

Abstract
Background
Studies assessing the relationship between surgeon volume and outcomes have shown mixed results, depending on the specific procedure analyzed. This volume relationship has not been well studied in patients undergoing total shoulder arthroplasty (TSA), but it should be, because this procedure is common, expensive, and potentially morbid.
Questions/purposes
We performed this study to assess the association between increasing surgeon volume and decreasing rate of revision at 2 years for (1) anatomic TSA (aTSA) and (2) reverse TSA (rTSA) in the United States.
Methods
In this retrospective study, we used Centers for Medicare and Medicaid Services (CMS) fee-for-service inpatient and outpatient data from 2015 to 2021 to study the association between annual surgeon aTSA and rTSA volume and 2-year revision shoulder procedures after the initial surgery. The CMS database was chosen for this study because it is a national sample and can be used to follow patients over time. We included patients with Diagnosis-related Group code 483 and Current Procedural Terminology code 23472 for TSA (these codes include both aTSA and rTSA). We used International Classification of Diseases, Tenth Revision, procedural codes. Patients who underwent shoulder arthroplasty for fracture (10% [17,524 of 173,242]) were excluded. We studied the variables associated with the subsequent procedure rate through a generalized linear model, controlling for confounders such as patient age, comorbidity risk score, surgeon and hospital volume, surgeon graduation year, hospital size and teaching status, assuming a binomial distribution with the dependent variable being whether an episode had at least one subsequent procedure within 2 years. The regression was fitted with standard errors clustered at the hospital level, combining all TSAs and within the aTSA and rTSA groups, respectively. Hospital and surgeon yearly volumes were calculated by including all TSAs, primary procedure and subsequent, during the study period. Other hospital-level and surgeon-level characteristics were obtained through public files from the CMS. The CMS Hierarchical Condition Category risk score was controlled because it is a measure reflecting the expected future health costs for each patient based on the patient’s demographics and chronic illnesses. We then converted regression coefficients to the percentage change in the odds of having a subsequent procedure.
Results
After controlling for confounding variables including patient age, comorbidity risk score, surgeon and hospital volume, surgeon graduation year, and hospital size and teaching status, we found that an annual surgeon volume of ≥ 10 aTSAs was associated with a 27% decreased odds of revision within 2 years (95% confidence interval 13% to 39%; p < 0.001), while surgeon volume of ≥ 29 aTSAs was associated with a 33% decreased odds of revision within 2 years (95% CI 18% to 45%; p < 0.001) compared with a volume of fewer than four aTSAs per year. Annual surgeon volume of ≥ 29 rTSAs was associated with a 26% decreased odds of revision within 2 years (95% CI 9% to 39%; p < 0.001).
Conclusion
Surgeons should consider modalities such as virtual planning software, templating, or enhanced surgeon training to aid lower-volume surgeons who perform aTSA and rTSA. More research is needed to assess the value of these modalities and their relationship with the rates of subsequent revision.
Level of Evidence
Level III, therapeutic study.
Introduction
The use of anatomic total shoulder arthroplasty (TSA) and reverse TSA has been increasing in the United States, with more than 100,000 TSAs performed each year [3, 24]. With higher rates of shoulder arthroplasty, volume trends among surgeons and hospitals may be more easily assessed [18, 19]. Higher surgeon volume has been correlated with improved outcomes after multiple procedures, including hip and knee arthroplasty [1, 6, 10-14, 17, 20-23]. Decreased complications, lower costs, and a smaller number of subsequent revision procedures have been associated with higher-volume surgeon practices for many procedures [1, 6, 7, 10-14, 17, 20-23]. Hip fracture fixation, however, is a notable example in which higher volume has not been associated with improved outcomes, with some studies showing no difference in complications, mortality, or other outcomes after fixation of hip fractures between high-volume and low-volume surgeons [5, 15, 16].
Given the inconsistent relationship between higher volumes and better outcomes, it seems important to explore procedures that are commonly performed, expensive, and potentially morbid, but few studies we know of have analyzed the relationship between hospital or surgeon volume and outcomes after TSA. Farley et al. [7] used the Nationwide Readmissions Database and showed that higher-volume hospitals were associated with lower rates of 90-day adverse outcomes after TSA including readmission, revision, and complications. A 2004 study using the Nationwide Inpatient Sample showed the mortality rates for patients undergoing shoulder arthroplasty by surgeons who performed fewer than four shoulder arthroplasty procedures per year were higher than for patients treated by surgeons who performed four or more procedures per year [9]. Given the high volume of TSAs performed each year and the high costs associated with the procedure, understanding the volume–outcome relationship for patients undergoing TSA is critical and may have important implications regarding the future training of surgeons, adjuvant technology use, and policymaking.
We performed this study to assess the association between increasing surgeon volume and decreasing rate of revision at 2 years for (1) anatomic TSA (aTSA) and (2) reverse TSA (rTSA) in the United States.
Materials and Methods
Data Source
We used 100% sample Centers for Medicare and Medicaid Services (CMS) fee-for-service inpatient and outpatient claims data from 2015 through 2021. The CMS database was chosen for this study because it is a national sample and can be used to track patients over time. The CMS 100% sample is the largest and most comprehensive of national datasets, which is one strength of this study. Additionally, patients, readmissions, and revision surgery can be followed longitudinally for each patient. Furthermore, the database allows researchers to measure surgeon volume, which can be analyzed for each surgeon and correlated to the odds of revision. Patient race and ethnicity are available through the CMS beneficiary enrollment database through self-reporting at time of enrollment.
Because our study requires identification through the International Classification of Diseases, Tenth Revision, diagnosis (ICD-10-CM) and procedure (ICD-10-PCS) codes, we chose our study’s starting point as Q4 2015, which is the first quarter that ICD-10 codes were used in the Medicare claims. By the time of our analysis, we had the most recent claims through Q3 2021.
The study included primary TSAs that were coded as inpatient using diagnosis-related group code 483 and as outpatient using primary Current Procedural Terminology (CPT) code 23472. Outpatient TSAs only constituted a small fraction of the total number of TSAs because the CMS removed TSAs from the inpatient-only list in 2021. We further identified whether the procedure was a shoulder procedure using each patient’s primary ICD-10-PCS code and excluded nonshoulder procedures. We further divided TSAs into nonfracture anatomic arthroplasties, nonfracture reverse arthroplasties, and fracture TSAs (anatomic and reverse combined) based on each patient’s primary ICD-10-CM and ICD-10-PCS codes. All deaths within 2 years of the primary procedure and all fracture TSAs were excluded to ensure a homogeneous sample of patients who elected to undergo the procedure. We then identified the laterality (left or right) of each procedure through primary ICD-10-PCS codes. ICD-10-PCS codes are essential in determining laterality because CPT codes cannot be used to differentiate left-sided from right-sided procedures (Supplemental Fig. 1; http://links.lww.com/CORR/B43).
From a clean sample of primary TSAs that were performed either on a left or right shoulder, not bilateral, we studied whether multiple arthroplasties were performed on the same shoulder for the same patient within a 2-year period. We identified the first available TSA for each patient as the primary surgery; any later TSAs performed on the same shoulder within 2 years from the primary surgery for the same patient were counted as subsequent procedures for that patient. Q4 2015 through Q3 2016 served as our lookback period, meaning that we made sure no procedures happened afterward that were subsequent procedures during the lookback period. Because our claim spanned through Q3 2021, our study period was Q4 2016 through Q3 2019, a total of 36 months. We included patients with diagnosis-related group code 483 and CPT code 23472 for TSA (these codes include both aTSA and rTSA). The analysis included 54,149 aTSAs and 97,092 rTSAs performed by 7916 surgeons at 2566 hospitals. The revision rate at 2 years was 3.5% for aTSA and 2.4% for rTSA. The mean age was 73 ± 7 years for patients who underwent rTSA and 71 ± 7 years for those who underwent aTSA.
The analysis included 2566 hospitals, 39% (1011 of 2566) of which were teaching hospitals and 81% (2069 of 2566) of which were urban hospitals. The mean annual hospital TSA volume was 20 ± 28 procedures. A total of 7916 surgeons were included in the analysis. The mean annual surgeon aTSA and rTSA volume was 9 ± 13 and 8 ± 13 procedures, respectively (Table 1).
Table 1.
Characteristics of aTSAs and rTSAs
| Variable | aTSA | rTSA |
| Hospital characteristics | ||
| Number of hospitals | 2346 | 2443 |
| Teaching hospital, % (n) | 41 (953) | 40 (976) |
| Urban hospital, % (n) | 82 (1929) | 81 (1981) |
| Bed size, mean ± SD | 224 ± 211 | 220 ± 209 |
| Yearly TSA volume, mean ± SD | 22 ± 28 | 21 ± 28 |
| Surgeon characteristics | ||
| Number of surgeons | 6096 | 6509 |
| Medical school graduation year, mean ± SD | 1996 ± 10 | 1997 ± 10 |
| Yearly TSA volume, mean ± SD | 9 ± 13 | 8 ± 13 |
| Episode characteristics | ||
| Number of episodes | 54,149 | 97,092 |
| Mean subsequent revision rate, % (n) | 3.5 (1908) | 2.4 (2350) |
| Left shoulder, % (n) | 48 (26,192) | 41 (40,024) |
| Mean age in years ± SD | 71 ± 7 | 73 ± 7 |
| Women, % (n) | 56 (30,077) | 61 (58,851) |
| Race, White, % (n) | 93 (50,158) | 93 (90,350) |
| Mean CMS-HCC risk score ± SD | 1 ± 0.9 | 1 ± 1 |
| BMI > 40 kg/m2, % (n) | 6 (3217) | 6 (5433) |
| CHF, % (n) | 5 (2569) | 7 (6845) |
| COPD, % (n) | 9 (5095) | 12 (11,662) |
| Cancer, % (n) | 1 (679) | 1 (1278) |
| Diabetes, % (n) | 19 (10,466) | 22 (21,838) |
| Kidney disease, % (n) | 2 (1146) | 3 (3162) |
| Liver disease, % (n) | 0.6 (317) | 0.6 (600) |
Patient race and ethnicity are available through the CMS beneficiary enrollment database through self-reporting at the time of enrollment. aTSA = anatomic total shoulder arthroplasty; rTSA = reverse total shoulder arthroplasty; CMS-HCC = Centers for Medicare and Medicaid Services Hierarchical Condition Categories; CHF = congestive heart failure; COPD = chronic obstructive pulmonary disease.
A total of 151,241 shoulder arthroplasty episodes were included in the analysis (Supplemental Fig. 1; http://links.lww.com/CORR/B43), including 54,149 aTSAs and 97,092 rTSAs. A total of 44% (66,216 of 151,241) were left shoulder arthroplasties, with 40% (26,192 of 66,216) being aTSAs and 60% (40,024 of 66,216) rTSAs. The mean subsequent revision procedure rate within 2 years of the initial arthroplasty was 2.8%: 3.5% for aTSA and 2.4% for rTSA. With a mean age of 72 ± 7 years among all patients, rTSAs were performed on a slightly older population with a mean age of 73 ± 7 years compared with 71 ± 7 years for aTSAs. Patients undergoing rTSA (66% [58,851 of 88,928]) were more likely to be women than those undergoing aTSA (34% [30,077 of 88,928]). Overall, rTSAs were performed on a more-ill population with a mean CMS Hierarchical Condition Categories risk score of 1.2 ± 1.0 compared with those undergoing aTSA (1.0 ± 0.9) (Table 1).
Statistical Analysis
We studied the variables associated with the rate of subsequent procedures through a generalized linear model, assuming a binomial distribution with the dependent variable being whether an episode had at least one subsequent procedure within 2 years (Supplemental Table 1; http://links.lww.com/CORR/B44). The regression was fitted at the episode level with standard errors clustered at the hospital level, combining all TSAs and within the anatomic and reverse TSA groups, respectively. We controlled for the following factors in the regression (the procedure type variable was removed when fitting the regression within each procedure group): At the hospital level, we controlled for teaching status, urban setting, bed size, and mean yearly TSA volume; at the surgeon level, we controlled for medical school graduation year and mean yearly TSA volume; and at the patient and episode-of-care level, we controlled for age, gender, race (White versus non-White), CMS Hierarchical Condition Categories risk score, procedure type (aTSA or rTSA), left versus right side, year fixed effects, and state fixed effects. Race was identified through classification in the CMS database. We grouped race as White and non-White because of the small samples of individual race categories.
Hospital and surgeon yearly TSA volumes were calculated by including all TSAs, primary and subsequent, during the study period (Table 2). Other hospital-level and surgeon-level characteristics were obtained through public files from the CMS. The CMS Hierarchical Condition Categories risk score was controlled because it is a measure reflecting the expected future health costs for each patient based on the patient’s demographics and chronic illnesses. To facilitate interpretation, we then converted the regression coefficients to a percentage change in the odds of having a subsequent procedure. The annual surgeon volume distribution was right skewed, with the median being three procedures per year, the 80th percentile containing nine procedures, and the 95th percentile containing 28 procedures (Supplemental Fig. 2; http://links.lww.com/CORR/B45). The median annual hospital volume was 10 procedures per year while the 80th percentile was 30 procedures per year (Supplemental Fig. 3; http://links.lww.com/CORR/B46)
Table 2.
Characteristics of all TSAs by surgeon volume group
| Variable | Low volume (n = 11,812) | Medium volume (n = 32,190) | High volume (n = 50,658) | Very high volume (n = 57,232) |
| Mean subsequent revision rate, % (n) | 4 (426) | 3 (1049) | 3 (1379) | 2 (1404) |
| Left shoulder, % (n) | 44 (5178) | 44 (14,247) | 43 (21,963) | 43 (24,828) |
| Age in years, mean ± SD | 72 ± 8 | 72 ± 7 | 73 ± 7 | 72 ± 7 |
| Female, % (n) | 61 (7211) | 60 (19,197) | 59 (30,007) | 57 (32,513) |
| White, % (n) | 90 (10,573) | 92 (29,653) | 93 (47,005) | 93 (53,277) |
| CMS-HCC risk score, mean ± SD | 1.2 ± 1.1 | 1.2 ± 1.0 | 1.1 ± 1.0 | 1.1 ± 1.0 |
| BMI > 40 kg/m2, % (n) | 6 (688) | 6 (1872) | 6 (2839) | 6 (3251) |
| CHF, % (n) | 6 (745) | 6 (2049) | 6 (3223) | 6 (3397) |
| COPD, % (n) | 13 (1497) | 12 (3985) | 11 (5588) | 10 (5687) |
| Cancer, % (n) | 1.5 (179) | 1.2 (399) | 1.2 (607) | 1.3 (772) |
| Diabetes, % (n) | 24 (2798) | 23 (7352) | 22 (10,953) | 20 (11,201) |
| Kidney disease, % (n) | 3 (347) | 3 (1015) | 3 (1392) | 3 (1554) |
| Liver disease, % (n) | 0.7 (85) | 0.6 (208) | 0.7 (330) | 0.5 (294) |
CMS-HCC = Centers for Medicare and Medicaid Services Hierarchical Condition Categories; CHF = congestive heart failure; COPD = chronic obstructive pulmonary disease.
We then assigned a volume group to each surgeon based on the observed distribution, and the volume groups were as follows: Low volume was one to three procedures per year, medium volume was four to nine procedures per year, high volume was 10 to 28 procedures per year, and very high volume was 29 procedures or more. There was an imbalance in distribution among surgeons and procedures, with the lowest 50% of the surgeons performing 8% of the total procedures and the top 5% of the surgeons performing 38% of the total procedures (Fig. 1). The percentage of procedures performed by low-volume, medium-volume, high-volume, and very high–volume surgeons based on hospital volume was also calculated (Supplemental Fig. 4; http://links.lww.com/CORR/B47). There was a decrease in the revision rate with an increase in surgeon yearly volume (Fig. 2). A scatter plot was created to show the mean 2-year revision rate compared with annual surgeon volume, which showed a decreasing trend of revision with increasing annual surgeon volume (Fig. 3).
Fig. 1.

This bar graph shows the distribution of surgeons and procedures by surgeon volume group for all TSAs.
Fig. 2.
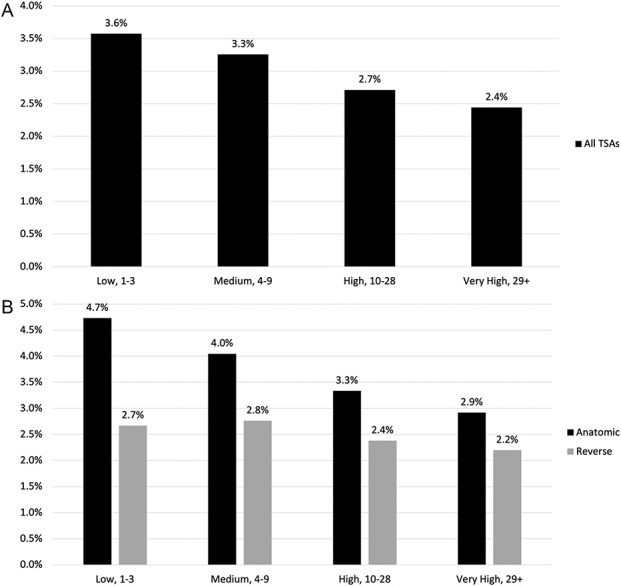
These bar graphs show the subsequent revision rate for (A) all TSAs and (B) subsequent revision rate by surgeon volume group for anatomic and reverse TSA.
Fig. 3.

This scatter plot represents the mean revision rate against surgeon yearly volume.
Results
Anatomic TSA
After controlling for confounding variables including patient age, comorbidity risk score, surgeon and hospital volume, surgeon graduation year, and hospital size and teaching status, we found that an annual surgeon volume of ≥ 10 aTSAs was associated with a 27% decreased odds of revision within 2 years (95% confidence interval 13% to 39%; p < 0.001), while a surgeon volume of ≥ 29 aTSAs was associated with a 33% decreased odds of revision within 2 years (95% CI 18% to 45%; p < 0.001) compared with an annual volume of fewer than four aTSAs (Table 3).
Table 3.
Regression estimate of different variables’ impacts on subsequent revision rate, aTSA versus rTSA
| aTSA | rTSA | |||||
| Variable | Estimatea, % | 95% CI, % | p value | Estimatea, % | 95% CI, % | p value |
| Age | -3 | (-3 to -2) | < 0.001 | -5 | (-5 to -4) | < 0.001 |
| Female | 41 | (28 to 56) | < 0.001 | -50 | (-54 to -46) | < 0.001 |
| Non-White | -12 | (-27 to 7) | 0.20 | -6 | (-20 to 10) | 0.43 |
| Left shoulder | -5 | (-14 to 4) | 0.29 | 6 | (-2 to 15) | 0.17 |
| BMI > 40 kg/m2 | 4 | (-14 to 26) | 0.69 | 0 | (-16 to 19) | > 0.99 |
| CHF | 3 | (-18 to 29) | 0.82 | 25 | (7 to 46) | < 0.001 |
| COPD | 40 | (21 to 62) | < 0.001 | 13 | (0 to 27) | 0.05 |
| Cancer | -3 | (-38 to 52) | 0.90 | 10 | (-22 to 55) | 0.59 |
| Diabetes | -5 | (-16 to 7) | 0.36 | 1 | (-8 to 12) | 0.78 |
| Kidney disease | 6 | (-23 to 45) | 0.74 | 26 | (0 to 57) | 0.05 |
| Liver disease | 41 | (-15 to 135) | 0.18 | 22 | (-20 to 85) | 0.36 |
| Surgeon volume group, mid | -14 | (-27 to 2) | 0.09 | 4 | (-13 to 24) | 0.68 |
| Surgeon volume group, high | -27 | (-39 to -13) | < 0.001 | -11 | (-26 to 6) | 0.20 |
| Surgeon volume group, very high | -33 | (-45 to -18) | < 0.001 | -26 | (-39 to -9) | < 0.001 |
| Surgeon graduation year | 0 | (0 to 1) | 0.56 | 0 | (-1 to 0) | 0.20 |
| Hospital volume group, mid | -12 | (-27 to 5) | 0.14 | -4 | (-18 to 14) | 0.67 |
| Hospital volume group, high | -7 | (-23 to 12) | 0.45 | 8 | (-9 to 29) | 0.39 |
| Hospital volume group, very high | -27 | (-42 to -9) | < 0.001 | 4 | (-16 to 28) | 0.73 |
| Urban | 15 | (-5 to 40) | 0.16 | 12 | (-4 to 31) | 0.14 |
| Bed size | 0 | (0 to 0) | 0.69 | 0 | (0 to 0) | 0.82 |
| Teaching | 14 | (0 to 31) | 0.05 | 3 | (-8 to 16) | 0.60 |
Estimates were made from a logistic regression at episode level with standard errors clustered at the hospital level. In addition to the listed variables, year fixed effects and state fixed effects were controlled for. Coefficients were converted as percentage changes in the odds of receiving a subsequent revision. CHF = congestive heart failure; COPD = chronic obstructive pulmonary disease.
Reverse TSA
After controlling for confounding variables including patient age, comorbidity risk score, surgeon and hospital volume, surgeon graduation year, and hospital size, and teaching status, we found that an annual surgeon volume of ≥ 10 rTSAs was associated with an 11% decreased odds of revision within 2 years (95% CI 6% to 26%; p = 0.20), while surgeon volume of ≥ 29 rTSAs was associated with a 26% decreased odds of revision within 2 years (95% CI 9% to 39%; p < 0.001) compared with an annual volume of fewer than four aTSAs (Table 3).
Discussion
The association between higher volume and improved outcomes has been shown for many procedures, perhaps most notably hip and knee arthroplasty [1, 7, 8, 11-16, 19-22]. However, some other procedures such as hip fracture fixation have not been shown to have a volume–outcome relationship. Given that there is no consistent volume–outcome relationship that is applicable to all orthopaedic procedures, those performed in high volume and those associated with high costs or morbidity are important to assess for volume–outcome relationships. With the increasing volume of aTSA and rTSA, it is critical to better understand the relationship between volume and revision risk. The results of this study showed that higher volume is associated with a lower odds of revision at 2 years after aTSA and rTSA. This effect was seen at a surgeon volume of > 10 annual procedures. These results highlight the importance of helping to improve outcomes in patients undergoing shoulder arthroplasty by lower-volume surgeons. Surgeons could consider various methods such as virtual planning software, templating, or enhanced surgeon training when performing aTSA and rTSA. Although it has not been proven, we speculate these tools will be more helpful to lower-volume surgeons than to higher-volume surgeons. However, this must be studied specifically, and we think this may be an important area of future research.
Limitations
First, we did not aim, nor were we able, to measure patient-reported satisfaction or functional outcomes in this study. The purpose of this study was to assess the revision rate and its association with surgeon annual volume. Further studies are needed to assess the association of volume and functional or patient-reported outcomes. To identify laterality of the shoulder procedure, which is required to accurately analyze revision surgery, ICD-10 codes are needed; therefore, Q4 of 2015 was the starting point for this study. This timepoint was chosen because this is when ICD-10 was implemented. Given this starting point, we cannot determine long-term implant survivorship past the current date. Nonetheless, we could still demonstrate a stepwise increased odds of revision with decreasing surgeon volume through the study period. The Medicare fee-for-service data do not include Medicare Advantage plans, and some surgeons may have other patients with Medicare insurance who were not included in this study. Despite this limitation, the results still may have broader applicability to all patients with Medicare, even though we did not analyze those with Medicare Advantage. Furthermore, we were unable to determine where on the learning curve a surgeon was, and we could not measure or factor in surgeon skill; however, this was not the purpose of this study. This cannot be measured reliably. In addition, many shoulder arthroplasty revisions were performed in the long term, but we did not have 20-year to 30-year follow-up data on the patients in this study and could not provide long-term revision rates. We also could not determine the severity of disease that was treated with arthroplasty. There is no specific ICD-10 diagnosis code for cuff tear arthropathy, which limited our ability to determine specific diagnoses for patients undergoing rTSA. We grouped race by White and non-White race because of small samples in individual race categories. Further studies will need to assess whether specific race categories are associated with the revision rate. Finally, a further study is needed to assess the importance of hospital volume in the context of surgeon volume. Although hospital volume was included in the regression analysis, there was no association between hospital volume and odds of revision.
Discussion of Key Findings
Only four studies we know of have assessed the volume–outcome relationship in patients undergoing aTSA or rTSA, all with substantial limitations [4, 7-9]. Farley et al. [7] analyzed patients undergoing rTSA in the Nationwide Readmissions Database from 2011 to 2015 and found that hospitals performing 70 or more rTSAs per year had lower 90-day complications and readmissions than lower-volume hospitals. A study using the Australian Orthopaedic Association National Joint Replacement Registry from 2004 to 2017 showed that lower-volume surgeons (fewer than 10 TSAs per year) were associated with early revision after aTSA and early and revision after rTSA [4]. The present study corroborates these findings by assessing surgeon volume on a national level in the United States, demonstrating a stepwise increase in the odds of revision surgery at 2 years with lower annual surgeon volume. Additionally, we showed that higher hospital volume was not associated with an increased rate of revision at 2 years. Virtual planning and 3D templating are becoming more common in shoulder arthroplasty. These modalities may bring lower-volume surgeons closer to higher-volume surgeons because lower-volume surgeons may not have the same experience and comfort with implant positioning and sizing.
The results of this study also have important economic implications. TSA accounts for more than USD 1.8 billion in costs to United States hospitals per year [2], and the incidence of the procedure is increasing more quickly than that of hip and knee arthroplasty [24]. With the higher rate of shoulder arthroplasty procedures being performed, the number of revision procedures is also increasing [24]. The volume–revision relationship shown in this study may support programs such as employer healthcare plans that partner with high-volume centers of excellence. Differences in bundled payments based on center volume and outcomes may be a cost-saving measure or incentive for higher-volume centers. Furthermore, this work could support the use of technology such as virtual planning software, 3D templating, or other assistive technologies to aid lower-volume surgeons who may have less experience with shoulder arthroplasty. However, this is speculative and has not been proven to show improvement in outcomes. Further, these tools and modalities contribute to higher costs in various orthopaedic fields and do not seem to improve fracture classification or interventions. More research is needed to assess the value of these technologies and determine whether they affect revision rates. Surgeon volume should be considered when assessing the value of these technologies. We speculate that lower-volume surgeons may gain more from templating or preoperative planning if they have limited experience, but there is no evidence proving this. Enhanced training through courses and laboratory sessions may also be beneficial to lower-volume surgeons. Vendors could consider providing this to lower-volume surgeons who use new technology or implants.
Conclusion
This study showed an increased odds of 2-year revision in patients who underwent TSA by lower-volume surgeons. We speculate that virtual planning software, templating, or enhanced surgeon training may aid lower-volume surgeons who perform aTSA and rTSA; however, there is no evidence to support this, and future studies are needed to assess whether these tools lead to improved outcomes. More research is also needed to assess the value of these modalities and their relationship with subsequent revision rates.
Group Authorship
Members of the Avant-garde Health and Codman Shoulder Society Value Based Care Group include Matthew J. Best, Catherine J. Fedorka, Derek A. Haas, Xiaoran Zhang, Adam Z. Khan, April D. Armstrong, Joseph A. Abboud, Andrew Jawa, Evan A. O’Donnell, Robert M. Belniak, Jason E. Simon, Eric R. Wagner, Momin Malik, Michael B. Gottschalk, Gary F. Updegrove, Jon J. P. Warner, and Uma Srikumaran.
Footnotes
aMembers of the Avant-garde Health and Codman Shoulder Society Value Based Care Group are listed in an Appendix at the end of this article.
Each author certifies that there are no funding or commercial associations (consultancies, stock ownership, equity interest, patent/licensing arrangements, etc.) that might pose a conflict of interest in connection with the submitted article related to the author or any immediate family members.
All ICMJE Conflict of Interest Forms for authors and Clinical Orthopaedics and Related Research® editors and board members are on file with the publication and can be viewed on request.
Ethical approval was not sought for the present study.
This work was performed at the Johns Hopkins University, Baltimore, MD, USA.
Contributor Information
Matthew J. Best, Email: mbest8@jhmi.edu.
Catherine J. Fedorka, Email: cjfedorka@gmail.com.
Derek A. Haas, Email: derek@avantgardehealth.com.
Xiaoran Zhang, Email: luka@avantgardehealth.com.
Adam Z. Khan, Email: adamzkhan12@gmail.com.
April D. Armstrong, Email: aarmstrong@pennstatehealth.psu.edu.
Joseph A. Abboud, Email: abboudj@gmail.com.
Andrew Jawa, Email: andrewjawa@gmail.com.
Evan A. O’Donnell, Email: eodonnell4@partners.org.
Robert M. Belniak, Email: rbelniak@starlingphysicians.com.
Jason E. Simon, Email: jsimon2@partners.org.
Eric R. Wagner, Email: eric.r.wagner@emory.edu.
Momin Malik, Email: momin@avantgardehealth.com.
Michael B. Gottschalk, Email: Michael.gottschalk@emoryhealthcare.org.
Jon J. P. Warner, Email: jwarner@mgh.harvard.edu.
References
- 1.Battaglia T, Mulhall K, Brown T, Saleh K. Increased surgical volume is associated with lower THA dislocation rates. Clin Orthop Relat Res. 2006;447:28-33. [DOI] [PubMed] [Google Scholar]
- 2.Best MJ, Aziz KT, McFarland EG, Anderson GF, Srikumaran U. Economic implications of decreased elective orthopaedic and musculoskeletal surgery volume during the coronavirus disease 2019 pandemic. Int Orthop. 2020;44:2221-2228. [DOI] [PMC free article] [PubMed] [Google Scholar]
- 3.Best MJ, Aziz KT, Wilckens JH, McFarland EG, Srikumaran U. Increasing incidence of primary reverse and anatomic total shoulder arthroplasty in the United States. J Shoulder Elbow Surg. 2021;30:1159-1166. [DOI] [PubMed] [Google Scholar]
- 4.Brown JS, Gordon RJ, Peng Y, Hatton A, Page RS, Macgroarty KA. Lower operating volume in shoulder arthroplasty is associated with increased revision rates in the early postoperative period: long-term analysis from the Australian Orthopaedic Association National Joint Replacement Registry. J Shoulder Elbow Surg. 2020;29:1104-1114. [DOI] [PubMed] [Google Scholar]
- 5.de Meireles AJ, Gerhardinger L, Oliphant BW, et al. Factors associated with optimal patient outcomes after operative repair of isolated hip fractures in the elderly. Trauma Surg Acute Care Open. 2020;5:e000630. [DOI] [PMC free article] [PubMed] [Google Scholar]
- 6.Dy CJ, Marx RG, Bozic KJ, Pan TJ, Padgett DE, Lyman S. Risk factors for revision within 10 years of total knee arthroplasty. Clin Orthop Relat Res. 2014;472:1198-1207. [DOI] [PMC free article] [PubMed] [Google Scholar]
- 7.Farley KX, Schwartz AM, Boden SH, Daly CA, Gottschalk MB, Wagner ER. Defining the volume-outcome relationship in reverse shoulder arthroplasty. J Bone Joint Surg Am. 2020;102:388-396. [DOI] [PubMed] [Google Scholar]
- 8.Hammond JW, Queale WS, Kim TK, McFarland EG. Surgeon experience and clinical and economic outcomes for shoulder arthroplasty. J Bone Joint Surg Am . 2003;85:2318-2324. [DOI] [PubMed] [Google Scholar]
- 9.Jain N, Pietrobon R, Hocker S, Guller U, Shankar A, Higgins LD. The relationship between surgeon and hospital volume and outcomes for shoulder arthroplasty. J Bone Joint Surg Am. 2004;86:496-505. [DOI] [PubMed] [Google Scholar]
- 10.Jeschke E, Citak M, Günster C, et al. Are TKAs performed in high-volume hospitals less likely to undergo revision than TKAs performed in low-volume hospitals? Clin Orthop Relat Res. 2017;475:2669-2674. [DOI] [PMC free article] [PubMed] [Google Scholar]
- 11.Kalfa D, Chai P, Bacha E. Surgical volume-to-outcome relationship and monitoring of technical performance in pediatric cardiac surgery. Pediatr Cardiol. 2014;35:899-905. [DOI] [PubMed] [Google Scholar]
- 12.Katz JN, Barrett J, Mahomed NN, Baron JA, Wright RJ, Losina E. Association between hospital and surgeon procedure volume and the outcomes of total knee replacement. J Bone Joint Surg Am. 2004;86:1909-1916. [DOI] [PubMed] [Google Scholar]
- 13.Lau RL, Perruccio AV, Gandhi R, Mahomed NN. The role of surgeon volume on patient outcome in total knee arthroplasty: a systematic review of the literature. BMC Musculoskelet Disord. 2012;13:250. [DOI] [PMC free article] [PubMed] [Google Scholar]
- 14.Manley M, Ong K, Lau E, Kurtz SM. Total knee arthroplasty survivorship in the United States Medicare population. J Arthroplasty. 2009;24:1061-1067. [DOI] [PubMed] [Google Scholar]
- 15.Metcalfe D, Salim A, Olufajo O, et al. Hospital case volume and outcomes for proximal femoral fractures in the USA: an observational study. BMJ Open. 2016;6:e010743. [DOI] [PMC free article] [PubMed] [Google Scholar]
- 16.Okike K, Chan PH, Paxton EW. Effect of surgeon and hospital volume on morbidity and mortality after hip fracture. J Bone Joint Surg Am. 2017;99:1547-1553. [DOI] [PubMed] [Google Scholar]
- 17.Ong K, Lau E, Manley M, Kurtz SM. Patient, hospital, and procedure characteristics influencing total hip and knee arthroplasty procedure duration. J Arthroplasty. 2009;24:925-931. [DOI] [PubMed] [Google Scholar]
- 18.Padegimas EM, Maltenfort M, Lazarus MD, Ramsey ML, Williams GR, Namdari S. Future patient demand for shoulder arthroplasty by younger patients: national projections. Clin Orthop Relat Res. 2015;473:1860-1867. [DOI] [PMC free article] [PubMed] [Google Scholar]
- 19.Page RS, Navarro RA, Salomonsson B. Establishing an international shoulder arthroplasty consortium. J Shoulder Elbow Surg. 2014;23:1081-1082. [DOI] [PubMed] [Google Scholar]
- 20.Ravi B, Jenkinson R, Austin PC, et al. Relation between surgeon volume and risk of complications after total hip arthroplasty: propensity score matched cohort study. BMJ. 2014;348:g3284-g3284. [DOI] [PMC free article] [PubMed] [Google Scholar]
- 21.Shervin N, Rubash HE, Katz JN. Orthopaedic procedure volume and patient outcomes. Clin Orthop Relat Res. 2007;457:35-41. [DOI] [PubMed] [Google Scholar]
- 22.Siddiqi A, Alamanda VK, Barrington JW, et al. Effects of hospital and surgeon volume on patient outcomes after total joint arthroplasty: reported from the American Joint Replacement Registry. J Am Acad Orthop Surg. 2022;30:e811-e821. [DOI] [PubMed] [Google Scholar]
- 23.Stella M, Bissolati M, Gentile D, Arriciati A. Impact of surgical experience on management and outcome of pancreatic surgery performed in high- and low-volume centers. Updates Surg. 2017;69:351-358. [DOI] [PubMed] [Google Scholar]
- 24.Wagner E, Farley K, Higgins I, Wilson J, Daly C, Gottschalk M. The incidence of shoulder arthroplasty: rise and future projections compared with hip and knee arthroplasty. J Shoulder Elbow Surg. 2020;29:2601-2609. [DOI] [PubMed] [Google Scholar]