Abstract
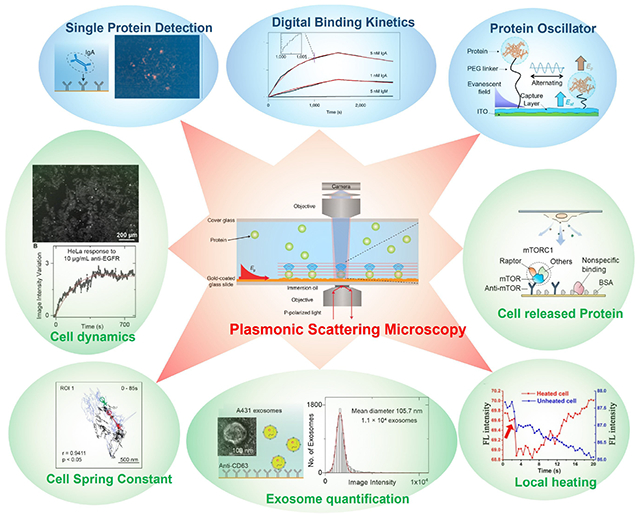
Measuring molecular binding kinetics represents one of the most important tasks in molecular interaction analysis. Surface plasmon resonance (SPR) is a popular tool for analyzing molecular binding. Plasmonic scattering microscopy (PSM) is a newly developed SPR imaging technology, which detects the out-of-plane scattering of surface plasmons by analytes and has pushed the detection limit of label-free SPR imaging down to a single-protein level. In addition, PSM also allows SPR imaging with high spatiotemporal resolution, making it possible to analyze cellular response to the molecular bindings. In this Mini Review, we present PSM as a method of choice for chemical and biological imaging, introduce its theoretical mechanism, present its experimental schemes, summarize its exciting applications, and discuss its challenges as well as the promising future.
Keywords: surface plasmon resonance, plasmonic scattering microscopy, binding kinetics, single molecule, single cell
GRAPHICAL ABSTRACT
1. Introduction
Determining molecular interactions is important for drug discovery, detection of disease biomarkers, and understanding the biological processes at the molecular scale.[1] Surface plasmon resonance (SPR) has been developed and become an indispensable tool for label-free detection of molecules and molecular interactions.[2] In the last 15 years, SPR microscopy (SPRM), one kind of SPR imaging approach based on high numerical aperture oil immersion objective, has provided instruments with high spatial resolution and measurement sensitivity for imaging single biological entities with size down to ~50 nm, and thus has been extensively applied in various fields, including imaging of single cells,[3–9] bacteria,[10] subcellular organelles,[11] viruses,[12–14] nanoparticles,[15–23] nanowires,[24–25] exosomes,[26] surface electric field[27] thermal diffusion,[28] surface charges,[29] posttranslational modifications of proteins,[30] and chemical reactions.[31–32]
SPR approaches share two advantages over conventional optical sensing and imaging approaches. First, the surface plasmonic wave is one kind of evanescent field, where the field intensity is localized within ~100 nm from the sensor surface, making it free of the interference of impurities in the bulk solution. Combined with the surface modification and microfluidic system, the SPR systems are particularly suitable for real-time monitoring of surface binding to analyze the molecular interaction dynamics. Second, surface plasmonic waves can enhance the light-analyte interactions by 20–30 times, which accounts for the high measurement sensitivity of SPR sensors.
However, SPR imaging sensors, including SPRM, also suffer from two limitations resulting from the physical characteristics of surface plasmonic waves. First, the evanescent waves, including surface plasmonic waves, cannot propagate to the detector in a far field, and usually can only be detected via reflection light monitoring. The reflection light will create a large background in the images, leading to low image contrast, which makes it challenging to image small analytes, such as single proteins. Second, the surface plasmonic waves have delocalized propagation features along the surface, which produces a spot at the location of the analyte with a parabolic tail, due to interference between the in-plane scattering light from the analyte and the surface plasmonic wave. The parabolic tail leads to poor spatial resolution, making it challenging to analyze the targets with complicated distributions, such as the patterns of cell adhesion sites.[26,33–35]
To overcome these two limitations, plasmonic scattering microscopy (PSM), one new kind of SPR imaging approach, was developed recently.[36] Different from the traditional SPR imaging systems that measure the reflected light, PSM images the out-of-plane scattered surface plasmonic waves by analytes. PSM retains the advantages of traditional SPR technology because the surface plasmonic waves still play the role of illumination field for PSM. At the same time, the out-of-plane scattering can be directly recorded at the far field to form PSM images without collecting the reflection beam, which provides high image contrast and high spatial resolution at the sub-micrometer level without the parabolic tails. For these reasons, PSM becomes the first SPR imaging approach providing the high contrast images of the analytes with size down to single protein level, as well as high spatiotemporal resolution images for analysis of cell-substrate interactions. In this Mini Review, we first introduce the principles and instrumentation of PSM, and then describe the key applications in single-protein imaging and single-cell analysis developed in the last two years. Lastly, we will discuss the challenges and perspectives of PSM.
2. Principle and Instrumentation of PSM
The SPRM images the in-plane scattering of the plasmonic wave by detecting the reflection light (Figure 1A). On the contrary, the PSM detects the out-of-plane scattering of the plasmonic wave, which can directly propagate to the far field (Figure 1E).[37] The out-of-plane scattering intensity can be calculated using the discrete dipole approximation and roughly estimated with the Rayleigh scattering model.[38–40] The PSM can be easily constructed by adding one objective on the top of either a prism-coupled SPR sensor (Figure 1E) or an objective-couple SPRM (Figure 2a) to collect the out-of-plane scattered plasmonic waves by the analytes.[36,41] The PSM flow cell for analyte delivery is similar to a prism-type total internal reflection fluorescence microscopy, where a cover glass seals the top of the flow cell for optical observation and the height of the flow channel should be controlled to be a few tens of micrometers for easy correction of spherical aberration.[42] Figure 1A and 1E show the SPRM and PSM images of one polystyrene nanoparticle, respectively. One can see clearly that PSM provides a point spread function with Gaussian distribution and without the parabolic tail, which has higher spatial resolution than classical SPRM (Figure 1B–D and 1F–H).
Figure 1.
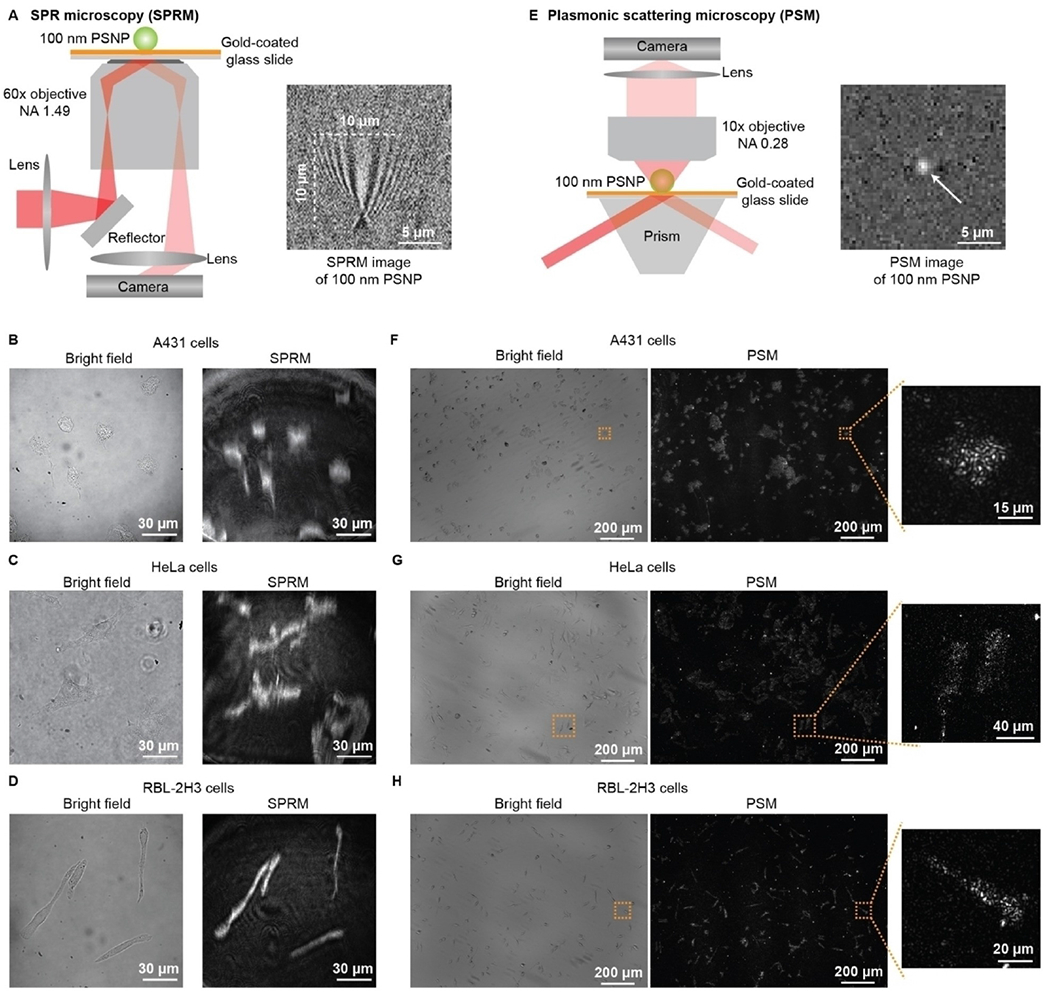
a) Schematic of the optical setup for SPRM, and SPRM image of one 100 nm polystyrene nanoparticle (PSNP). B), C) and D) Bright field and SPRM images of fixed A431, HeLa, and RBL-2H3 cells. E)2005Schematic of the optical setup for PSM, and PSM image of one 100 nm PSNP. F), G) and H) Bright field and PSM images of fixed A431, HeLa, and RBL-2H3 cells. Reproduced with permission from Ref. [41]. Copyright 2022 Wiley VCH.
Figure 2.
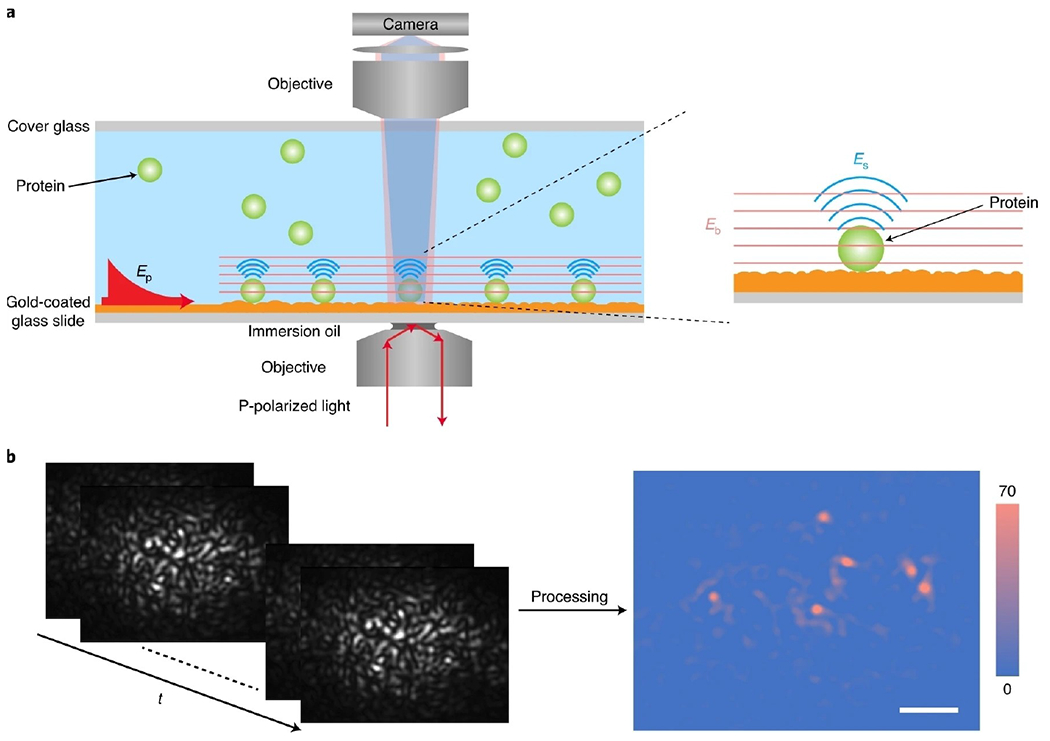
a) Schematic of an objective-based PSM setup, where surface plasmonic waves (Ep) are excited by light from the bottom of a gold-coated glass slide and scattering of the plasmonic waves by a particle or protein (Es) and by the gold surface (Eb) is collected from the top to form a PSM image. b), Raw time sequence of PSM images of 26 nm polystyrene nanoparticles (left), and background and drift corrected PSM image (right), where t refers to time. Scale bar, 5 μm. Reproduced with permission from Ref. [40]. Copyright 2020 Springer Nature.
For large analytes, such as cell adhesions sites, the plasmonic waves scattered by the analytes dominate the PSM image contrast (Figure 1F–H). However, for small analytes, such as the 26 nm polystyrene nanoparticles, the plasmonic waves scattered by the gold surface roughness will dominate the image contrast in the raw PSM images. After subtracting the raw frame by the previous frame, the analytes can be clearly observed in the differential image (Figure 2b), where the analyte image contrast is mainly produced by the interference of plasmonic waves scattered by the analytes with those scattered by the surface roughness. For the gold film prepared by the thermal evaporation, pure scattering usually dominates the PSM image contrast for the polystyrene nanoparticles with a diameter larger than 65 nm, while the interference term usually dominates the PSM image contrast for smaller analytes, such as polystyrene nanoparticles with a diameter smaller than 65 nm and proteins (Figure 3).
Figure 3.
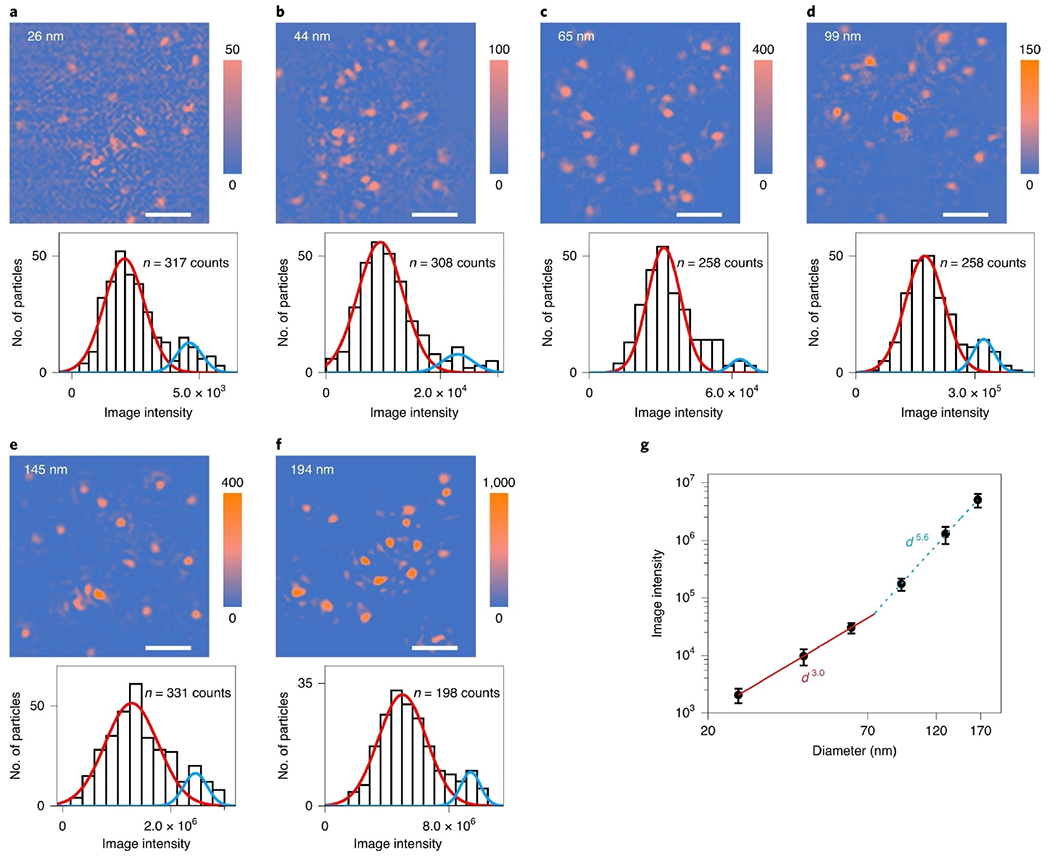
a–f) PSM images and image intensity histograms of 26 nm (a), 44 nm (b), 65 nm (c), 99 nm (d), 145 nm (e) and 194 nm (f) polystyrene nanoparticles, where the solid lines are Gaussian fittings. In each histogram, a small second peak (blue line) is attributed to formation of dimers or two particles binding to the nearby surface simultaneously with a distance smaller than the diffraction limit. Incident light intensity and camera exposure time are 200 W cm−2 and 5 ms for 26-, 44- and 65-nm nanoparticles, 10 W cm−2 and 10ms for 99 nm, 10 Wcm−2 and 5ms for 145 nm, and 10 Wcm−2 and 2 ms for 194 nm, respectively. The image intensity was normalized with an incident light intensity of 200 Wcm−2 and a camera exposure time of 5 ms. The sample sizes are presented in each panel. Scale bars, 5 μm. g) PSM image intensity versus particle diameter. The image intensity at the center of the error bar for each diameter is obtained from the mean value of the corresponding histogram in a–f. The error bars indicate the full width at half maximum of the Gaussian fitting of corresponding histograms. Reproduced with permission from Ref. [40]. Copyright 2020 Springer Nature.
In addition to the advantage of high spatial resolution, PSM also allows incident light intensity up to 3 kW cmȒ2, which is ~30 000 times higher than the classical SPRM, without camera overexposure because PSM does not collect the strong reflection. Combined with the plasmonic enhancement, the incident light intensity of 3 kW cm−2 can provide a sufficient signal-to-noise ratio for label-free single molecule imaging with PSM.[43–47] For example, single protein binding behaviors on antibody modified surface were monitored by PSM. The proteins can bind to the surface modified with corresponding antibodies, while other non-target proteins will only hit on the surface transiently due to Brownian motion (Figure 4).
Figure 4.
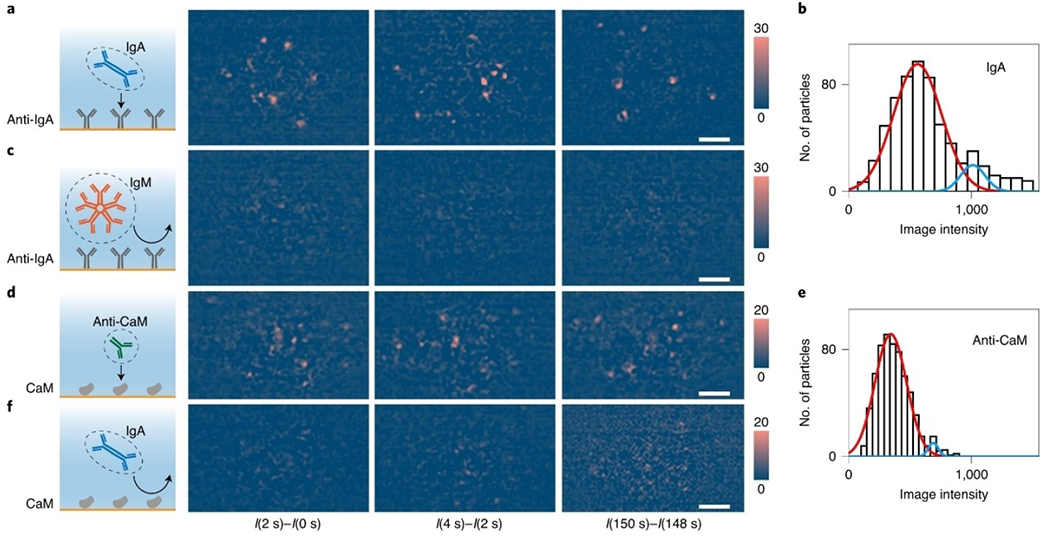
a) Differential PSM snapshots showing binding of IgA to anti-IgA immobilized on the surface. b) Intensity histogram of IgA molecules, where the solid lines are Gaussian fitting. c) Negative control experiment, exposing IgM to anti-IgA surface. d) Binding of anti-CaM to CaM immobilized on the surface. e) Intensity histogram of anti-CaM molecules on CaM, where the solid lines are Gaussian fitting. f) Negative control experiment, exposing IgA to CaM. I(0 s), I(2 s), I(4 s), I(148 s) and I(150 s) refer to the raw PSM images achieved at 0 s, 2 s, 4 s, 148 s and 150 s, respectively, after exposure to samples. Incident light intensity, 2kW cm−2; camera exposure time, 2 ms. Scale bars, 5 μm. Reproduced with permission from Ref. [40]. Copyright 2020 Springer Nature.
3. Single Protein Binding Kinetics
With the single-molecule imaging capability, PSM can digitally count the binding proteins to quantify the receptor-ligand binding kinetics, which is a key application of SPR technology.[48–49] By counting the binding and unbinding molecules against the time, the association and dissociation curves can be digitally produced and fitted to determine the kinetic constants (Figure 5a).[36] This digital counting based binding kinetic analysis has two major advantages: It detects individual molecular binding events directly and thus is immune to bulk refractive index changes in the solution, which must be corrected in the analog ensemble SPR for accurate binding kinetics measurement. In addition, PSM can quantify the heterogeneity of individual protein properties, such as number, size, and binding behaviors, and therefore can discriminate the binding of impurity molecules in the sample from that of the target protein based on the analyte property differences (Figure 5b–f). Owing to the advantage of being immune to bulk refractive index variation and allowing highly specific detection, PSM provides the ability for molecular detection in complex media, such as measuring single molecule binding kinetics in serum,[39] and counting intracellular protein complexes released by cells after lysis (Figure 6).[50]
Figure 5.
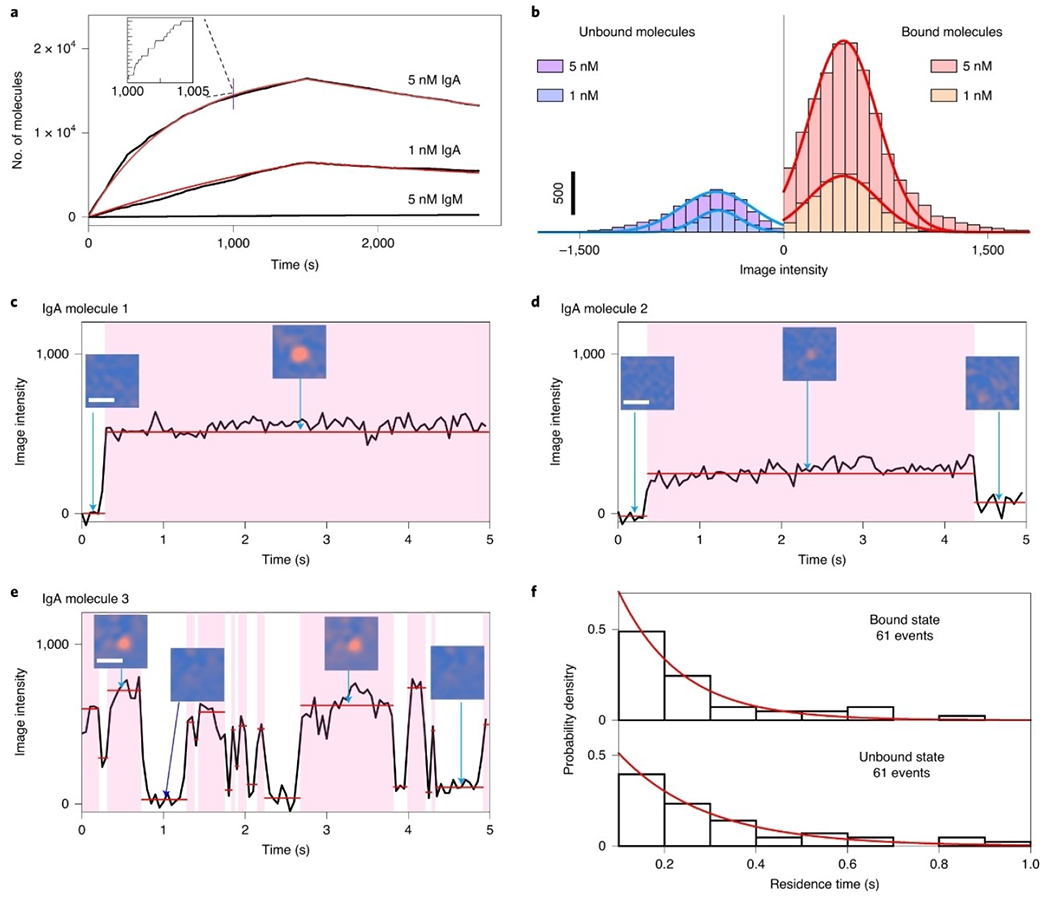
a) Kinetics of IgA binding to anti-IgA determined by digital counting of the binding/unbinding of single molecules. B) Histograms of intensity changes associated with binding and unbinding of individual IgA molecules, where the solid lines are Gaussian fittings. C–e) Examples of different binding behaviors observed at the single-molecule level: IgA molecules 1 (c), 2 (d) and 3 (e). Scale bars of the PSM images, 2 μm. f) Bound and unbound residence time distributions for IgA molecule 3, where the red lines are fittings of the data to exponential decay. Reproduced with permission from Ref. [40]. Copyright 2020 Springer Nature.
Figure 6.
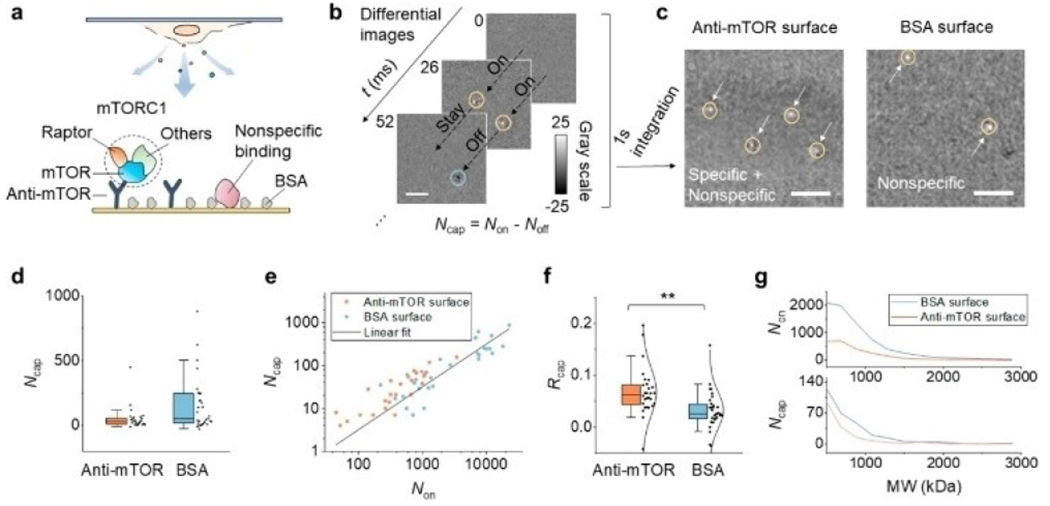
PSM detection of mTORC1 released from lysed cells. (a) mTORC1, an intracellular protein complex consisting of mTOR, Raptor, and other components is specifically captured to the anti-mTOR functionalized surface. Although the surface is blocked with BSA, some large molecules can still bind to the surface nonspecifically and be imaged by PSM. (b) Representative differential images showing the dynamic binding and unbinding of single-protein complexes. Scale bar, 3 μm. The bright spot and the dark spot in the image indicate the molecule hitting or leaving the surface, respectively. The total number of captured molecules (Ncap) in a measurement is defined by Ncap=Non–Noff. (c) Integration of the differential images for 1 s. The arrows mark the position of the captured molecules. The left and right panels show the result of using an anti-mTOR surface and a BSA surface, respectively. Scale bar, 3 μm. (d) The numbers of captured molecules on an anti-mTOR surface and BSA surface. Each data point is obtained from an individual measurement; n = 28 (on 9 chips) and 31 (on 10 chips) for the anti-mTOR and BSA groups, respectively. For each measurement, the cell confluence is random, and the detection time ranges from 30 s to 2 min. (e) The positive correlation between Ncap and Non. (f) Capture ratio (Rcap=Ncap/Non) is used to describe the binding ability, with anti-mTOR showing a significantly higher ratio than BSA. **P < 0.01. The data are fitted with a normal distribution (solid curves). (g) Representative mass distribution curves of released molecules (top) and captured molecules (bottom) for anti-mTOR and BSA surfaces. Reproduced with permission from Ref. [50]. Copyright 2022 American Chemical Society.
4. Exosome Analysis
All prokaryotic and eukaryotic cells secreted extracellular vesicles (EVs) into circulation. EVs are lipid bilayer wrapped particles. Exosome is one type of EV with a diameter range of 30 to 150 nm (average ~100 nm) and plays a key role in intercellular transit process to regulate distant cell physiology and activity. Due to the endosomal origin mechanism, the constituents of exosomes can reflect the type and conditions of cells where they are released. Therefore, exosome analysis is a promising way to evaluate the health conditions from body liquid without biopsying tissues.[51–53] Traditional exosome biomarker analysis relies on the western blot technique, which requires laborious post-labelling processes for detection, making it impractical for rapid detection. Besides, western blot detection cannot analyze the size information of the exosomes, which is usually determined with an additional nanoparticle tracking analysis measurement. PSM provides the ability to perform the label-free size distribution and biomarker analysis in one system. Combined with the antibody modified surface, PSM can selectively capture and detect exosomes from the EVs. The exosome size can be estimated by tracking the intensity of binding events. Then, the ligand solutions can be flowed onto the exosomes immobilized on the surface, and the intensity variations against time can be recorded to create the specific binding curves. Fitting the binding curves allows for determining the kinetic constants and the relative biomarker content levels. Finally, the exosome biomarker profiles can be analyzed for different types of cells, which could be used to analyze the type of cancer cells (Figure 7). PSM provides sufficient signal-to-noise ratio for analysis of the single exosome binding events, and can be easily constructed on a popular prism-coupled SPR system with commercially available components. Therefore, PSM could become an economical and powerful tool for clinical exosome analysis as well as exosome biology research such as exosome biomarker binding properties.[54–55]
Figure 7.
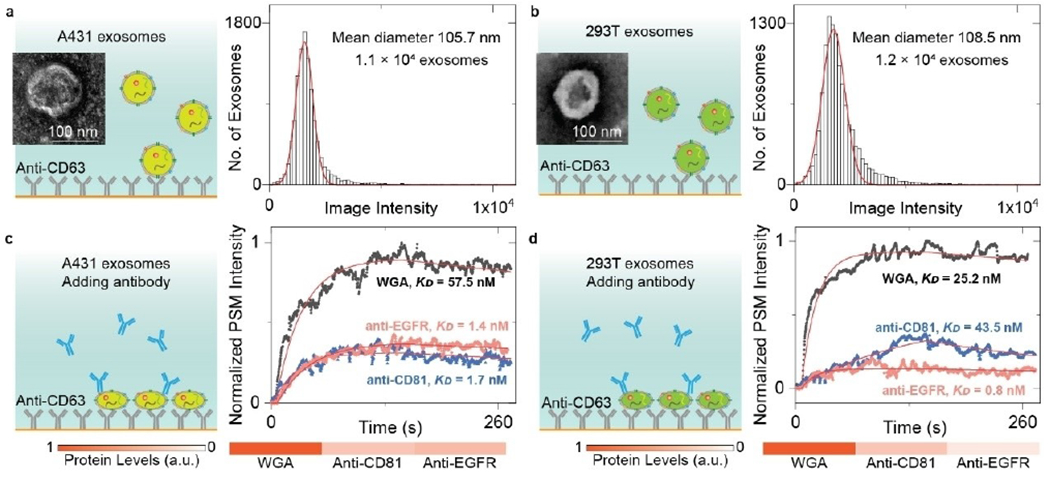
a, b) TEM images of EV from A431(a), and 293T(b) cells and PSM image intensity histograms of the exosomes by individually counting the single binding events. The exosomes are recognized by the anti-CD63 antibody immobilized on the gold surface. The mean diameter of exosomes and sample size are presented in the figure. c, d) Ensemble PSM measurements of WGA, anti-CD81, and anti-EGFR binding to the target proteins on the surfaces of A431(c), and 293T(d) exosomes. The protein levels are estimated by normalizing the target-associated changes to those of WGA targets. Reproduced with permission from Ref. [54]. Copyright 2022 Royal Society of Chemistry.
5. Analysis of Cellular Activities
Membrane proteins are responsible for many cellular processes such as signaling, communications, attaching to a surface, and recognizing other cells. Membrane proteins are also accounting for over half of current drug targets. The primary cellular activities and treatment processes usually begin with the binding of ligand or drug molecules to the membrane proteins. Membrane proteins may lose their functions without the support of a membrane, and therefore it is critical to quantify the binding kinetics of membrane proteins in situ for understanding the cellular functions and discovering new drugs. PSM provides high spatial resolution imaging of cell adhesion sites, and high measurement sensitivity for molecular binding. In addition, PSM can employ prism coupled SPR scheme and low magnification objective for large view imaging, enabling high throughput membrane protein binding kinetics analysis (Figure 8).[41] Furthermore, PSM can also track the lateral and axial movements of cell adhesion sites with a high temporal resolution, and determine the free energy profiles of cell adhesion by statistically analyzing the axial movement amplitudes, which provides a promising method for quantification of cellular responses to small molecules at a level of detail (Figure 9).[56]
Figure 8.
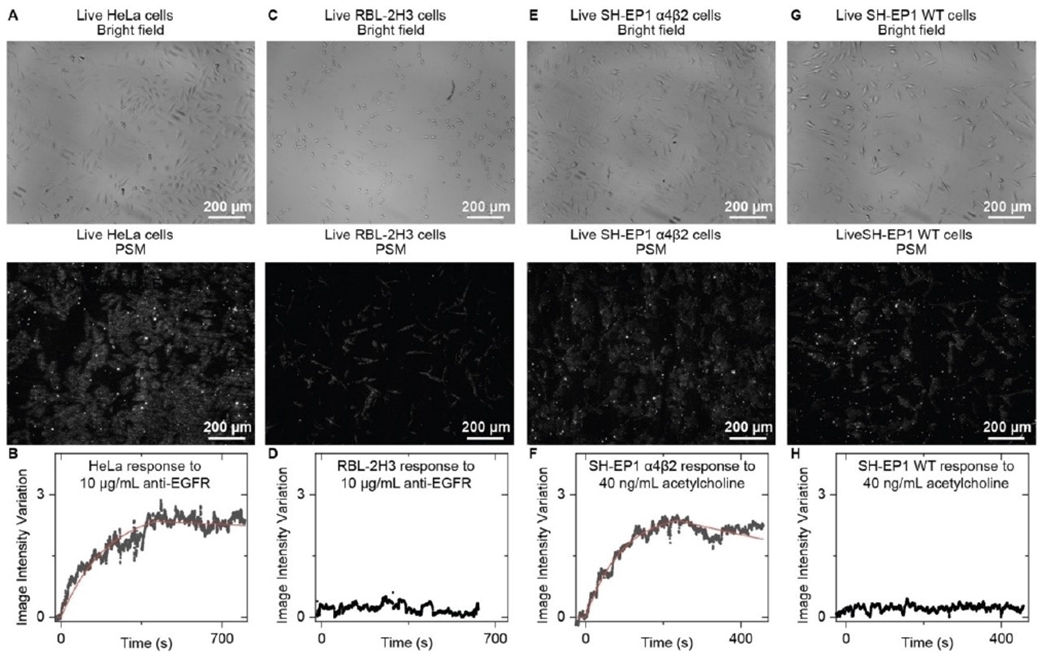
A) Bright field and PSM images of live HeLa cells. B) The image intensity variation against time by averaging the signals of all cells within the field of view shown in (A) during the anti-EGFR binding process. The fitted line is achieved by fitting the curve with a first-order binding kinetics model. C) Bright field and PSM images of live RBL-2H3 Cells. D) The image intensity variation against time by averaging the signal of all cells within the field of view shown in (C) during exposure to anti-EGFR as the negative control. E) Bright field and PSM images of live SH-EP1 α4β2 Cells. F) The image intensity variation against time by averaging the signals of all cells within the field of view shown in (E) during the acetylcholine binding process. The fitted line is achieved by fitting the curve with a first-order binding kinetics model. G) Bright field and PSM images of live SH-EP1 WT Cells. H) The image intensity variation against time by averaging the signal of all cells within the field of view shown in (G) during exposure to acetylcholine as the negative control. Reproduced with permission from Ref. [41]. Copyright 2022 Wiley VCH.
Figure 9.
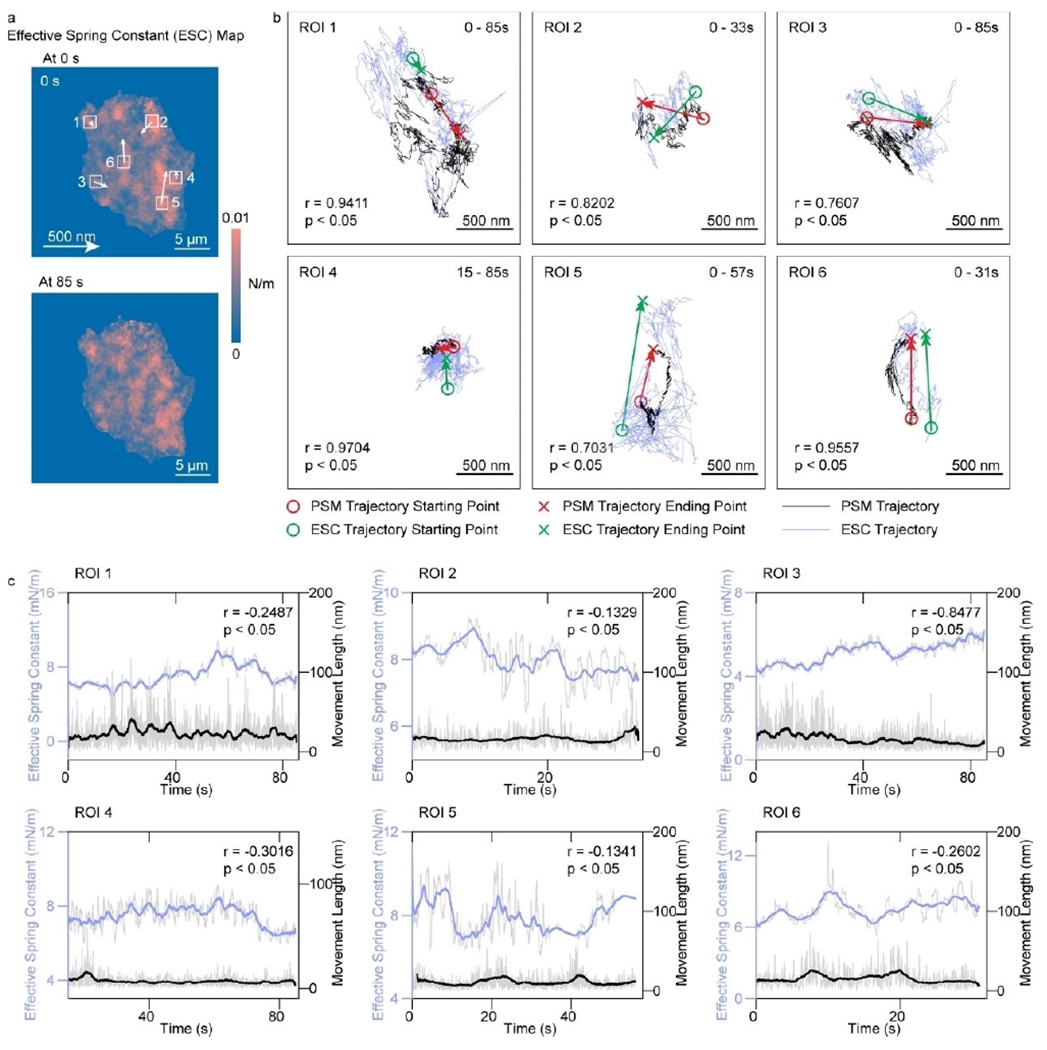
a) Effective spring constant maps of the same RBL-2H3 cell, after activation by 5 μg/mL DNP-BSA solution. The movements of maximum effective local spring constant locations are indicated by arrows. b) Overlays of the trajectory of focal adhesion movements (black lines) and the trajectory of maximum local effective spring constant locations (blue lines) in the ROI marked in (a). r represents the correlation coefficient between two trajectories. c) Correlation of focal adhesion movement distances with effective spring constant. The solid lines are achieved with a moving average over a window of 2.5 s, and the shadow lines are achieved with a moving average over a window of 0.05 s. The incident light intensity and camera exposure time are 600 Wcm−2 and 0.15 ms, respectively. The camera recording frame rate is 7000 fps. Reproduced with permission from Ref. [56]. Copyright 2021 American Chemical Society.
6. Latest Development and Applications
6.1. Evanescent scattering microscopy
PSM demonstrates that the scattering of evanescent waves can be employed for sensing with higher sensitivity than the resonant condition detections. This approach paves a road to utilize other kinds of evanescent waves, not limited to the surface plasmonic waves on the noble metal film surface, for label-free single molecule detection. A demonstrated example is evanescent scattering microscopy (ESM). ESM uses cover glasses to replace the gold coated slide in the PSM system, and the evanescent waves are created by total internal reflection (Figure 10). This detection scheme allows more flexible incident wavelength selection, eliminates the heating effect accompanying the gold film, avoids the interference of quantum coupling when tracking the motions of metal nanoparticles, and allows the systems with both dual and single objectives owing to the good optical transmittance of cover glasses.[40,57] In addition, the ESM has better compatibility with fluorescence imaging because it avoids the gold film quenching and absorption on fluorescence emission. Furthermore, ESM is a better choice for measuring single molecule charges[58] and for electrochemical imaging because it can reduce the background surface charge effect of the gold film by using alternative conducting coating such as indium tin oxide (ITO).[59] Although ESM has these advantages, one technical issue of ESM is that the ghost light caused by the imperfect optical components cannot be fully blocked by the cover glass surface compared to the gold film, which restrict it’s usage in a large field of view imaging, where the PSM is preferred.
Figure 10.
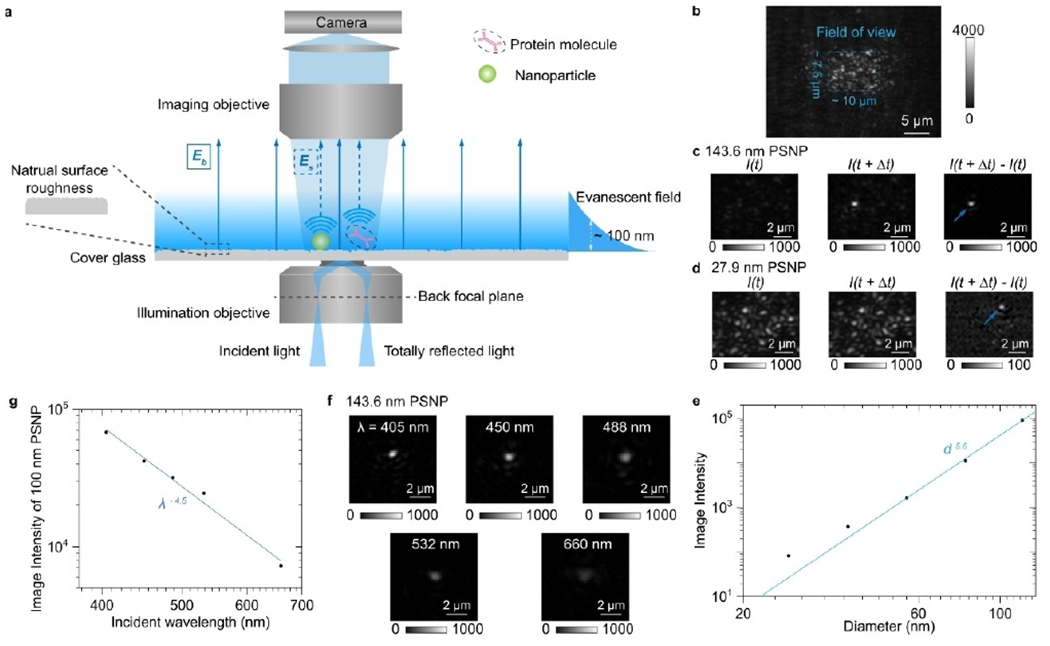
a), Schematic of ESM, where the evanescent field is created by total internal reflection and scattering of the evanescent waves by a particle or protein (Es) and by the glass surface (Eb) is collected from the top to form an ESM image. b), Raw ESM images of a bare cover glass. The blue dashed frame indicates the field of view determined by the illumination area. Incident wavelength: 450 nm. Incident intensity: 60 kWcm−2. Camera exposure time: 5 ms. c, d), ESM images before and after the binding of a 143.6 nm (c) and 27.9 nm (d) polystyrene nanoparticle (PSNP), and the corresponding differential images. Individual particles are marked with arrows. Incident wavelength: 450 nm. Incident intensity and camera exposure time are 2 kWcm−2 and 0.2ms for 143.6 nm, and 60kW cm−2 and 1ms for 27.9 nm, respectively. e) ESM image intensity versus particle diameter. f) ESM images of 143.6 nm PSNP achieved with different incident wavelengths. Incident intensity: 2 kWcm−2. Camera exposure time: 0.2 ms. g) ESM image intensity of the nanoparticle with an effective diameter of 100 nm versus incident wavelength. Reproduced with permission from Ref. [39]. Copyright 2022 Springer Nature.
6.2. Single molecule oscillator
In addition to the ability to determine single protein numbers and sizes, ESM can also be used with nano oscillator technology to determine the single protein charge. The nano oscillator was first demonstrated in total internal reflection microscopy for analyte charge detection.[13–14,59] The ESM has further advanced this method by providing a higher signal-to-noise ratio and higher spatial resolution than classical evanescent microscopy for simultaneously identifying different proteins on one sensor chip based on the difference in their sizes and charges. This technology may pave a road for comprehensive analysis of proteins, especially during the process of post translational modification (Figure 11).[58]
Figure 11.
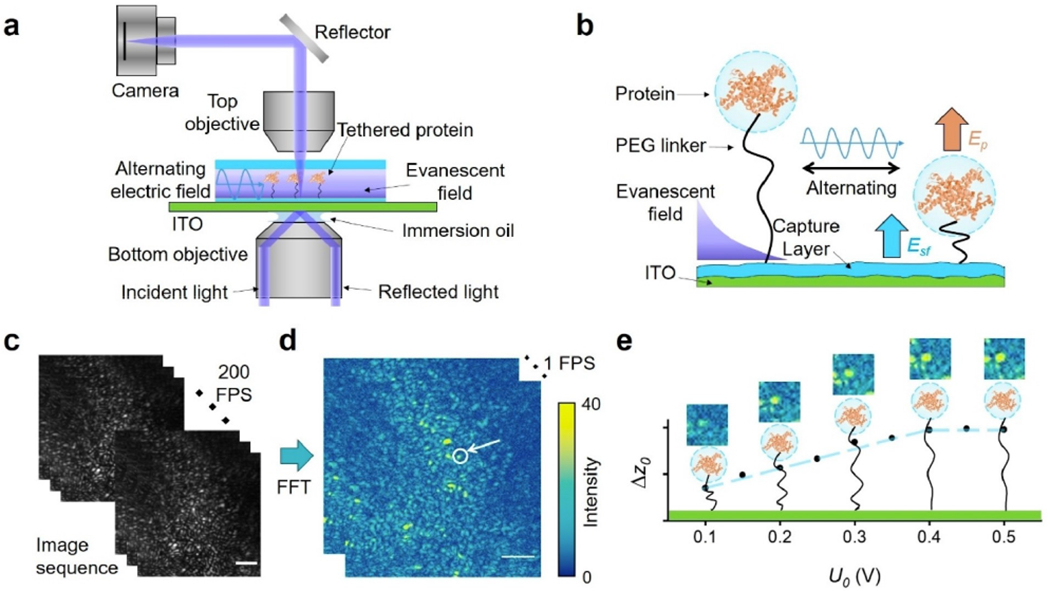
a) Schematic of ESM imaging of single protein oscillators. A vertical alternating electric field is applied to an ITO surface via a three-electrode configuration. b) The protein molecule is tethered to the streptavidin functionalized (the capture layer) ITO surface by a PEG linker and driven into oscillation by an alternating electric field in a vertical direction. c) An alternating potential with 0.5 V amplitude and 40 Hz frequency is applied to the ITO surface functionalized with tethered immunoglobulin G (IgG). An image sequence is recorded at 200 frames per second (FPS). d) By performing a temporal fast Fourier transform (FFT) to every 1 s image in the image sequence, an FFT image sequence of 1 FPS is obtained, in which oscillating proteins show as bright spots. The arrow marks a single IgG protein (yellow spot). e) The FFT image intensity of the marked protein is converted to oscillation amplitude (in nanometers) through calibration. By increasing the applied potential (U0), the oscillation amplitude (Δz0) shows a linear increase in the beginning and then reaches a plateau due to the restriction from the PEG tether. The hydrodynamic diameter and charge of the protein can be determined from the plateau regime and the linear regime, respectively. Scale bar: 5 μm. Reproduced with permission from Ref. [59]. Copyright 2022 American Chemical Society.
6.3. Rapid and noninvasive regulation of temperature sensitive ion channels
Temperature is a critical environmental parameter regulating cell functions and activities. The classical temperature control techniques employ heating sources to conduct the heat transfer, which can be time consuming and nonuniform over the target surface. In recent decades, plasmon resonances in nanostructures, especially metallic nanoparticles, have been proven to be efficient in regulating localized heat rapidly and feasibly for many practical applications. Due to the heating effect of gold film under surface plasmon resonance conditions, PSM also can rapid and noninvasively regulate local temperature near the illuminated surface. Because of the limited penetration length of surface plasmonic waves, PSM limits the heating volume within ~100 nm above the gold surface, and thus providing a feasible way to selectively heat the temperature-sensitive membrane proteins, such as the transient receptor potential vanilloid 1 (TRPV1) ion channels, for regulating cellular activities. This approach has been experimentally demonstrated by selectively activating ion channels in TRPV1-transfected HEK-293T cells by plasmonic heating, with simultaneous fluorescence imaging to monitor the intercellular calcium ions influx processes (Figure 12).[60]
Figure 12.
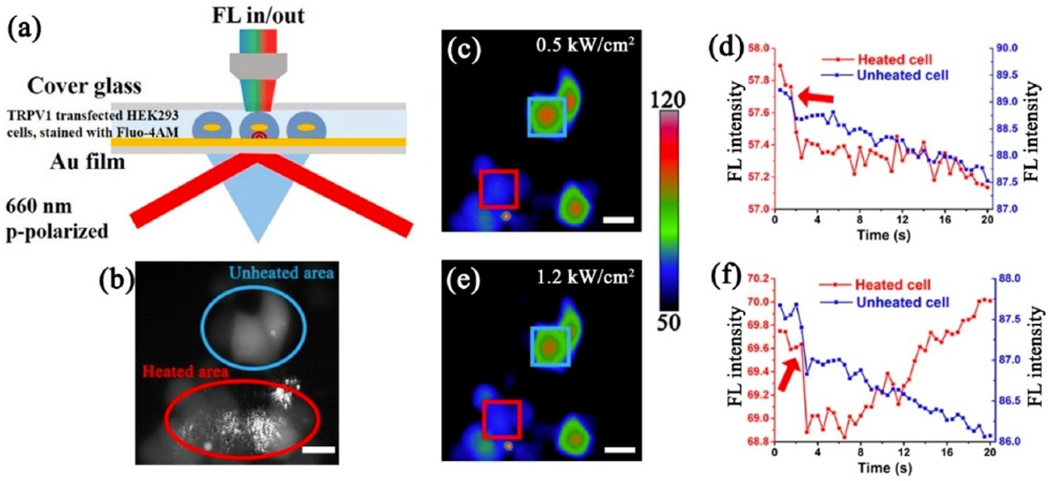
a) Schematic of PSM and fluorescence imaging setup for selective TRPV1 activation monitoring. b) Overlap of the fluorescence image and PSM image, showing the locations of activated cells (red circle) and unactivated cells (blue circle). c, e) Fluorescence imaging snapshots (pseudocolor) of cells excited at 0.5 kW/cm2 (c) and 1.2 kW/cm2 (e). Cells of interest in the W-PTM view and out of the W-PTM view are marked with the red and blue squares, respectively. d, f) Corresponding fluorescence intensity traces of the cells of interest in (c, e), respectively. The red arrow marks the time when PSM excitation started.
Reproduced with permission from Ref. [60]. Copyright 2022 American Chemical Society.
7. Summary and Outlook
Recently developed label-free single-molecule imaging approaches have pushed beyond ensemble averages and have revealed the statistical distributions of molecular sizes and interaction processes. The photothermal microscopy has shown the heterogeneity of single protein absorption in the solution.[61] Interferometric scattering microscopy (iSCAT) can observe the diffusion, association, and dissociation of membrane associated proteins to analyze homo- and hetero-oligomeric interactions for membrane-associated processes at a level of detail, and thus iSCAT becomes a promising tool to elucidate biomolecular mechanisms on the plasma membrane, such as the MinDE reaction cycles that play a key role in bacteria divisions.[62–63] Compared to these technologies using far field light, the PSM was developed from the SPR technology, which is a classical and popular approach for molecular interaction analysis. PSM detects the out-of-plane scattering of evanescent waves to achieve high spatial resolution and enable high incident light intensity. PSM and the related ESM have several unique features. First, the evanescent field intensity is localized within ~100 nm from the sensor surface, making it immune to the interference of molecules and impurities in the bulk solution, and particularly suitable for studying surface binding. Second, there is a large enhancement in the evanescent field, making PSM possible to achieve the same signal-to-noise ratio with a wider field of view compared with iSCAT. Finally, the PSM does not consider the Gouy phase shift as the iSCAT, and thus the field of view can be easily expanded in PSM for applications in a diverse range of biological specimens.
PSM also employs the near-field interference between the plasmonic waves scattered by gold surface and analytes to enhance the image contrast to enable single protein detection. The near-field interference principle has also been used by new label-free single-molecule imaging approaches, such as nanofluidic scattering microscopy.[64]
Single-molecule detection capability and high spatiotemporal resolution provide many encouraging and promising prospects for the future development of PSM. In our opinion, PSM still shares the major advantage with the conventional SPR technology, where the incident illumination is limited near the surface by the evanescent wave and does not interact with the targets dispersed in the bulk. Considering that cellular activities, such as transmembrane transports and signal transductions, usually starting with the ligand binding to the receptors on the membrane, a central task for future PSM development should be the detailed analysis of molecular interactions among membrane proteins and ligands. At the same time, PSM should try to combine the super-resolution or three-dimensional single cell fluorescence imaging technology for comprehensively analyzing the whole process of cellular activities and pathways.
REVIEW.
Measuring molecular binding kinetics is a key task in molecular interaction analysis. Plasmonic scattering microscopy (PSM) is a newly developed optical imaging technology pushing the detection limit down to a single-protein level. The principle and instrumentation of PSM is introduced, and its key applications are summarized in single molecules detection, molecular binding kinetics quantification and cellular dynamic mapping.

Acknowledgements
The authors thank financial support from the National Institute of General Medical Sciences of the National Institutes of Health under Award Number R01GM140193 and R01GM107165.
Biographies

Pengfei Zhang obtained his B.S. degree from University of Science and Technology of China, and Ph.D. degree from Tsinghua University, majoring in physics. He worked as a postdoctoral researcher in Biodesign Center for Bioelectronics and Biosensors in Prof. Shaopeng Wang’s group while writing this article. He is currently a professor at Key Laboratory of Analytical Chemistry for Living Biosystems, Institute of Chemistry, Chinese Academy of Sciences. His research focuses on plasmonic and evanescence scattering microscopy for single-molecule imaging.

Xinyu Zhou obtained his B. S. degree from the Southern University of Science and Technology in Shenzhen, China. He is currently a Ph.D. student in Prof. Shaopeng Wang’s group in School of Biological and Health Systems Engineering and Biodesign Center for Bioelectronics and Biosensors. His research focuses on label-free imaging of single molecules and cells.

Shaopeng Wang is an associate professor in School of Biological and Health Systems Engineering and Biodesign Center for Bioelectronics and Biosensors at Arizona State University. He received his B.S. degree in Biological Sciences & Biotechnology and M.S. degree in Biophysics from Tsinghua University, and earned his Ph.D. degree in physical chemistry from University of Miami. His research interests include label-free optical and electrochemical sensing for chemical and biological targets and the development of biosensors and bioanalytical instruments for biomedical applications.
Footnotes
Conflict of Interest
The authors declare no conflict of interest.
Data Availability Statement
Data sharing is not applicable to this article as no new data were created or analyzed in this study.
References
- [1].Santos R, Ursu O, Gaulton A, Bento AP, Donadi RS, Bologa CG, Karlsson A, Al-Lazikani B, Hersey A, Oprea TI, Overington JP, Nat. Rev. Drug Discovery 2017, 16, 19–34. [DOI] [PMC free article] [PubMed] [Google Scholar]
- [2].Homola J, Chem. Rev 2008, 108, 462–493. [DOI] [PubMed] [Google Scholar]
- [3].Wang W, Foley K, Shan X, Wang S, Eaton S, Nagaraj VJ, Wiktor P, Patel U, Tao N, Nat. Chem 2011, 3, 249–255. [DOI] [PMC free article] [PubMed] [Google Scholar]
- [4].Wang W, Yang Y, Wang S, Nagaraj VJ, Liu Q, Wu J, Tao N, Nat. Chem 2012, 4, 846–853. [DOI] [PMC free article] [PubMed] [Google Scholar]
- [5].Lu J, Li J, Angew. Chem. Int. Ed 2015, 54, 13576–13580; [DOI] [PubMed] [Google Scholar]; Angew. Chem 2015, 127, 13780–13784. [Google Scholar]
- [6].Lu J, Yang Y, Wang W, Li J, Tao N, Wang S, Anal. Chem 2016, 88, 11498–11503. [DOI] [PMC free article] [PubMed] [Google Scholar]
- [7].Liu X-W, Yang Y, Wang W, Wang S, Gao M, Wu J, Tao N, Angew. Chem. Int. Ed 2017, 56, 8855–8859; [DOI] [PMC free article] [PubMed] [Google Scholar]; Angew. Chem 2017, 129, 8981–8985. [Google Scholar]
- [8].Peng Z, Lu J, Zhang L, Liu Y, Li J, Analyst 2018, 143, 5264–5270. [DOI] [PubMed] [Google Scholar]
- [9].Yang Y, Liu X-W, Wang H, Yu H, Guan Y, Wang S, Tao N, ACS Nano 2018, 12, 4186–4193. [DOI] [PMC free article] [PubMed] [Google Scholar]
- [10].Syal K, Iriya R, Yang Y, Yu H, Wang S, Haydel SE, Chen H-Y, Tao N, ACS Nano 2016, 10, 845–852. [DOI] [PubMed] [Google Scholar]
- [11].Yang Y, Yu H, Shan X, Wang W, Liu X, Wang S, Tao N, Small 2015, 11, 2878–2884. [DOI] [PMC free article] [PubMed] [Google Scholar]
- [12].Wang S, Shan X, Patel U, Huang X, Lu J, Li J, Tao N, Proc. Natl. Acad. Sci. USA 2010, 107, 16028–16032. [DOI] [PMC free article] [PubMed] [Google Scholar]
- [13].Ma G, Syu G-D, Shan X, Henson B, Wang S, Desai PJ, Zhu H, Tao N, J. Am. Chem. Soc 2018, 140, 11495–11501. [DOI] [PMC free article] [PubMed] [Google Scholar]
- [14].Ma G, Shan X, Wang S, Tao N, Anal. Chem 2019, 91, 14149–14156. [DOI] [PMC free article] [PubMed] [Google Scholar]
- [15].Shan X, Díez-Pérez I, Wang L, Wiktor P, Gu Y, Zhang L, Wang W, Lu J, Wang S, Gong Q, Li J, Tao N, Nat. Nanotechnol 2012, 7, 668–672. [DOI] [PubMed] [Google Scholar]
- [16].Wo X, Li Z, Jiang Y, Li M, Su Y-W, Wang W, Tao N, Anal. Chem 2016, 88, 2380–2385. [DOI] [PubMed] [Google Scholar]
- [17].Fang Y, Li Z, Jiang Y, Wang X, Chen H-Y, Tao N, Wang W, Proc. Natl. Acad. Sci. USA 2017, 114, 10566–10571. [DOI] [PMC free article] [PubMed] [Google Scholar]
- [18].Jiang D, Jiang Y, Li Z, Liu T, Wo X, Fang Y, Tao N, Wang W, Chen H-Y, J. Am. Chem. Soc 2017, 139, 186–192. [DOI] [PubMed] [Google Scholar]
- [19].Jing W, Wang Y, Yang Y, Wang Y, Ma G, Wang S, Tao N, ACS Nano 2019, 13, 8609–8617. [DOI] [PMC free article] [PubMed] [Google Scholar]
- [20].Liu R, Shan X, Wang H, Tao N, J. Am. Chem. Soc 2019, 141, 1694–11699. [DOI] [PubMed] [Google Scholar]
- [21].Wang H, Tang Z, Wang Y, Ma G, Tao N, J. Am. Chem. Soc 2019, 141, 16071–16078. [DOI] [PubMed] [Google Scholar]
- [22].Wang H, Yu H, Wang Y, Shan X, Chen H-Y, Tao N, Proc. Natl. Acad. Sci. USA 2020, 117, 17564–17570. [DOI] [PMC free article] [PubMed] [Google Scholar]
- [23].Wang Y, Tang Z, Chen H-Y, Wang W, Tao N, Wang H, Proc. Natl. Acad. Sci. USA 2021, 118, e2104598118. [DOI] [PMC free article] [PubMed] [Google Scholar]
- [24].Wang Y, Shan X, Wang H, Wang S, Tao N, J. Am. Chem. Soc 2017, 139, 1376–1379. [DOI] [PubMed] [Google Scholar]
- [25].Wang H, Shan X, Yu H, Wang Y, Schmickler W, Chen H-Y, Tao N, Angew. Chem. Int. Ed 2017, 56, 2132–2135; [DOI] [PubMed] [Google Scholar]; Angew. Chem 2017, 129, 2164–2167. [Google Scholar]
- [26].Yang Y, Shen G, Wang H, Li H, Zhang T, Tao N, Ding X, Yu H, Proc. Natl. Acad. Sci. USA 2018, 115, 10275–10280. [DOI] [PMC free article] [PubMed] [Google Scholar]
- [27].Wang Y, Shan X, Wang S, Tao N, Blanchard P-Y, Hu K, Mirkin MV, Anal. Chem 2016, 88, 1547–1552. [DOI] [PubMed] [Google Scholar]
- [28].Chen Z, Shan X, Guan Y, Wang S, Zhu J-J, Tao N, ACS Nano 2015, 9, 11574–11581. [DOI] [PubMed] [Google Scholar]
- [29].Lu J, Wang W, Wang S, Shan X, Li J, Tao N, Anal. Chem 2012, 84, 327–333. [DOI] [PMC free article] [PubMed] [Google Scholar]
- [30].Fang Y, Chen S, Wang W, Shan X, Tao N, Angew. Chem. Int. Ed 2015, 54, 2538–2542; [DOI] [PubMed] [Google Scholar]; Angew. Chem 2015, 127, 2568–2572. [Google Scholar]
- [31].Shan X, Patel U, Wang S, Iglesias R, Tao N, Science 2010, 327, 1363–1366. [DOI] [PubMed] [Google Scholar]
- [32].Wang Y, Wang H, Chen Y, Wang Y, Chen H-Y, Shan X, Tao N, J. Am. Chem. Soc 2017, 139, 7244–7249. [DOI] [PubMed] [Google Scholar]
- [33].Yu H, Shan X, Wang S, Chen H, Tao N, Anal. Chem 2014, 86, 8992–8997. [DOI] [PubMed] [Google Scholar]
- [34].Yu H, Shan X, Wang S, Tao N, Anal. Chem 2017, 89, 2704–2707. [DOI] [PubMed] [Google Scholar]
- [35].Wang X, Zeng Q, Xie F, Wang J, Yang Y, Xu Y, Li J, Yu H, Anal. Chem 2021, 93, 7399–7404. [DOI] [PubMed] [Google Scholar]
- [36].Zhang P, Ma G, Dong W, Wan Z, Wang S, Tao N, Nat. Methods 2020, 17, 1010–1017. [DOI] [PMC free article] [PubMed] [Google Scholar]
- [37].Kretschmann E, Opt. Commun 1972, 6, 185–187. [Google Scholar]
- [38].Evlyukhin AB, Bozhevolnyi SI, Phys. Rev. B 2015, 92, 245419. [Google Scholar]
- [39].Zhang P, Ma G, Wan Z, Wang S, ACS Sens. 2021, 6, 1357–1366. [DOI] [PMC free article] [PubMed] [Google Scholar]
- [40].Zhang P, Zhou L, Wang R, Zhou X, Jiang J, Wan Z, Wang S, Nat. Commun 2022, 13, 2298. [DOI] [PMC free article] [PubMed] [Google Scholar]
- [41].Zhang P, Zhou X, Jiang J, Kolay J, Wang R, Ma G, Wan Z, Wang S, Angew. Chem. Int. Ed 2022, 61, e202209469. [DOI] [PMC free article] [PubMed] [Google Scholar]
- [42].Martin-Fernandez ML, Tynan CJ, Webb SED, J. Microsc 2013, 252, 16–22. [DOI] [PMC free article] [PubMed] [Google Scholar]
- [43].Piliarik M, Sandoghdar V, Nat. Commun 2014, 5, 4495. [DOI] [PubMed] [Google Scholar]
- [44].Arroyo JO, Kukura P, Nat. Photonics 2016, 10, 11–17. [Google Scholar]
- [45].Ortega Arroyo J, Cole D, Kukura P, Nat. Protoc 2016, 11, 617–633. [DOI] [PubMed] [Google Scholar]
- [46].Cole D, Young G, Weigel A, Sebesta A, Kukura P, ACS Photonics 2017, 4, 211–216. [DOI] [PMC free article] [PubMed] [Google Scholar]
- [47].Young G, Hundt N, Cole D, Fineberg A, Andrecka J, Tyler A, Olerinyova A, Ansari A, Marklund Erik G, Collier Miranda P, Chandler Shane A, Tkachenko O, Allen J, Crispin M, Billington N, Takagi Y, Sellers James R, Eichmann C, Selenko P, Frey L, Riek R, Galpin Martin R,Struwe Weston B, Benesch Justin LP, Kukura P, Science 2018, 360, 423–427. [DOI] [PMC free article] [PubMed] [Google Scholar]
- [48].Zhang P, Liu L, He Y, Chen X, Ma K, Wei D, Wang H, Shao Q, Sens. Actuators B 2018, 272, 69–78. [Google Scholar]
- [49].Zhang P, Liu L, He Y, Chen X, Ma K, Wei D, Plasmonics 2019, 14, 187–195. [Google Scholar]
- [50].Ma G, Zhang P, Zhou X, Wan Z, Wang S, ACS Cent. Sci 2022, 8, 1272–1281. [DOI] [PMC free article] [PubMed] [Google Scholar]
- [51].Ning B, Huang Z, Youngquist BM, Scott JW, Niu A, Bojanowski CM, Zwezdaryk KJ, Saba NS, Fan J, Yin X-M, Cao J, Lyon CJ, Li C.-z., Roy CJ, Hu TY, Nat. Nanotechnol 2021, 16, 1039–1044. [DOI] [PMC free article] [PubMed] [Google Scholar]
- [52].Kalluri R, LeBleu VS, Science 2020, 367, eaau6977. [DOI] [PMC free article] [PubMed] [Google Scholar]
- [53].Zheng W, LaCourse SM, Song B, Singh DK, Khanna M, Olivo J, Stern J, Escudero JN, Vergara C, Zhang F, Li S, Wang S, Cranmer LM, Huang Z, Bojanowski CM, Bao D, Njuguna I, Xiao Y, Wamalwa DC, Nguyen DT, Yang L, Maleche-Obimbo E, Nguyen N, Zhang L, Phan H, Fan J, Ning B, Li C, Lyon CJ, Graviss EA, John-Stewart G, Mitchell CD, Ramsay AJ, Kaushal D, Liang R, Pérez-Then E, Hu TY, Nature Biomedical Engineering 2022, 6, 979–991. [DOI] [PMC free article] [PubMed] [Google Scholar]
- [54].Zhang P, Jiang J, Zhou X, Kolay J, Wang R, Wan Z, Wang S, Chem. Sci 2022. [DOI] [PMC free article] [PubMed] [Google Scholar]
- [55].Zhang P, Wang S, Biocell 2021, 45, 1449–1451. [DOI] [PMC free article] [PubMed] [Google Scholar]
- [56].Zhang P, Zhou X, Wang R, Jiang J, Wan Z, Wang S, ACS Sens. 2021, 6, 4244–4254. [DOI] [PMC free article] [PubMed] [Google Scholar]
- [57].Zhang P, Wang R, Wan Z, Zhou X, Ma G, Kolay J, Jiang J, Wang S, Anal. Chem 2022, 94, 10781–10787. [DOI] [PMC free article] [PubMed] [Google Scholar]
- [58].Wan Z, Ma G, Zhang P, Wang S, ACS Sens. 2022, 7, 2625–2633. [DOI] [PMC free article] [PubMed] [Google Scholar]
- [59].Ma G, Wan Z, Yang Y, Zhang P, Wang S, Tao N, Nat. Commun 2020, 11, 4768. [DOI] [PMC free article] [PubMed] [Google Scholar]
- [60].Wang R, Jiang J, Zhou X, Wan Z, Zhang P, Wang S, Anal. Chem 2022. [Google Scholar]
- [61].Gaiduk A, Yorulmaz M, Ruijgrok PV, Orrit M, Science 2010, 330, 353–356. [DOI] [PubMed] [Google Scholar]
- [62].Foley EDB, Kushwah MS, Young G, Kukura P, Nat. Methods 2021, 18, 1247–1252. [DOI] [PMC free article] [PubMed] [Google Scholar]
- [63].Heermann T, Steiert F, Ramm B, Hundt N, Schwille P, Nat. Methods 2021, 18, 1239–1246. [DOI] [PMC free article] [PubMed] [Google Scholar]
- [64].Špačková B, Klein Moberg H, Fritzsche J, Tenghamn J, Sjösten G, Šípová-Jungová H, Albinsson D, Lubart Q, van Leeuwen D, Westerlund F, Midtvedt D, Esbjörner EK, Käil M, Volpe G, Langhammer C, Nat. Methods 2022, 19, 751–758. [DOI] [PMC free article] [PubMed] [Google Scholar]
Associated Data
This section collects any data citations, data availability statements, or supplementary materials included in this article.
Data Availability Statement
Data sharing is not applicable to this article as no new data were created or analyzed in this study.


