

Abstract
Lung cancer is one of the most common types of cancer worldwide, with the highest incidence and mortality rates. Protein phosphatase, Mg2+/Mn2+ dependent 1G (PPM1G) is a serine/threonine phosphatase, which is involved in the proliferation, invasion and metastasis of tumor cells. However, there are few reports on the role of PPM1G in lung adenocarcinoma (LUAD). The present study used publicly available data from The Cancer Genome Atlas (TCGA) and Gene Expression Omnibus databases to evaluate the expression of PPM1G in LUAD, and to assess the relationship between PPM1G expression and the prognosis of patients with LUAD. Protein expression data of PPM1G obtained by immunohistochemical staining were collected from the Human Protein Atlas database. The correlation between PPM1G and immune cell infiltration and immune checkpoints was analyzed by single-sample gene set enrichment analysis of TCGA data. The Kaplan-Meier method was used for survival analysis, and univariate and multivariate Cox regression were used to analyze the effect of PPM1G on prognosis with data from TCGA database. The results showed that PPM1G was highly expressed in LUAD cancer tissues. The high expression of PPM1G was associated with poor clinical stage, T stage, N stage and overall survival in LUAD. The present study screened 29 genes related to PPM1G and closely related to the cell cycle in patients with LUAD. The expression of PPM1G was positively correlated with γδ-T cells, T helper 2 cells and natural killer CD56dim cells, and was negatively correlated with B cells, mast cells, plasmacytoid dendritic cells, T helper cells, macrophages, T cells, CD8 T cells, central memory T cells, effector memory T cells, neutrophils and T follicular helper cells. In addition, PPM1G was positively correlated with immune detection points. In conclusion, PPM1G may be involved in the control of the lung cancer cell cycle, and could be associated with prognosis and immune infiltration in patients with LUAD.
Keywords: protein phosphatase, Mg2+/Mn2+ dependent 1G, lung adenocarcinoma, immune infiltration, prognosis, cell cycle
Introduction
Lung cancer is one of the most common types of cancer worldwide, with the highest incidence and mortality rates (1). According to statistics, millions of new lung cancer cases and lung cancer-related deaths are recorded annually (2). Lung cancer is divided into two common types, namely small cell lung cancer and non-small cell lung cancer (NSCLC) (3,4). The latter accounts for ~85% of all lung cancer cases (5), and lung adenocarcinoma (LUAD) is the most common subtype of NSCLC (6).
There are several treatment methods for lung cancer, including routine surgery, chemotherapy and radiotherapy, as well as the new methods of targeted therapy and immunotherapy (7); however, lung cancer is still the leading cause of cancer-related mortality globally (8). Therefore, the identification of novel biomarkers and the development of new treatment approaches for lung cancer are of great importance.
Protein phosphatase, Mg2+/Mn2+ dependent 1G (PPM1G) is member of the metal-dependent protein phosphatase (PPM) family. The PPM family consists of serine/threonine phosphatases, which are involved in regulating the cell cycle and differentiation (9,10). Dysregulation of these phosphatases can result in the development of several diseases, including cancer. It has been reported that PPM1D, as a member of the PPM family, is associated with the onset of several types of human tumors, including high-grade glioma (11), colorectal cancer (12) and esophageal squamous cell carcinoma (13). In addition, previous studies have demonstrated that PPM1D upregulation is associated with the poor prognosis of patients with NSCLC (14,15). However, whether PPM1G, a significant member of the PPM family, is associated with the prognosis of lung cancer and immune cell infiltration, thus exerting a prognostic and immune potential, remains to be elucidated. A previous study demonstrated that PPM1G may serve a significant role in regulating the cell cycle (16). Another study showed that PPM1G is involved in the dephosphorylation of pre-mRNA splicing factors (17); pre-mRNA splicing serves a critical role in the pathological process of cancer (18).
In the present study, multiple public online platforms were used to detect the expression levels of PPM1G in tumor sample data downloaded from The Cancer Genome Atlas (TCGA) (https://cancergenome.nih.gov) and Gene Expression Omnibus (GEO) (https://www.ncbi.nlm.nih.gov/geo/), and to evaluate the association between PPM1G expression, prognosis and immune cell infiltration. In addition, the association between PPM1G and cell cycle-related genes in LUAD was investigated. Overall, the current study aimed to reveal the potential of PPM1G as a prognostic biomarker and its effect on immune cell infiltration in patients with LUAD, as well as to further investigate the role of PPM1G in regulating the cell cycle.
Materials and methods
Patient datasets
The expression levels of PPM1G were detected in 33 types of human cancer using TCGA (https://portal.gdc.cancer.gov/) database (19). A Mann-Whitney U test was performed to compare the differences in the expression levels of PPM1G between tumor and normal tissues (tumor-adjacent tissue). The cut-off P-value was set to <0.05 and the fold change was 1.5. Subsequently, RNA-sequencing (RNA-seq) data and clinical data of 535 LUAD tumor and 59 normal tissue samples were downloaded from the TCGA-LUAD dataset. Level 3 high-throughput sequencing (HTSeq)-fragments per kilobase of exon model per million reads mapped (FPKM) format of RNA-seq were downloaded from TCGA database, and the RNA-seq data in FPKM format were converted into transcripts per million (TPM) form and log2 conversion was then performed (20). In addition, three LUAD datasets, namely GSE30219 (21), GSE116959 (22) and GSE10072 (23), were downloaded from the Gene Expression Omnibus (GEO) database (https://www.ncbi.nlm.nih.gov/geo/) (24). The aforementioned GEO datasets were used to verify the differences in gene expression levels. Since the clinical data in the GSE30219 dataset were more detailed, this dataset was used to assess prognosis. Finally, the Human Protein Atlas (HPA) database (http://www.proteinatlas.org/) was used to validate the protein expression levels of PPM1G in LUAD.
RNA extraction and reverse transcription-quantitative PCR (RT-qPCR)
A total of 12 LUAD samples were collected from 6 male patients and 6 female patients (average age 60) who received surgical treatment for lung cancer at the Yantai Affiliated Hospital of Binzhou Medical University between March 2022 and December 2022 and the adjacent lung tissues with a distance from tumor tissue >2 cm were collected as negative controls. The studies were conducted in accordance with the ethical standards according to The Declaration of Helsinki, as well as national and international guidelines (25). The present study was approved by the Institutional Research Ethics Committee of Yantai Affiliated Hospital of Binzhou Medical University (protocol no. 20220215001; Yantai, China). The patients provided written informed consent to participate in this study.
Total RNA was isolated from tissues using the GoldHi Plasmid Mini kit (cat. no. CW0581; CoWin Biosciences). The Evo M-MLV RT Master Mix (cat. no. AG11728) was used to reverse transcribe RNA into cDNA, and the SYBR® Green Pro Taq HS Premix kit (cat. no. AG11740; both from Accurate Biology) was used for qPCR. The mRNA expression levels of PPM1G were analyzed by qPCR on the iCycler system (Bio-Rad Laboratories, Inc.). The RNA extraction, cDNA synthesis, and qPCR performed according to the manufacturer's protocols. The qPCR was performed at 95°C for 5 min, followed by 40 cycles at 95°C for 15 sec, 60°C for 30 sec and extension at 72°C for 30 sec, with a final extension step at 72°C for 10 min. GAPDH served as the internal control. The relative mRNA expression levels were measured using the 2−∆∆Cq method (26). The specific primer sequences were as follows: PPM1G, forward 5′-GGACAGTGAGGATGAGTCAGATG-3′, and reverse 5′-TGGCACCATCATCTCTTCTTCTT-3′; GAPDH, forward 5′-CGGAGTCAACGGATTTGGTCGTAT-3′ and reverse 5′-AGCCTTCTCCATGGTGGTGAAGAC-3′.
Survival analysis
The Kaplan-Meier plotter (http://kmplot.com/analysis/) was used to evaluate the association between the expression levels of PPM1G and the overall survival (OS) rate and clinical characteristics of patients with LUAD from TCGA database (27). Only RNAseq of LUAD patients with complete clinical data were retained, while those without the corresponding clinical data and from tumor-adjacent tissue were excluded.
Receiver operating characteristic (ROC) analysis
ROC curves were plotted to evaluate the diagnostic value of PPM1G in LUAD, and time-dependent ROC curves of PPM1G were used to predict the 1-, 3- and 5-year survival rates.
Analysis of nomograms to assess prognosis
The present study selected T stage, N stage, M stage, the expression level of PPM1G and age from Cox regression analysis to develop a prognostic nomogram chart to assess the 1-, 3- and 5-year OS rates of LUAD patients from TCGA database. The nomogram prediction chart was calibrated and then its accuracy verified by comparing the predicted probability of the line chart with the observed actual probability through a calibration curve.
LinkedOmics database analysis
The PPM1G-related co-expressed gene expression profile of LUCA patients from TCGA data in the LinkedOmics database were analyzed via gene set enrichment analysis (GSEA) in the Link Interpreter module (http://www.linkedomics.org) (28). Gene Ontology (GO) (http://geneontology.org/) and Kyoto Encyclopedia of Genes and Genomes (KEGG) (https://www.kegg.jp/) pathway enrichment analyses of the PPM1G-related co-expressed genes were subsequently performed for the functional enrichment analysis (29).
Functional enrichment analysis
The top 600 genes highly associated with PPM1G identified by LinkedOmics database analysis, and the top 100 upregulated genes associated with the survival of patients with LUAD identified by survival analysis were plotted into Venn diagrams using the XIANTAO platform (www.xiantaozi.com) (30). A total of 29 intersecting genes were obtained. GO and KEGG pathway enrichment analyses of these genes were performed using DAVID software (http://david.ncifcrf.gov/) (31). P<0.05 was set as the cut-off criterion.
Protein-protein interaction (PPI) network analysis
The STRING (https://string-db.org/) (32) database was utilized to analyze the PPIs. First, the ‘multiple proteins’ option was selected and the 29 intersecting genes were then entered into the STRING database. ‘Homo sapiens’ was selected in the species option. The obtained PPI data were used to generate a high-level network diagram using R package (33). A correlation heat map of the 29 intersecting genes were visualized by ‘ggplot2’ R package (34).
Correlation analysis between PPM1G, immune cell infiltration and immune checkpoints
Single-sample gene set enrichment analysis(SSGSEA) on the XIANTAO platform was performed to analyze the association between PPM1G expression, immune cell infiltration and immune checkpoints in LUAD. P<0.05 was set as the cut-off criterion. ρ>-0.3 and <0.3 were regarded as very weak correlations.
TISIDB database analysis
TISIDB is an integrated knowledge-based portal (http://cis.hku.hk/TISIDB/) (35). The association between PPM1G and the expression of chemokines/chemokine receptors was evaluated via evaluating the expression levels of chemokines/chemokine receptors of tumor-infiltrating immune cells through the ‘chemokine’ module in TISIDB.
Statistical analysis
The expression profile of PPM1G in patients with LUAD was illustrated in boxplots and scatter plots. The data from TCGA database were analyzed by Mann-Whitney U test for the unpaired data and the paired Student's t-test for the paired data. The unpaired data from the GEO database were analyzed by Mann-Whitney U test. The RT-qPCR data was analyzed using Wilcoxon signed-ranks test for paired data. The association between clinical parameters and PPM1G expression was analyzed by Kruskal-Wallis test and Dunn's test. The prognostic potential of PPM1G in patients with LUAD was evaluated via univariate and multivariate Cox regression analyses. The association between the expression levels of PPM1G and the OS of patients with LUAD were analyzed with the Kaplan-Meier method and log-rank test P-values were calculated. The contingency table (age exclusion) was analyzed by χ2 test when satisfying the assumption that the expected count in <20% of the cells of the analyzed contingency table was ≤5, when the expected count violated this assumption, Fisher's exact test was used to compare the groups; thus Fisher's exact test was used to analyze N stage, primary therapy outcome, ethnicity and residual tumor. The median age variable in the contingency was analyzed by Wilcoxon signed-ranks test. The patients were split into high and low expression groups by the median. Finally, the correlation between PPM1G and immune characteristics was analyzed by Spearman's rank correlation coefficient. P<0.05 was considered to indicate a statistically significant difference.
Results
PPM1G is upregulated in cancer tissues compared with in non-cancer tissues
To explore the possible role of PPM1G, its expression in 33 types of cancer was detected. Fig. 1A summarizes the expression levels of PPM1G in pan-cancer data (33 cancer types) obtained from TCGA database. The results showed that, compared with in normal tissues, PPM1G was upregulated significantly in 24 tumor tissues, including LUAD, clear cell carcinoma, bladder urothelial carcinoma, breast invasive carcinoma, cholangiocarcinoma, colon cancer, esophageal cancer, hepatocellular carcinoma, lung squamous cell carcinoma, prostate cancer, rectal adenocarcinoma, gastric cancer, thyroid cancer, endometrial carcinoma, adrenal cortical carcinoma and pancreatic cancer, etc. PPM1G was downregulated significantly in kidney chromophobe, testicular germ cell tumors and acute myeloid leukemia. The unpaired (normal=347 and tumor=515; P=5.6 × 10−73; Fig. 1B) and paired (normal=57 and tumor=57; P=2.2 × 10⁻¹⁵; Fig. 1C) TCGA-LUAD data presented in boxplots further demonstrated that the expression of PPM1G was increased in LUAD tissues compared with that in normal lung tissues. In addition, in the HPA database, immunohistochemical staining revealed that the expression levels of PPM1G in normal lung tissues were lower than those in tumor tissues (Fig. 1D and E). Additionally, three GEO datasets, namely GSE30219, GSE116959 and GSE10072, were selected to further verify the expression levels of PPM1G in LUAD. The results demonstrated that PPM1G was significantly upregulated in LUAD tissues compared with that in non-tumoral lung samples in all three GEO datasets (Fig. 2A-C). Finally, RT-qPCR verified that the relative mRNA expression levels of PPM1G were significantly higher in LUAD compared with in normal tissues (Fig. 2D).
Figure 1.

Relative expression levels of PPM1G in LUAD from TCGA and HPA databases. (A) Pan-cancer analysis of PPM1G expression levels in TCGA database. (B) Boxplot of PPM1G expression between LUAD and normal tissues in TCGA database. (C) Pairwise scatter plot of PPM1G expression between LUAD and normal tissues in TCGA database. (D) Immunohistochemical staining of PPM1G in normal lung tissue from the HPA database. (E) Immunohistochemical staining of PPM1G in lung tumor tissue from the HPA database. Immunohistochemical staining from the HPA database for PPM1G. **P<0.01,***P<0.001. PPM1G, protein phosphatase, Mg2+/Mn2+ dependent 1G; LUAD, lung adenocarcinoma; TCGA, The Cancer Genome Atlas; HPA, Human Protein Atlas.
Figure 2.

Expression levels of PPM1G in LUAD were verified using the Gene Expression Omnibus database. Expression of PPM1G in cancer and normal tissues in the (A) GSE30219, (B) GSE116959 and (C) GSE10072 datasets. (D) Reverse transcription-quantitative PCR showed relative mRNA expression levels of PPM1G in LUAD were significantly higher than those in normal tissues. **P<0.01. PPM1G, protein phosphatase, Mg2+/Mn2+ dependent 1G; LUAD, lung adenocarcinoma.
PPM1G expression is associated with the clinical features of patients with LUAD
To evaluate the association between PPM1G expression and the clinical characteristics of patients with LUAD, the expression levels of PPM1G were detected in different clinical categories in TCGA database (Table I). The results showed that high expression of PPM1G was significantly associated with pathologic stage (P<0.001), N stage (P<0.001), smoking status (smoker; P=0.019), number of pack years smoked (P=0.001), OS (P<0.001) and disease-specific survival (DSS; P=0.007 Table I; Fig. 3A-F). In DSS assessment, mortality caused by LUAD was counted as outcomes, and fatalities not caused by LUAD were not counted as outcomes.
Table I.
Relationship between PPM1G expression and clinical characteristics in lung adenocarcinoma.
| Characteristic | Low expression of PPM1G (n=267) | High expression of PPM1G (n=268) | P-value |
|---|---|---|---|
| T stage, n (%) | 0.010 | ||
| T1 | 105 (19.7) | 70 (13.2) | |
| T2 | 128 (24.1) | 161 (30.3) | |
| T3 | 24 (4.5) | 25 (4.7) | |
| T4 | 8 (1.5) | 11 (2.1) | |
| N stage, n (%) | <0.001 | ||
| N0 | 198 (38.2) | 150 (28.9) | |
| N1 | 34 (6.6) | 61 (11.8) | |
| N2 | 21 (4) | 53 (10.2) | |
| N3 | 1 (0.2) | 1 (0.2) | |
| M stage, n (%) | 0.304 | ||
| M0 | 176 (45.6) | 185 (47.9) | |
| M1 | 9 (2.3) | 16 (4.1) | |
| Primary therapy outcome, n (%) | 0.014 | ||
| PD | 25 (5.6) | 46 (10.3) | |
| SD | 22 (4.9) | 15 (3.4) | |
| PR | 2 (0.4) | 4 (0.9) | |
| CR | 180 (40.4) | 152 (34.1) | |
| Pathologic stage, n (%) | <0.001 | ||
| Stage I | 175 (33.2) | 119 (22.6) | |
| Stage II | 48 (9.1) | 75 (14.2) | |
| Stage III | 27 (5.1) | 57 (10.8) | |
| Stage IV | 10 (1.9) | 16 (3.0) | |
| Sex, n (%) | 0.514 | ||
| Female | 147 (27.5) | 139 (26.0) | |
| Male | 120 (22.4) | 129 (24.1) | |
| Ethnicity, n (%) | 0.817 | ||
| Asian | 4 (0.9) | 3 (0.6) | |
| Black or African American | 30 (6.4) | 25 (5.3) | |
| Caucasian | 206 (44.0) | 200 (42.7) | |
| Age, n (%) | 0.791 | ||
| ≤65 years | 125 (24.2) | 130 (25.2) | |
| >65 years | 132 (25.6) | 129 (25.0) | |
| Residual tumor, n (%) | 0.510 | ||
| R0 | 175 (47.0) | 180 (48.4) | |
| R1 | 5 (1.3) | 8 (2.2) | |
| R2 | 1 (0.3) | 3 (0.8) | |
| Anatomic neoplasm subdivision, n (%) | 0.223 | ||
| Left | 109 (21.0) | 96 (18.5) | |
| Right | 149 (28.7) | 166 (31.9) | |
| Anatomic neoplasm subdivision 2, n (%) | 0.932 | ||
| Central lung | 28 (14.8) | 34 (18) | |
| Peripheral lung | 55 (29.1) | 72 (38.1) | |
| Number of pack years smoked, n (%) | 0.001 | ||
| <40 | 107 (29.0) | 81 (22.0) | |
| ≥40 | 72 (19.5) | 109 (29.5) | |
| Smoker, n (%) | 0.019 | ||
| No | 47 (9.0) | 28 (5.4) | |
| Yes | 211 (40.5) | 235 (45.1) | |
| OS event, n (%) | <0.001 | ||
| Survived | 192 (35.9) | 151 (28.2) | |
| Succumbed | 75 (14.0) | 117 (21.9) | |
| DSS event, n (%) | 0.007 | ||
| Survived | 204 (40.9) | 175 (35.1) | |
| Succumbed | 47 (9.4) | 73 (14.6) | |
| PFI event, n (%) | 0.072 | ||
| Survived | 165 (30.8) | 144 (26.9) | |
| Succumbed | 102 (19.1) | 124 (23.2) | |
| Age, median (IQR) | 66 (60, 73) | 65 (58, 72) | 0.225 |
Anatomic neoplasm subdivision is whether the tumor is in the left or right lung. Anatomic neoplasm subdivision 2 is whether the tumor is central lung cancer or peripheral lung cancer. PPM1G, protein phosphatase, Mg2+/Mn2+ dependent 1G; PD, progressive disease; SD, stable disease; PR, partial response; CR, complete response; IQR, interquartile range; OS, overall survival; DSS, disease-specific survival; PFI, progress free interval (calculated as the length of time between the first treatment and the first recurrence).
Figure 3.

Boxplots evaluating PPM1G expression of patients with lung adenocarcinoma according to different clinical characteristics. (A) Pathologic stage, (B) N stage, (C) smoking status, (D) Number of pack years smoked, (E) OS event and (F) DSS event. PPM1G, protein phosphatase, Mg2+/Mn2+ dependent 1G; OS, overall survival; DSS, disease-specific survival.
High PPM1G expression is an independent prognostic factor for OS in LUAD
To determine the effect of PPM1G expression on OS, patients with LUAD, based on TCGA database, were divided into high and low PPM1G expression groups by the median. Kaplan-Meier survival analysis revealed that high PPM1G expression was associated with poor prognosis in patients with LUAD (HR=1.82; P<0.001; Fig. 4A). In addition, subgroup analysis showed that high PPM1G expression was significantly associated with poor prognosis in patients with T1 stage (HR=2.24; P<0.012; Fig. 4B), T2 stage (HR=1.74; P=0.005; Fig. 4C), N0 stage (HR=1.99; P=0.002; Fig. 4D), M0 stage (HR=1.64; P=0.005; Fig. 4E) and pathologic stage I (HR=1.72; P=0.027; Fig. 4F). Additionally, high PPM1G expression was associated with poor prognosis in patients of both sexes (female, HR=1.75; P=0.007; Fig. 4G and male, HR=1.82; P=0.006; Fig. 4H), in smokers (HR=1.74; P=0.001; Fig. 4I), number of pack years smoked <40 (HR=2.61; P=0.001; Fig. 4J), and in patients aged ≤65 years (HR=1.88; P=0.004; Fig. 4K) and >65 years (HR=1.77; P=0.006; Fig. 4L). In addition, the effect of PPM1G expression on the prognosis of patients with LUAD was verified using the GSE30219 GEO dataset. Kaplan-Meier survival analysis of this dataset demonstrated that patients with increased PPM1G expression had a shorter OS (Fig. 5A-D). Univariate Cox regression analysis of the OS-related clinical features of patients with LUAD in TCGA showed that T stage, N stage, M stage, pathologic stage, residual tumor and high PPM1G expression were notably associated with poor OS; while multivariate Cox regression analysis showed that only T stage was notably associated with poor OS (Table II). These data suggested that the high expression levels of PPM1G could be an independent prognostic factor for OS in patients with LUAD.
Figure 4.

Kaplan-Meier curve for overall survival in LUAD. (A) Kaplan-Meier curve for PPM1G in all tumor patients. Subgroup analysis for patients with (B) T1, (C) T2, (D) N0, (E) M0 and (F) pathologic stage I LUAD, and for (G) female patients, (H) male patients, (I) smokers, (J) smokers with <40 pack years, and patients aged (K) ≤65 and (L) >65 years. PPM1G, protein phosphatase, Mg2+/Mn2+ dependent 1G; LUAD, lung adenocarcinoma.
Figure 5.

Kaplan-Meier curve for overall survival in LUAD in the validation dataset GSE30219. (A) Kaplan-Meier curve for PPM1G in all tumor patients. Subgroup analysis for patients with (B) T1/T2, (C) N0 and (D) M0 LUAD. PPM1G, protein phosphatase, Mg2+/Mn2+ dependent 1G; LUAD, lung adenocarcinoma.
Table II.
Univariate and multivariate Cox regression analyses of the clinical characteristics associated with OS in lung adenocarcinoma in The Cancer Genome Atlas.
| Univariate analysis | Multivariate analysis | ||||
|---|---|---|---|---|---|
|
|
|
||||
| Characteristic | Total, n | Hazard ratio (95% CI) | P-value | Hazard ratio (95% CI) | P-value |
| T stage | 523 | ||||
| T1&T2 | 457 | Reference | |||
| T3&T4 | 66 | 2.317 (1.591–3.375) | <0.001a | 2.111 (1.156–3.853) | 0.015a |
| N stage | 510 | ||||
| N0 | 343 | Reference | |||
| N1 | 94 | 2.382 (1.695–3.346) | <0.001a | 1.863 (0.879–3.949) | 0.104 |
| N2&N3 | 73 | 2.968 (2.040–4.318) | <0.001a | 2.174 (0.809–5.845) | 0.124 |
| M stage | 377 | ||||
| M0 | 352 | Reference | |||
| M1 | 25 | 2.136 (1.248–3.653) | 0.006a | 1.219 (0.462–3.217) | 0.689 |
| Pathologic stage | 518 | ||||
| Stage I | 290 | Reference | |||
| Stage II | 121 | 2.418 (1.691–3.457) | <0.001a | 0.929 (0.427–2.020) | 0.852 |
| Stage III | 81 | 3.544 (2.437–5.154) | <0.001a | 1.251 (0.432–3.621) | 0.679 |
| Stage IV | 26 | 3.790 (2.193–6.548) | <0.001a | ||
| Sex | 526 | ||||
| Female | 280 | Reference | |||
| Male | 246 | 1.070 (0.803–1.426) | 0.642 | ||
| Age | 516 | ||||
| ≤65 years | 255 | Reference | |||
| >65 years | 261 | 1.223 (0.916–1.635) | 0.172 | ||
| Residual tumor | 363 | ||||
| R0 | 347 | Reference | |||
| R1 | 13 | 3.255 (1.694–6.251) | <0.001a | 2.208 (0.943–5.168) | 0.068 |
| R2 | 3 | 11.085 (3.443–35.689) | <0.001a | 3.324 (0.658–16.796) | 0.146 |
| Anatomic neoplasm subdivision | 512 | ||||
| Left | 200 | Reference | |||
| Right | 312 | 1.037 (0.770–1.397) | 0.810 | ||
| Anatomic neoplasm subdivision 2 | 182 | ||||
| Central lung | 62 | Reference | |||
| Peripheral lung | 120 | 0.913 (0.570–1.463) | 0.706 | ||
| Number of pack years smoked | 363 | ||||
| <40 | 183 | Reference | |||
| ≥40 | 180 | 1.073 (0.753–1.528) | 0.697 | ||
| Smoker | 512 | ||||
| No | 72 | Reference | |||
| Yes | 440 | 0.894 (0.592–1.348) | 0.591 | ||
| PPM1G | 526 | ||||
| Low | 262 | Reference | |||
| High | 264 | 1.821 (1.357–2.442) | <0.001a | 1.183 (0.794–1.762) | 0.409 |
P<0.001. OS, overall survival.
Diagnostic value of PPM1G in LUAD
ROCs and nomograms were plotted to evaluate the diagnostic value of PPM1G in LUAD. The diagnostic ROC curve showed that the area under the curve (AUC) value was 0.929 (Fig. 6A), thus indicating that PPM1G could exert an accurate diagnostic effect. Time-dependent ROC curves of PPM1G were used to predict the 1-, 3- and 5-year survival rates. All AUC values were >0.5 (Fig. 6B). To construct a nomogram, the expression levels of PPM1G were combined with several clinical variables, including T stage, N stage, M stage and age, to predict the survival probability of patients at 1, 3 and 5 years (Fig. 6C). In addition, the calibration and accuracy verification of the nomogram were evaluated via calibration curve (Fig. 6D).
Figure 6.

ROC curve analysis and nomogram model of PPM1G. (A) ROC curve analysis of the ability of PPM1G to distinguish tumor from normal tissue. (B) Time-dependent survival ROC curve analysis to predict 1-, 3- and 5-year survival rates. (C) Nomogram model, combining clinical variables and PPM1G level to predict 1-, 3- and 5-year survival probability. (D) Nomogram calibration analysis curve. ROC, receiver operating characteristic; PPM1G, protein phosphatase, Mg2+/Mn2+ dependent 1G; AUC, area under the curve.
PPM1G is closely associated with regulation of the cell cycle in LUAD
The Link Interpreter module of the LinkedOmics website was applied to detect the co-expression pattern of PPM1G in TCGA-LUAD to verify the biological function of PPM1G in LUAD. A total of 25 genes with the highest Spearman correlation coefficient and negative correlation were selected. Subsequently, a single gene co-expression heatmap was constructed (Fig. 7A). GO function and KEGG pathway enrichment analyses of the top 600 PPM1G-related genes were performed using DAVID Functional Annotation Bioinformatics Microarray analysis. The results showed that the 600 genes were mainly enriched in the GO terms ‘cell cycle DNA replication’ and ‘DNA replication’ (Fig. 7B). Furthermore, all genes that were significantly associated with survival in LUAD were screened. The top 100 upregulated genes were selected. The top 600 genes significantly associated with PPM1G expression with the 100 survival-associated genes were entered into a Venn diagram and the 29 common genes associated with PPM1G expression and survival in LUAD were obtained (Fig. 8A). These 29 genes were subjected to GO enrichment and KEGG pathway analyses, and the results showed that the differentially expressed genes were significantly enriched in the GO term ‘cell cycle’ (Fig. 8B). A PPI network was then constructed to analyze the interactions between the 29 proteins. The network diagram revealed that these proteins were strongly associated with each other and all genes were closely associated with the cell cycle (Fig. 9A). The gene co-expression correlation heatmap of the 29 proteins also demonstrated that the majority of proteins were positively associated with each other (Fig. 9B). These results indicated that these PPM1G-associated cell cycle-related genes were closely associated and could be used as polygenic biomarkers to predict the survival of patients with LUAD.
Figure 7.

PPM1G functional clustering and interaction network analysis of PPM1G-related genes. (A) Heatmap showing the 25 genes with positive correlation and 25 genes with negative correlation with PPM1G in LUAD. (B) Gene Ontology term and Kyoto Encyclopedia of Genes and Genomes pathway analyses of PPM1G-related genes in LUAD. PPM1G, protein phosphatase, Mg2+/Mn2+ dependent 1G; LUAD, lung adenocarcinoma.
Figure 8.
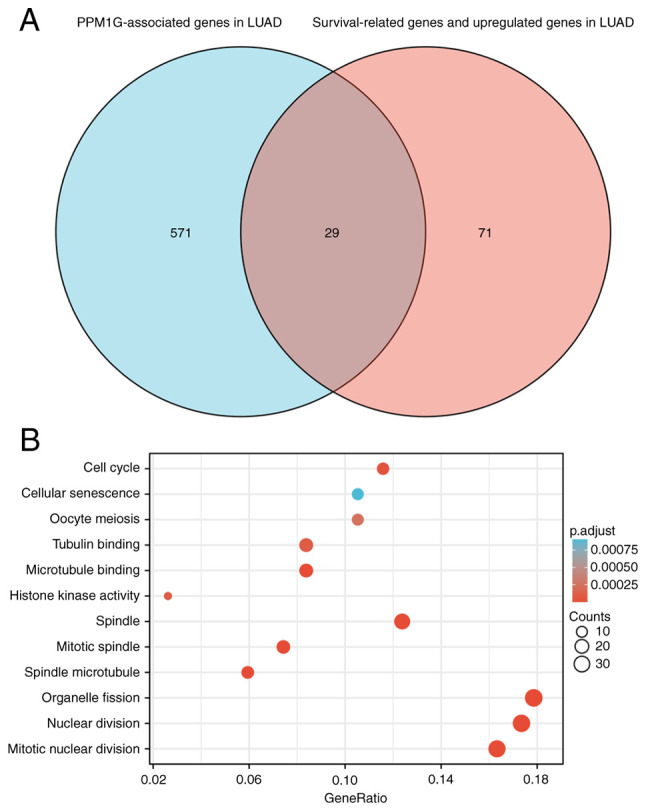
PPM1G functional clustering and interaction network analysis of PPM1G-related genes. (A) Venn diagram of the PPM1G-related genes, and the survival-related and upregulated genes in LUAD. (B) Gene Ontology term and Kyoto Encyclopedia of Genes and Genomes pathway analyses of the PPM1G-related genes and LUAD survival-related genes in LUAD. PPM1G, protein phosphatase, Mg2+/Mn2+ dependent 1G; LUAD, lung adenocarcinoma.
Figure 9.

PPM1G-related gene interaction network and gene co-expression matrix. (A) Protein phosphatase, Mg2+/Mn2+ dependent 1G-related gene interaction enrichment network. (B) Protein phosphatase, Mg2+/Mn2+ dependent 1G-related gene co-expression matrix in LUAD. PPM1G, protein phosphatase, Mg2+/Mn2+ dependent 1G. LUAD, lung adenocarcinoma.
Correlation analysis between PPM1G and cell cycle-related regulatory genes in LUAD
The aforementioned analysis showed that PPM1G was closely associated with regulation of the cell cycle in LUAD. Therefore, the association between PPM1G and cell cycle-related genes in LUAD was subsequently investigated. The results showed that the expression levels of the cell cycle-related genes LMNB2 (ρ=0.750; P<0.001; Fig. 10A), CCT7 (ρ=0.734; P<0.001; Fig. 10B), PLK1 (ρ=0.699; P<0.001; Fig. 10C), PRC1 (ρ=0.678; P<0.001; Fig. 10D), RRM2 (ρ=0.692; P<0.001; Fig. 10E), TK1 (ρ=0.699; P<0.001; Fig. 10F), KIF20A (ρ=0.657; P<0.001; Fig. 10G), GTSE1 (ρ=0.670; P<0.001; Fig. 10H), KIF23 (ρ=0.674; P<0.001; Fig. 10I), MCM5 (ρ=0.638; P<0.001; Fig. 10J), HJURP (ρ=0.636, P<0.001; Fig. 10K), ANLN (ρ=0.636; P<0.001; Fig. 10L), NUSAP1 (ρ=0.630; P<0.001; Fig. 10M), CDC25C (ρ=0.624; P<0.001; Fig. 10N) and SKA3 (ρ=0.625; P<0.001; Fig. 10O) were positively associated with those of PPM1G. The aforementioned findings indicated that the expression of PPM1G was closely associated with that of cell cycle-related genes in LUAD.
Figure 10.

Correlation of cell cycle regulatory genes with PPM1G in lung adenocarcinoma. (A) LMNB2, (B) CCT7, (C) PLK1, (D) PRC1, (E) RRM2, (F) TK1, (G) KIF20A, (H) GTSE1, (I) KIF23, (J) MCM5, (K) HJURP, (L) ANLN, (M) NUSAP1, (N) CDC25C and (O) SKA3. PPM1G, protein phosphatase, Mg2+/Mn2+ dependent 1G.
Correlation analysis between PPM1G expression and immune cells
Subsequently, the association between PPM1G expression and tumor immune response was explored. The lollipop chart in Fig. 11 illustrates the association between PPM1G expression and immune cell infiltration in LUAD. The results of the assessment of the differential distribution of immune cells in patients with high and low PPM1G expression levels showed that the numbers of T helper (Th)2 and γδ-T cells in patients with LUAD and low PPM1G expression were significantly lower compared with those in patients with high PPM1G expression. Additionally, the numbers of T follicular helper (TFH) cells, central memory T (Tcm) cells, Th cells, T cells, plasmacytoid dendritic cells (pDCs), mast cells, macrophages, immature DCs, eosinophils, DCs, cytotoxic cells, CD8 T cells and B cells were notably lower in LUAD patients with high PPM1G expression compared with those in patients with low PPM1G expression (Fig. 12A-O). Furthermore, the correlation between the expression levels of PPM1G and immune cell infiltration in LUAD was evaluated. The results demonstrated that the expression levels of PPM1G were positively correlated with the infiltration degree of Th2 cells (ρ=0.462; P<0.001; Fig. 13A), natural killer CD56dim cells (ρ=0.152; P<0.001; Fig. 13B) and γδ-T cells (ρ=0.151; P<0.001; Fig. 13C). By contrast, the expression levels of PPM1G were negatively correlated with the infiltration degree of B cells (ρ=−0.273; P<0.001; Fig. 13D), mast cells (ρ=−0.316; P<0.001; Fig. 13E), pDCs (ρ=−0.171; P<0.001; Fig. 13F), Th cells (ρ=−0.127; P=0.003; Fig. 13G), macrophages (ρ=−0.159; P<0.001; Fig. 13H), T cells (ρ=−0.224; P<0.001; Fig. 13I), CD8 T cells (ρ=−0.158, P<0.001; Fig. 13J), Tcm cells (ρ=−0.171; P<0.001; Fig. 13K), effector memory T cells (ρ=−0.110, P<0.001; Fig. 13L), TFH cells (ρ=−0.183; P<0.001; Fig. 13M) and Th1 cells (ρ=−0.103; P=0.018; Fig. 13N). Chemokines and chemokine receptors play a key role in the infiltration of immune cells into the tumor. Therefore, the association between PPM1G expression and chemokines/chemokine receptors in LUAD was analyzed using TISIDB. The heatmap revealed that there was a clear association between the expression of several chemokines and PPM1G expression in LUAD (Fig. 14A). Therefore, the correlation between the expression of PPM1G and that of chemokines in LUAD was further analyzed. The results showed that the expression of PPM1G was negatively correlated with CCL13 (ρ=−0.259; P=2.62×10⁻⁹; Fig. 14B), CCL14 (ρ=−0.442; P<2.2×10⁻¹⁶; Fig. 14C), CCL15 (ρ=−0.191; P=1.22×10⁻⁵; Fig. 14D), CCL19 (ρ=−0.34; P=2.47×10⁻¹⁵; Fig. 14E), CXCL2 (ρ=−0.119; P=0.00666; Fig. 14F), CCL22 (ρ=−0.191; P=1.33×10⁻⁵; Fig. 14G), CCL23 (ρ=−0.294; P=1.11×10⁻¹¹; Fig. 14H), CXCL14 (ρ=−0.242; P=2.95×10⁻⁸; Fig. 14I), CXCL16 (ρ=−0.285; P=4.64×10⁻¹¹; Fig. 14J), CCL17 (ρ=−0.302; P=2.8×10⁻¹²; Fig. 14K), CXCL17 (ρ=−0.3; P=4.22×10⁻¹²; Fig. 14L), CXCL13 (ρ=−0.148; P=0.000742; Fig. 14M), CXCL12 (ρ=−0.338; P=3.44×10⁻¹⁵; Fig. 14N) and CX3CL1 (ρ=−0.205; P=2.8×10⁻⁶; Fig. 14O). The heatmap of the association between PPM1G expression and the expression of multiple chemokine receptors in LUAD revealed that there was also a significant association between the two factors (Fig. 15A). More specifically, the results demonstrated that the expression of PPM1G was negatively correlated with that of CCR1 (ρ=−0.185; P=2.38×10⁻⁵; Fig. 15B), CCR2 (ρ=−0.38; P<2.2×10⁻¹⁶; Fig. 15C), CCR3 (ρ=−0.093; P=0.0349; Fig. 15D), CCR5 (ρ=−0.203; P=3.36×10⁻⁶; Fig. 15E), CCR4 (ρ=−0.425; P<2.2×10⁻¹⁶; Fig. 15F), CCR6 (ρ=−0.521; P<2.2×10⁻¹⁶; Fig. 15G), CCR7 (ρ=−0.341; P=1.91×10⁻¹⁵; Fig. 15H), CCR8 (ρ=−0.215; P=8.51×10⁻⁷; Fig. 15I), CX3CR1 (ρ=−0.457; P<2.2×10⁻¹⁶; Fig. 15J), CXCR1 (ρ=−0.199; P=5.08×10⁻⁶; Fig. 15K), CXCR2 (ρ=−0.282; P=8.66×10⁻¹¹; Fig. 15L), CXCR4 (ρ=−0.256; P=3.98×10⁻⁹; Fig. 15M), CXCR5 (ρ=−0.255; P=4.46×10⁻⁹; Fig. 15N) and CXCR6 (ρ=−0.187; P=1.99×10⁻⁵; Fig. 15O). These results indicated that the expression of PPM1G was negatively associated with that of chemokines/chemokine receptors in LUAD.
Figure 11.

Correlation between PPM1G expression and immune infiltration in LUAD. **P<0.01 and ***P<0.001. PPM1G, protein phosphatase, Mg2+/Mn2+ dependent 1G; LUAD, lung adenocarcinoma; Th, T helper; Tgd, γδ-T; NK, natural killer; DC, dendritic cell; Tem, effector memory T; pDC, plasmacytoid DC; Tcm, central memory T; TFH, T follicular helper; iDC, immature DC; aDC, activated DC.
Figure 12.

Differential distribution of immune cells in patients with high and low PPM1G expression. (A) Th2, (B) TFH, (C) Tgd, (D) Tcm, (E) T helper and (F) T cells, (G) pDCs, (H) mast cells, (I) macrophages, (J) iDCs, (K) eosinophils, (L) DCs, (M) cytotoxic cells, (N) CD8 T cells and (O) B cells. PPM1G, protein phosphatase, Mg2+/Mn2+ dependent 1G; Th, T helper; Tgd, γδ-T; DC, dendritic cell; Tem, effector memory T; pDC, plasmacytoid DC; Tcm, central memory T; TFH, T follicular helper; iDC, immature DC.
Figure 13.

Correlation between PPM1G expression and immune infiltration in LUAD. (A) Th2, (B) natural killer CD56dim, (C) Tgd, (D) B and (E) mast cells, (F) pDCs, (G) Th cells, (H) macrophages, (I) T, (J) CD8 T, (K) Tcm and (L) Tem cells, (M) TFH and (N) Th1 cells. PPM1G, protein phosphatase, Mg2+/Mn2+ dependent 1G; LUAD, lung adenocarcinoma; Th, T helper; Tgd, γδ-T; Tem, effector memory T; pDC, plasmacytoid dendritic cell; Tcm, central memory T; TFH, T follicular helper.
Figure 14.

Correlation analysis between PPM1G expression and chemokines. (A) Heatmap analysis of the correlation between PPM1G and chemokines in tumors. PPM1G expression in lung adenocarcinoma was negatively correlated with (B) CCL13, (C) CCL14, (D) CCL15, (E) CCL19, (F) CXCL2, (G) CCL22, (H) CCL23, (I) CXCL14, (J) CXCL16, (K) CCL17, (L) CXCL17, (M) CXCL13, (N) CXCL12 and (O) CX3CL1. PPM1G, protein phosphatase, Mg2+/Mn2+ dependent 1G.
Figure 15.

Correlation analysis between PPM1G expression and chemokine receptors. (A) Heatmap analysis of the correlation between PPM1G and chemokine receptors in tumors. PPM1G expression in lung adenocarcinoma was negatively correlated with (B) CCR1, (C) CCR2, (D) CCR3, (E) CCR5, (F) CCR4, (G) CCR6, (H) CCR7, (I) CCR8, (J) CX3CR1, (K) CXCR1, (L) CXCR2, (M) CXCR4, (N) CXCR5 and (O) CXCR6. PPM1G, protein phosphatase, Mg2+/Mn2+ dependent 1G.
PPM1G expression is associated with immune checkpoints in LUAD
Programmed death ligand 1 (PD-L1; gene, CD274), cytotoxic T lymphocyte antigen-4 (CTLA-4) and programmed cell death 1 (PD-1; gene, PDCD1) are significant immune checkpoints involved in tumor immune escape (36). Considering the potential carcinogenic effect of PPM1G on LUAD, the association between PPM1G and PD-L1, CTLA-4 and PD-1 was further investigated by SSGSEA. The results showed that PPM1G was positively correlated with PD-L1 (ρ=0.149; P<0.001; Fig. 16A), CTLA-4 (ρ=0.354; P<0.001; Fig. 16B) and PD-1 (ρ=0.384; P<0.001; Fig. 16C) in LUAD.
Figure 16.

Correlation between PPM1G expression and immune checkpoints in lung adenocarcinoma. (A) CD274, (B) CTLA-4, (C) PDCD1. PPM1G, protein phosphatase, Mg2+/Mn2+ dependent 1G; CTLA-4, cytotoxic T lymphocyte antigen-4.
Discussion
With the recent development of targeted therapy and immunotherapy, it is necessary to identify new biomarkers of lung cancer and explore novel treatments.
PPM1G, a significant member of the PPM family, is an Mg2+/Mn2+-dependent serine/threonine phosphatase (37). It has been reported that PPM1G is involved in the dephosphorylation of several histones and in different cellular biological processes, including cell cycle regulation and immune response (10). Previous studies have also suggested that PPM1G may be involved in pre-mRNA splicing (38), DNA damage response and tumorigenesis (39). Previous studies have focused on the association between PPM1G and liver cancer, and have concluded that the PPM1G gene may be a potential immunotherapy target and prognostic marker of liver cancer (17,40). However, to the best of our knowledge, there are few reports on the role of PPM1G in LUAD (41). No studies, to the best of our knowledge, have reported mutations or single nucleotide polymorphisms of PPM1G in LUAD. Therefore, to investigate the association between PPM1G expression and immune cell infiltration, cell cycle and prognosis in LUAD, bioinformatics analysis was performed using several online databases.
In the present study, the expression levels and prognostic potential of PPM1G in LUAD were explored. By performing a pan-cancer analysis of the expression of PPM1G using TCGA database, increased PPM1G expression levels were detected in cancer tissues compared with those in noncancer tissues, and PPM1G was revealed to be significantly upregulated in LUAD. Its increased expression was associated with poor OS and different clinicopathological features of patients with LUAD, including pathologic stage, N stage, smoking status, number of pack years smoked and DSS event. The Kaplan-Meier survival analysis, and univariate and multivariate Cox regression analyses showed that high expression of PPM1G was an independent prognostic factor for the OS of patients with LUAD, and TCGA database and the GEO datasets also suggested that patients with increased PPM1G expression had poor OS. In addition, the diagnostic significance of PPM1G in LUAD was evaluated. To analyze the diagnostic value of PPM1G expression in LUAD, ROC curve and nomogram analyses were performed on the PPM1G gene expression data of TCGA database. The AUC was 0.929, suggesting a high diagnostic value, indicating that it could be an independent diagnostic marker for LUAD progression.
At present, there are few studies on the substrate of PPM1G. PPM1G has been shown to bind to the Tat protein of the human immunodeficiency virus as well as to NF-κB (9). In addition, PPM1G can bind to the RNA of small nuclear ribonucleoproteins (42). PPM1G forms a PPP-type phosphatase holoenzyme with B56δ that maintains adherens junction integrity by acting directly on substrate α-catenin (43). This indicates that PPM1G may affect cell migration. In LUAD, it has been shown that PPM1G is closely related to the regulation of the cell cycle by inhibiting p38 activation via dephosphorylation of MEK6 (41). Lin et al (10) suggested that PPM1G could affect the prognosis of patients with hepatocellular carcinoma via regulating the cell cycle, based on the results of data analysis. Cell cycle disorders are commonly characterized by the uncontrolled growth, proliferation, differentiation and apoptosis of tumor cells (44). In the present study, KEGG pathway enrichment analysis and GO functional annotation of the PPM1G-related genes showed a positive relationship with cell cycle-related genes, including LMNB2, CCT7, PLK1, PRC1 and RRM2. However, no definite PPM1G substrate has been assessed in the study of other tumors; therefore, verification of the direct substrate of PPM1G, especially cell cycle-related proteins, should be an aim in future work.
The tumor microenvironment (TME) includes immune cells, extracellular matrix components, mesenchymal cells and inflammatory mediators, which are involved in tumor development, metastasis and recurrence (45). The type and aggregation of immune cells serve a key role in tumor development (46). Previous studies on lung cancer have demonstrated that the immunological analysis results regarding immune cell type and density are more valuable in predicting clinical outcomes than TNM staging (47–50). It has been reported that CD4+ T-cell and CD8+ T-cell infiltration is enhanced in NSCLC, and that these two immune cell types are associated with prolonged patient survival (46,51). CTLA-4 and PD-1/PD-L1 inhibitors are common immune checkpoint inhibitors that can markedly prolong the survival of patients with cancer. A previous study showed that the number of CD4+ T cells in the blood of patients with NSCLC was associated with the clinical effect of immune checkpoint inhibitors (52). Th1 and Th2 cells are common subsets of CD4 T cells. Frafjord et al (53) demonstrated that in NSCLC, the number of Th2 cells is increased in the tumor matrix and tumor epithelium. By contrast, Th1 cells are mainly enriched in distal normal lung tissue. In the present study, the association between PPM1G expression, the degree of immune cell infiltration and immune checkpoints in LUAD was evaluated. The results revealed that the increased expression levels of PPM1G were positively associated with the infiltration level of Th2 cells. By contrast, PPM1G expression was negatively associated with the infiltration level of T cells, CD8+ T cells and Th1 cells. These findings indicated that there are different degrees of correlation between the expression of PPM1G and immune cell infiltration.
Furthermore, the correlation between PPM1G expression and immune checkpoints in LUAD was analyzed. It has been reported that chemokines/chemokine receptors serve a significant role in directional immune cell migration (54–56). In the present study, TISIDB was used to analyze the association between PPM1G expression and chemokines/chemokine receptors in LUAD. The results revealed that PPM1G expression was negatively associated with that of multiple chemokines/chemokine receptors, and was positively associated with those of PD-1/PD-L1 and CTLA-4 in LUAD. This finding suggested that PPM1G upregulation could be associated with the occurrence and progression of LUAD and may have a critical role in inhibiting immune cell migration to TME.
In conclusion, the bioinformatics analysis was used to extract data from a variety of online databases and strict statistical methods were used to analyze and verify the results, which indicated that PPM1G may have prognostic potential and diagnostic value in LUAD. It was further inferred that PPM1G has the potential as a novel prognostic biomarker and therapeutic target in patients with LUAD.
The present study filled the gap of the effect of PPM1G in LUAD, provided a certain research basis for further verifying the prognostic and immunological potential of PPM1G in lung adenocarcinoma through in vivo or in vitro studies, and provided ideas for exploring novel targeted therapy and immunotherapy to treat lung cancer.
Acknowledgements
Not applicable.
Funding Statement
The present study was supported by the Shandong Natural Science Fund of Shandong Province (grant no. ZR2020MH080), The Projects of Medical and Health Technology Development Program in Shandong Province (grant no. 2019WS310), the Clinical Research Fund of Shandong Medical Association (grant no. YXH2022ZX033), and the Shandong Province Traditional Chinese Medicine Science and Technology Project (grant no. M-2022234).
Availability of data and materials
The datasets used and/or analyzed during the current study available from the corresponding author on reasonable request.
Authors' contributions
RY performed the bioinformatics analysis, wrote and revised the manuscript. LQ performed analysis and wrote the manuscript. ZW, JT, HG, XW and DY analyzed the data. PD and MD performed the experiments and drafted and edited the manuscript. RY and MD confirm the authenticity of all the raw data. All authors read and approved the final manuscript.
Ethics approval and consent to participate
The current study was approved by the Scientific Research Ethics Committee of Yantai Affiliated Hospital of Binzhou Medical University (Yantai, China; protocol no. 20220215001). The patients provided written informed consent to participate in this study.
Patient consent for publication
Not applicable.
Competing interests
The authors declare that they have no competing interests.
References
- 1.Wang X, Chen X, Liu H. Expression and bioinformatics-based functional analysis of UAP1 in lung adenocarcinoma. Cancer Manag Res. 2020;12:12111–12121. doi: 10.2147/CMAR.S282238. [DOI] [PMC free article] [PubMed] [Google Scholar]
- 2.Bray F, Ferlay J, Soerjomataram I, Siegel RL, Torre LA, Jemal A. Global cancer statistics 2018: GLOBOCAN estimates of incidence and mortality worldwide for 36 cancers in 185 countries. CA Cancer J Clin. 2018;68:394–424. doi: 10.3322/caac.21492. [DOI] [PubMed] [Google Scholar]
- 3.Cho JH. Immunotherapy for non-small-cell lung cancer: Current status and future obstacles. Immune Netw. 2017;17:378–391. doi: 10.4110/in.2017.17.6.378. [DOI] [PMC free article] [PubMed] [Google Scholar]
- 4.O'Brien TD, Jia P, Caporaso NE, Landi MT, Zhao Z. Weak sharing of genetic association signals in three lung cancer subtypes: Evidence at the SNP, gene, regulation, and pathway levels. Genome Med. 2018;10:16. doi: 10.1186/s13073-018-0522-9. [DOI] [PMC free article] [PubMed] [Google Scholar]
- 5.Friedlaender A, Banna G, Malapelle U, Pisapia P, Addeo A. Next generation sequencing and genetic alterations in squamous cell lung carcinoma: Where are we today? Front Oncol. 2019;9:166. doi: 10.3389/fonc.2019.00166. [DOI] [PMC free article] [PubMed] [Google Scholar]
- 6.AbdulJabbar K, Raza SEA, Rosenthal R, Jamal-Hanjani M, Veeriah S, Akarca A, Lund T, Moore DA, Salgado R, Al Bakir M, et al. Geospatial immune variability illuminates differential evolution of lung adenocarcinoma. Nat Med. 2020;26:1054–1062. doi: 10.1038/s41591-020-0900-x. [DOI] [PMC free article] [PubMed] [Google Scholar]
- 7.Herbst RS, Morgensztern D, Boshoff C. The biology and management of non-small cell lung cancer. Nature. 2018;553:446–454. doi: 10.1038/nature25183. [DOI] [PubMed] [Google Scholar]
- 8.Avancini A, Sartori G, Gkountakos A, Casali M, Trestini I, Tregnago D, Bria E, Jones LW, Milella M, Lanza M, Pilotto S. Physical activity and exercise in lung cancer care: Will promises be fulfilled? Oncologist. 2020;25:e555–e569. doi: 10.1634/theoncologist.2019-0463. [DOI] [PMC free article] [PubMed] [Google Scholar]
- 9.Kamada R, Kudoh F, Ito S, Tani I, Janairo JIB, Omichinski JG, Sakaguchi K. Metal-dependent Ser/Thr protein phosphatase PPM family: Evolution, structures, diseases and inhibitors. Pharmacol Ther. 2020;215:107622. doi: 10.1016/j.pharmthera.2020.107622. [DOI] [PubMed] [Google Scholar]
- 10.Lin YR, Yang WJ, Yang GW. Prognostic and immunological potential of PPM1G in hepatocellular carcinoma. Aging (Albany NY) 2021;13:12929–12954. doi: 10.18632/aging.202964. [DOI] [PMC free article] [PubMed] [Google Scholar]
- 11.Zhang M, Xu E, Zhang J, Chen X. PPM1D phosphatase, a target of p53 and RBM38 RNA-binding protein, inhibits p53 mRNA translation via dephosphorylation of RBM38. Oncogene. 2015;34:5900–5911. doi: 10.1038/onc.2015.31. [DOI] [PMC free article] [PubMed] [Google Scholar]
- 12.Peng TS, He YH, Nie T, Hu XD, Lu HY, Yi J, Shuai YF, Luo M. PPM1D is a prognostic marker and therapeutic target in colorectal cancer. Exp Ther Med. 2014;8:430–434. doi: 10.3892/etm.2014.1762. [DOI] [PMC free article] [PubMed] [Google Scholar]
- 13.Li K, Liu Y, Xu S, Wang J. PPM1D functions as oncogene and is associated with poor prognosis in esophageal squamous cell carcinoma. Pathol Oncol Res. 2020;26:387–395. doi: 10.1007/s12253-018-0518-1. [DOI] [PubMed] [Google Scholar]
- 14.Zhang C, Chen Y, Wang M, Chen X, Li Y, Song E, Liu X, Kim S, Peng H. PPM1D silencing by RNA interference inhibits the proliferation of lung cancer cells. World J Surg Oncol. 2014;12:258. doi: 10.1186/1477-7819-12-258. [DOI] [PMC free article] [PubMed] [Google Scholar]
- 15.Yang H, Gao XY, Li P, Jiang TS. PPM1D overexpression predicts poor prognosis in non-small cell lung cancer. Tumour Biol. 2015;36:2179–2184. doi: 10.1007/s13277-014-2828-6. [DOI] [PubMed] [Google Scholar]
- 16.Sun C, Wang G, Wrighton KH, Lin H, Songyang Z, Feng XH, Lin X. Regulation of p27Kip1 phosphorylation and G1 cell cycle progression by protein phosphatase PPM1G. Am J Cancer Res. 2016;6:2207–2220. [PMC free article] [PubMed] [Google Scholar]
- 17.Chen D, Zhao Z, Chen L, Li Q, Zou J, Liu S. PPM1G promotes the progression of hepatocellular carcinoma via phosphorylation regulation of alternative splicing protein SRSF3. Cell Death Dis. 2021;12:722. doi: 10.1038/s41419-021-04013-y. [DOI] [PMC free article] [PubMed] [Google Scholar]
- 18.Di C, Syafrizayanti, Zhang Q, Chen Y, Wang Y, Zhang X, Liu Y, Sun C, Zhang H, Hoheisel JD. Function, clinical application, and strategies of Pre-mRNA splicing in cancer. Cell Death Differ. 2019;26:1181–1194. doi: 10.1038/s41418-018-0231-3. [DOI] [PMC free article] [PubMed] [Google Scholar]
- 19.Vasaikar SV, Straub P, Wang J, Zhang B. LinkedOmics: Analyzing multi-omics data within and across 32 cancer types. Nucleic Acids Res. 2018;46(D1):D956–D963. doi: 10.1093/nar/gkx1090. [DOI] [PMC free article] [PubMed] [Google Scholar]
- 20.Pachter L. Models for transcript quantification from RNA-Seq. 2011 arXiv preprint arXiv:11043889. [Google Scholar]
- 21.Rousseaux S, Debernardi A, Jacquiau B, Vitte AL, Vesin A, Nagy-Mignotte H, Moro-Sibilot D, Brichon PY, Lantuejoul S, Hainaut P, et al. Ectopic activation of germline and placental genes identifies aggressive metastasis-prone lung cancers. Sci Transl Med. 2013;5:186ra166. doi: 10.1126/scitranslmed.3005723. [DOI] [PMC free article] [PubMed] [Google Scholar]
- 22.Moreno Leon L, Gautier M, Allan R, Ilié M, Nottet N, Pons N, Paquet A, Lebrigand K, Truchi M, Fassy J, et al. The nuclear hypoxia-regulated NLUCAT1 long non-coding RNA contributes to an aggressive phenotype in lung adenocarcinoma through regulation of oxidative stress. Oncogene. 2019;38:7146–7165. doi: 10.1038/s41388-019-0935-y. [DOI] [PubMed] [Google Scholar]
- 23.Landi MT, Dracheva T, Rotunno M, Figueroa JD, Liu H, Dasgupta A, Mann FE, Fukuoka J, Hames M, Bergen AW, et al. Gene expression signature of cigarette smoking and its role in lung adenocarcinoma development and survival. PLoS One. 2008;3:e1651. doi: 10.1371/journal.pone.0001651. [DOI] [PMC free article] [PubMed] [Google Scholar]
- 24.Li T, Fan J, Wang B, Traugh N, Chen Q, Liu JS, Li B, Liu XS. TIMER: A web server for comprehensive analysis of tumor-infiltrating immune cells. Cancer Res. 2017;77:e108–e110. doi: 10.1158/1538-7445.AM2017-108. [DOI] [PMC free article] [PubMed] [Google Scholar]
- 25.Stockhausen K. The declaration of Helsinki: Revising ethical research guidelines for the 21st century. Med J Aust. 2000;172:252–253. doi: 10.5694/j.1326-5377.2000.tb123936.x. [DOI] [PubMed] [Google Scholar]
- 26.Livak KJ, Schmittgen TD. Analysis of relative gene expression data using real-time quantitative PCR and the 2(−Delta Delta C(T)) method. Methods. 2001;25:402–408. doi: 10.1006/meth.2001.1262. [DOI] [PubMed] [Google Scholar]
- 27.Lánczky A, Nagy Á, Bottai G, Munkácsy G, Szabó A, Santarpia L, Győrffy B. miRpower: A web-tool to validate survival-associated miRNAs utilizing expression data from 2178 breast cancer patients. Breast Cancer Res. 2016;160:439–446. doi: 10.1007/s10549-016-4013-7. [DOI] [PubMed] [Google Scholar]
- 28.Subramanian A, Tamayo P, Mootha VK, Mukherjee S, Ebert BL, Gillette MA, Paulovich A, Pomeroy SL, Golub TR, Lander ES, Mesirov JP. Gene set enrichment analysis: A knowledge-based approach for interpreting genome-wide expression profiles. Proc Natl Acad Sci USA. 2005;102:15545–15550. doi: 10.1073/pnas.0506580102. [DOI] [PMC free article] [PubMed] [Google Scholar]
- 29.Kanehisa M, Furumichi M, Tanabe M, Sato Y, Morishima K. KEGG: New perspectives on genomes, pathways, diseases and drugs. Nucleic Acids Res. 2017;45(D1):D353–D361. doi: 10.1093/nar/gkw1092. [DOI] [PMC free article] [PubMed] [Google Scholar]
- 30.Wang J, Liu W, Li JC, Li M, Li B, Zhu R. Hepcidin downregulation correlates with disease aggressiveness and immune infiltration in liver cancers. Front Oncol. 2021;11:714756. doi: 10.3389/fonc.2021.714756. [DOI] [PMC free article] [PubMed] [Google Scholar]
- 31.Huang da W, Sherman BT, Lempicki RA. Systematic and integrative analysis of large gene lists using DAVID bioinformatics resources. Nat Protoc. 2009;4:44–57. doi: 10.1038/nprot.2008.211. [DOI] [PubMed] [Google Scholar]
- 32.Szklarczyk D, Franceschini A, Wyder S, Forslund K, Heller D, Huerta-Cepas J, Simonovic M, Roth A, Santos A, Tsafou KP, et al. STRING v10: Protein-protein interaction networks, integrated over the tree of life. Nucleic Acids Res. 2015;43((Database Issue)):D447–D452. doi: 10.1093/nar/gku1003. [DOI] [PMC free article] [PubMed] [Google Scholar]
- 33.Prates L, Lemes RB, Hünemeier T, Leonardi F. Population-based change-point detection for the identification of homozygosity islands. Bioinformatics. 2023;39:btad170. doi: 10.1093/bioinformatics/btad170. [DOI] [PMC free article] [PubMed] [Google Scholar]
- 34.Wickham H. New York, NY: Springer; 2009. ggplot2: Elegant graphics for data analysis. [DOI] [Google Scholar]
- 35.Yu G, Wang LG, Han Y, He QY. clusterProfiler: An R package for comparing biological themes among gene clusters. OMICS. 2012;16:284–287. doi: 10.1089/omi.2011.0118. [DOI] [PMC free article] [PubMed] [Google Scholar]
- 36.Darvin P, Toor SM, Sasidharan Nair V, Elkord E. Immune checkpoint inhibitors: Recent progress and potential biomarkers. Exp Mol Med. 2018;50:1–11. doi: 10.1038/s12276-018-0191-1. [DOI] [PMC free article] [PubMed] [Google Scholar]
- 37.Ge MX, Liu HT, Zhang N, Niu WX, Lu ZN, Bao YY, Huang R, Yu DK, Shao RG, He HW. Costunolide represses hepatic fibrosis through WW domain-containing protein 2-mediated Notch3 degradation. Br J Pharmacol. 2020;177:372–387. doi: 10.1111/bph.14873. [DOI] [PMC free article] [PubMed] [Google Scholar]
- 38.Pan C, Liu HD, Gong Z, Yu X, Hou XB, Xie DD, Zhu XB, Li HW, Tang JY, Xu YF, et al. Cadmium is a potent inhibitor of PPM phosphatases and targets the M1 binding site. Sci Rep. 2013;3:2333. doi: 10.1038/srep02333. [DOI] [PMC free article] [PubMed] [Google Scholar]
- 39.Chaudhary N, Maddika S. WWP2-WWP1 ubiquitin ligase complex coordinated by PPM1G maintains the balance between cellular p73 and ΔNp73 levels. Mol Cell Biol. 2014;34:3754–3764. doi: 10.1128/MCB.00101-14. [DOI] [PMC free article] [PubMed] [Google Scholar]
- 40.Xiao Q, Cheng Z, Kuang W, Wu H, Luo X, Wang R. Clinical value of PPM1G gene in survival prognosis and immune infiltration of hepatocellular carcinoma. Appl Bionics Biomech. 2022;2022:8926221. doi: 10.1155/2022/8926221. [DOI] [PMC free article] [PubMed] [Google Scholar] [Retracted]
- 41.Chen J, Li J, Sun H, Hu T, Wang Y, Kang G, Cao M, Li X. PPM1G promotes the progression of lung adenocarcinoma by inhibiting p38 activation via dephosphorylation of MEK6. Carcinogenesis. 2023;44:93–104. doi: 10.1093/carcin/bgac090. [DOI] [PubMed] [Google Scholar]
- 42.Gudipaty SA, McNamara RP, Morton EL, D'Orso I. PPM1G binds 7SK RNA and hexim1 To block P-TEFb assembly into the 7SK snRNP and sustain transcription elongation. Mol Cell Biol. 2015;35:3810–3828. doi: 10.1128/MCB.00226-15. [DOI] [PMC free article] [PubMed] [Google Scholar]
- 43.Kumar P, Tathe P, Chaudhary N, Maddika S. PPM1G forms a PPP-type phosphatase holoenzyme with B56δ that maintains adherens junction integrity. EMBO Rep. 2019;20:e46965. doi: 10.15252/embr.201846965. [DOI] [PMC free article] [PubMed] [Google Scholar]
- 44.Dyer DP, Medina-Ruiz L, Bartolini R, Schuette F, Hughes CE, Pallas K, Vidler F, Macleod MKL, Kelly CJ, Lee KM, et al. Chemokine receptor redundancy and specificity are context dependent. Immunity. 2019;50:378–389.e5. doi: 10.1016/j.immuni.2019.01.009. [DOI] [PMC free article] [PubMed] [Google Scholar]
- 45.Wang M, Chang M, Li C, Chen Q, Hou Z, Xing B, Lin J. Tumor-microenvironment-activated reactive oxygen species amplifier for enzymatic cascade cancer starvation/chemodynamic /immunotherapy. Adv Mater. 2022;34:e2106010. doi: 10.1002/adma.202106010. [DOI] [PubMed] [Google Scholar]
- 46.Stankovic B, Bjørhovde HAK, Skarshaug R, Aamodt H, Frafjord A, Müller E, Hammarström C, Beraki K, Bækkevold ES, Woldbæk PR, et al. Immune cell composition in human non-small cell lung cancer. Front Immunol. 2019;9:3101. doi: 10.3389/fimmu.2018.03101. [DOI] [PMC free article] [PubMed] [Google Scholar]
- 47.Welsh TJ, Green RH, Richardson D, Waller DA, O'Byrne KJ, Bradding P. Macrophage and mast-cell invasion of tumor cell islets confers a marked survival advantage in non-small-cell lung cancer. J Clin Oncol. 2005;23:8959–8967. doi: 10.1200/JCO.2005.01.4910. [DOI] [PubMed] [Google Scholar]
- 48.Kilic A, Landreneau RJ, Luketich JD, Pennathur A, Schuchert MJ. Density of tumor-infiltrating lymphocytes correlates with disease recurrence and survival in patients with large non-small-cell lung cancer tumors. J Surg Res. 2011;167:207–210. doi: 10.1016/j.jss.2009.08.029. [DOI] [PubMed] [Google Scholar]
- 49.Chen X, Wan J, Liu J, Xie W, Diao X, Xu J, Zhu B, Chen Z. Increased IL-17-producing cells correlate with poor survival and lymphangiogenesis in NSCLC patients. Lung Cancer. 2010;69:348–354. doi: 10.1016/j.lungcan.2009.11.013. [DOI] [PubMed] [Google Scholar]
- 50.Horne ZD, Jack R, Gray ZT, Siegfried JM, Wilson DO, Yousem SA, Nason KS, Landreneau RJ, Luketich JD, Schuchert MJ. Increased levels of tumor-infiltrating lymphocytes are associated with improved recurrence-free survival in stage 1A non-small-cell lung cancer. J Surg Res. 2011;171:1–5. doi: 10.1016/j.jss.2011.03.068. [DOI] [PubMed] [Google Scholar]
- 51.Al-Shibli KI, Donnem T, Al-Saad S, Persson M, Bremnes RM, Busund LT. Prognostic effect of epithelial and stromal lymphocyte infiltration in non-small cell lung cancer. Clin Cancer Res. 2008;14:5220–5227. doi: 10.1158/1078-0432.CCR-08-0133. [DOI] [PubMed] [Google Scholar]
- 52.Zuazo M, Arasanz H, Fernández-Hinojal G, García-Granda MJ, Gato M, Bocanegra A, Martínez M, Hernández B, Teijeira L, Morilla I, et al. Functional systemic CD4 immunity is required for clinical responses to PD-L1/PD-1 blockade therapy. EMBO Mol Med. 2019;11:e10293. doi: 10.15252/emmm.201910293. [DOI] [PMC free article] [PubMed] [Google Scholar]
- 53.Frafjord A, Buer L, Hammarström C, Aamodt H, Woldbæk PR, Brustugun OT, Helland Å, Øynebråten I, Corthay A. The immune landscape of human primary lung tumors Is Th2 skewed. Front Immunol. 2021;12:764596. doi: 10.3389/fimmu.2021.764596. [DOI] [PMC free article] [PubMed] [Google Scholar]
- 54.Phua SC, Chiba S, Suzuki M, Su E, Roberson EC, Pusapati GV, Schurmans S, Setou M, Rohatgi R, Reiter JF, et al. Dynamic remodeling of membrane composition drives cell cycle through primary cilia excision. Cell. 2019;178:261. doi: 10.1016/j.cell.2019.06.015. [DOI] [PubMed] [Google Scholar]
- 55.Kanemitsu N, Ebisuno Y, Tanaka T, Otani K, Hayasaka H, Kaisho T, Akira S, Katagiri K, Kinashi T, Fujita N, et al. CXCL13 is an arrest chemokine for B cells in high endothelial venules. Blood. 2005;106:2613–2618. doi: 10.1182/blood-2005-01-0133. [DOI] [PubMed] [Google Scholar]
- 56.Pallandre JR, Krzewski K, Bedel R, Ryffel B, Caignard A, Rohrlich PS, Pivot X, Tiberghien P, Zitvogel L, Strominger JL, Borg C. Dendritic cell and natural killer cell cross-talk: A pivotal role of CX3CL1 in NK cytoskeleton organization and activation. Blood. 2008;112:4420–4424. doi: 10.1182/blood-2007-12-126888. [DOI] [PMC free article] [PubMed] [Google Scholar]
Associated Data
This section collects any data citations, data availability statements, or supplementary materials included in this article.
Data Availability Statement
The datasets used and/or analyzed during the current study available from the corresponding author on reasonable request.