

Abstract
Background
Several observational studies reported on the association between particulate matter ≤2.5μm (PM2.5) and its absorbance with coronavirus (COVID-19), but none use Mendelian randomisation (MR). To strengthen the knowledge on causality, we examined the association of PM2.5 and its absorbance with COVID-19 risk using MR.
Methods
We selected genome-wide association study (GWAS) integration data from the UK Biobank and IEU Open GWAS Project for two-sample MR analysis. We used inverse variance weighted (IVW) and its multiple random effects and fixed effects alternatives to generally predict the association of PM2.5 and its absorbance with COVID-19, and six methods (MR Egger, weighted median, simple mode, weighted mode, maximum-likelihood and MR-PRESSO) as complementary analyses.
Results
MR results suggested that PM2.5 absorbance was associated with COVID-19 infection (odds ratio (OR) = 2.64; 95% confidence interval (CI) = 1.32-5.27, P = 0.006), hospitalisation (OR = 3.52; 95% CI = 1.05-11.75, P = 0.041) and severe respiratory symptoms (OR = 28.74; 95% CI = 4.00-206.32, P = 0.001) in IVW methods. We observed no association between PM2.5 and COVID-19.
Conclusions
We found a potential causal association of PM2.5 absorbance with COVID-19 infection, hospitalisation, and severe respiratory symptoms using MR analysis. Prevention and control of air pollution could help delay and halt the negative progression of COVID-19.
Coronavirus disease 2019 (COVID-19), a globally prevalent infectious disease caused by the severe acute respiratory syndrome coronavirus-2 (SARS-CoV-2) [1], leads to severe respiratory symptoms [2] and pathological lung changes like ground-glass opacities, signs of reticulation (including course fibrous bands, either with or without obvious parenchymal distortion), bronchiectasis, pulmonary fibrosis [3-5], and complications of multiple body systems [6,7], which is seriously harmful to human health.
Evidence suggests that exposure to air pollution is related to susceptibility to SARS-CoV-2 infection and COVID-19 severity [8]. Particulate matter ≤2.5μm (PM2.5) is a significant component of air pollutants and extremely detrimental to human health because of their small size [9], due to which it reduces lung immune response and antibacterial activity and increases viral load. Recent studies have shown that PM2.5 is possibly related to known COVID-19 symptoms and mortality [10-12]. PM2.5 increase of 1μg*m-3 can lead to at least an 11% increase in COVID-19 mortality in the USA [13]. However, evidence of these associations comes from observational studies rather than randomised controlled trials, preventing conclusion regarding association due to possible confounding.
As no studies have reported or discussed the use of the genetic instruments to predict the correlation between PM2.5 and COVID-19 risk, we hypothesised that there may exist a causal relationship between PM2.5 and COVID-19 risk. We conducted a two-sample Mendelian randomisation (MR) study to investigate the association between PM2.5, PM2.5 absorbance (a proxy of elemental carbon) [14], and COVID-19 risk.
METHODS
Study design
The MR design, which minimises the impact of environmental and other confounding factors, is based on genetic variation as instrument variables of exposure factors, and infers the causal relationship between exposure factors and outcome variables. This method's random allocation of alleles is similar to that of randomized controlled trials [15,16]. Additionally, it can increase the directivity of causality and diminish reverse causation, because the process cannot change the genetic variation of exposure factors.
Using genetic variants as instrumental variables, MR analysis consists of three essential assumptions (Figure 1). The first assumption is that the genetic variants proposed as instrumental variables should be robustly associated with exposure, the second indicates that the used genetic variants should not be associated with any confounder factors, and the third is that the selected genetic variants should affect the risk of the outcome only through risk factors.
Figure 1.
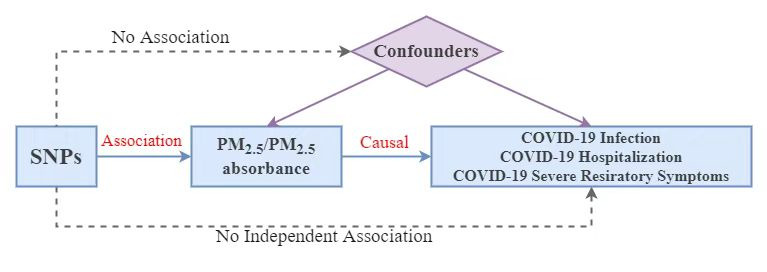
Study flowchart.
Screen of genetic instrument
We obtained single-nucleotide polymorphisms (SNPs) as instrumental variables associated with PM2.5 and PM2.5 absorbance from genome-wide association study (GWAS) data sets of IEU’s analysis of the UK Biobank, containing 423 796 individuals of European ancestry. These data sets can be searched in the IEU Open GWAS Project (GWAS ID: ukb-b-11312, and ukb-b-10817) [17]. To select the most powerful instrumental variables, we grouped the data set screen standards (P < 5 × 10⁻⁸, r2<0.01, and clump distance >10 000kb) [18] to eliminate the linkage disequilibrium for excluding potential horizontal pleiotropy and insignificant SNPs. We then selected eight independent SNPs associated with PM2.5 and five independent SNPs associated with PM2.5 absorbance.
COVID-19 data source
We obtained summary data on the association of COVID-19 cases from the European Bioinformatics Institute (EBI) database of complete GWAS summary data, searchable through the IEU Open GWAS Project [17]. We chose three data sets to investigate different COVID-19 situations, including COVID-19 (1 644 784 controls, 38 984 cases), recent COVID-19 hospitalisations (1 549 095 controls, 8316 cases) and confirmed COVID-19 cases with severe respiratory symptoms (1 383 241 controls, 5101 cases) [19]. We excluded all individuals who had withdrawn consent from either data source.
Statistical analysis
We performed the inverse variance weighted (IVW) method and its multiple random effects and fixed effects alternatives to estimate the association for genetically predicted PM2.5 and PM2.5 (analysed SNPs >3) [18,20]. Additionally, MR-Egger [21], weighted median [22], simple mode, weighted mode, maximum-likelihood [23], and MR-PRESSO [24] were used as complementary analysis to IVW.
We conducted the two-sample MR analysis between two groups of selected SNPs and the above three groups of COVID-19, respectively. The total odds ratio (OR) was the effect of PM2.5 and PM2.5 absorbance on COVID-19 separately. We interpreted a P-value <0.05 as statistically significant. Sensitivity analyses consisted of three parts and several methods. First, we assessed the heterogeneity using the value of Cochran’s Q test, with a P-value <0.05 suggesting that heterogeneity existed [25], but the IVW method results with the multiplicative random-effects model were still reliable in this situation. Second, we assessed horizontal pleiotropy [26] to avoid the second and third assumption, calculating it using MR-Egger intercept [21]. If the P-value of MR-Egger intercept was <0.05, we considered the effect of SNPs associated with exposure factors on outcomes as unreliable. Third, we performed the leave-one-out analysis, excluding each SNP one by one to determine whether a single SNP significantly changed the results [27]. Using the IVW method, we could calculate the “all” numerical value, and considered the results reliable if “all”>0. Additionally, the MR-PRESSO method can recognise outliers (SNPs) and provide a causal estimate after corresponding outliers are removed and the forest plot reflected the correlation of exposure factors with outcomes in each SNP. To avoid weak instrumental bias, we used the F statistic to measure the strength of instrument variables. If F was >10, we considered the outcome to be unaffected by weak instruments [28,29]. We performed all analyses in R (Version 4.1.2) using the “TwoSampleMR” [30] and “MR-PRESSO” packages.
RESULTS
Information of selected SNPs
The F statistic was greater than 10 for all the instrument variables associated with PM2.5 and PM2.5 absorbance in UK Biobank study (Table 1 and Table 2). The MR analysis estimated the risk of PM2.5 and PM2.5 absorbance on COVID-19 of status (Figure 2, Figure 3, and Figure S1, Table S1 and S2 in the Online Supplementary Document). Through MR-PRESSO, outlier SNPs have been eliminated and statistics have been corrected.
Table 1.
Selected genetic instruments of PM2.5
| SNP | Chr | Beta | SE | P-value | F | Related genes |
|---|---|---|---|---|---|---|
| rs114708313 |
6 |
0.025 |
0.004 |
4.20E-08 |
30.076 |
HCG27 |
| rs12203592 |
6 |
0.022 |
0.003 |
6.20E-17 |
69.918 |
IRF4 |
| rs1372504 |
5 |
0.012 |
0.002 |
3.10E-08 |
30.674 |
NONE |
| rs1537371 |
9 |
0.012 |
0.002 |
8.50E-09 |
33.149 |
CDKN2B-AS1 |
| rs6749467 |
2 |
-0.012 |
0.002 |
1.40E-08 |
32.228 |
FAM150B |
| rs72642437 |
18 |
0.113 |
0.019 |
3.10E-09 |
35.119 |
ZBTB7C |
| rs77205736 |
8 |
0.014 |
0.002 |
2.10E-08 |
31.399 |
MSRA |
| rs77255816 | 6 | 0.031 | 0.006 | 4.20E-08 | 30.041 | CDKAL1 |
SNPs – single-nucleotide polymorphisms, Chr – chromosome, SE – standard error, F – F statistics, HCG27 – HLA complex group 27, IRF4 – interferon regulatory factor 4, NONE – no related gene, CDKN2B-AS1 – CDKN2B antisense RNA 1, FAM150B – ALK and LTK ligand 2, ZBTB7C – zinc finger and BTB domain containing 7C, MSRA – methionine sulfoxide reductase A, CDKAL1 – CDK5 regulatory subunit associated protein 1 like 1
Table 2.
Selected genetic instruments of PM2.5 absorbance
| SNP | Chr | Beta | SE | P-value | F | Related genes |
|---|---|---|---|---|---|---|
| rs12203592 |
6 |
0.017 |
0.003 |
1.20E-10 |
41.539 |
IRF4 |
| rs4915350 |
1 |
0.046 |
0.008 |
5.70E-09 |
33.933 |
LINC02789 |
| rs59727727 |
6 |
0.018 |
0.003 |
2.80E-08 |
30.823 |
MICA |
| rs77205736 |
8 |
0.013 |
0.002 |
4.50E-08 |
29.911 |
MSRA |
| rs79475047 | 6 | 0.040 | 0.007 | 1.60E-09 | 36.427 | CDKAL1 |
SNPs – single-nucleotide polymorphisms, Chr – chromosome, SE – standard error, F – F statistics; IRF4 – interferon regulatory factor 4, LINC02789 – long intergenic non-protein coding RNA 2789, MICA – MHC class I polypeptide-related sequence A, MSRA – methionine sulfoxide reductase A, CDKAL1 – CDK5 regulatory subunit associated protein 1 like 1
Figure 2.
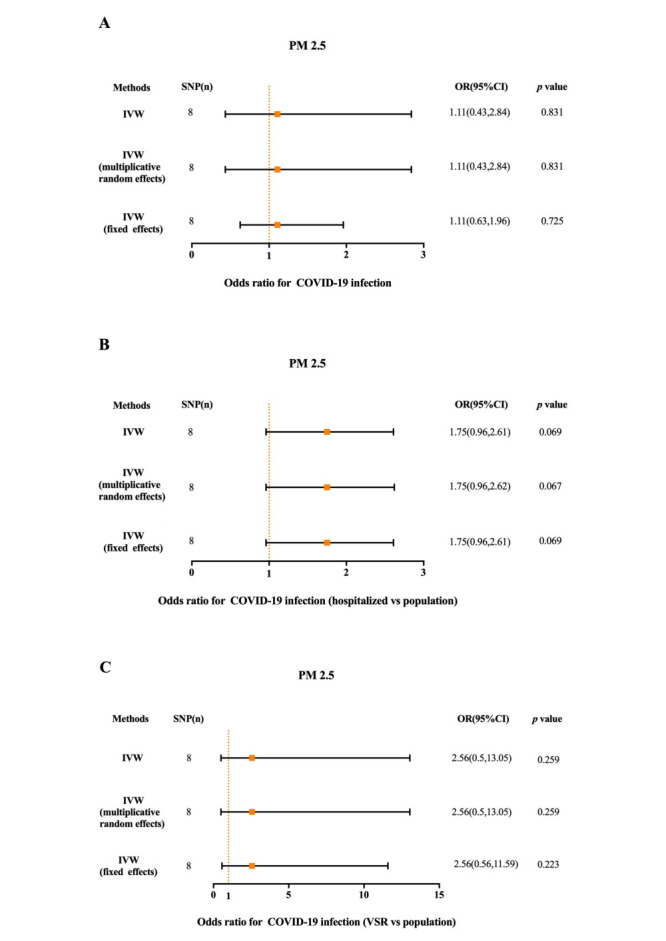
The MR results of PM2.5 on the status of COVID-19. Panel A. The association of PM2.5 with COVID-19 infection. Panel B. The association of PM2.5 with COVID-19 hospitalization. Panel C. The association of PM2.5 with COVID-19 with VSR. SNP – single-nucleotide polymorphisms, OR – odds ratio, IVW – the inverse variance weighted method, VSR – very severe respiratory symptoms.
Figure 3.
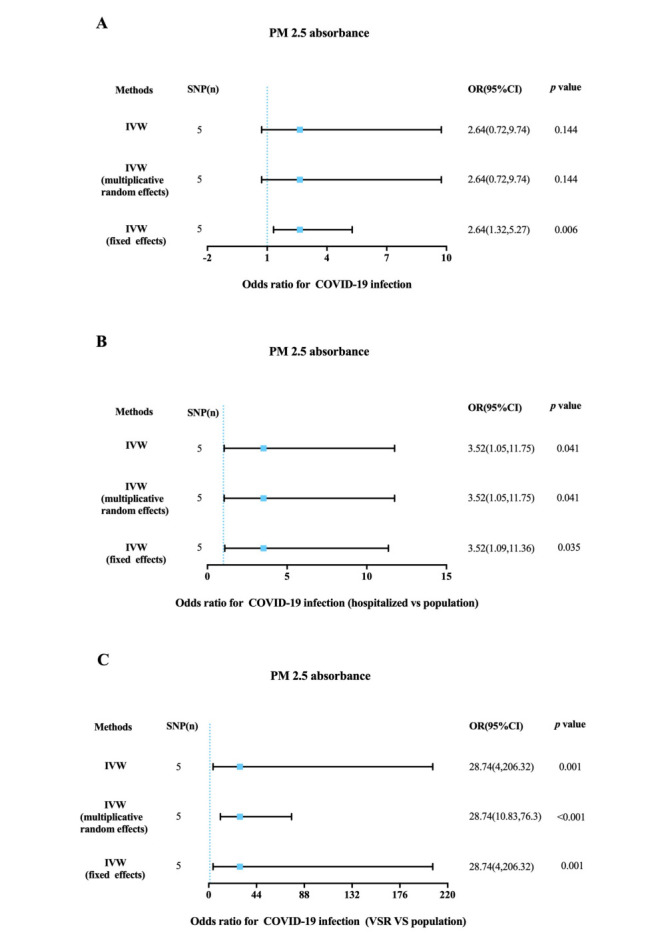
The MR results of PM2.5 absorbance on the status of COVID-19. Panel A. The association of PM2.5 absorbance with COVID-19 infection. Panel B. The association of PM2.5 absorbance with COVID-19 hospitalization. Panel C. The association of PM2.5 absorbance with COVID-19 with VSR. SNP – single-nucleotide polymorphisms, OR – odds ratio, IVW – the inverse variance weighted metho, VSR – very severe respiratory symptoms.
MR analysis of PM2.5 on the status of COVID-19
Using screened instrument variables, we found no association between PM2.5 and COVID-19 in MR. In the IVW MR analysis, genetically predicted PM2.5 was not significantly associated with COVID-19 infection (OR = 1.11; 95% confidence interval (CI) = 0.43-2.84, P = 0.831)), hospitalisation (OR = 1.75; 95% CI = 0.96-2.61, P = 0.068) and severe respiratory symptoms (OR = 2.56; 95% CI = 0.50-13.05, P = 0.259) vs population (Figure 2). In the sensitivity analysis (Table S3 in the Online Supplementary Document), we estimated that there were confounding factors and horizontal pleiotropy between instrumental variables of PM2.5 and COVID-19 infection (Cochran’s Q: P = 0.012, MR-Egger: P = 0.018), which indicated that the results of two-sample MR in this group were unreliable. Although there was not significance in the IVW method, instrument variables in weight median method (Figure S1 and Table S1 in the Online Supplementary Document) showed significant statistical differences between PM2.5 and COVID-19 hospitalisation (OR = 2.06; 95% CI = 1.04-2.84, P = 0.038).
MR analysis of PM2.5 absorbance on the status of COVID-19
In the IVW MR analysis, genetically predicted PM2.5 absorbance was associated with COVID-19 hospitalisation (OR = 3.52; 95% CI = 1.05-11.75, P = 0.041) and severe respiratory symptoms (OR = 28.74; 95% CI = 4.00-206.32, P = 0.001) (Figure 3). Although the association of PM2.5 absorbance with COVID-19 infection was not significantly statistical in the IVW method (OR = 2.64; 95% CI = 0.72-9.74, P = 0.144), there was differences in the methods of IVW (fixed effects) (OR = 2.64; 95% CI = 1.32-5.27, P = 0.006), weighted median (OR = 3.93; 95% CI = 1.28-12.08, P = 0.017) and maximum likelihood (OR = 2.85; 95% CI = 1.37-5.95, P = 0.005) (Table S2 in the Online Supplementary Document). In the sensitivity analysis (Table S3 in the Online Supplementary Document), the heterogeneity test detected heterogeneity between instrumental variables of PM2.5 absorbance and COVID-19 infection, but no horizontal pleiotropy was observed between genetic instruments and all outcomes, which did not affect the reliability of the results.
DISCUSSION
We obtained and filtered relevant genome-wide data from GWAS as genetic instruments to explore the causal association of PM2.5 and PM2.5 absorbance with infection, hospitalisation, or severe respiratory symptoms of COVID-19. We found that PM2.5 absorbance may be associated with increased risk of COVID-19 hospitalisation and severe respiratory symptoms. We also found PM2.5 absorbance was a risk factor for COVID-19 prevalence in weight median and maximum likelihood method. However, there was no significant relationship between exposure to PM2.5 and COVID-19 infection, hospitalisation, or severe respiratory symptoms.
PM2.5 absorbance, as a proxy and indicator of element carbon reflecting the concentration of carbonaceous components in PM2.5, may increase the risk of COVID-19 infection and deterioration by reducing the resistance to infection by negatively influencing lung structure and long-term function [31,32]. Consistently, PM2.5 absorbance mainly determined by exposure to environmental tobacco smoke indoors [33] was most likely associated with worse progression and adverse outcomes of COVID-19 [34]. Studies have shown that PM2.5 absorbance was significantly correlated with brain malignancy, incident hypertension and metabolic syndrome, which could exacerbate the severity of COVID-19 by affecting body physiologic function, including endothelial dysfunction and abnormal lipids metabolism [35-37].
Previous studies provided a pathogenetic explanation for this association. In a large cohort study, PM2.5 absorbance was found to be possibly associated with the increase of gamma glutamyl transferase (GGT) [38], which was linked to the occurrence of accumulating inflammation response and applications in COVID-19 [39,40]. Furthermore, a mice model study indicated that PM2.5 carbonaceous components such as elemental carbon drive an acute cardiovascular response by increasing blood pressure and heart rate, which may increase cardiovascular burden and potential risk for complications in COVID-19 patients [41]. The carbonaceous particles in PM2.5 may act as vehicles for strong acids like H2SO4 and cause damage to alveolar epithelium with inhalation of PM2.5, decreasing resistance to infection and pulmonary dysfunction [42]. Additionally, inhalation of high levels of spherical carbonaceous nanoparticles may induce inflammatory response and reactivates latent virus [43,44]. Through the IVW methods, we found PM2.5 absorbance was a likely risk factor of COVID-19 hospitalisation and severe respiratory symptoms. Meanwhile, PM2.5 absorbance may also increase the risk of COVID-19 infection estimated in the fixed effects IVW, weighted median and maximum likelihood method. Based on multiple statistical models, PM2.5 absorbance was identified to be possibly associated with increased risk of COVID-19 prevalence and negative progression.
Some studies have suggested PM2.5 absorbance was possibly a risk factor for COVID-19 cases, increasing patients’ symptoms and mortality [45-50]. A prospective cohort study showed that PM2.5 was significantly associated with COVID-19 hospitalisations and accesses to intensive care units [51], while another study reported that pollution stemming from PM2.5 caused poor prognosis of COVID-19 patients [52]. However, confounding factors are often present, and we also found no adequate evidence for the association of PM2.5 with COVID-19, even though the result of weight median method showed significant statistical differences between PM2.5 and COVID-19 with hospitalisation.
Components of PM2.5 may provide a reasonable explanation for the difference between the associations of PM2.5 and PM2.5 absorbance with COVID-19 risk. These components are intricate and mainly contain carbonaceous aerosol (including elemental carbon and organic carbon particles like polycyclic aromatic hydrocarbon), crustal components, trace elements, and heavy metals, which trigger various pathogenic mechanisms [53-55]. When analysing PM2.5 as a whole factor, we found no association with COVID-19 in the MR, but discovered that PM2.5 absorbance (as a proxy of elemental carbon that accounts for 50% proportion of PM2.5) was possibly correlated with COVID-19 risk, suggesting that carbonaceous components in PM2.5 may be independently associated with COVID-19 risk, but that other compositions probably weaken or inversely interfere in this association with PM2.5 [56]. Considering GWAS data of PM2.5 only originated from the European population, further genetic studies are necessary to confirm our findings in other races and circumstances.
Although this study has several strengths, it also has some limitations. First, GWAS data only came from European populations, and we could not assess the effect of age and sex on the observed association in summary level data. We thus lack genetic data for different regions, races, and environments, so we cannot generalise our findings to other populations or contexts. Second, we detected heterogeneity and horizontal pleiotropy, and had a limited number of SNPs in our analysis, making the correlation between PM2.5 and COVID-19 infection unreliable. The source of this heterogeneity might have been the different detection methods used for obtaining corresponding data. In some cases, we can still trust the results with heterogeneity in IVW methods [57], but may need to rescreen the tool variables or collect new GWAS data to exclude the impact of horizontal pleiotropy. Additionally, the accuracy of the statistical model may be affected by a high standard error due to the low number of genetic instruments, which indicates we need to constantly update relevant GWAS data. Third, since PM2.5 consists of multiple pollutants, and as there is no clear PM2.5 component in the summary level data, we cannot conduct further subgroup analyses to determine its effect on COVID-19. Finally, several, often more harmful variations of SARS-CoV-2 (eg, Omicron) emerged in different geographical areas since 2021 [58,59]. Our data was only collected in 2020 and do not contain data on the adverse effects of new viral strain on a person’s body or genes, meaning updated data could further improve the relevance of our study. Meanwhile, indicators of environmental pollution such as PM2.5 concentration, should be further analysed through linear or nonlinear MR studies to make our conclusion more reliable.
CONCLUSIONS
We found a potentially casual association of PM2.5 absorbance with COVID-19 infection, hospitalisation, and severe respiratory symptoms using MR analysis. Prevention and control of air pollution may help delay and block the negative progression of COVID-19.
Additional material
Acknowledgements
We appreciated all participants and the contributors of IEU Open GWAS Project and UK Biobank for their invaluable efforts and contribution. The data used in the present MR study were all obtained from publicly available databases. Consequently, there is no need to provide extra ethical approval and informed consent form.
Footnotes
Funding: This work was supported by the National Natural Science Foundation of China (No.8197021705 to Qilin Ma) and the Hunan Provincial Innovation Foundation for Postgraduate. (CX20220362 to Chenxi Liu).
Authorship contributions: Chenxi Liu was responsible for thinking framework, study design data analysis, manuscript writing and modification. Qilin Ma undertook the funding, design and control of the project. and Yubo Liu were responsible for review and modification of the paper. Jia Peng and Yi Peng revised manuscript pictures and typesetting. Yuanyuan Kuang and Yinzhuang Zhang put forward some suggestions for the manuscript. All authors read and approved the final manuscript.
Disclosure of interest: The authors completed the ICMJE Disclosure of Interest Form (available upon request from the corresponding author) and disclose no relevant interests.
REFERENCES
- 1.Ciotti M, Ciccozzi M, Pieri M, Bernardini S.The COVID-19 pandemic: viral variants and vaccine efficacy. Crit Rev Clin Lab Sci. 2022;59:66-75. 10.1080/10408363.2021.1979462 [DOI] [PubMed] [Google Scholar]
- 2.Lu R, Zhao X, Li J, Niu P, Yang B, Wu H, et al. Genomic characterisation and epidemiology of 2019 novel coronavirus: implications for virus origins and receptor binding. Lancet. 2020;395:565-74. 10.1016/S0140-6736(20)30251-8 [DOI] [PMC free article] [PubMed] [Google Scholar]
- 3.Chun HJ, Coutavas E, Pine AB, Lee AI, Yu VL, Shallow MK, et al. Immuno-fibrotic drivers of impaired lung function in post-acute sequelae of SARS-CoV-2 infection. JCI Insight. 2021;6:e148476. 10.1172/jci.insight.148476 [DOI] [PMC free article] [PubMed] [Google Scholar]
- 4.Mehandru S, Merad M.Pathological sequelae of long-haul COVID. Nat Immunol. 2022;23:194-202. 10.1038/s41590-021-01104-y [DOI] [PMC free article] [PubMed] [Google Scholar]
- 5.Zhu N, Zhang D, Wang W, Li X, Yang B, Song J, et al. A Novel Coronavirus from Patients with Pneumonia in China, 2019. N Engl J Med. 2020;382:727-33. 10.1056/NEJMoa2001017 [DOI] [PMC free article] [PubMed] [Google Scholar]
- 6.Huang C, Huang L, Wang Y, Li X, Ren L, Gu X, et al. 6-month consequences of COVID-19 in patients discharged from hospital: a cohort study. Lancet. 2023;401:e21-e33. 10.1016/S0140-6736(23)00810-3 [DOI] [PMC free article] [PubMed] [Google Scholar]
- 7.Zheng KI, Feng G, Liu WY, Targher G, Byrne CD, Zheng MH.Extrapulmonary complications of COVID-19: A multisystem disease? J Med Virol. 2021;93:323-35. 10.1002/jmv.26294 [DOI] [PMC free article] [PubMed] [Google Scholar]
- 8.Brandt EB, Beck AF, Mersha TB.Air pollution, racial disparities, and COVID-19 mortality. J Allergy Clin Immunol. 2020;146:61-3. 10.1016/j.jaci.2020.04.035 [DOI] [PMC free article] [PubMed] [Google Scholar]
- 9.Gasana J, Dillikar D, Mendy A, Forno E, Ramos Vieira E.Motor vehicle air pollution and asthma in children: a meta-analysis. Environ Res. 2012;117:36-45. 10.1016/j.envres.2012.05.001 [DOI] [PubMed] [Google Scholar]
- 10.Accarino G, Lorenzetti S, Aloisio G.Assessing correlations between short-term exposure to atmospheric pollutants and COVID-19 spread in all Italian territorial areas. Environ Pollut. 2021;268:115714. 10.1016/j.envpol.2020.115714 [DOI] [PMC free article] [PubMed] [Google Scholar]
- 11.Bourdrel T, Annesi-Maesano I, Alahmad B, Maesano CN, Bind MA.The impact of outdoor air pollution on COVID-19: a review of evidence from in vitro, animal, and human studies. Eur Respir Rev. 2021;30:200242. 10.1183/16000617.0242-2020 [DOI] [PMC free article] [PubMed] [Google Scholar]
- 12.Rohrer M, Flahault A, Stoffel M.Peaks of Fine Particulate Matter May Modulate the Spreading and Virulence of COVID-19. Earth Syst Environ. 2020;4:789-96. 10.1007/s41748-020-00184-4 [DOI] [PMC free article] [PubMed] [Google Scholar]
- 13.Wu X, Nethery RC, Sabath MB, Braun D, Dominici F.Air pollution and COVID-19 mortality in the United States: Strengths and limitations of an ecological regression analysis. Sci Adv. 2020;6:eabd4049. 10.1126/sciadv.abd4049 [DOI] [PMC free article] [PubMed] [Google Scholar]
- 14.Furlong MA, Alexander GE, Klimentidis YC, Raichlen DA.Association of Air Pollution and Physical Activity With Brain Volumes. Neurology. 2021;98:e416-26. 10.1212/WNL.0000000000013031 [DOI] [PMC free article] [PubMed] [Google Scholar]
- 15.Davey Smith G, Hemani G.Mendelian randomization: genetic anchors for causal inference in epidemiological studies. Hum Mol Genet. 2014;23:R89-98. 10.1093/hmg/ddu328 [DOI] [PMC free article] [PubMed] [Google Scholar]
- 16.Emdin CA, Khera AV, Kathiresan S.Mendelian Randomization. JAMA. 2017;318:1925-6. 10.1001/jama.2017.17219 [DOI] [PubMed] [Google Scholar]
- 17.IEU pen GWAS project. GWAS summary data. 2022. Available: https://gwas.mrcieu.ac.uk/. Accessed: 4 July 2023.
- 18.Yuan S, Larsson SC.Coffee and Caffeine Consumption and Risk of Kidney Stones: A Mendelian Randomization Study. Am J Kidney Dis. 2022;79:9-14.e1. 10.1053/j.ajkd.2021.04.018 [DOI] [PubMed] [Google Scholar]
- 19.COVID-19 Host Genetics Initiative The COVID-19 Host Genetics Initiative, a global initiative to elucidate the role of host genetic factors in susceptibility and severity of the SARS-CoV-2 virus pandemic. Eur J Hum Genet. 2020;28:715-8. 10.1038/s41431-020-0636-6 [DOI] [PMC free article] [PubMed] [Google Scholar]
- 20.Lawlor DA, Harbord RM, Sterne JA, Timpson N, Davey Smith G.Mendelian randomization: using genes as instruments for making causal inferences in epidemiology. Stat Med. 2008;27:1133-63. 10.1002/sim.3034 [DOI] [PubMed] [Google Scholar]
- 21.Bowden J, Davey Smith G, Burgess S.Mendelian randomization with invalid instruments: effect estimation and bias detection through Egger regression. Int J Epidemiol. 2015;44:512-25. 10.1093/ije/dyv080 [DOI] [PMC free article] [PubMed] [Google Scholar]
- 22.Bowden J, Davey Smith G, Haycock PC, Burgess S.Consistent Estimation in Mendelian Randomization with Some Invalid Instruments Using a Weighted Median Estimator. Genet Epidemiol. 2016;40:304-14. 10.1002/gepi.21965 [DOI] [PMC free article] [PubMed] [Google Scholar]
- 23.Nguyen LT, Schmidt HA, von Haeseler A, Minh BQ.IQ-TREE: a fast and effective stochastic algorithm for estimating maximum-likelihood phylogenies. Mol Biol Evol. 2015;32:268-74. 10.1093/molbev/msu300 [DOI] [PMC free article] [PubMed] [Google Scholar]
- 24.Verbanck M, Chen CY, Neale B, Do R.Detection of widespread horizontal pleiotropy in causal relationships inferred from Mendelian randomization between complex traits and diseases. Nat Genet. 2018;50:693-8. 10.1038/s41588-018-0099-7 [DOI] [PMC free article] [PubMed] [Google Scholar]
- 25.Greco M FD, Minelli C, Sheehan NA, Thompson JR.Detecting pleiotropy in Mendelian randomisation studies with summary data and a continuous outcome. Stat Med. 2015;34:2926-40. 10.1002/sim.6522 [DOI] [PubMed] [Google Scholar]
- 26.Bowden J, Del Greco MF, Minelli C, Davey Smith G, Sheehan N, Thompson J.A framework for the investigation of pleiotropy in two-sample summary data Mendelian randomization. Stat Med. 2017;36:1783-802. 10.1002/sim.7221 [DOI] [PMC free article] [PubMed] [Google Scholar]
- 27.Nolte IM.Metasubtract: an R-package to analytically produce leave-one-out meta-analysis GWAS summary statistics. Bioinformatics. 2020;36:4521-2. 10.1093/bioinformatics/btaa570 [DOI] [PMC free article] [PubMed] [Google Scholar]
- 28.Burgess S, Thompson SG, CRP CHD Genetics Collaboration Avoiding bias from weak instruments in Mendelian randomization studies. Int J Epidemiol. 2011;40:755-64. 10.1093/ije/dyr036 [DOI] [PubMed] [Google Scholar]
- 29.Pierce BL, Ahsan H, Vanderweele TJ.Power and instrument strength requirements for Mendelian randomization studies using multiple genetic variants. Int J Epidemiol. 2011;40:740-52. 10.1093/ije/dyq151 [DOI] [PMC free article] [PubMed] [Google Scholar]
- 30.Hemani G, Tilling K, Davey Smith G.Orienting the causal relationship between imprecisely measured traits using GWAS summary data. PLoS Genet. 2017;13:e1007081. 10.1371/journal.pgen.1007081 [DOI] [PMC free article] [PubMed] [Google Scholar]
- 31.Deng Q, Lu C, Norbäck D, Bornehag CG, Zhang Y, Liu W, et al. Early life exposure to ambient air pollution and childhood asthma in China. Environ Res. 2015;143:83-92. 10.1016/j.envres.2015.09.032 [DOI] [PubMed] [Google Scholar]
- 32.Eeftens M, Tsai M-Y, Ampe C, Anwander B, Beelen R, Bellander T, et al. Spatial variation of PM2.5, PM10, PM2.5 absorbance and PMcoarse concentrations between and within 20 European study areas and the relationship with NO2 – Results of the ESCAPE project. Atmos Environ. 2012;62:303-17. 10.1016/j.atmosenv.2012.08.038 [DOI] [Google Scholar]
- 33.Lanki T, Ahokas A, Alm S, Janssen NA, Hoek G, De Hartog JJ, et al. Determinants of personal and indoor PM2.5 and absorbance among elderly subjects with coronary heart disease. J Expo Sci Environ Epidemiol. 2007;17:124-33. 10.1038/sj.jes.7500470 [DOI] [PubMed] [Google Scholar]
- 34.Vardavas CI, Nikitara K.COVID-19 and smoking: A systematic review of the evidence. Tob Induc Dis. 2020;18:20. 10.18332/tid/119324 [DOI] [PMC free article] [PubMed] [Google Scholar]
- 35.Andersen ZJ, Pedersen M, Weinmayr G, Stafoggia M, Galassi C, Jørgensen JT, et al. Long-term Exposure to Ambient Air Pollution and Incidence of Brain Tumor: the European Study of Cohorts for Air Pollution Effects (ESCAPE). Neuro-oncol. 2018;20:420-32. 10.1093/neuonc/nox163 [DOI] [PMC free article] [PubMed] [Google Scholar]
- 36.Fuks KB, Weinmayr G, Basagaña X, Gruzieva O, Hampel R, Oftedal B, et al. Long-term exposure to ambient air pollution and traffic noise and incident hypertension in seven cohorts of the European study of cohorts for air pollution effects (ESCAPE). Eur Heart J. 2017;38:983-90. [DOI] [PubMed] [Google Scholar]
- 37.Voss S, Schneider A, Huth C, Wolf K, Markevych I, Schwettmann L, et al. ENVINT-D-20-01309: Long-term exposure to air pollution, road traffic noise, residential greenness, and prevalent and incident metabolic syndrome: Results from the population-based KORA F4/FF4 cohort in Augsburg, Germany. Environ Int. 2021;147:106364. 10.1016/j.envint.2020.106364 [DOI] [PubMed] [Google Scholar]
- 38.Wirsching J, Nagel G, Tsai MY, de Hoogh K, Jaensch A, Anwander B, et al. Exposure to ambient air pollution and elevated blood levels of gamma-glutamyl transferase in a large Austrian cohort. Sci Total Environ. 2023;883:163658. 10.1016/j.scitotenv.2023.163658 [DOI] [PubMed] [Google Scholar]
- 39.Baral B, Muduli K, Jakhmola S, Indari O, Jangir J, Rashid AH, et al. Redefining lobe-wise ground-glass opacity in COVID-19 through deep learning and its correlation with biochemical parameters. IEEE J Biomed Health Inform. 2023;27:2782-93. 10.1109/JBHI.2023.3263431 [DOI] [PubMed] [Google Scholar]
- 40.Schwarz S, Lang C, Harlander M, Stupnik T, Slambrouck JV, Ceulemans LJ, et al. Gamma-glutamyltransferase is a strong predictor of secondary sclerosing cholangitis after lung transplantation for COVID-19 ARDS. J Heart Lung Transplant. 2022;41:1501-10. 10.1016/j.healun.2022.06.020 [DOI] [PMC free article] [PubMed] [Google Scholar]
- 41.Wagner JG, Kamal AS, Morishita M, Dvonch JT, Harkema JR, Rohr AC.PM2.5-induced cardiovascular dysregulation in rats is associated with elemental carbon and temperature-resolved carbon subfractions. Part Fibre Toxicol. 2014;11:25. 10.1186/1743-8977-11-25 [DOI] [PMC free article] [PubMed] [Google Scholar]
- 42.Fanizza C, De Berardis B, Ietto F, Soggiu ME, Schirò R, Inglessis M, et al. Analysis of major pollutants and physico-chemical characteristics of PM2.5 at an urban site in Rome. Sci Total Environ. 2018;616-617:1457-68. 10.1016/j.scitotenv.2017.10.168 [DOI] [PubMed] [Google Scholar]
- 43.André E, Stoeger T, Takenaka S, Bahnweg M, Ritter B, Karg E, et al. Inhalation of ultrafine carbon particles triggers biphasic pro-inflammatory response in the mouse lung. Eur Respir J. 2006;28:275-85. 10.1183/09031936.06.00071205 [DOI] [PubMed] [Google Scholar]
- 44.Sattler C, Moritz F, Chen S, Steer B, Kutschke D, Irmler M, et al. Nanoparticle exposure reactivates latent herpesvirus and restores a signature of acute infection. Part Fibre Toxicol. 2017;14:2. 10.1186/s12989-016-0181-1 [DOI] [PMC free article] [PubMed] [Google Scholar]
- 45.Bashir MF, Ma BJ, Bilal M, Komal B, Bashir MA, Farooq TH, et al. Correlation between environmental pollution indicators and COVID-19 pandemic: A brief study in Californian context. Environ Res. 2020;187:109652. 10.1016/j.envres.2020.109652 [DOI] [PMC free article] [PubMed] [Google Scholar]
- 46.López-Feldman A, Heres D, Marquez-Padilla F.Air pollution exposure and COVID-19: A look at mortality in Mexico City using individual-level data. Sci Total Environ. 2021;756:143929. 10.1016/j.scitotenv.2020.143929 [DOI] [PMC free article] [PubMed] [Google Scholar]
- 47.Pansini R, Fornacca D.COVID-19 Higher Mortality in Chinese Regions With Chronic Exposure to Lower Air Quality. Front Public Health. 2021;8:597753. 10.3389/fpubh.2020.597753 [DOI] [PMC free article] [PubMed] [Google Scholar]
- 48.Pivato A, Amoruso I, Formenton G, Di Maria F, Bonato T, Vanin S, et al. Evaluating the presence of SARS-CoV-2 RNA in the particulate matters during the peak of COVID-19 in Padua, northern Italy. Sci Total Environ. 2021;784:147129. 10.1016/j.scitotenv.2021.147129 [DOI] [PMC free article] [PubMed] [Google Scholar]
- 49.Wang P, Chen K, Zhu S, Wang P, Zhang H.Severe air pollution events not avoided by reduced anthropogenic activities during COVID-19 outbreak. Resour Conserv Recycl. 2020;158:104814. 10.1016/j.resconrec.2020.104814 [DOI] [PMC free article] [PubMed] [Google Scholar]
- 50.Wu X, Nethery RC, Sabath BM, Braun D, Dominici F.Air pollution and COVID-19 mortality in the United States: Strengths and limitations of an ecological regression analysis. Sci Adv. 2020;6:eabd4049. 10.1126/sciadv.abd4049 [DOI] [PMC free article] [PubMed] [Google Scholar]
- 51.Chen C, Wang J, Kwong J, Kim J, van Donkelaar A, Martin RV, et al. Association between long-term exposure to ambient air pollution and COVID-19 severity: a prospective cohort study. CMAJ. 2022;194:E693-700. 10.1503/cmaj.220068 [DOI] [PMC free article] [PubMed] [Google Scholar]
- 52.Ali N, Islam F.The Effects of Air Pollution on COVID-19 Infection and Mortality-A Review on Recent Evidence. Front Public Health. 2020;8:580057. 10.3389/fpubh.2020.580057 [DOI] [PMC free article] [PubMed] [Google Scholar]
- 53.Martins V, Moreno T, Minguillon MC, van Drooge BL, Reche C, Amato F, et al. Origin of inorganic and organic components of PM2.5 in subway stations of Barcelona, Spain. Environ Pollut. 2016;208:125-36. 10.1016/j.envpol.2015.07.004 [DOI] [PubMed] [Google Scholar]
- 54.Rodríguez-Cotto RI, Ortiz-Martínez MG, Rivera-Ramírez E, Mateus VL, Amaral BS, Jiménez-Vélez BD, et al. Particle pollution in Rio de Janeiro, Brazil: increase and decrease of pro-inflammatory cytokines IL-6 and IL-8 in human lung cells. Environ Pollut. 2014;194:112-20. 10.1016/j.envpol.2014.07.010 [DOI] [PMC free article] [PubMed] [Google Scholar]
- 55.Wang H, Shen X, Liu J, Wu C, Gao J, Zhang Z, et al. The effect of exposure time and concentration of airborne PM2.5 on lung injury in mice: A transcriptome analysis. Redox Biol. 2019;26:101264. 10.1016/j.redox.2019.101264 [DOI] [PMC free article] [PubMed] [Google Scholar]
- 56.Chow JC, Watson JG, Edgerton SA, Vega E.Chemical composition of PM2.5 and PM10 in Mexico City during winter 1997. Sci Total Environ. 2002;287:177-201. 10.1016/S0048-9697(01)00982-2 [DOI] [PubMed] [Google Scholar]
- 57.Bowden J, Holmes MV.Meta-analysis and Mendelian randomization: A review. Res Synth Methods. 2019;10:486-96. 10.1002/jrsm.1346 [DOI] [PMC free article] [PubMed] [Google Scholar]
- 58.Araf Y, Akter F, Tang YD, Fatemi R, Parvez MSA, Zheng C, et al. Omicron variant of SARS-CoV-2: Genomics, transmissibility, and responses to current COVID-19 vaccines. J Med Virol. 2022;94:1825-32. 10.1002/jmv.27588 [DOI] [PMC free article] [PubMed] [Google Scholar]
- 59.Tao K, Tzou PL, Nouhin J, Gupta RK, de Oliveira T, Kosakovsky Pond SL, et al. The biological and clinical significance of emerging SARS-CoV-2 variants. Nat Rev Genet. 2021;22:757-73. 10.1038/s41576-021-00408-x [DOI] [PMC free article] [PubMed] [Google Scholar]
Associated Data
This section collects any data citations, data availability statements, or supplementary materials included in this article.