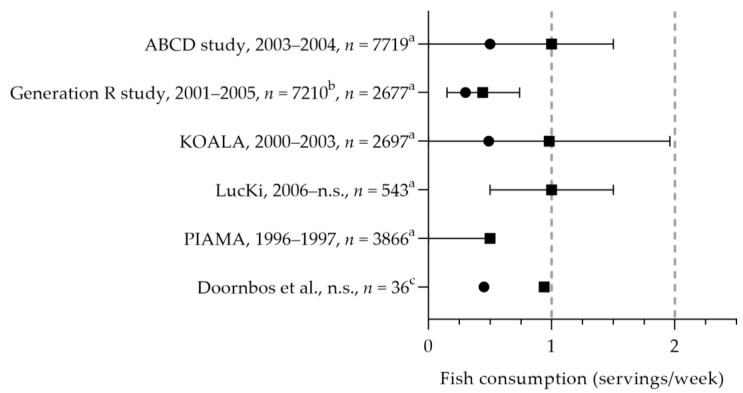
Figure 3.
(Fatty) fish consumption by pregnant women. Squares indicate fish intake; dots indicate fatty fish intake. The dotted vertical line represents recommended intakes for fish (2 servings/week) and fatty fish (1 serving/week). a = median with interquartile range (IQR); b = median; c = mean. n.s. = not stated. ABCD study, Generation R study, KOALA, LucKi, PIAMA [20]. Doornbos et al. [40].

