Abstract
Background
The sagittal plane of spine-pelvis morphology of adult patients with lumbar disc herniation (LDH) differs from that of normal people. There is a correlation between abnormal sagittal plane morphology and adult LDH. This study aimed to investigate the relationship between LDH in young people and the Roussouly classification in the sagittal alignment of the spine and pelvis.
Methods
A total of 126 patients with LDH hospitalized in our tertiary hospital between January 2020 and January 2021 who met the inclusion and exclusion criteria were retrospectively analyzed in a cross-sectional study. Participants were grouped according to the spinal level of disc herniation (L4/5 group, L5/S1 group, L3/4 group). Pelvic incidence (PI), pelvic tilt (PT), and sacral slope (SS) of all cases were measured using standing lateral spinal radiographs. Facet joint angles (FJA) were measured using lumbar computed tomography (CT) horizontal radiographs, and the height of the anterior, middle, and posterior margins of the herniated disc was measured using sagittal radiographs. The classification of Pfirrmann disc degeneration was determined via magnetic resonance imaging (MRI) film of the lumbar region. Roussouly classification was performed according to sagittal plane morphology, and data were analyzed among each group.
Results
In all, 126 patients aged from 18 to 40 years, with an average age of 31.04±5.886 years were included. There were 63 cases of L4/5 disc herniation, 59 cases of L5/S1 herniation, and 4 cases of L3/4 herniation. There were 35 cases of epiphyseal separation. The Roussouly classification included 21 cases of type 1, 56 cases of type 2, 32 cases of type 3, 4 cases of type 4, and 13 cases of type 3 + anteverted pelvis (type 3-AP). The L4/5 disc herniation group had significantly more types 2 and 3 than the other groups, and the L5/S1 disc herniation group had significantly more types 1 and 2 than the other groups. There were no significant differences in the Pfirrmann grade of intervertebral disc degeneration; epiphyseal separation; the height of anterior, middle, and posterior margins of the herniated disc; the difference between left and right facet angle and bilateral facet angle; and the thoracic kyphosis (TK) value among any of the groups (P>0.05). There were significant differences in PI, PT, SS, lumbar lordosis (LL), and height of the anterior and posterior margins of the intervertebral space among all groups (P<0.05). PI values were grouped at 50°; PT, SS, and LL were significantly different (P<0.05), whereas TK values were not significantly different between the 2 groups (P>0.05). SS values were grouped at 35°, and there were significant differences in PI, TK, and LL between the 2 groups (P<0.05). According to the disc herniation segment, the patients were divided into L4/5 and L5/S1 groups. There were significant differences in PI, PT, anterior edge height, anterior to posterior edge height, left facet angle, right facet angle, and bilateral facet angle (P<0.05).
Conclusions
LDH is common in L4/5 and L5/S1 segments. The incidence of Roussouly type 1 and 2 LDH is significantly higher than other types, and type 4 is the lowest. Small PI and small SS are more obvious in the L5/S1 segment. L5/S1 disc herniation is more common in patients with Roussouly type 1 and 2 classifications, whereas L4/5 disc herniation is more frequent in patients with Roussouly type 2 and 3 classifications.
Keywords: Lumbar disc herniation (LDH), spine-pelvic sagittal alignment, Roussouly classification
Introduction
Lumbar disc herniation (LDH) refers to degenerative changes of the lumbar intervertebral disc, rupture of annulus fibrosus, protrusion or prolapse of nucleus pulposus tissue, and the main clinical symptoms of lumbar and leg pain caused by stimulation or compression of corresponding nerves. The patients most affected with LDH are middle-aged and young people. Studies have found an association between abnormal sagittal morphology and LDH in adults (1). Roussouly types with different sagittal forms have different spine-pelvis morphology and distinct pelvic incidence (PI) values, with Roussouly types 1 and 2 having significantly lower PI values than Roussouly types 3 and 4 (2). It has been reported that people with smaller PI are more likely to develop lumbar intervertebral disc process disease (3-6). On the other hand, Torrie et al. (7) found no differences in LDH degeneration frequency between patients with different Roussouly subtypes.
The purpose of this study was to investigate the relationship between LDH in young people and spine-pelvis sagittal morphology and Roussouly classification. To minimize the effects of adjacent intervertebral disc degeneration and facet and joint degeneration, the imaging data of patients with LDH under 40 years old admitted to our department between January 2020 and January 2021 were collected. We present this article in accordance with the STROBE reporting checklist (available at https://qims.amegroups.com/article/view/10.21037/qims-22-503/rc).
Methods
General information
A cross-sectional retrospective study was conducted on patients with LDH under 40 years old who were admitted to Sichuan Provincial Orthopedic Hospital from January 2020 to January 2021 with complete imaging data. The inclusion criteria were as follows: (I) aged 18 years and older and younger than or equal to 40 years; (II) meeting the diagnostic criteria of symptomatic LDH; (III) the adjacent segments of the target segment disc Pfirrmann grade (8) was less than or equal to grade Ⅲ; (IV) no other serious complications; and (V) the patient provided written informed consent and was willing to accept the relevant treatment plan. The exclusion criteria were as follows: (I) previous lumbar surgery; (II) congenital lumbar disease, lumbar spondylolisthesis, trauma, tumor, or bilateral femoral head disease; (III) multisegmental spinal canal stenosis; (IV) lower limb joint disease; and (V) mental disturbance preventing cooperation in the study.
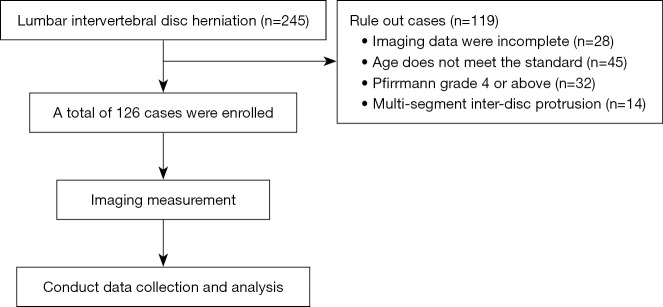
All patients with LDH were confirmed by medical history, physical examination, and imaging examination [magnetic resonance imaging (MRI), computed tomography (CT)], and a total of 245 patients were initially included. Based on the inclusion and exclusion criteria, 126 cases were included in the final sample, comprising 88 male and 38 female patients. Participant ages ranged from 18 to 40 years, with an average of 31.04±5.886 years (Figure 1).
Figure 1.
Flowchart.
Imaging measurement
All patients had full-length anteroposterior and lateral spine radiographs with clear anatomical marks, plain lumbar CT + 3-dimensional (3D) reconstruction, and lumbar MRI data. The X-ray shooting standard was described by Horton et al. (9), as follows. Under the guidance of professional technicians, the patient stood naturally, looked straight ahead, stood with both feet shoulder-width apart, straightened the knee joint with the patella facing forwards, naturally flexed both elbow joints, bent both wrists, and clenched hands were placed naturally in the supraclavicular fossa. Lumbar CT and MRI were performed in a supine position with a lower limb extension machine. Magnetic resonance (MR) scanning was performed with a Siemens 1.5T MR machine (Siemens, Erlangen, Germany). The spinal coil was selected, and the L3 level was located in the center of the coil. The scanning sequences included: sagittal spin echo T1-weighted imaging (SE T1WI), rotation time (TR) 3,612 ms, echo time (TE) 124 ms, SE T2-weighted imaging (T2WI), TR 476 ms, and TE 9 ms; short-T1 inversion recovery (STIR) TR 4,228 ms, TE 48 ms; the field of view (FOV) 300 mm × 250 mm, with a layer thickness of 3.5 mm and a layer spacing of 0.35 mm; axial SE T2WI, TR 4,000 ms, and TE 122 ms. CT scans were performed with GE 64-row, 128-slice BrightSpeed VCT (GE Healthcare, Chicago, IL, USA), ranging from the 12th thoracic 12 to the 1st sacral vertebra, at 120 kV, 150 mAs, collimation 0.625 mm, TR 0.6 s, movement 40 mm/cycle, and pitch 0.984:1. All original data were reconstructed at an AW 4.4 workstation with a layer thickness of 5 mm, and sagittal and cross-sectional intervertebral disc images were reconstructed at intervals. The imaging parameters were measured using the software of the picture archiving and communication system (PACS) of Sichuan Orthopedic Hospital.
X-ray of the spine
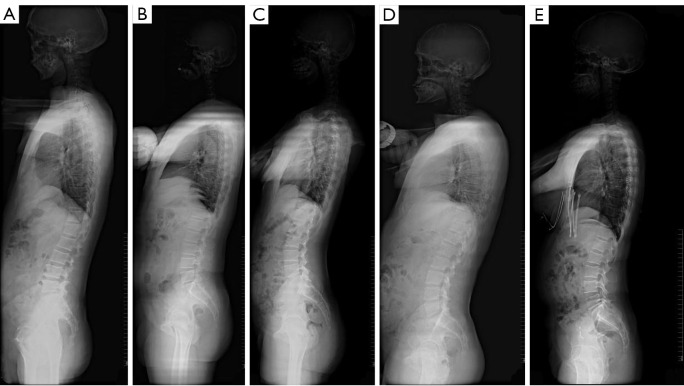
Pelvic parameters were measured according to the method described by Legaye et al. (10) (Figure 2). The PI referred to the angle between the straight line connecting the midpoint of the S1 upper endplate and the midpoint of the line connecting the center of the bilateral femoral head and the vertical line of the S1 upper endplate. Sacral slope (SS) referred to the angle between the upper endplate of S1 and the horizontal line; pelvic tilt (PT) referred to the angle between the line between the midpoint of the endplate of the sacrum and the midpoint of the femoral head on both sides and the gravity line. The angle was positive when the midpoint of the upper endplate was located behind the axis of the femoral head, and negative when the midpoint of the upper endplate was located in the front of S1. The spinal parameters (Figure 3) were as follows: thoracic kyphosis (TK): the angle between the tangent line of the upper endplate of T4 and the tangent line of the lower endplate of T12; lumbar lordosis (LL): the included angle between the tangent line of the upper endplate of L1 and S1; TK: the kyphosis is positive and the lordosis is negative. LL is positive in lordosis and negative in kyphosis (11,12). Roussouly classification was performed according to sagittal plane morphology. The Roussouly classification criteria (2,13) (Figure 4) were as follows: type 1: SS <35°, PI <50°, short segment LL <3 vertebral bodies, LL vertex lower than L4 level, and kyphosis in thoracolumbar region; type 2: SS <35°, PI <50°, long segment LL, high vertex at the L4 level, kyphotic angle is smaller, the overall back is flat; type 3: 35°< SS <45°, PI >50°, the vertex of LL is located in the center of the 4th lumbar vertebrae or 3–4th lumbar intervertebral disc, the balance and coordination of the spine is good; type 4: SS >45°, PI >50°, LL angle and length increased, the vertex is located at the L3 or higher vertebral body, thoracic kyphotic angle is the largest; type 3 + anteverted pelvis (type 3-AP): 35°< SS <45°, PI <50°, PT ≤5°, and other characteristics are basically similar to type 3.
Figure 2.
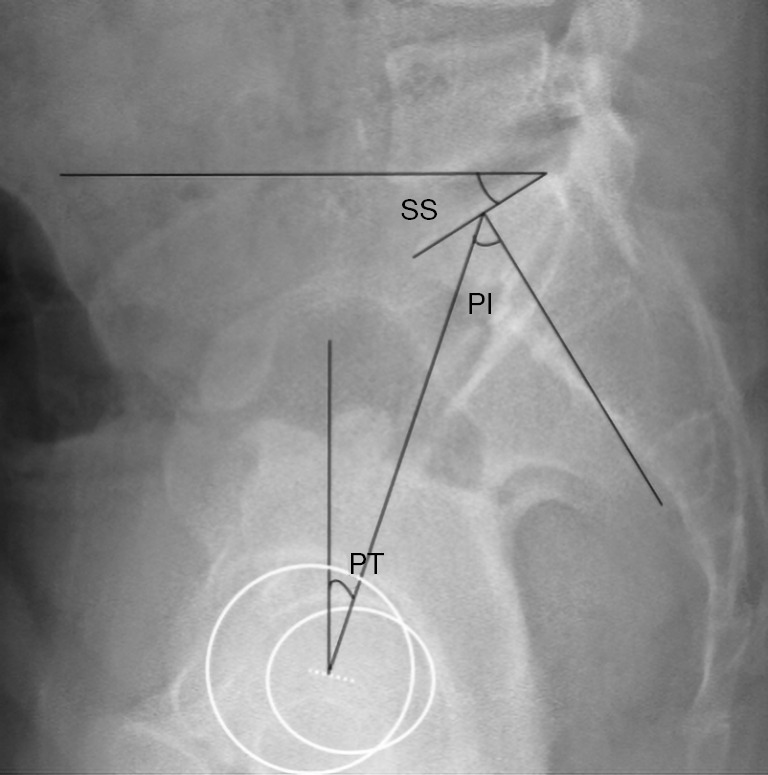
X-ray pelvic parameters measurement method. SS, sacral slope; PI, pelvic incidence; PT, pelvic tilt.
Figure 3.

Measurement method of spine parameters on X-ray. LL, lumber lordosis; TK, thoracic kyphosis.
Figure 4.
Roussouly classification images for example. (A) Type 1; (B) type 2; (C) type 3-AP; (D) type 3; (E) type 4. Type 3-AP, type 3 + anteverted pelvis.
Lumbar CT and MRI
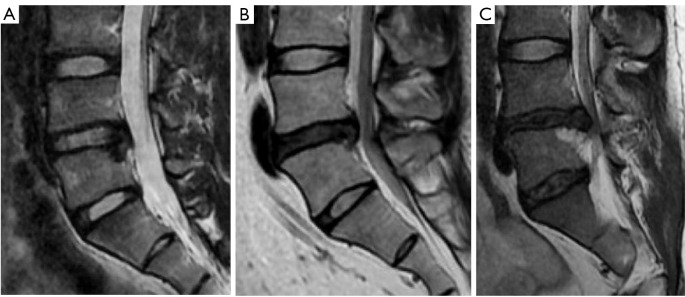
Facet joint angles (FJA) of the protruding segment were measured on the horizontal CT radiographs of the lumbar spine. According to the method developed by Noren et al. (14) (Figure 5): parallel to the vertebral endplate in cross-section, the intervertebral disc is located around, before, and after the cut edge line of the rectangle; the diagonal intersection point is the center of the vertebral body (O point); connected to the center of the vertebral body and the spine base center (P point) is the center line; the edge of the articular process is inside; the articular process is under the edge on the intersection (Q point); the articular process is under the lower edge (S point); the articular process is on the outer edge of the connection to the intersection point (T point) for the joint line, and the angle between the bilateral joint line and the midline is the FJA. The joint lines intersect on both sides. The height of the anterior, middle, and posterior margins of the herniated intervertebral disc was measured on the sagittal CT of the lumbar spine, and the median sagittal plane image of the lumbar spine was selected to measure the anterior, middle, and posterior distances of each intervertebral space on the leading edge, middle, and posterior margins of the vertebral body (15) (Figure 6) and to determine whether the epiphyseal ring was severed (16). The Pfirrmann disc degeneration grade (8) (Figure 7) and the segment and side of disc herniation were determined using a lumbar MRI film. The Pfirrmann disc degeneration grade was based on T2-weighted midsagittal fast spin echo images of lumbar MRI.
Figure 5.
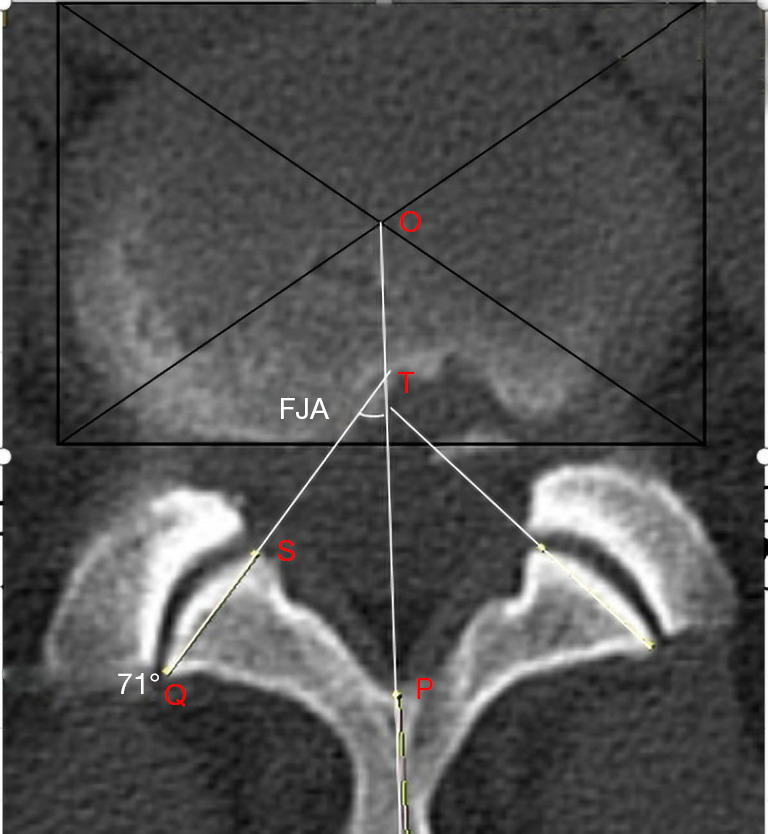
Measurement method of FJA on computed tomography horizontal radiography. O point: parallel to the vertebral endplate in cross-section, the intervertebral disc is located around, before, and after the cut edge line of the rectangle; the diagonal intersection point is the center of the vertebral body; P point: the spine base center; the edge of the articular process is inside; Q point: the articular process is under the edge on the intersection; S point: the articular process is under the lower edge; T point: the articular process is on the outer edge of the connection to the intersection point; FJA, facet joint angles.
Figure 6.
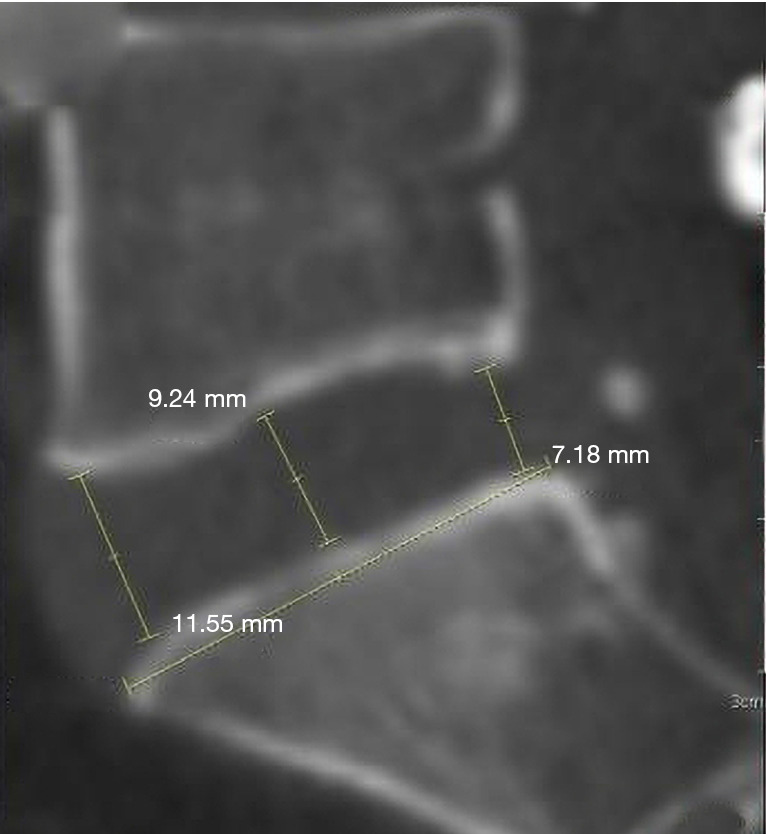
Measurement method of lumbar intervertebral space height on CT sagittal view. CT, computed tomography.
Figure 7.
Shown above is the Pfirrmann disc degeneration grading diagram. (A) Grade 3; (B) grade 4; (C) grade 5.
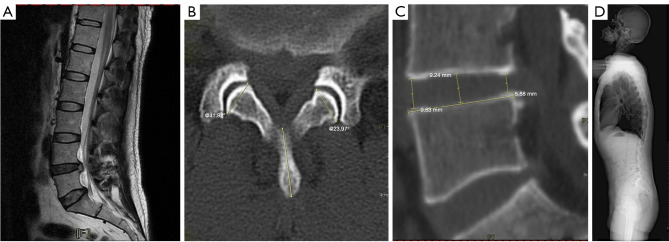
The study was conducted in accordance with the Declaration of Helsinki (as revised in 2013). The image materials have been reviewed and approved by the Ethics Approval Committee of Sichuan Province Orthopedic Hospital (No. KY2020-043-01), and written informed consent was obtained. The above-mentioned imaging data were measured twice by an attending spine specialist, who was not aware of the content of the study but was aware of the measurement methods, and the final value was expressed as the mean of the 2 measurements (Figure 1). Figures 8,9 show the nonsurgical and surgical cases, respectively.
Figure 8.
Case 1: non-surgically treatment. (A) Lumbar MRI. (B) Lumbar CT plain scan. Left FJA is 23.97°; right FJA is 41.92°. (C) The sagittal CT of the lumbar spine. Height of anterior margins is 9.63 mm; height of posterior margins is 5.88 mm; height of middle margins is 9.24 mm. (D) Full length lateral X-ray of the spine. Roussouly classification type 2. CT, computed tomography; FJA, facet joint angle; MRI, magnetic resonance imaging.
Figure 9.
Case 2: surgical treatment. (A) Lumbar MRI. (B) Lumbar CT plain scan. Left FJA is 39.97°; right FJA is 37.63°. (C) The sagittal CT of the lumbar spine. Height of anterior margins is 10.95 mm; height of posterior margins is 5.48 mm; height of middle margins is 7.94 mm. (D) Full length lateral X-ray of the spine. Roussouly classification type 1. CT, computed tomography; FJA, facet joint angle; MRI, magnetic resonance imaging.
Statistical methods
All statistical results were analyzed using SPSS 26.0 statistical software (IBM Corp., Armonk, NY, USA). Categorical data were analyzed using the χ2 test, the comparison between multiple groups was adjusted for using the Bonferroni correction, and continuous data were analyzed using independent sample t-tests and univariate analysis of variance (ANOVA). A P value <0.05 was considered statistically significant.
Results
Of a total of 245 patients with LDH, a total of 126 patients were finally enrolled in this study (Figure 9), including 88 males and 38 females, aged 18–40 years, with an average age of 31.04±5.886 years. There were 63 cases of L4/5 herniation, 59 cases of L5/S1 herniation, and 4 cases of L3/4 herniation. There were 35 cases of epiphyseal ring detachment (Table 1).
Table 1. Comparison of general data.
| Gender | Segment, n | Direction of the herniated disc, n | Pfirrmann classification, n | Epiphyseal separation, n | Age (years), n | ||||||||||||||
|---|---|---|---|---|---|---|---|---|---|---|---|---|---|---|---|---|---|---|---|
| L3/4 | L4/5 | L5/S1 | Left | Right | Central | Level 3 | Level 4 | Level 5 | With | Without | 18–25 | 26–30 | 31–35 | 36–40 | |||||
| Male | 3 | 47 | 38 | 45 | 37 | 6 | 21 | 47 | 20 | 29 | 59 | 19 | 21 | 28 | 20 | ||||
| Female | 1 | 16 | 21 | 19 | 12 | 7 | 4 | 19 | 15 | 6 | 32 | 6 | 6 | 13 | 13 | ||||
| χ2 value | 1.556 | 4.217 | 5.118 | 3.898 | 2.641 | ||||||||||||||
| P value | 0.459 | 0.121 | 0.077 | 0.048 | 0.450 | ||||||||||||||
For χ2 test, P<0.05. Data have been adjusted using the Bonferroni method.
Comparison between Roussouly classification groups
A total of 126 patients, 88 males and 38 females, underwent Roussouly classification. There were no significant differences in gender, side of disc herniation, Pfirrmann grading of disc degeneration, and whether or not the epiphyseal ring was severed among any of the groups (P>0.05), and L4/5 and L5/S1 were significantly higher than L3/4. After Bonferroni correction, L4/5 segment groups type 2 and 3 were significantly higher than the other groups, L5/S1 segment groups type 1 and 2 were significantly higher than the other groups, and there were significant differences (P<0.05) (Table 2). Also, there were significant differences in PI, PT, SS, and LL values among all groups (P<0.05), but no significant differences in TK values (P>0.05). There were no significant differences in the height of the anterior, posterior, and intermediate intervertebral spaces among any of the groups (P>0.05), and there were significant differences in the height of the anterior and posterior intervertebral spaces between all groups (P<0.05). There were no significant differences in the angle of the left and right facet joints and the angle of the bilateral facet joints between any of the groups (P>0.05) (Table 3).
Table 2. Comparison of general data.
| Roussouly classification [n] | Gender, n | Segment, n | Direction of herniated disc, n | Pfirrmann classification, n | Epiphyseal separation, n | ||||||||||||
|---|---|---|---|---|---|---|---|---|---|---|---|---|---|---|---|---|---|
| Male | Female | L3/4 | L4/5 | L5/S1 | Left | Right | Central | Level 3 | Level 4 | Level 5 | With | Without | |||||
| Type 1 [21] | 14 | 7 | 1 | 2 | 18 | 12 | 8 | 1 | 2 | 15 | 4 | 5 | 16 | ||||
| Type 2 [56] | 43 | 13 | 3 | 28 | 25 | 26 | 21 | 9 | 15 | 27 | 14 | 14 | 42 | ||||
| Type 3 [32] | 21 | 11 | 0 | 27 | 5 | 17 | 13 | 2 | 5 | 16 | 11 | 10 | 22 | ||||
| Type 4 [4] | 2 | 2 | 0 | 1 | 3 | 3 | 1 | 0 | 1 | 3 | 0 | 2 | 2 | ||||
| Type 3-AP [13] | 8 | 5 | 0 | 5 | 8 | 6 | 6 | 1 | 2 | 5 | 6 | 4 | 9 | ||||
| χ2 value | 2.826 | 32.623 | 4.796 | 9.429 | 1.615 | ||||||||||||
| P value | 0.587 | <0.001 | 0.779 | 0.307 | 0.806 | ||||||||||||
For χ2 test, P<0.05. Data have been adjusted using the Bonferroni method.
Table 3. Comparison between Roussouly typing groups.
| Roussouly classification [n] | PI | PT | SS | TK | LL | Height of anterior margins | Height of posterior margins | Height of middle margins | Height difference between anterior and posterior edge | Left FJA | Right FJA | Bilateral angle difference |
|---|---|---|---|---|---|---|---|---|---|---|---|---|
| Type 1 [21] | 38.28±6.861 | 14.88±6.532 | 23.47±9.033 | 19.08±10.682 | 25.81±20.186 | 10.79±2.669 | 6.42±1.667 | 8.69±1.757 | 4.37±2.947 | 47.04±8.703 | 48.34±16.052 | 10.20±8.969 |
| Type 2 [56] | 42.24±6.427 | 19.00±7.306 | 23.26±7.654 | 20.60±10.027 | 28.71±17.444 | 8.96±2.548 | 6.39±1.520 | 7.91±1.679 | 2.57±2.364 | 44.36±11.494 | 45.19±10.741 | 7.79±7.187 |
| Type 3 [32] | 56.89±4.917 | 24.46±6.943 | 32.41±7.124 | 23.38±9.821 | 40.54±15.214 | 9.56±2.384 | 6.44±1.860 | 8.50±1.857 | 3.12±2.335 | 43.86±10.639 | 43.56±10.983 | 6.96±5.426 |
| Type 4 [4] | 61.54±2.490 | 11.62±1.793 | 49.92±4.079 | 24.55±7.245 | 55.97±11.874 | 11.01±3.603 | 5.84±1.861 | 7.88±2.781 | 5.16±1.832 | 50.78±9.567 | 54.97±5.952 | 8.83±6.890 |
| Type 3-AP [13] | 45.81±3.248 | 8.14±3.248 | 37.69±2.542 | 26.26±9.561 | 50.10±5.641 | 9.43±1.841 | 5.43±1.740 | 7.69±1.305 | 4.00±2.091 | 41.86±11.022 | 41.99±9.205 | 8.90±6.815 |
| F value | 50.014 | 16.796 | 25.180 | 1.487 | 8.869 | 2.435 | 1.074 | 1.354 | 3.176 | 0.853 | 1.494 | 0.746 |
| P value | <0.001 | <0.001 | <0.001 | 0.210 | <0.001 | 0.051 | 0.372 | 0.254 | 0.016 | 0.494 | 0.208 | 0.562 |
Data are presented as mean ± standard deviation. Univariate ANOVA analysis, P<0.05. ANOVA, analysis of variance; SS, sacral slope; PI, pelvic incidence; PT, pelvic tilt; TK, thoracic kyphosis; LL, lumbar lordosis; FJA, facet joint angle.
Comparison between PI, SS, and intervertebral disc herniation groups
PI values were grouped at 50°, and the smaller the PI value, the smaller the PT, SS, and LL values. There was a significant difference (P<0.05), whereas there was no significant difference in the TK value (P>0.05) (Table 4). The SS value was compared with the 35° group. The larger the SS value, the larger the PI, TK, and LL values, with significant differences (P<0.05), whereas the PT value showed no significant differences (P>0.05) (Table 5). The protruding segments were divided into the L4/5 and L5/S1 groups. Compared with the L5/S1 group, the PI and PT in the L4/5 group were larger, and the anterior height of the intervertebral space, the difference between the anterior and posterior edge of the intervertebral space, the difference between the left FJA, right FJA, and bilateral FJA were smaller, with significant differences (P<0.05). However, there were no significant differences in SS, TK, LL, posterior edge height of intervertebral space, and middle height of intervertebral space (P>0.05) (Table 6).
Table 4. Group comparison of pelvic incidence values at 50°.
| PI, n (%) | PI | PT | SS | TK | LL |
|---|---|---|---|---|---|
| <50°, 90 (71.43) | 41.83±6.551 | 16.47±7.667 | 25.39±9.014 | 21.05±10.245 | 31.12±18.624 |
| >50°, 36 (28.57) | 57.40±4.913 | 23.03±7.728 | 34.36±8.805 | 23.51±9.490 | 42.26±15.533 |
| t value | −14.536 | −4.329 | −5.078 | −1.241 | −3.171 |
| P value | <0.001 | <0.001 | <0.001 | 0.217 | 0.002 |
Data are presented as mean ± standard deviation. Independent sample t-test, P<0.05. SS, sacral slope; PI, pelvic incidence; PT, pelvic tilt; TK, thoracic kyphosis; LL, lumbar lordosis.
Table 5. Comparison of sacral slope values in 35° groups.
| SS, n (%) | PI | PT | SS | TK | LL |
|---|---|---|---|---|---|
| <35°, 77 (61.11) | 41.16±6.740 | 17.88±7.298 | 23.31±7.993 | 20.19±10.162 | 27.92±18.142 |
| >35°, 49 (38.89) | 54.33±6.854 | 19.08±9.51 | 35.24±7.769 | 24.21±9.483 | 44.34±14.004 |
| t value | −10.621 | −0.798 | −8.255 | −2.223 | −5.393 |
| P value | <0.001 | 0.426 | <0.001 | 0.028 | <0.001 |
Data are presented as mean ± standard deviation. Independent sample t-test, P<0.05. SS, sacral slope; PI, pelvic incidence; PT, pelvic tilt; TK, thoracic kyphosis; LL, lumbar lordosis.
Table 6. Group comparison of disc herniation segments.
| Segment, n (%) | PI | PT | SS | TK | LL | Height of anterior margins | Height of posterior margins | height of middle margins | Height difference between anterior and posterior margins | Left FJA | Right FJA | Bilateral angle difference |
|---|---|---|---|---|---|---|---|---|---|---|---|---|
| L4/5, 63 (50.0) | 48.98±9.924 | 20.82±8.376 | 28.18±10.189 | 22.46±9.471 | 35.59±18.120 | 9.00±2.386 | 6.29±1.755 | 8.26±1.779 | 2.71±2.386 | 42.82±11.089 | 43.26±9.226 | 6.59±5.662 |
| L5/S1, 59 (46.83) | 43.86±7.917 | 16.01±7.470 | 27.88±9.641 | 21.18±10.367 | 33.23±19.193 | 10.13±2.644 | 6.20±1.511 | 8.16±1.739 | 3.92±2.512 | 47.34±9.605 | 47.91±13.613 | 9.88±8.140 |
| t value | 3.132 | 3.344 | 0.168 | 0.715 | 0.697 | −2.483 | 0.282 | 0.309 | −2.739 | −2.402 | −2.223 | −2.582 |
| P value | 0.002 | 0.001 | 0.867 | 0.476 | 0.487 | 0.014 | 0.779 | 0.758 | 0.007 | 0.018 | 0.028 | 0.011 |
Data are presented as mean ± standard deviation. Independent sample t-test, P<0.05. SS, sacral slope; PI, pelvic incidence; PT, pelvic tilt; TK, thoracic kyphosis; LL, lumbar lordosis; FJA, facet joint angle.
Discussion
In recent years, more and more in-depth studies have been conducted on the sagittal spine-pelvis sequence. According to the sagittal spine-pelvis sequence based on the Roussouly classification, it can be divided into 4 types according to the shape of the distal LL and the tilt of the sacrum (13). In 2018, Laouissat et al. (2) added the type 3-AP. At present, the Roussouly classification of the sagittal spinal-pelvic sequence can be divided into 5 types. Among the 5 types, type 1, 2, and 3-AP were small PI (<50°), 3 and 4 were large PI (>50°), type 1 and 2 were low SS (<35°), type 3 and 3-AP were average SS (35°< SS <45°), and type 4 was high SS (>45°). Studies (4-6) have shown that the PI of patients with LDH is smaller than that of the normal population.
Comparison between Roussouly classification groups for spine-pelvis alignment parameters
According to the Roussouly classification of patients with LDH, statistical analysis showed that there were no significant differences in terms of the side of disc herniation, the Pfirrmann grade of disc degeneration, and the presence of epiphyseal ring separation (P>0.05), but there were significant differences in the segment of disc herniation (P<0.05). The L4/5 and L5/S1 levels were significantly higher than L3/4 levels, which was consistent with the high incidence of disc herniation and L4-S1 levels. After Bonferroni correction, type 2 and 3 in the L4/5 segment group were significantly higher than those in the other groups, and type 1 and 2 in the L5/S1 segment group were significantly higher than those in other groups. Parameters PI, PT, SS, and LL were significantly different among each group. Since the Roussouly classification is based on SS size and the location of the LL vertex, PI and SS values are different among different types, and PI = PT + SS, LL, and PI are closely related (17). Therefore, there were differences among the PI, SS, PT, and LL groups. This is consistent with other reports (18,19).
There were no significant differences between the leading edge of the intervertebral space, the posterior edge of the intervertebral space, and the height of the intervertebral space among any of the groups (P>0.05), whereas there were significant differences between the anterior and posterior edge of the intervertebral space (P<0.05). According to the Roussouly classification, there were significant differences between the curvature of the lower lumbar vertebrae and the height difference between the anterior and posterior edge of intervertebral space. The greater the SS, the greater the lordosis of the lower lumbar vertebrae and the greater the height difference between the anterior and posterior margins of the intervertebral space. Type 4 SS was the largest, and the height difference between the anterior and posterior margin of the intervertebral space was also the largest. There was no significant difference in the difference between the left and right facet angles and the bilateral facet angles among any of the groups (P>0.05), indicating that the difference between the facet angles and the bilateral facet angles had no significant correlation with LDH, which is consistent with other reports (20,21).
Comparison of PI and SS parameters using the Roussouly classification
The PI value is the morphological parameter of the pelvic sagittal alignment, and the PI is basically constant after ontogeny maturation. The Roussouly classification perfected by Laouissat and Roussouly in 2018 was combined with the PI parameter, and the PI was divided into groups with a PI greater than or less than 50° as the boundary. There were significant differences in PT, SS, and LL (P<0.05). The smaller the PI, the smaller the SS and LL, and the patients with disc herniation accounted for a large proportion (71.43%), which is consistent with other reports (4-6).
There were 4 patients with an SS value greater than 45°, accounting for 3.17%, and 122 patients with SS value less than 45°, accounting for 96.83%. The incidence of LDH with large SS values was low, specifically, the incidence of LDH according to Roussouly classification 4 was low. The following reasons for the large SS values were considered: large lordosis of the lower lumbar spine, large stress of the posterior facet joint, small vertical stress of the intervertebral disc, and low incidence of LDH. When the SS value was greater than or less than 35°, there were 77 cases (61.11%) in the small SS group and 49 cases (38.89%) in the large SS group. Roussouly type 1 and 2 LDH incidence was higher than other types (P<0.05), which is consistent with other reports (13). In the small SS group, the PI, TK, and LL values were also smaller (P<0.05), and there was a close relationship between SS and PI and LL (17). In the small SS group, there was also a small TK, which was in line with the characteristics of small spinal lordosis and kyphosis angles in Roussouly types 1 and 2. The incidence of LDH with small SS values was significantly higher than that with large SS values.
The PI and PT values of the L4/5 segment group were higher than those of the L5/S1 segment group, whereas the anterior height of the intervertebral space, the difference between the anterior and posterior edges of the intervertebral space, the difference between the left FJA, the right FJA, and the bilateral FJA were all smaller (P<0.05). In the L5/S1 segment, the PI was less than 50° in 51 cases, and greater than 50° in 5 cases. As shown in Table 3, type 1 and type 2 of L5/S1 segment herniation group are significantly higher than those of other groups. The lumbosacral area is the junction area between the spine and pelvis. Patients with L5/S1 disc herniation have a smaller PI to form a more moderate curvature of the lower lumbar spine, and the L5/S1 disc is subjected to a greater vertical pressure. The nucleus pulposus then protrudes toward the rupture. The smaller SS also provides space for the L5/S1 disc to protrude. The height of anterior intervertebral space in L5/S1 segment, the height difference of anterior-to-posterior intervertebral space, the angle difference of facet joint and facet joint in L5/S1 segment were significantly higher than those in L4/5 segment. Combined with the local anatomical analysis, we believed that L5/S1 was the lumbar sacral vertebrae transition site, and the intervertebral space was wider in front and narrower in back. Therefore, the height difference of anterior intervertebral space and anterior-posterior intervertebral space in L5/S1 segment was higher than that in L4/5 segment. Moreover, the Angle of the articular facet of L5/S1 also shifted to the sacral vertebra and the direction of the articular plane shifted from the sagittal plane to the coronal plane, so the angle of the articular facet joint increased. In addition, it was reported in the literature (22,23) that SS is closely related to LL, the reduction of LL is related to discrete disc dehydration, and LL and PI show a linear relationship. Therefore, the incidence of LDH in patients with a small PI value is more obvious in the L5/S1 segment (24). In the L4/5 segment protrusion group, type 2 and type 3 were significantly higher than those in other groups. Since type 1 lordosis was mainly concentrated in L4-S1, the vertical stress of the lower lumbar spine was distributed more in the facet joints and less in the intervertebral disc, whereas type 2 and type 3 lordosis was gentle, and the vertical stress of the lower lumbar spine was distributed almost evenly in the intervertebral disc and facet joints. Rupture of annulus fibrosus and nucleus pulposus protrusion occurred due to prolonged compression of intervertebral disc.
This study has several limitations. The number of cases in this study was limited, and a comparison between patients with LDH and healthy volunteers was not conducted. The retrospective design of the study is another limitation. Roussouly typing was used to classify the spine and pelvis sagittal plane of normal people. However, the cases in this study were patients with LDH. Roussouly typing was used to analyze the imaging features of patients with LDH. In addition, the lower limbs were not used to evaluate the sagittal balance of the whole body. Finally, the Pfirrmann classification of disc degeneration has certain limitations, which may lead to incorrect classification and affect the final results.
Conclusions
LDH was more common in L4/5 and L5/S1 segments, with PI <50° and SS <35°. The incidence of LDH was significantly higher in Roussouly classification type 1 and 2, and lowest in Roussouly classification type 4. Small PI and small SS was more obvious in the L5/S1 segment. L5/S1 disc herniation was more common in patients with Roussouly 1 and 2 classifications, whereas L4/5 disc herniation was more common in patients with Roussouly 2 and 3 classifications. In clinical practice, it is necessary to reduce the incidence of LDH by keeping a good posture, maintaining a good SS angle, and reducing the vertical stress of the lower lumbar intervertebral disc. These issues need further study.
Supplementary
The article’s supplementary files as
Acknowledgments
Funding: This work was supported by a Sichuan Administration of Traditional Chinese Medicine Scientific research project (No. 2020LC0180).
Ethical Statement: The authors are accountable for all aspects of the work in ensuring that questions related to the accuracy or integrity of any part of the work are appropriately investigated and resolved. The study was conducted in accordance with the Declaration of Helsinki (as revised in 2013). The study was approved by the ethics board of the Sichuan Provincial Orthopedic Hospital (No. KY2020-043-01), and informed consent was provided by all patients.
Footnotes
Reporting Checklist: The authors completed the STROBE reporting checklist. Available at https://qims.amegroups.com/article/view/10.21037/qims-22-503/rc
Conflicts of Interest: All authors completed the ICMJE uniform disclosure form (available at https://qims.amegroups.com/article/view/10.21037/qims-22-503/coif). The authors have no conflicts of interest to declare.
References
- 1.Menezes-Reis R, Bonugli GP, Dalto VF, da Silva Herrero CFP, Defino HLA, Nogueira-Barbosa MH. Association Between Lumbar Spine Sagittal Alignment and L4-L5 Disc Degeneration Among Asymptomatic Young Adults. Spine (Phila Pa 1976) 2016;41:E1081-7. 10.1097/BRS.0000000000001568 [DOI] [PubMed] [Google Scholar]
- 2.Laouissat F, Sebaaly A, Gehrchen M, Roussouly P. Classification of normal sagittal spine alignment: refounding the Roussouly classification. Eur Spine J 2018;27:2002-11. 10.1007/s00586-017-5111-x [DOI] [PubMed] [Google Scholar]
- 3.Barrey C, Jund J, Noseda O, Roussouly P. Sagittal balance of the pelvis-spine complex and lumbar degenerative diseases. A comparative study about 85 cases. Eur Spine J 2007;16:1459-67. 10.1007/s00586-006-0294-6 [DOI] [PMC free article] [PubMed] [Google Scholar]
- 4.Smith JS, Shaffrey CI, Bess S, Shamji MF, Brodke D, Lenke LG, Fehlings MG, Lafage V, Schwab F, Vaccaro AR, Ames CP. Recent and Emerging Advances in Spinal Deformity. Neurosurgery 2017;80:S70-85. 10.1093/neuros/nyw048 [DOI] [PubMed] [Google Scholar]
- 5.Liu H, Shrivastava SR, Zheng ZM, Wang JR, Yang H, Li ZM, Wang TP, Wang H, Utsab S. Correlation of lumbar disc degeneration and spinal-pelvic sagittal balance. Zhonghua Yi Xue Za Zhi 2013;93:1123-8. [PubMed] [Google Scholar]
- 6.Hu D, Ning X. Study on the relationship between sagittal spinal and pelvic parameters and lumbar disc herniation. Journal of Spinal Surgery 2020;18:64-7. [Google Scholar]
- 7.Torrie PA, McKay G, Byrne R, Morris SA, Harding IJ. The Influence of Lumbar Spinal Subtype on Lumbar Intervertebral Disc Degeneration in Young and Middle-Aged Adults. Spine Deform 2015;3:172-9. 10.1016/j.jspd.2014.08.006 [DOI] [PubMed] [Google Scholar]
- 8.Pfirrmann CW, Metzdorf A, Zanetti M, Hodler J, Boos N. Magnetic resonance classification of lumbar intervertebral disc degeneration. Spine (Phila Pa 1976) 2001;26:1873-8. 10.1097/00007632-200109010-00011 [DOI] [PubMed] [Google Scholar]
- 9.Horton WC, Brown CW, Bridwell KH, Glassman SD, Suk SI, Cha CW. Is there an optimal patient stance for obtaining a lateral 36" radiograph? A critical comparison of three techniques. Spine (Phila Pa 1976) 2005;30:427-33. 10.1097/01.brs.0000153698.94091.f8 [DOI] [PubMed] [Google Scholar]
- 10.Legaye J, Duval-Beaupère G, Hecquet J, Marty C. Pelvic incidence: a fundamental pelvic parameter for three-dimensional regulation of spinal sagittal curves. Eur Spine J 1998;7:99-103. 10.1007/s005860050038 [DOI] [PMC free article] [PubMed] [Google Scholar]
- 11.Schwab F, Lafage V, Patel A, Farcy JP. Sagittal plane considerations and the pelvis in the adult patient. Spine (Phila Pa 1976) 2009;34:1828-33. 10.1097/BRS.0b013e3181a13c08 [DOI] [PubMed] [Google Scholar]
- 12.Li W, Sun Z, Chen Z. Imaging study of normal spinal-pelvic sagittal position parameters. Chinese Journal of Orthopedics 2013;33:447-53. [Google Scholar]
- 13.Roussouly P, Gollogly S, Berthonnaud E, Dimnet J. Classification of the normal variation in the sagittal alignment of the human lumbar spine and pelvis in the standing position. Spine (Phila Pa 1976) 2005;30:346-53. 10.1097/01.brs.0000152379.54463.65 [DOI] [PubMed] [Google Scholar]
- 14.Noren R, Trafimow J, Andersson GB, Huckman MS. The role of facet joint tropism and facet angle in disc degeneration. Spine (Phila Pa 1976) 1991;16:530-2. 10.1097/00007632-199105000-00008 [DOI] [PubMed] [Google Scholar]
- 15.Qiao FL, Zhu B, Ma J, Bao L, Wang YK, Chen X. CT measurement and clinical significance of lumbar midsagittal plane intervertebral space. Chinese Imaging Journal of Integrated Traditional and Western Medicine 2015;13:382-4. [Google Scholar]
- 16.Yang B, Jia YH, Yang B, Di L. Radiological manifestations of posterior margin detachment of lumbosacral vertebrae. Journal of Imaging Research and Medical Applications 2018;(5):93-5. [Google Scholar]
- 17.Sun Z, Li W, Chen Z, Yu M, Zhao W. Sagittal sequence fitting relationship between spine and pelvis in normal Chinese. Chinese Journal of Spine and Spinal Cord 2015;25:1-5. [Google Scholar]
- 18.Li G, Yang C, Chen K, Zhu X, Li M. Correlation between lumbar intervertebral disc degeneration and sagittal plane parameters of spine and pelvis. Chinese Journal of Clinical Medicine 2017;24:194-8. [Google Scholar]
- 19.Rajnics P, Templier A, Skalli W, Lavaste F, Illes T. The importance of spinopelvic parameters in patients with lumbar disc lesions. Int Orthop 2002;26:104-8. 10.1007/s00264-001-0317-1 [DOI] [PMC free article] [PubMed] [Google Scholar]
- 20.Kunakornsawat S, Ngamlamaidt K, Tungsiripat R, Prasartritha T. The relationship of facet tropism to lumbar disc herniation. J Med Assoc Thai 2007;90:1337-41. [PubMed] [Google Scholar]
- 21.Zheng X, He Y, Wang Y. CT analysis of facet joint symmetry of lumbar disc herniation in middle-aged and young people and its significance. The Journal of Cervicodynia and Lumbodynia 2022;(1):141-2. [Google Scholar]
- 22.Menezes-Reis R, Garrido Salmon CE, Bonugli GP, Mazoroski D, Savarese LG, Herrero CFPS, Defino HLA, Nogueira-Barbosa MH. Association between spinal alignment and biochemical composition of lumbar intervertebral discs assessed by quantitative magnetic resonance imaging. Quant Imaging Med Surg 2021;11:2428-41. 10.21037/qims-20-40 [DOI] [PMC free article] [PubMed] [Google Scholar]
- 23.Shu S, Hu Z, Bao H, Shi J, Hu A, Grelat M, Liu Z, Sun X, Qian B, Cheng JCY, Lam TP, Chu WWC, Qiu Y, Zhu Z. An analysis of the interactions between the spine, pelvis, and lower limbs in asymptomatic adults with limited pelvic compensation. Quant Imaging Med Surg 2020;10:999-1007. 10.21037/qims-19-785 [DOI] [PMC free article] [PubMed] [Google Scholar]
- 24.Xie W, Bai M, Wang X, Tan Y, He L. Relationship between sacral morphology and L5/S1 disc herniation. Journal of Nanchang University (Medical Science) 2017;(3):52-5. [Google Scholar]
Associated Data
This section collects any data citations, data availability statements, or supplementary materials included in this article.
Supplementary Materials
The article’s supplementary files as


