

Abstract

Understanding the structural dynamics/evolution of catalysts and the related surface chemistry is essential for establishing structure–catalysis relationships, where spectroscopic and scattering tools play a crucial role. Among many such tools, neutron scattering, though less-known, has a unique power for investigating catalytic phenomena. Since neutrons interact with the nuclei of matter, the neutron–nucleon interaction provides unique information on light elements (mainly hydrogen), neighboring elements, and isotopes, which are complementary to X-ray and photon-based techniques. Neutron vibrational spectroscopy has been the most utilized neutron scattering approach for heterogeneous catalysis research by providing chemical information on surface/bulk species (mostly H-containing) and reaction chemistry. Neutron diffraction and quasielastic neutron scattering can also supply important information on catalyst structures and dynamics of surface species. Other neutron approaches, such as small angle neutron scattering and neutron imaging, have been much less used but still give distinctive catalytic information. This review provides a comprehensive overview of recent advances in neutron scattering investigations of heterogeneous catalysis, focusing on surface adsorbates, reaction mechanisms, and catalyst structural changes revealed by neutron spectroscopy, diffraction, quasielastic neutron scattering, and other neutron techniques. Perspectives are also provided on the challenges and future opportunities in neutron scattering studies of heterogeneous catalysis.
1. Introduction
Achieving the Net Zero carbon goals by 2050 set by many countries requires aggressive decarbonization, which entails both the reduction in, and capture of CO2 emissions from the use of fossil fuels.1 Increasing the use of renewable energy sources such as wind, solar, hydropower, and biomass will help to reduce CO2 emissions but currently makes up only 1/3 of the global power capacity. In the intermediate and foreseeable future, fossil fuels are still the primary energy resources for our society. Reduction of the consumption of fossil fuels can effectively decrease CO2 emissions but requires improving the energy and chemical efficiency of the processes so that the societal demand for energy and fuels can still be met. In both aspects, catalysis can play a significant role in decarbonization by improving the process efficiency in terms of activity and selectivity and transforming renewal resources, including biomass and wastes such as plastics and CO2, into products that are otherwise derived from fossil fuels.2 Realizing the potential of catalysis in decreasing the carbon footprint presents a grand challenge in developing new catalytic materials with unprecedented efficiency. A fundamental understanding of the structure–catalysis relationships in these conventional and new chemical reactions is indispensable for designing such new catalysts and thus addressing the decarbonization challenge.
In the pursuit of understanding the chemical transformations of catalytic reactions and the structural evolution of catalysts at the molecular level, a suite of advanced experimental methods has been developed in the studies of catalysis science, particularly for heterogeneous thermal catalysis.3−6 These include the use of photons (diffraction and spectroscopy using X-ray, infrared (IR), Raman, ultraviolet–visible (UV–vis)),6−12 electrons (microscopy, surface science methods),13−15 and neutrons.16,17 While each method provides valuable information on some aspects of catalysis, multiple approaches, often termed multimodal, are desired to provide a complete picture of the working catalysts under reaction conditions.
Among the many characterization approaches, neutron scattering can provide not only complementary catalytic information to other scattering techniques, typically photons and electrons, but also unique insights into catalyst structures and reaction mechanisms of light elements such as hydrogen, nitrogen, and oxygen, or neighboring elements that are difficult or not possible to interrogate by other methods. Neutrons interact with nuclei rather than electrons. Thus, to a neutron, most matter is empty space allowing penetration deep into a catalyst bed or through the thick reactor walls necessary for reactions in extreme conditions. Due to the weak interaction, neutron irradiation does not alter the catalyst, unlike X-ray techniques, where sample damage can be problematic. Additionally, each isotope has its unique neutron scattering cross section. This unusual isotopic sensitivity allows contrast variation and potential discrimination of elements with similar atomic numbers.18−20
For catalysis research, neutron methods can be classified as elastic (diffraction and imaging) and inelastic (spectroscopic) techniques, as depicted in Figure 1, which are used to investigate where atoms are (structure) and what atoms do (function). Neutron diffraction (ND) has significantly contributed to catalysis as a complement to X-ray-based techniques, especially in revealing the location of light elements in the structure of the catalyst under reaction conditions.20−24 Through investigation of the broadening of the diffraction peak, quasi-elastic neutron scattering (QENS) provides information on molecular motions (diffusion and rotational) on a range of time scales (picosecond to nanosecond) at Ångstrom length scales,25 complementary to the typical dynamic information from nuclear magnetic resonance (NMR) studies.26,27 Upon a change in the energy of the scattered neutrons, inelastic neutron scattering (INS), a neutron analog to optical vibrational spectroscopy, provides access to all types of vibrational and translational modes without any selection rules; thus affording chemical spectroscopy information on the catalyst and surface species.16,28,29 Advantageous over conventional optical spectroscopy techniques, INS can bestow catalytic mechanistic insights into opaque materials and especially spectroscopic modes in the low energy range (typically below 1000 cm–1), which is difficult for infrared (inaccessible) and Raman (dominated by phonon modes) spectroscopies.
Figure 1.

An illustration of typical neutron scattering methods for heterogeneous catalysis investigations. S – intensity, Q – momentum transfer, ω – energy transfer
There have been some excellent reviews17,29−36 and book chapters16,28,37−40 on the application of neutron scattering to heterogeneous catalysis. Most of these have focused on a single technique, especially INS, with limited comprehensive reviews36,37 on various neutron techniques. With the recent advancement of neutron sources, beamlines, and environmental reactor cell setups, neutron studies of catalysis have seen significant progress. Hence, a timely review of neutron scattering studies of heterogeneous catalysis is warranted. This work will overview the applications, especially in the past decade or so, of different neutron scattering techniques in heterogeneous catalysis with a focus on studies of thermal catalysis. After a brief introduction to the fundamentals of neutron scattering, neutron spectroscopy, diffraction, and other techniques will be reviewed regarding the theory, reactor designs, and catalysis studies. Multimodal approaches combining two or more techniques, either all neutron methods or a mixture with other approaches, will also be briefly reviewed in catalysis research. The review will conclude with a summary and perspective on neutron scattering studies of heterogeneous catalysis.
2. A Brief Introduction to Neutron Scattering
Smaller (subatomic) particles are often used as probes to measure the atomic level structure and dynamics. Commonly used techniques include X-ray scattering, Raman/infrared spectroscopy, and transmission electron microscopy. Compared to the above methods using photons or electrons, neutron scattering (i.e., using neutrons as the probe particles) may sound less familiar to many readers. The neutron is an elementary particle with zero electric charge, a rest mass close to that of the proton, and a magnetic moment.41 When a neutron strikes an atom, it interacts with the nucleus and can be either absorbed or scattered. Absorption, which leads to nuclear transformation and is the basis of all neutron detectors, is not of interest in the applications to be discussed here. Instead, we learn the structure and dynamics of the material from the scattered neutrons.42 The scattering can be elastic or inelastic because a neutron has mass; all scattering results in a change of direction, and hence momentum, of the neutron. There is no energy exchange for elastic scattering, and the neutrons change direction upon collision. In the case of inelastic scattering, the neutron exchanges energy and momentum with the scattering nucleus (the scatterer). The scattered neutron may gain or lose energy (Figure 1). The energy transferred from the neutron appears as the scatterer’s rotational, vibrational, or translational energy.28 The scattering can also be coherent or incoherent. Incoherent scattering measures the correlation between the positions of an atom at time zero and at a later time, with each atom contributing independently to the total scattering by simple summation. In contrast, coherent scattering describes interference between waves from the scattering of a single neutron from all nuclei—examples are the Bragg peaks seen in diffraction or the phonon dispersion seen in an inelastic scattering. In 1994, the Nobel Prize in Physics was awarded “for pioneering contributions to the development of neutron scattering techniques for studies of condensed matter” jointly to Bertram N. Brockhouse “for the development of neutron spectroscopy” and to Clifford G. Shull “for the development of the neutron diffraction technique”.43
Neutron scattering shares many similarities with X-ray scattering, but there are also significant differences. Neutrons interact with matter via the relatively weak neutron–nucleon interaction at a very short-range (∼fm). X-rays interact with matter via electromagnetic interaction, which scales with electron density. Because the atomic nucleus is only ∼1/1000th of the diameter of an atom, to a neutron, most matter is empty space. Consequently, a principal advantage of neutrons over X-rays is that neutrons are highly penetrating. This capability of neutrons ensures that the results obtained from neutron scattering are representative of the bulk. For neutron scattering, the scattering cross section is both element- and isotope-dependent, while for X-ray scattering, it is a monotonic function of atomic number.
Moreover, neutron scattering cross sections for light elements are relatively large compared to the much heavier metals. These features are illustrated in Figure 2, which indicates that 1) neutron scattering is ideal for studying catalytic systems involving light elements, mainly hydrogen, which could not be directly detected by X-rays; 2) it is possible for neutron scattering to distinguish adjacent elements in the periodic table since they may have different neutron cross sections; 3) one can use isotope labeling in a neutron scattering experiment to resolve structural or dynamical information that is otherwise inaccessible; 4) more complicated sample environment equipment can be used in a neutron scattering experiment, such as high-pressure and high-temperature sample cells made of metals, without blocking the incident/scattered beam.28,40 There are also disadvantages. Neutron sources have much lower flux than X-rays; thus, much longer data acquisition time and larger sample quantities are required. Neutrons are expensive and difficult to produce. Consequently, while X-ray-based facilities can be easily accessed, there are relatively few neutron facilities worldwide where neutron scattering experiments can be carried out.
Figure 2.

Neutron scattering cross sections of selected elements (isotopes)44 that are relevant to catalysis research.
Neutrons can be produced by fission or spallation.45 The fission approach requires a nuclear reactor, where controlled chain reactions happen in nuclear fuels (containing 235U) to release neutrons. The neutron beams produced this way are continuous (i.e., steady state) with high average flux. The spallation approach is entirely different. It uses a particle accelerator to generate a high-energy proton beam directed onto a “target” made of heavy metals such as Ta, W, or Hg. The interaction of a high-energy proton with the nucleus results in highly excited nuclear states. One of the decay mechanisms is the “evaporation” of neutrons. A significant distinction of this approach is that the beam can be easily pulsed, meaning that the protons, thus the produced neutrons, can be tuned to come in/out as pulses/packets at specific frequencies.
Most spallation sources are operated in a pulsed mode, which enables the energy or wavelength of the neutrons to be measured by time-of-flight (ToF).45 Specifically, since the emission of the neutrons is pulsed and time-stamped, one can measure the time needed for a neutron to travel from the source to the detector and then convert that to velocity and thus energy or wavelength. Modern spallation sources have high peak flux, brightness, and efficiency. A history and locations of neutron sources are presented in Figure 3,46 which also highlights some of the currently running spallation sources including ISIS47 in the UK, J-PARC48 in Japan, and SNS49 in the US. There are also newer spallation sources shown in Figure 3, including the China Spallation Neutron Source (CSNS)50 that has recently been commissioned, as well as the European Spallation Source (ESS)51 and the Second Target Station (STS)52 of SNS that are presently being built/designed.
Figure 3.

(Top) Evolution of thermal-neutron sources (reactor-based and spallation). Adapted with permission from ref (46). Copyright 2006 AIP Publishing. (Bottom) The location of neutrons sources around the world. Those marked in red are spallation sources, and the rest are reactors. Detailed information about the neutron sources can be found in Table S1 in the Supporting Information.
In a neutron scattering experiment (assuming the incident neutron flux is fixed), the scattering intensity (the number of scattered neutrons) depends on three variables: the cross section of the scattering atom (the scatterer), the number of scattering atoms in the neutron beam, and the atomic positions and displacements due to vibrations. The scattering intensity is expressed by the scattering law and can, in principle, be calculated rigorously, assuming all the above information is known.40,42 Since the atomic structure and dynamics, which are often the goal of a neutron scattering experiment, can be difficult to extract directly from the experimental data, an atomistic model (or a series of models) is often used to simulate the neutron scattering data, compare with experiment, and then help to interpret the data and obtain insight. For example, when analyzing the complicated diffraction pattern measured on a disordered or nanomaterial, the reverse Monte Carlo method53,54 is often used to search for a structural model that can reproduce the total scattering intensities. When assigning the peaks observed in an inelastic neutron scattering experiment, lattice dynamics or molecular dynamics based on density functional theory55−57 is a widely used tool to find the structural or dynamical origin (e.g. physical adsorption, chemical reaction, or phase instability) behind the experimental observations.58−62 In addition to the commonly used software packages for atomic simulations, tools have been developed to bridge neutron scattering experiments and atomistic models.54,58,59,61−64 Nowadays, advanced computing and simulation play an increasingly important role in analyzing and interpreting neutron scattering data.
3. Neutron Spectroscopy of Catalysis
Neutron vibrational spectroscopy (NVS), i.e., INS, has dominated the use of neutron techniques for heterogeneous catalysis research thanks to its distinct sensitivity to hydrogen and its involvement in many catalytic reactions. This section will start with an introduction of neutron spectroscopy fundamentals, followed by an overview of applications of NVS for studying different hydrogen and hydrogen-containing species from adsorption and reactions, and a few case studies of other light elements such as oxygen- and nitrogen-containing species in catalysis. For the convenience of the readers, representative examples of the catalysts, adsorbates, and reaction species studied by INS are briefly summarized in Table S2.
3.1. Introduction to Neutron Spectroscopy
INS can be considered the neutron analog of Raman and infrared spectroscopy. Instead of using photons as the probing beam, a neutron beam is directed onto the sample. When INS occurs, one can determine molecular excitations (corresponding to vibrational modes) from the energy loss/gain spectra. INS and Raman/infrared spectroscopy are highly complementary, as summarized in Table 1 and illustrated in Figure 4.
Table 1. Unique Capabilities of INS That Make It an Ideal Complementary Technique to Conventional Raman and Infrared Spectroscopya.
| NVS (INS) | Raman/Infrared spectroscopy |
|---|---|
| Measures dynamics of nuclei (direct) | Measures response of electrons (indirect) |
| Not restricted by selection rules, can detect Raman/infrared-inactive modes | Selection rules apply |
| Great sensitivity to H | Cannot always detect H |
| High penetration (bulk probe) | Lower penetration degree (surface + bulk) |
| Easy access to low energy range (librational and translational modes) | Low energy cutoff usually applies (especially for infrared spectroscopy) |
| Q trajectories in the (Q, ω)* map; averaging over the Brillouin zone | Γ point (Brillouin zone center) only |
| Intensity weighted by neutron scattering cross section | Intensity weighted by change in polarizability or dipole moment |
| Easy to simulate/calculate spectra | More effort to simulate/calculate spectra |
| Weak interaction, no energy deposition in sample | Potential sample damage via heating, photochemistry etc. under laser irradiation (Raman) |
| Low sensitivity: 10–100 mg of hydrogenous sample, >1 g of non-hydrogenous material, 3–50 g of catalyst | Highly sensitive: 1–10 mg of sample, 10–1000 mg of catalyst |
Q: momentum transfer; ℏω: the energy transfer; ω: angular frequency.
Figure 4.

A comparison of the (a) infrared, (b) Raman, and (c) INS spectra measured on the same material (N-phenylmaleimide, as shown in the inset). (d) INS spectrum of N-(perdeuterophenyl) maleimide. Reproduced with permission from ref (65). Copyright 2006 Elsevier.
3.1.1. Instrumentation
For INS spectroscopy, the quantity of interest is generally the energy transfer, i.e., the difference in energy between the incident and scattered neutron. At a pulsed neutron source, the neutron time-of-flight (ToF) is recorded and then converted to energy. There are two modes of operation of a ToF neutron spectrometer: direct geometry and indirect (or inverted) geometry.45 In a direct geometry spectrometer (DGS), the incident neutron beam is chopped by a Fermi chopper to select the initial speed/energy. The sample then scatters the monochromatic beam in different directions with different energy loss/gain. An array of detectors is then used to capture the scattered neutrons and record their positions (scattering angle) and total ToF from the neutron source. Since the incident energy is fixed and known, the initial ToF from source to sample can be calculated. Thus, the ToF on the secondary path (between sample and detector) can be derived, from which the final energy can be calculated. The neutrons are histogrammed by their energy transfer, adequately normalized, and the INS spectrum is obtained. This mechanism is illustrated in Figure 5. ToF methods can also be used at continuous sources such as reactors or the Swiss Spallation Neutron Source (SINQ).66 The MAPS, MERLIN, and MARI instruments at ISIS, ARCS, and SEQUOIA at SNS are examples of DGSs at pulsed sources. Panther (and its predecessor IN4) at the ILL and DCS at NIST are examples of DGSs at continuous sources.67,68 Both of these instruments require complex chopper systems to convert a steady state beam into a pulsed beam. They are also both on thermal sources, so have a maximum energy transfer of ∼1000 cm–1.
Figure 5.

Working mechanism of a DGS. (a) Distance–time plot of the neutrons. L1 is the length of the primary flight path from the moderator to the sample, and L2 is the length of the secondary flight path from the sample to the detector. (b) the measured INS spectrum derived from (c) after conversion of ToF to energy transfer. (c) the raw ToF spectrum.
An indirect geometry spectrometer (IGS) is the opposite. The incident beam is a white neutron beam consisting of neutrons of a wide range of speed/energy, typically ∼0–1500 meV or higher. A crystal analyzer reflects the scattered neutron beam at a particular reflection angle, by which Bragg’s law selects neutrons with specific wavelengths (thus speed/energy). The reflected beam is then passed through a filter that scatters and absorbs the higher-order reflections, leaving only neutrons with a fixed final energy to reach the detector. This mechanism is illustrated in Figure 6.
Figure 6.

Working mechanism of an IGS. (a) Distance–time plot of the neutrons. L1 is the length of the primary flight path from the moderator to the sample, and L2 is the length of the secondary flight path from the sample to the detector. (b) The measured INS spectrum derived from (c) after conversion of ToF to energy transfer. (c) the raw ToF spectrum.
At a steady state source, an IGS is somewhat different to that at a pulsed facility. In this case, the instruments are simplified versions of the first type of inelastic spectrometer: the triple axis spectrometer (TAS) invented by Bertram Brockhouse in 1952.43,69 A TAS consists of three elements: (i) a monochromator for the incident beam, (ii) the sample, and (iii) a monochromator in the scattered beam. This results in an instrument that, in principle, can access any point in (Q,ω) space. However, because it is a point-by-point method it is very slow and the use of two monochromators means that the detected flux is very low. It was realized very early on that replacing the second (analyzing) monochromator by a beryllium filter would greatly increase the detected flux. This type of instrument was installed at NIST (BT4) and the ILL (IN1-BeF) in the late 1970s and for many years were the workhorses of INS of catalysts (see Section 3.2.6). Both instruments have been upgraded: BT4 to FANS and IN1-BeF to Lagrange.70,71 Lagrange is unusual for a spectrometer at a reactor, in that it views a hot source (a graphite block heated to ∼2000 °C) so one can access the full 0–4000 cm–1 range. Most reactor instruments are limited to ∼1000 cm–1 because they view a thermal (i.e., room temperature) source. Lagrange is also unusual in that it uses a combination of a Be filter and a graphite analyzer to improve the resolution over that obtainable with just a Be filter as the analyzer. Presently, the most frequently used IGSs in catalysis research are TOSCA at ISIS, VISION at SNS, and Lagrange at the ILL.
DGS and IGS both have their advantages and disadvantages. Typically, a DGS offers more flexibility to cover selected regions in the S(Q,E) map, but a wider range coverage sacrifices resolution at low energy transfer. An IGS, however, can cover a wide energy range in a single scan with excellent resolution at low energy transfer. The spectra of the same sample collected at DGS and IGS are compared in Figure 7. With its wide dynamic range and good resolution in the important energy range, IGS is suitable as a generic instrument for chemical spectroscopy. If there is a specific feature of interest, the DGS can focus on that feature. Also, because DGS provides the possibility of accessing the high E and low Q area when a suppressed Debye–Waller factor is needed (such as at elevated temperature or the C–H/N–H/O–H stretch region is of interest), DGS is a better choice and thus might be more suitable for in situ catalysis studies.
Figure 7.

INS spectra of iodomethane recorded at 20 K on (a) TOSCA, (b) TOSCA × 10 ordinate expansion of the 2500–4000 cm–1 region, (c) and (d) MAPS with incident energies of 4840 and 2017 cm–1, respectively. Reproduced from ref (72). Open access.
3.1.2. Sample Environment
Apart from the choice of the spectrometer type, the sample environment (reactor cells) is also a critical factor for heterogeneous catalysis studies where the gas atmosphere, temperature, and pressure need to be controlled. Taking advantage of the high penetration power of neutrons, reactors can be made from various materials ranging from quartz to more durable variants such as steel or copper–beryllium. For example, stainless steel cells are usually used for reactions requiring high temperature and/or high pressure, where there is no need for optically transparent windows (often required in optical spectroscopy and with X-rays). Aluminum produces a lower background and is thus preferred when the reaction conditions are moderate. It is also possible to use quartz cells when it is important to be able to see the sample during the experiment (e.g., to monitor the color change). The reactor can be designed with a separate inlet and outlet for flow-through reactions or a single inlet/outlet for cyclic gas loading. When the sample is highly neutron absorbing or scattering, it is beneficial to use a flat sample holder rather than a cylindrical one. Depending on the maximum reaction temperature, the sample holders can be sealed with indium, lead, or gold wires, as well as aluminum foil or copper gaskets. Some of the reactors used at ISIS and SNS are shown in Figure 8.
Figure 8.

Various reactors used for catalysis neutron scattering experiments. (a, b) Stainless steel Swagelok reactors for flow-through and cyclic gas loading, respectively. (c) A ConflatTM stainless steel can. (d) An aluminum cylindrical can with a diameter of half inch. (e) An aluminum pressure cell that can hold pressure up to 100 bar. (f) is a vanadium cylindrical can, and (g) is an aluminum flat can. Bottom panel (h) shows a sample stick-reactor system developed at SNS for in situ catalytic reactions.
In the case of IGS, the spectral measurements typically require a very low temperature (<50 K) to suppress the Debye–Waller factor. This makes it almost impossible to carry out operando INS study of heterogeneous catalysis, as most reactions typically require above-ambient temperatures. Therefore, most catalysis studies in INS have adopted a “react and quench” approach, where the sample reactor/stick is taken out of the instrument to perform the high-temperature adsorption and reactions and then returned to the spectrometer for spectral acquisition at low temperatures without exposure to ambient atmosphere. This limitation is less of a problem for diffractometers and DGS. One of the few examples of measuring neutron spectra at reaction temperatures (in situ spectroscopy) is the room temperature CO oxidation over a model Pd catalyst investigated on the MAPS spectrometer,73 thanks to the spectrometer’s high sensitivity and ability to access low momentum transfer.
3.1.3. INS Spectral Interpretation Aided with Computational Modeling
In an INS spectrum, several features are of interest to the catalytic systems studied: scattering intensity, energy range, peak positions, peak intensity, and peak shape. The scattering intensity is proportional to the number of scattered neutrons versus the energy transferred from the neutrons to the scatterer. The INS spectrum can provide information in the low-energy region. For IGS, the lower limit is usually 10–20 cm–1; for DGS, it depends on the incident energy, and it can be as low as ∼1 cm–1. Even lower energy can be accessed with quasielastic neutron scattering. However, particularly for IGS, features in INS tend to become weak and poorly resolved above 1600 cm–1 due to multiple factors, including the neutron flux, Debye–Waller factor, and recoil. The peak positions of INS bands are signatures of a molecule’s structure and intramolecular forces that determine the atomic displacements; thus, different transitions show different intensities. In theory, the vibrational modes will be observed at the same energies in the INS, infrared, and Raman spectra (see the example shown in Figure 4). Thus, one could obtain complementary information through different types of vibrational spectroscopy. So, it is the best practice that infrared and Raman studies are carried out to obtain complementary data before the INS experiment. The INS peak intensity, the integrated area under the peak, is proportional to the amplitude of motion during the vibration. Since INS is not limited by selection rules, the shape of the INS peak shows additional structural and dynamic information. The integrated spectral intensity is also directly proportional to the total neutron scattering cross section in the beam (in the case of hydrogenous material, it roughly scales with the amount of hydrogen).28
Theoretically modeling is often required to analyze and understand the obtained INS spectrum. Neutron scattering shows the cumulative effect on the energies and numbers of the scattered neutrons of all collisions with the catalyst and any adsorbed species. The challenge is to separate the spectrum into the different scattering species using modeling. Using computer simulations, phonon information can be obtained from either quantum or classical calculations such as density functional theory (DFT) and molecular dynamics (MD). In these calculations, experimental information such as the instrument geometry, resolution, and the nature of the sample is considered. The OCLIMAX program58 developed at the VISION beamline allows one to calculate the full INS spectrum, including coherent effects and temperature effects for various INS instruments and arbitrary trajectories in the momentum and energy transfer (Q-ω) space. The models used to fit the spectrum can provide information on the vibrational modes and dynamics, and indicators of the structure of the catalysts.
3.2. INS Studies of Hydrogen-Containing Species
3.2.1. INS from Dihydrogen
A free dihydrogen (H2) molecule can be considered as a rigid quantum rotor, with its rotational energy levels expressed as E = BJ(J + 1), where J is the rotational quantum number and B is the rotational constant, which is 7.35 meV (59.3 cm–1, 1 meV = 8.066 cm–1) for H2 with an H–H distance of 0.74 Å. H2 has two spin isomers, para-hydrogen (p-H2, a singlet with spins of the two protons antiparallel to each other) and ortho-hydrogen (o-H2, a triplet with spins of the two protons parallel to each other). Due to symmetry constraints on the total wave function, rotational states with even J (0, 2, 4, ...) can only be occupied by p-H2, and rotational states with odd J values (1, 3, 5, ...) can only be occupied by o-H2. These spin isomers in hydrogen are important for neutron scattering because neutrons have 1/2 spin and scatter differently from p-H2 and o-H2. The complex interaction is best described by Fermi’s golden rule, as detailed by Young and Koppel.74 A main conclusion of this work is that excitations by neutrons from p-H2 to p-H2 (between rotational states with even J values) have very small neutron scattering cross sections compared to excitations from o-H2 to either p-H2 or o-H2. This contrasting scattering behavior is illustrated in the INS spectra of solid p-H2 and solid normal hydrogen n-H2 (a mixture of o-H2 and p-H2 at a 3:1 ratio), as shown in Figure 9. For p-H2, the strongest INS peak appears at ∼118 cm–1 (14.7 meV) corresponding to the J(0 → 1) transition. Since the cross section for the J(0 → 0) transition is negligibly small, there is almost no elastic line or phonon band (expected at ∼50 cm–1) in p-H2. In contrast, the INS spectrum of n-H2 (with 75% o-H2) exhibits a strong phonon band centered at 50 cm–1, as well as an intense elastic line.
Figure 9.

INS spectra of solid p-H2 (black) and n-H2 (red) measured at 5 K on VISION. The small elastic intensity for p-H2 is due to the aluminum sample holder.
The elastic line, translational mode, and the J(0 → 1) rotational line are all extremely sensitive to the environment surrounding the hydrogen molecule. For example, the rotational energy levels can change drastically when the hydrogen is no longer a “free” 3D rotor but is subjected to an external potential. Quantitative models have been developed to connect the type/strength of the external potential and the position, splitting, and profile of the peaks.40,75,76 These, combined with the high penetration of the neutron beam (allowing the study of H2–host interactions in bulk materials or opaque sample containers) and the ability to be quantitative (the total INS intensity scales with the amount of H2), make INS a uniquely sensitive and powerful probe to study H2, such as its adsorption and activation in porous materials and on the catalyst surface. In the following, we will show a few applications related to catalysis.
INS has been previously used to study hydrogen on (nanoparticle) metal oxides,77,78 (porous) silica,79 zeolite,80,81 carbon,82,83 and metal–organic frameworks (MOFs).75,84−86 For example, Larese et al.77 studied H2 adsorbed on the MgO(100) surface and recorded a rotational energy J(0 → 1) of 11.25 meV (90.7 cm–1) when there was less than one monolayer of H2, significantly lower than the 14.7 meV (118 cm–1) free rotor. Combined with neutron diffraction and modeling data, they confirmed that this was due to the interaction of H2 with the Mg2+ ion with an effective charge q ∼ 1, which led to a hindered, quasi-2D rotor. As H2 fully covered the surface, additional H2 with no direct interaction with Mg gave rise to a peak at 118 cm–1, consistent with free rotor behavior (Figure 10)
Figure 10.

(a) Adsorption isotherms and (b) INS spectra of p-H2 on MgO(100) surface at different loading/coverage levels. Reproduced with permission from ref (77). Copyright 2008 American Physical Society.
Hydrogen also interacts strongly with the metal sites in MOFs. In a study by Weinrauch et al.,87p-H2 was first dosed into a MOF with Cu(I) sites. Two binding sites were clearly observed, with the stronger site resulting in peaks near 5 meV (40.3 cm–1), and the weaker site having rotational excitations around 14 meV (112.9 cm–1) (Figure 11). Interestingly, when D2 was further added to the system, it preferentially binded to the strong site, displacing the H2 to the weaker site. The origin of this selectivity is associated with nuclear quantum effects and may have potential applications in selective activation or separation of H2/D2. Similar INS features indicating a strong interaction between H2 and open metal sites are also observed in other MOFs.75,85,86 On the contrary, there are also MOFs in which the metal sites are already saturated. Thus, H2 does not have direct access. In these cases, much weaker interactions between H2 and organic linkers or hydroxyl groups are expected, resulting in a rotational peak very close to the free rotor at 14.7 meV (118.6 cm–1).84
Figure 11.

INS spectra of H2/D2 adsorbed on a Cu(I) MOF. Inset highlights the strong (∼5 meV (40.3 cm–1)) and weak (∼14 meV (112.9 cm–1)) adsorption sites, as well as the displacement of H2 from the strong sites to the weak sites upon D2 addition (note that scattering from D2 is an order of magnitude weaker than that from H2). Reproduced with permission from ref (87). Copyright 2017 Nature Publishing Group.
The interaction between H2 and metals can be rather complicated, and the product can be found in a broad spectrum, as illustrated in Figure 12 by Kubas.88 Specifically, between the extremes of an H2 molecule and the metal dihydride, there can be multiple intermediate states depending on the relative strength of the interactions between the two H atoms and the metal site. A key indicator is the H–H distance, which, together with the environment-dependent hindrance experienced by the H2, will exhibit strong signatures in the INS spectra. Assignment of the peaks can lead to important information on H–H distance, nature of the complex, tunneling frequency, energy barrier, etc. In the case of W(CO)3(η2-H2)P2,88,89 the tunneling peaks can be explained by a quantum H2 rotor with an elongated H–H bond (0.82 Å) in a double-well with an energy barrier of 762 cm–1.
Figure 12.

H–H distance under various situations. Reproduced with permission from ref (88). Copyright 2007 American Chemical Society.
Silica, zeolites, and porous carbon are common catalysts or substrate materials for catalysts. Understanding their interaction with H2 is important. A study of p-H2 adsorption on Cu-ZSM-580 found that the rotational excitation J(0 → 1) exhibited a double peak with the first peak around 12 meV (96.8 cm–1) and the second peak around 14 meV (112.9 cm–1). Similar features are also observed in other porous silica or zeolite materials.79 The two peaks usually go side by side, even at very low coverage, indicating that they are not due to two adsorption sites. The integrated intensity of the first peak is about twice that of the second peak. A reasonable explanation is that the first peak is due to excitation from J0M0 to J1M ± 1 (M is the magnetic quantum number and in the free rotor has a degeneracy of (2J + 1)). In contrast, the second peak is due to excitation to J1M0. This suggests that the hydrogen is likely parallel to the surface and has a slightly reduced rotational constant (meaning a slightly compressed H–H distance).
In brief, this section summarizes the basic theory of INS from dihydrogen, as well as the applications of INS to understand the status of H2 adsorbed on different porous materials and surfaces. The strength and advantages of INS are prominent, and it is arguably the most powerful technique available to understand adsorbed dihydrogen.
3.2.2. Metal Hydrides in Ammonia Synthesis and Other Reactions
The cost of CO2 emissions in the Haber–Bosch process for ammonia synthesis has resulted in intensive efforts to find alternative catalysts.90,91 In 2000, it was reported92 that ternary nitrides Fe3Mo3N, Co3Mo3N, and Ni2Mo3N were active catalysts, particularly when doped with Cs. The materials have been studied by in situ neutron powder diffraction.93,94 Computational studies suggest two mechanisms95 are operative: one involves the direct reaction between surface-bound activated N2 and H2; in the second, H2 dissociates on a Co8 cluster and reacts with N atoms on the surface. Presumably, the role of Cs is to promote the dissociation of H2.
Recent work has shown that alkali metals or alkaline earth hydrides, combined with transition metals, are active ammonia synthesis catalysts.96 The group I and II hydrides have been comprehensively characterized by INS spectroscopy and DFT calculations,97−99 as have many ternary metal hydrides.100 These catalysts are operated in a chemical looping mode involving alternating cycles of nitrogen fixation and hydrogenation, as illustrated schematically in Scheme 1. An INS and in situ neutron powder diffraction study101 of Ni/BaH2 as a model catalyst for ammonia synthesis clearly showed the cycling between BaNH and BaH2. Such systems are ideally suited to neutron scattering, and there are clearly opportunities in this area.
Scheme 1. Proposed Mechanism for the Chemical Looping Process for Ammonia Synthesis over Ni/BaH2.
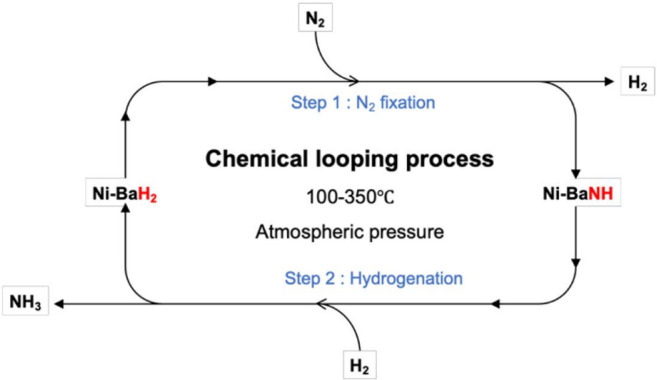
Reproduced with permission from ref (101). Copyright 2021 Springer.
A novel development in materials chemistry has been the discovery of oxyhydrides.102 The archetype is BaTiO3Hx that contains both O2– and H– ions. Several of the parent compounds have been investigated by INS.103−106 These materials have been proposed as catalysts or catalyst supports for various reactions, including ammonia synthesis,107 selective hydrogenation,108 and steam reforming of ethanol.109 The last of these has been extensively investigated by INS using a CeNixHyOz catalyst.109−112Figure 13 shows a schematic of the reaction and depiction of the active site. The INS spectra are assigned as the hydride (peak at 460 cm–1) and hydrogen chemisorbed on nanoparticulate Ni (peak at 870 cm–1).
Figure 13.

Top: schematic of ethanol reforming using a CeNixHyOz oxyhydride catalyst. Bottom: background subtracted INS spectra of CeNiXHZOY catalysts obtained after treatment in H2 at 250 °C: (a) X = 0.5 and (b) X = 1. Reproduced with permission from ref (110). Copyright 2013 Wiley-VCH.
3.2.3. Hydrogen on/in Metals
While most of the transition metals form binary hydrides of the hydrogen-in-metal type,113 albeit about half of them only do so at high pressure,114 for applications in heterogeneous catalysis, it is the formation of surface hydrides that is generally required.115 Industrially, the most important ones are Ni, Pd, Pt (hydrogenation catalysts), Fe (ammonia synthesis and Fischer–Tropsch synthesis), Co (Fischer–Tropsch synthesis), and Cu (methanol synthesis).
Hydrogen bound to a surface is difficult to detect by vibrational spectroscopy. Raman spectroscopy is usually hampered by fluorescence; infrared spectroscopy suffers from the bands being intrinsically weak and, for supported catalysts, often from a limited spectral range because of absorption by the support. The metal surface selection rule restricts both forms of spectroscopy: only modes that involve motion perpendicular to the surface are allowed.116 All these factors are irrelevant to INS spectroscopy: metals and supports are essentially transparent to neutrons (so the entire 0–4000 cm–1 range is observable), and there are no selection rules. The disadvantages of INS are that it is insensitive and usually measured at 20 K or less. INS spectroscopy requires 0.1–10 mmol H (depending on the instrument) in the beam. Generally, for metal surfaces, at best, there is a 1:1 ratio of hydrogen to surface atoms; this means that to obtain sufficient hydrogen in the beam, high surface area materials are essential. Thus, the samples are usually either supported metals, where the metal loading is at least 5 wt %, or (relatively) high surface area (10–80 m2 g–1) metals, most commonly Raney-type or metal blacks (skeletal metals). Work before 2005 is reviewed elsewhere,40 so the focus here will primarily be on work since then.
The metals that have been studied by INS are those that form surface hydrides under ambient conditions, and for this reason, almost all of the studies have been of Ni, Pd, and Pt. Hydrogen on these metals has been studied many times40 and, notably, the spectra are consistent between different groups at various institutions across the decades.
3.2.3.1. Nickel
Figure 14a shows the INS spectrum of hydrogen on Raney Ni,117 which is typical of that usually found.118 Shown in Figure 14b is the INS spectrum of hydrogen on a novel type of Ni foam catalyst.119 This evolution of the Raney process results in a highly porous, lightweight material.120 It is clear that the spectra are markedly different. In Figure 14b, there are hints of peaks at 900 and 1030 cm–1, which by comparison to Raney Ni, are assigned to hydrogen on (111) facets. The major difference is the greater intensity in the 400–800 cm–1 region. This is assigned to hydrogen on “non-(111)” facets. The intensity shows a much larger degree of surface heterogeneity in this sample than in Raney Ni. A crude estimation, based on the relative area of hydrogen on the (111) sites to the total area, would indicate that there are approximately equal numbers of (111) and non-(111) sites in the foam catalyst. In contrast, for Raney Ni, the ratio is at least 5:1, (111) to non-(111).
Figure 14.

Difference INS spectra of hydrogen on: (a) Raney Ni (blue) and (b) the Ni foam sample (red). Reproduced with permission from ref (119) under a Creative Commons Attribution 4.0 International License (CC-BY).
3.2.3.2. Palladium
Palladium is exceptional in readily absorbing hydrogen at room temperature to form the archetypal hydrogen-in-metal system.121 The stoichiometry is PdHx where 0 ≤ x ≤ 1. There are two phases, α (x ≤ 0.017) and β (0.60 ≤ x ≤ 1), and the two phases coexist in the intermediate regime. The α-phase is a solid solution of hydrogen in Pd, and the β-phase is an ordered structure.122 Ignoring imperfections, in a face-centered cubic (fcc) metal such as Pd, there are two possible sites for hydrogen to occupy: octahedral (O-site) and tetrahedral (T-site) (see Figure 15, Inset). In bulk PdH, the longer Pd–H distance of the octahedral site means that this is the preferred site for both the α- and β-phases. INS spectroscopy is consistent with this,123 as the 0 → 1 (fundamental) transition in PdH is at ∼500 cm–1, whereas in ZrH2, where the tetrahedral site is occupied,124,125 the fundamental transition is at ∼1050 cm–1 (Figure 15).
Figure 15.

INS spectra of PdH and ZrH2. Inset: the octahedral (O-site) and tetrahedral (T-site) sites available in an fcc solid. The inset is reproduced with permission from ref (125). Copyright 2016 American Chemical Society.
The hydrogenation activity of Pd is dependent on the availability of hydrogen. This is clearly seen in the Lindlar catalyst126 (5%Pd+3.5%Pb/CaCO3). This stereoselectively hydrogenates alkynes to cis-alkenes and is a key reagent in the production of vitamin A.127 INS spectroscopy shows that under 1 bar H2 pressure, the Lindlar catalyst retains 2.2 times less hydrogen than the equivalent Pd-only catalyst (5% Pd/CaCO3).128 The amount of β-PdH formed strongly depends on the catalyst morphology, which is largely determined by the support choice and synthesis conditions. This is apparent in the INS spectra of a series of carbon supported Pd catalysts129 as shown in Figure 16, and the relative areas of the region 350–800 cm–1 are shown in Table 2. The shape and intensity of the 0 → 1 transition of β-PdH at ∼500 cm–1 differ.
Figure 16.

Normalized difference INS spectra of a series of carbon supported Pd catalysts after subtraction of the same sample evacuated at 200 °C overnight. Key: sample 1 (red) Pd(20%)/activated carbon, sample 2 (blue) Pd(20%)/carbon black, sample 3 (olive) sample 2 heated to 300 °C in argon, and sample 4 (violet) sample 2 heated to 400 °C in argon. Reproduced with permission from ref (129) under a Creative Commons Attribution 3.0 Unported License (CC-BY).
Table 2. Integrated Hydrogen Areas from the IINS Spectra in Order of Increasing Average Primary Particle Sizea.
| Catalyst (sample no.) | Morphologyb | DN/nmc | Relative aread |
|---|---|---|---|
| Pd(20%)/carbon black (2) | agg | 2.40 | 1.31 |
| Pd(20%)/activated carbon (1) | prim | 3.58 | 1.00 |
| Pd(20%)/carbon black 300 °C (3) | agg/prim | 6.73 | 1.65 |
| Pd(20%)/carbon black 400 °C (4) | prim | 7.74 | 1.30 |
Reproduced with permission from ref (129) under a Creative Commons Attribution 3.0 Unported License (CC-BY).
Morphological differences according to TEM: agg = mostly aggregates, prim = mostly isolated primary particles.
Average particle size from statistical determination by TEM.
The influence of the support and the effect of alloying were also seen in a series of catalysts tested for hydrogenation of aromatic nitro compounds, a crucial step in the production of isocyanates for polyurethane manufacture.130 In the series Pd(5%)/C, Pd(4.5%)Pt(0.5%)/C, and Pd(4.5%)Pt(0.5%)Fe(5%)/C, the relative amount of hydrogen (normalized to 1 g Pd) is 4.7:3.33:1.00, respectively. This approximately correlated inversely with the activity seen in a model reaction (nitrobenzene hydrogenation): 6.6, 36.9, 23.1 mmol nitrobenzene min–1. A more detailed discussion of the influence of the support and the effect of alloying on morphology and hydrogen capacity is given elsewhere.131
At very low hydrogen concentrations, it is possible to detect surface-bound hydrogen. Figure 17a shows the INS spectrum of a Pd black after dehydrogenation at 100 °C. The key role of modeling in neutron scattering was emphasized earlier in this review. Figure 17b shows the results of a DFT calculation for the model shown in Figure 17c. The model has hydrogen in 3-fold coordination sites at the surface, which results in modes at 815/988 cm–1 (738/966 cm–1) and in subsurface sites that result in the 496 cm–1 (476 cm–1) mode (experimental values in brackets). The width of the calculated peaks is because of strong vibrational dispersion (variation of transition energy with wavevector) in the modes.
Figure 17.

(a) INS spectrum of Pd black after dehydrogenation at 100 °C, (b) calculated INS spectrum based on the model shown in panel (c). Reproduced with permission from ref (129) under a Creative Commons Attribution 3.0 Unported License (CC-BY).
While the state of the hydrogen in β-PdH has been comprehensively studied, the nature of the hydrogen at the surface has been almost completely neglected by NVS: we are unaware of any experimental studies in this area. By using an INS spectrometer that can be optimized31 to look for modes at ∼2000 cm–1, it was possible to detect a weak vibration at 2150 cm–1 that was assigned to hydrogen in the on-top site (i.e., bonded to a single metal atom).129
Differences in the activity and selectivity of α- and β-phase hydride in the selective hydrogenation of ethyne are known,132 and this may be related to the presence or not of the on-top surface site. The on-top site is undoubtedly populated under conditions where H2 gas is present, so it is likely a hitherto unrecognized participant in catalytic hydrogenations by β-PdH.
Earlier, we had stated that hydrogen occupies the O-site in the Pd bulk. Lately, this view has been challenged. Based on neutron diffraction studies of Pd nanoparticles, two groups125,133 have proposed that there is a significant occupation of the tetrahedral sites, particularly near room temperature (Figure 18 upper part). A third group134 claims to have imaged the interstitial hydrogen atoms at the near-surface region of octahedral PdHx nanoparticles by scanning TEM. The absorbed hydrogen occupies the T-site interstices near the surface, while the occupation gradually changes to the O-site in the bulk. DFT calculations show that the absorption energy difference between T-site and O-site hydrogen becomes much smaller at the subsurface than in bulk Pd and can be further reduced at the subsurface of PdH. An INS study135 found excess intensity in the spectra of nanoparticulate PdH0.42 as compared to the bulk (Figure 18 lower part) that was assigned to hydrogen in T-sites. The authors also found additional intensity around 2000 cm–1 that was not accounted for within their model and suggested that this may be surface species. This would be consistent with the earlier study.129 QENS of the same nanoparticles used for Figure 18 (lower part) showed an additional fast process not seen in the bulk, which was interpreted as jumps between T-sites.136 The O- and T-sites are energetically distinct, so they presumably have different reactivity that may influence their properties. This topic merits further investigation.
Figure 18.

Upper: temperature dependence of the fraction of the D atoms at the T-sites (nT) determined by Rietveld analysis of PdDx.125 Lower: INS spectrum of nano-PdH0.42 at 10 K.135 The difference between H adsorption in the bulk (dashed line) and the nanoparticles (solid line with error bars) is shown at the bottom of the figure as a series of Gaussian bands. These are assigned as hydrogen in T-sites. Upper image reproduced with permission from ref (125). Copyright 2016, American Chemical Society. Lower image reproduced with permission from ref (135). Copyright 2017 American Physical Society.
3.2.3.3. Platinum
In marked contrast to palladium, the hydrogen solubility in platinum is essentially zero, so the hydrogen is entirely at the surface. Hydrogen readily dissociates on platinum at room temperature, but the temperature range over which this occurs was unknown. This can be investigated by QENS. An elastic window scan of a Pt(50 wt %)/C fuel cell catalyst that was loaded with H2 at 20 K137 showed three regions: the decrease in signal in temperature below 60 K corresponded to desorption of physisorbed H2, the increase in signal in the temperature range 60–125 K was because of the dissociation of H2 and consequent binding of hydrogen to the surface. The slow decrease above 150 K was the usual behavior as the Debye–Waller factor increases. The data clearly shows that H2 dissociates on Pt over the range 60–120 K.
INS is a relatively insensitive technique, so to maximize the signal, either Pt black or high metal loading (40–60 wt % Pt) supported catalysts have been used. Improvements in instrumentation mean that 5 wt % Pt catalysts can now be studied.138−140 Remarkably, it is possible to observe both the expected Pt–H modes and molecular hydrogen physisorbed to Pt–hydride species.138
The assignment of the surface sites occupied by hydrogen on platinum has been controversial for decades.40 The INS spectra are remarkable because the overall profile is almost independent of the environment. Hydrogen on Pt black,141,142 on Pt in zeolite Y,142 on Pt on carbon,137 silica,142 or alumina supports138−140 all give essentially the same spectra. DFT calculations of hydrogen on a Pt nanoparticle141 and alumina supported Pt clusters140 have finally resolved the debate. Figure 19 shows a comparison of the INS spectrum of hydrogen on Pt black and that calculated for a Pt44H80 nanoparticle (inset in the figure). Apart from a small shift to higher energy, the calculation is in outstanding agreement with the experimental data. Calculated INS spectra can be readily decomposed into individual contributions, and Figure 19b–d shows the contributions of the on-top site, the 2-fold bridge, and the 3-fold site. No 4-fold coordinated H atoms exist because the Pt–H distance is too long. Instead, hydrogen forms 2-fold bridges around the edges of the 4-fold site, and there is a complete absence of subsurface hydrogen, consistent with the vanishingly small solubility. It had been assumed that the 3-fold site would be dominant because (111) was the lowest energy surface of Pt. This work shows that this is not the case, and the major contributor is the 2-fold site. The work on the supported clusters gave the same results: the best fit to the experimental data was a linear combination of models that mainly had 2-fold sites.140
Figure 19.

Comparison of: (a) the experimental INS spectrum of hydrogen on platinum black (olive) recorded on IN1-Lagrange with that calculated by (b) lattice dynamics (red) for the Pt44H80 nanoparticle shown in the inset. (On-top hydrogen are shown in white, 2-fold hydrogen in red and 3-fold hydrogen in yellow.) Contributions from the different sites to the total spectrum of the Pt44H80 nanoparticle: (a) on-top, (b) 2-fold, and (c) 3-fold. Reproduced with permission from ref (141) under a Creative Commons Attribution 4.0 International License (CC-BY).
One noticeable outcome of the work is that both analyses show the H:Pt ∼ 2. Hydrogen chemisorption measurements to determine the metal dispersion have always assumed H:Pt = 1. This work demonstrates that this is not a reasonable assumption.
3.2.3.4. Cobalt
Cobalt-based catalysts are becoming increasingly important for low temperature Fischer–Tropsch synthesis of long-chain hydrocarbons from syngas (H2 + CO).143−145 A key step in the reaction is the dissociation of H2 on cobalt. Surprisingly, studies by vibrational spectroscopy of hydrogen adsorbed on Co are extremely scarce. There is one comprehensive surface science study of hydrogen on Co(1010)146 and two INS studies that used Raney Co.147,148 Recent work119 has shown that both of these are flawed: bands that were assigned as Co–H modes are, almost certainly, deformation modes of hydroxyls. Distinguishing between hydroxyls and metal–hydrogen modes with the type of spectrometer (“indirect geometry”) commonly used for molecular spectroscopy is difficult. While these give excellent spectra below 2000 cm–1 (most of the INS spectra shown in this review were recorded with this type of spectrometer), their design means that data in the C–H/N–H/O–H stretch region (2500–4000 cm–1) is unreliable (as explained in more detail elsewhere31). The complementary use of a different type of spectrometer (“direct geometry”) that enables the high-energy region to be studied reliably is essential, as the presence or absence of an O–H stretch mode allows an unambiguous distinction between hydroxyls and metal–hydrogen modes.
Figure 20 shows spectra for hydrogen on Raney Co recorded with a direct geometry instrument.119 The difference spectrum (Figure 20c) shows a broad band centered at ∼880 cm–1. Crucially, the difference spectrum shows no change in the O–H stretch region on the addition of hydrogen, so the feature at 880 cm–1 cannot be hydroxyls. Comparison with the transition energies found for the high coverage phase of hydrogen on Co(1013)146 shows that the envelope encompasses the modes and that there are submaxima at, or close to, the Co–H modes found for Co(1010).
Figure 20.

INS spectra of Raney Co, all spectra recorded with a direct geometry spectrometer (MAPS). Top: Ei = 650 meV (5243 cm–1), bottom: Ei = 300 meV (2420 cm–1). (a) Dried, reduced sample, (b) sample plus 1 bar H2, and (c) the difference spectrum (a–b). The vertical bars in the lower part are the transition energies at which the Co–H modes are found for the high coverage phase of hydrogen on Co(1010). Reproduced with permission from ref (119) under a Creative Commons Attribution 4.0 International License (CC-BY).
The work showed that an oxidic and/or hydroxylated Co surface is very resistant to reduction. An extended reduction period at >250 °C is required to remove most hydroxyls. It is also clear that the clean surface is highly reactive: even very small amounts of oxygen (e.g., as found in a typical glovebox) result in the hydroxylation of the surface.
Recently, INS proved that the existence of oxygen vacancies on Co3O4 played an important role in the formation of hydride.149 The activation of H2 over Co3O4 at 250 °C formed Co–H species at 110 meV (887.3 cm–1) and Co–OH moieties evidenced by a broad feature around 80–160 meV (645.3–1290.6 cm–1). However, the activation of H2 over metallic Co did not yield features of Co–H due to the absence of Co–O and oxygen vacancies. DFT calculations indicated that H2 underwent both homolytic and heterolytic dissociation over CoO(100)–OV sites to yield hydride species.
3.2.3.5. Copper
Copper is a key component in the Cu/ZnO/Al2O3 catalyst used for the industrial manufacture of methanol.150 As discussed in more detail in the section on methanol synthesis (Section 3.3.1), copper(I) hydride, CuH, has been proposed as a hydrogen reservoir in the reaction.
CuH was the first binary metal hydride to be discovered (in 1844)151 and has been characterized by neutron diffraction152−155 and INS spectroscopy.154,155 The diffraction studies show that while the stoichiometric material can be made, it is generally nonstoichiometric, CuHx, with x ∼ 0.75. There are aqueous and nonaqueous routes to make CuHx. The resulting materials have different properties, particularly regarding solubility. A combination of total scattering neutron diffraction, INS spectroscopy, and DFT calculations showed that the products from both routes were nanoparticulate with a core of CuHx but with different surface termination: bonded hydroxyls for the aqueous routes and a coordinated donor for the nonaqueous routes.
CuHx provides a particularly clear example of how the nature of an adsorbed layer on a nanoparticle surface determines its properties. Functionalization and optimization of nanoparticles by manipulating the surface layer is a topic of considerable interest,156 as it potentially provides a means to tailor the properties of the system. INS spectroscopy is well-suited to characterize hydrogenous adlayers on nanoparticles,157 as the optical absorption that hampers conventional spectroscopy is irrelevant.
3.2.4. Hydrogen on/in Oxides
3.2.4.1. Hydride Species: H–
When exposed to H2, surface hydrides could exist on the surface of metal oxides. Generally, H– and H+ species from the heterolytic split of H2 can form a surface hydride (M–H, M is the metal cation) and a hydroxyl (OH), respectively, on nonreducible metal oxide surfaces (e.g., MgO, Al2O3, ZnO). Two hydrogen atoms (H·) from the homolytic split of H2 can reduce a reducible metal oxide surface (e.g., CeO2, TiO2) and generate two hydroxyls. The formation of surface hydrides is not limited to nonreducible metal oxides. For instance, neutron-based experiments find that a hydride could be stabilized on the surface of reducible metal oxides when surface defects are present.158 In addition to surface defects, the electronic properties (e.g., polarization of the metal–O bond, bond strength of metal–H, reducibility, band gap) of metal oxides could also affect the formation mechanism of surface hydrides.159,160 Among all metal oxides that can form hydrides from H2, CeO2 is the most intensively studied.161,162 Over CeO2, it was found that the homolytic splitting of H2 was thermodynamically favored, whereas the heterolytic pathway was kinetically preferred. The results obtained from neutron techniques showed that hydride could exist on the ceria surface, although there were debates on the formation pathway. This section will primarily focus on hydride formation on the ceria’s surface and discuss the results obtained from neutron-based techniques. Reports of hydrogen on other metal oxides (e.g., ZnO) are scarce and will also be summarized.
Using INS, Lamonier et al. observed peaks attributed to hydride species (a peak at 490 cm–1) and surface hydroxyl groups (peaks at 100, 280, and 660 cm–1) on reduced cerium–nickel oxides.163 In addition to the surface hydride and the hydroxyl, several experimental and theoretical studies suggest that −OH and M–H species can be formed in the subsurface and bulk region of ceria due to the migration of surface H adatoms. Via in situ INS spectroscopy, Wu et al. found the existence of bulk Ce–H species in addition to surface hydride after heterolytic dissociation of H2 on ceria.164 However, the −OH groups in the bulk phase of CeO2 were not detected.164 It could be that bulk hydroxyl was unstable and destabilized as the amount of oxygen vacancies increased.165 Specifically, as shown in Figure 21, three groups of peaks were detected in INS spectra. Consistent with results obtained by Lamonier et al., sharp peaks at 400–650 cm–1 (B1) were assigned to the deformation band of surface Ce–H with a possible contribution from bulk CeH3-like species. Broad peaks at 750–1100 cm–1 (B2) were attributed to the deformation band of bulk Ce–H from CeH2 and/or CeH3-like species. The combinations and/or overtones of the B1 and B2 peaks were observed at 1300–1800 cm–1.
Figure 21.

Simulated INS spectra of bulk hydride of CeH2 and CeH3 and surface hydride on reduced (111), (110), and (100) surfaces. The experimental spectra from CeO2 after H2 treatment at 400 °C and bulk CeH3 are also shown for comparison. Reproduced with permission from ref (164). Copyright 2017 American Chemical Society.
Interestingly, products derived from homolytic splitting (surface–OHs) were observed on a close-to-stoichiometric CeO2 surface. In contrast, heterolytic products (Ce–H and −OH) were detected on the CeO2 surface with oxygen vacancies.164 These experimental results suggested that oxygen vacancies participated in the formation of hydride on the surface of ceria via heterolytic splitting of H2 and the proposed pathway was: H2 + O2– + □ → OH– + H– (□ = anionic vacancy). The hydride formed on the surface of ceria via heterolytic split of H2, based on both experimental and theoretical results, could transform into hydroxyl in the presence of O2, under which the oxygen vacancies were filled, leading to the transfer of H to the lattice O, the generation of −OH, and the reduction of two Ce4+ cations.159,161,162,166 The proposed mechanism was: 2H– + O2 → 2OH–.
Apart from neutron scattering studies, recent work proposed new pathways for hydride formation over CeO2,161,167,168 with the results in general agreement with the INS results. In one pathway, the 4f electron from Ce3+ could be transferred to hydrogen on the subsurface of CeO2 with defects to form hydride species and oxidize Ce3+ to Ce4+. The process was depicted as H2 + 2Ce3+Vo → 2Ce4+Vo–H– and could occur because the energy level of the localized 4f electron of Ce3+ was relatively high.167,169 In addition, Wang et al. found that the H– species originated from H2 heterolytic dissociation can exist on various stoichiometric CeO2 surfaces, including the low-index (111) and (100) surfaces and the high-index (221), (223), and (132) ones.169 Depending on the coordination numbers of the surface Ce, the stability of Ce–H was different. Specifically, the stability of the hydride species was higher if the coordination number of the surface Ce was lower. In addition to the correlation between the stability of the hydride with the coordination numbers of the surface Ce, it was also proposed that the pairs of hydride/proton species from heterolytic dissociation of H2 were thermodynamically stable on the CeO2(100) surface.170
Neutron spectroscopy has also been applied to study hydride formation over ZnO since it was suggested that O vacancies on ZnO could promote the heterolytic dissociation of H2 and the stabilization of hydride species.171 As shown in Figure 22, several bands were observed on the INS spectrum of the H2–ZnO system. The intense band at 829 cm–1 and a strong, broad band at 1665 cm–1 were correspondingly assigned to bending and symmetric stretching modes of Zn–H from reversible dissociative adsorption of H2 on Zn–O dimers.172 The position of the symmetric stretching mode (1665 cm–1) was different from that observed by infrared spectroscopy (1710 cm–1), as the INS band was too broad to locate the center accurately. DFT calculations indicated that the 1665 cm–1 band was contributed by Zn–H species on the nonpolar surfaces and Zn surface.173 The 1125 cm–1 band was ascribed to the bending mode of −OH. According to the DFT results, the shoulder at 584 cm–1 could be attributed to the bending mode of surface bridging Zn–H–Zn species.173 However, the bridging structure (Zn–H–Zn) at 1475 cm–l detected by infrared spectroscopy could not be confirmed by INS.174 When ZnO was reduced under H2 at 20 bar, and at 300 °C, a broadband (∼500 cm–1 to ∼1250 cm–1) was observed in the INS spectrum.175 One might anticipate that hydride species contributed to this band due to the increased amount of oxygen vacancies under a highly reducible environment. However, according to simulated INS spectra, this band was most likely attributed to Zn–OH species (around 750 cm–1) rather than bulk Zn–H species (below 500 cm–1). Meanwhile, the contribution from surface Zn–H species could not be ruled out, as surface hydride species might have a band with a higher frequency than the bulk hydrides.
Figure 22.

Difference spectrum: INS spectrum of ZnO + H2, minus INS spectrum of ZnO. The symbol “+” indicates data collected using the (200) plane, and “o” those collected using the (220) plane of the copper monochromator. Reproduced with permission from ref (172). Copyright 1984 Royal Society of Chemistry.
3.2.4.2. Hydroxide Species: OH
Via different methods (e.g., hydrogen spillover), oxide hydroxides can be formed by hydrogen insertion into several metal oxides (e.g., WO3, ReO3, MO3, UO3, MoxW1–xO3, V9Mo6O40, rutile VO2).176−186 At room temperature, a low amount of H can be inserted into the structure of metal oxide (e.g., H0.34UO3) without changing the framework integrity of parent oxides.187 Higher hydrogen content could result in the formation of amorphous phases (e.g., HxV2O5, x > 3).178,188 By using INS, different types of hydroxide groups (−OH and −OH2) can be observed depending on the polymorphs and the extent of hydrogen insertion.189
In the INS spectrum of cubic H0.4WO3, an intense band at 1145–1170 cm–1 was observed and assigned to a M–O–H deformation vibration.190,191 In addition, the INS spectrum of h-H0.26WO3 showed bands at ∼1613 and ∼484 cm–1 attributed to OH2 groups. For h-H0.26 WO3, it was also proposed that H+ might exist as H3O+ in the hexagonal tunnels rather than −OH. On the other hand, for H0.92Mo0.44W0.56O3 and H1.02Mo0.70W0.30O3, it was proposed that H+ presented exclusively as −OH, as evidenced by the strong deformation band of M–O–H at 1089 cm–1. These outcomes differ from infrared spectroscopy results, which showed the existence of a hydride species (assigned to a trampoline vibration of the hydrogen atom). However, no hydride species at 690 cm–1 was detected by INS.192
For HxVO2, two intense peaks (1083 and 909 cm–1) were observed by INS and ascribed to orthogonal δ-V–OH bending modes according to calculations (Figure 23).182 For V9Mo6O40, which had alternate layers of MoO3-like and ReO3-like units, the inserted H atoms bonded with the O atoms linking edge-shared octahedral chains and constructing the square windows. INS spectra of HxV9Mo6O40 (x = 7.8 and 17.5) exhibited an intense and broad peak at ∼1081 cm–1 assigned to the combination of Mo–OH and V–OH deformation modes.176
Figure 23.

Generated atomic displacements of V3OH unit. Reproduced with permission from ref (182). Copyright 1991 Elsevier.
In the case of MoO3, when the H concentration was low (e.g., HxMoO3, x = 0.34), −OH groups existed, whereas, at high hydrogen concentrations (e.g., HxMoO3, x = 0.93, 1.68, 2.0), the hydrogen atoms tended to form −OH2 groups over bridging oxygen atoms of MoO3.191,193−197 Further reduction of MoO3 led to the attachment of H to the terminal O atoms.187 The same trend was also observed over HxUO3.189 Specifically, in the INS spectrum, the −OH deformation vibration band at 968 cm–1 was identified on H0.35MoO3.190 This band shifted to 1267 cm–1 in the INS spectrum of H0.34MoO3.191 A band around 1600 cm–1 was observed in monoclinic phases of HxMoO3 with higher H contents (e.g., x = 0.93, 1.68, 2.0) and was attributed to the H–O–H deformation vibration of the −OH2 group. The band at 1200 cm–1 was very weak in H0.93MoO3, indicating that most H existed as −OH2 rather than as the −OH group.
3.2.5. Hydrogen on/in Other Catalytic Materials
INS measurements have been applied to study the surface of sulfides, carbides, nitrides, and electrides under H2 conditions. Using INS measurements, one could study the H2 activation capability of different metals and H-containing species in the system. For instance, metal sulfides (e.g., MoS2, CoMoS2) are widely applied in the industrial hydrodesulfurization process. In studying MoS2, a band at 660 cm–1 attributed to the Mo–S–H bending mode was observed, suggesting that H2 could be activated and the chemisorbed H species was bounded to the S sites.198 However, no bands assigned to H species on Co9S8 were detected, indicating that Co sites did not function for activating H2. For ruthenium sulfide, H–S bands and two different Ru–H linear species (probably related to different Ru facets) were observed.199 The hydride species was proposed to be active in hydrogenation since it was weakly adsorbed compared with −SH. Depending on the type of metal sulfides, the position of the −SH bending mode was different: 650 cm–1 for MoS2, 694 cm–1 for WS2, 600 and 710 cm–1 for RuS2.200 For a ruthenium sulfide catalyst, it was found that the adsorption of H2 depended on the sulfur-to-metal ratio, and coordinatively unsaturated S–S anion pairs were identified as active sites for H2 adsorption.199
Metal carbides, nitrides, and phosphides are highly active in hydrogenation reactions (e.g., hydrodenitrogenation and hydrodeoxygenation). However, relevant studies about the surface H species over these materials in hydrogenation related reactions are scarce. Based on INS data, it was found that the adsorption site of H depends on the composition of the carbide. For instance, in the H2–NbCx system, peaks at 774 cm–1 for NbC0.76Hx and 524 cm–1 for NbC0.76Dx were assigned to optical vibrations of H or D atoms occupying the centers of carbon vacancies.201 On the NbC0.71H0.28 sample, an additional peak at ∼1049 cm–1 was observed, which might be related to H atoms at sites displaced from the centers of carbon vacancies. Such sites were relatively unstable, as evidenced by the significantly decreased intensity of the 1049 cm–1 peak at elevated temperatures.
INS could help determine the site for H adsorption in systems with multiple surface sites. For instance, when γ-Mo2N was exposed to H2 at elevated temperature, γ-Mo2N–Hx (0.061< x < 0.082) phases were detected.202 According to H2-temperature programmed desorption, there were at least two hydrogen binding sites on the surface of γ-Mo2N–Hx. DFT results suggested that hydrogen heterolytically dissociated on the γ-Mo2N. Surface N (κ1-NHsurf), surface Mo (κ1-MoHsurf), and interstitial Mo (μ6-Mo6Hsub) were the sites for adsorbing H. INS was employed to get detailed information on the H adsorbing sites, and several peaks were detected. Peaks at 800 and 832 cm–1 were assigned to κ1-NHsurf. Peaks at 658, 986, and 1324 cm–1 were attributed to μ6-Mo6Hsub (Figure 24), suggesting that H preferred to adsorb on the interstitial Mo sites over the surface Mo sites. It was also inferred that the subsurface H might migrate to the surface once the reactant (crotonaldehyde) had consumed the surface H species.
Figure 24.

(right axis) Normalized INS spectra for (red) γ-Mo2N and (blue) γ-Mo2N-Hx samples and their difference spectrum (black, γ-Mo2N-Hx – γ-Mo2N). (left axis) Simulated INS spectra (summed over zero to four quantum transitions). Areas in the difference spectrum showing loss upon the addition of hydrogen match the computed κ1-NH surf model (green) well. Areas showing growth upon the addition of hydrogen are consistent with a μ6-Mo6H submodel (pink). Reproduced with permission from ref (202). Copyright 2016 American Chemical Society.
By monitoring the surface species, INS can also examine if the moieties are active or spectator species. For instance, although many electrides were successfully synthesized recently and exhibited interesting catalytic properties in certain reactions (e.g., ammonia synthesis), it needed to be clarified whether the hydride species in the bulk were involved in the reactions. INS spectra and DFT calculations were combined to reveal the role of encaged hydride species on Ru/C12A7:e– under ammonia synthesis conditions.20 According to the INS spectra, the intensity of the hydride band did not change significantly when the catalyst was exposed to N2, suggesting that the hydride species in the cage was chemically stable and might not be the active species in ammonia synthesis. Instead, it was proposed that the surface-adsorbed H species was responsible for the activity of the Ru/C12A7:e– catalysts in NH3 synthesis.
3.2.6. Adsorbed Hydrocarbons on Catalyst Surfaces
This section is focused on how neutron scattering techniques can be used to interrogate catalytic systems involving hydrocarbons. Many catalytic systems connected with contemporary chemical manufacturing techniques involve hydrocarbon transformations. For heterogeneously catalyzed processes, turnover cannot occur without the adsorption step. This section reviews the phenomenon of hydrocarbon adsorption, primarily from the perspective of using INS to access the vibrational spectra of adsorbed moieties. It is informative to consider aspects of the early pioneering work in this area and to follow the topic in time when, via a combination of improved spectrometer specifications and sample environment options, increasingly more complex adsorption systems are being investigated.
INS studies of adsorption (physisorption and chemisorption) in the 1970s and 1980s tended to concentrate on olefin adsorption over various substrates. For example, in 1977, Howard and Waddington used the beryllium filter detector (BFD) spectrometer located at the Atomic Energy Research Establishment (AERE) at Harwell (UK) to examine acetylene adsorption on Ag+ exchanged 13X zeolite.203 The BFD spectrometer provided somewhat limited resolution. The authors deduced from a partial vibrational assignment that acetylene was adsorbed nonlinearly on Ag-13X. Following on from work by Jobic and co-workers on Raney platinum,204 Graham and Howard used a combination of spectrometers located at the AERE and the Institute Laue-Langevin (France) to examine the adsorption of benzene on platinum black.205 A strong coverage dependence of the spectra was reported, and the authors could deduce that the plane of the molecule was parallel to the metal surface.
In 1985 Kelly and co-workers using a triple-axis spectrometer located at the National Bureau of Standards (USA), measured the INS spectra of ethyne and ethene on Raney nickel.206 Decomposition processes were observed on thermal ramping. The vibrational spectra of the molecularly adsorbed species were obtained and compared to vibrational electron energy loss spectra obtained using a nickel single crystal. Contrasts in the spectra enabled the authors to conclude that steps and edge sites on the high surface area material exhibited a reduced activation energy for dissociation.206 In 1992, Jacqueline Nicol reviewed the topic of using INS to investigate chemisorbed hydrogenous molecules, which included an informative section on the important matter of sample environment considerations.207
Improvements in spectrometer design in the 1990s and thereabouts led to improved resolution and sensitivity, enabling a wider range of substrates to be examined. For example, Henson and co-workers used the filter difference spectrometer (FDS) located at the Los Alamos National Laboratory (USA) to investigate the adsorption of ethene on Na zeolite Y.208 McNamara and co-workers used the TOSCA spectrometer located at the ISIS Neutron Facility of the Rutherford Appleton Laboratory (UK) to examine the physisorption of ethene and propene on activated carbon that was representative of that used as a catalyst support material for dispersed metal catalysts.209Figure 25 shows the spectra of solid propene (a) compared to that of the adsorbed variant (b). Normal coordinate analysis revealed the alkene as a physisorbed, disordered layer on the carbon.209
Figure 25.

INS spectra at 20 K of (a) propene and (b) propene adsorbed on carbon. Reproduced with permission from ref (209). Copyright 2000 Royal Society of Chemistry.
A further example of INS being used to assess hydrocarbon adsorption over catalytically relevant materials is represented by the work of Beta and co-workers who examined the adsorption of furan over alkali metal cation exchanged faujasite.210 In this case, the IN1 BeF spectrometer of the ILL was used to acquire the data. Shifts in C–H stretching modes and out-of-plane C–H bending frequencies enabled the authors to address interactions between basic lattice oxygen atoms and the slightly acid C–H bonds of the furan and between the π-electron system of furan and the corresponding cation. Furthermore, the work highlighted a role for adsorption inducing several compensation effects between various furan fundamental modes.210
Given the pivotal role of methanol in contemporary and future chemical manufacturing processes, methanol adsorption over various substrates has been an active area of endeavor in recent times. INS’s ability to access a wide spectral range of powdered catalysts, often beyond that accessible via infrared spectroscopy,211 provided additional impetus to those studies. Representative examples of substrates examined are zeolite X,212 η-alumina213 and metal–organic frameworks.214 Schenkel and co-workers used the TOSCA spectrometer to investigate the adsorption of methanol on alkali metal cation exchanged zeolite X.212 The INS measurements enabled the authors to define the primary interaction of methanol and the zeolite to be the oxygen atom of the alcohol and the cations located at the ion exchange positions of the zeolite. As part of a program of work developing a new generation methyl chloride synthesis catalyst,215 McInroy and co-workers used a combination of ISIS spectrometers (TOSCA and MARI) to investigate methanol adsorption over η-alumina.213 Whereas TOSCA is an indirect geometry spectrometer with good energy resolution for transitions below ca. 2000 cm–1, MARI is a direct geometry instrument that uses a Fermi chopper to monochromate the incident neutron. This latter arrangement allows one to select an incident energy close to the vibrational transitions of interest, offering relatively high resolution over a restricted spectral range. Chemisorbed methoxy groups were identified as the only surface species present under the studied conditions.213Figure 26 confirms this deduction, where it compares the INS spectrum of a saturated overlayer of methoxy on η-alumina with that of the model compound Al(OCH3)3.
Figure 26.

INS spectra of (a) a saturated chemisorbed overlayer of methoxy on η-alumina and (b) Al(OCH3)3. Reproduced with permission from ref (213). Copyright 2005 Royal Society of Chemistry.
The industrial production of methanol is typically achieved by applying a copper-containing heterogeneous catalyst of general formula Cu/ZnO/Al2O3.150 To better understand mechanistic options accessible within this reaction system and representing an extension of the methanol adsorption work, several studies have examined the matter of formate adsorption on copper-based materials. For example, Poulston and co-workers have used INS to observe the vibrational spectrum of formate (HCOO) produced by the room-temperature adsorption of formic acid on a range of reduced and oxidized copper surfaces.216Figure 27 presents the INS spectra in the 0–2000 cm–1 region (TOSCA) for formate adsorbed on Cu2O (a), Cu metal (b), and CuO (c). Figure 27d is the spectrum of bulk anhydrous copper formate and Figure 27e is the DFT simulated spectrum for the adsorption geometry indicated by the inset. The most intense features are the out-of-plane and in-plane C–H deformation modes at 1080 and 1389 cm–1. The article additionally provided the first report of the C–H torsional mode for the surface species observed at 208–225 cm–1.216 Subsequent theoretical studies for formate adsorption on copper low index surfaces by Chutia and co-workers corroborate the INS deduced findings.217
Figure 27.

INS spectra of formate adsorbed on (a) Cu2O, (b) Cu metal, (c) CuO, (d) bulk copper formate, and (e) DFT simulated spectrum for the adsorption geometry indicated by the inset. Reproduced with permission from ref (216). Copyright 1998 Elsevier.
Recent improvements in spectrometer specification have broadened the range of systems that can be investigated. Interestingly, some of these studies are logical extensions of the work outlined in Nicol’s review.207 For example, Duong and co-workers have used the VISION spectrometer operating at the Spallation Neutron Source at the Oak Ridge National Laboratory (ORNL, USA) to identify the optimal binding of ethyne to a nitro-decorated metal–organic framework compound.218 Jones and co-workers have used the recently upgraded TOSCA spectrometer219 to use ethene adsorption on model skeletal cobalt catalysts to characterize the active site distribution.220 Reminiscent of the work of Kelley and co-workers examining adsorption on Raney nickel, the new cobalt studies revealed the presence of highly active sites that induced adsorbate dehydrogenation. In general agreement with a preceding study by Davidson and co-workers on cobalt-based prototype Fischer–Tropsch synthesis catalysts,119 as highlighted in Section 3.2.3, the sensitivity of the cobalt catalysts to surface hydroxylation was additionally noted.
In brief, the application of inelastic neutron scattering to investigate hydrocarbon adsorption is an active area of research that provides a baseline for understanding the related but more dynamic process of heterogeneous catalysis facilitating hydrocarbon reforming. Recently realized improvements in spectrometer performance, in terms of sensitivity and resolution, have enabled a wider range of reaction systems to be investigated than was previously the case.
3.3. INS Studies of Catalytic Reactions
3.3.1. Hydrogenation/Dehydrogenation Reactions
3.3.1.1. Ammonia Synthesis
Ammonia is crucial for global food production and can be used as a hydrogen storage chemical.221,222 For over a century, ammonia synthesis has been conducted by reacting H2 and N2 in the Haber–Bosch process.223 Fe-based catalysts are typically used for ammonia production; however, their low activity requires high reaction temperatures (673–773 K). At these temperatures, the reaction equilibrium favors the reactants H2 and N2; therefore, the reaction is carried out under high pressure (15–30 MPa) to obtain economically viable ammonia yields.20 Ru catalysts have shown promising reaction rates at milder conditions, but they suffer from H2 poisoning since hydrogen adsorption out-competes N2 adsorption. When Ru nanoparticles (NPs) are supported on the electride form of a mayenite structure [Ca24Al28O64]4+ (4e–) (abbreviated C12A7:e–) with solvated electrons in the cages, a highly active catalyst for ammonia synthesis is created.224 In the work by Kammert et al.,20 a combination of kinetic analysis, neutron scattering, and DFT simulations were used to understand the nature of reactive hydrogen during catalytic ammonia synthesis over Ru/C12A7:e– at ambient pressure. After conducting the ammonia synthesis reaction, ND identified the presence of deuterium, 15N or oxygen inside the electride cage. However, the neutron scattering length density of these species was very similar; thus, the species were indistinguishable using only ND. INS measurements were able to identify the species inside the cages as hydrides. The spectrum generated after conducting the ammonia synthesis reaction at 673 K (H2:N2 = 3:1) (Figure 28a) was in excellent agreement with the simulated spectrum of an encaged hydride C12A7:H– via DFT. Hydride species inside the cages were chemically very stable after various treatments (Figure 28b–d), and thus it was proposed that they played a minor role in the ammonia synthesis reaction. More hydride species could be incorporated into the electride cage at 873 K, compared with 673 K, but the hydrides incorporated at 873 K were also less stable at this temperature.
Figure 28.

INS spectra of Ru/C12A7:e– collected at 5 K after exposure to (a) 0.1 MPa 3:1 H2:N2 mixture, (b) vacuum, (c) 0.1 MPa H2, and (d) 5 cycles of 0.1 MPa N2 at 673 K. Spectra are offset for clarity. Simulated C12A7:H– spectra and measured ammonia spectra are also shown for comparison. Reproduced with permission from ref (20). Copyright 2020 American Chemical Society.
It was reported that Ru/Ca2N:e– outperformed Ru/C12A7:e– in ammonia synthesis.225 Ca2N:e– reacted with adsorbed H and formed Ca2NH species. However, it was not clear about the structure of the Ca2NH species formed in the reaction. Recent in situ neutron scattering results confirmed the formation of H-containing species on the catalysts.226 By comparing different models with the experimental spectra, it was speculated that the formed Ca2NH-like species had a segregated structure with H/N layers separated by Ca layers, instead of the traditional structure where H and N are intermixed in the anion layers.
Ni/BaH2 is a hydride-based catalyst that has been shown to catalyze ammonia production at temperatures below 373 K and ambient pressure via a chemical-looping process. This process consists of two steps: nitrogen fixation and hydrogenation, as shown in Scheme 1.227 Moon et al. used INS to evidence the consumption of BaH2 during the nitrogen fixation step via the reaction: 2BaH2 + N2 → 2BaNH + H2. Figure 29i shows the INS spectrum of the Ni/BaH2 catalyst synthesized via ball-milling, the spectra after N2 exposure (for 1 and 4 h), and the spectrum after H2 exposure. Reduction of the INS signal intensity during N2 treatment reflected the consumption of BaH2. The spectra features gained after N2 treatment resembled those of BaNH (Figure 29ii). Treatment in H2 at 573 K resulted in increased intensity of the INS spectrum due to the incorporation of H2 into the catalyst via the following reaction: BaNH + 2H2 → BaH2 + NH3. However, the structure obtained after H2 treatment did not quite resemble the initial BaH2, suggesting that BaN1–xH1+y (0 < x(y) < 1) coexisted. Thus, it is suggested that the hydrogenation step is more difficult than the nitridation step.101
Figure 29.

i) INS spectra of Ni/BaH2 before reaction, after N2 reaction for 1 and 4 h at 573 K, and after H2 reaction for 2 h at 573 K. ii) Comparison of difference INS spectrum after N2 reaction with that reported for BaNH. Reproduced with permission from ref (101). Copyright 2021 Springer.
3.3.1.2. CO2 Hydrogenation: Reverse Water–Gas Shift Reaction
Reduction of atmospheric CO2 is of paramount importance to improve the natural balance of our planet. Catalytic hydrogenation of CO2 offers an avenue to use this greenhouse gas as a carbon source to produce various chemicals. CO2 can be hydrogenated to CH4, typically done over Ni catalysts.228 INS has assisted in identifying changes in the catalyst structure and surface intermediates during this reaction. During CO2 hydrogenation to methane at 300 °C over a commercial Ni-alumina/silica catalyst (reduced in H2 at 300 °C before reaction), INS revealed the simultaneous generation of NiO (440 and 580 cm–1) and Ni–H species (∼1000 cm–1), shining light on key pieces of the reaction mechanism.229 Studying the interaction of molecules to produce CO2 and H2 also provides insights related to CO2 hydrogenation. The water–gas shift (WGS) reaction, where CO reacts with water to produce CO2 and H2, was studied by Polo-Garzon et al. over an industrial-type CuCrFeOx catalyst.230 They concluded that the “redox” mechanism was predominant. In the redox mechanism, first, CO is oxidized by surface oxygen, and H2O subsequently fills the oxygen vacancy to produce H2. In the alternative “associative” mechanism, CO and H2O come together to form an “associated” intermediate (e.g., formate) on the surface, which later decomposes into CO2 and H2. INS was used to identify such “associated” intermediate after WGS and reverse-WGS (CO2 and H2 were reactants) by comparing them with the INS spectrum of formic acid. No evidence of an “associated” intermediate was found. INS spectra also supported the existence of surface Cu–H hydride and hydroxyl species (Figure 30). This evidence, combined with IR spectroscopy, DFT simulations, temperature-programmed surface reaction, and steady-state isotopic transient kinetic analysis (SSITKA), supported the redox mechanism.
Figure 30.

INS spectra i) after WGS reaction (CO/H2O = 1) over CuCrFeOx at 350 °C for 2 h, ii) after WGS reaction over CuCrFeOx at 350 °C for 2 h followed by evacuation at 100 °C. Reference spectra for iii) hydride (on CuCrFeOx), iv) water, and v) formic acid. Reproduced with permission from ref (230). Copyright 2019 American Chemical Society.
3.3.1.3. CO Hydrogenation: Fischer–Tropsch Synthesis (FTS)
Fischer–Tropsch synthesis (FTS) is a well-established catalytic reaction system using synthesis gas (CO and H2) obtained from resources such as coal, natural gas, and biomass to produce a variety of hydrocarbon products. Several variants of the process operate around the world, with the catalysts predominantly based on Fe- and Co-containing materials.231 Whereas recent large-scale unit operations have tended to feature Co catalysts, there is an increasing interest in Fe-based catalysts, not least as they offer the opportunity to cosynthesize olefins alongside alkanes, which otherwise tend to dominate the product slate.231
Despite wide application, there remains considerable uncertainty about how FTS catalysts operate. Schulz describes “the true F-T catalyst to be “constructed” under reaction conditions in processes of self-organization”.232 Moreover, when considering possible means for investigating the F-T process, in 2003, Schulz noted the potential of neutron scattering spectroscopy to provide new information on hydrocarbon entities likely to participate in the specific process chemistry.232 Whereas analytical techniques such as Mössbauer spectroscopy, X-ray diffraction, and temperature-programmed oxidation applied to Fe-based systems characterize the catalysts in terms of solid-state chemistry (hemeatite, magnetite, iron carbides, etc.)233,234 and the presence of carbonaceous materials,235,236 INS is one of the few probes that can provide information on how hydrogen is partitioned within the catalyst matrix.37
In 2013 Hamilton and co-workers used the technique of inelastic neutron scattering (INS) to interrogate an iron-based technical grade FTS catalyst that had been extracted from Sasol’s Secunda coal-to-liquids facility located in South Africa. Following a Soxhlet extraction procedure to remove the wax and hydrocarbon product from the catalyst, the spectra presented in Figure 31A were obtained on analysis by the TOSCA spectrometer.237
Figure 31.

(A) INS spectra of postreaction FTS catalyst samples obtained from the Secunda coal-to-liquid facility that have experienced two solvent extraction regimes: (a) the toluene extracted sample; (b) toluene/CH2Cl2 extracted sample. Reproduced with permission from ref (237). Copyright 2013 Wiley-VCH. (B) INS spectra of (a) precursor α-Fe2O3 and post reaction samples after reaction with a CO/H2 mixture (1:2) at (b) 623 K and (c) 723 K. Spectra were recorded at an incident energy of 4840 cm–1. (C) INS spectra of the (a) precursor α-Fe2O3 and post reaction samples after reaction with a CO/H2 mixture (1:2) at (b) 623 K and (c) 723 K. The inset spectrum (d) is an enlargement of the 623 K (top) and 723 K (bottom) spectra between 1000 and 1600 cm–1. Spectra were recorded at an incident energy of 2016 cm–1. Reproduced with permission from ref (238). Copyright 2014 Elsevier.
The two spectra in Figure 31A are essentially identical, indicating that the spectrum obtained is not dependent on the extraction solvent used. As noted previously (Section 3.1), TOSCA provides good spectral resolution in the 20–2000 cm–1 region but experiences resolution broadening at energies >2000 cm–1, manifested in Figure 31A by unresolved C–H stretching bands about 3000 cm–1. Figure 31A represents the vibrational spectrum of the postreaction catalyst that, due to its deep black coloration, would not have been accessible via optical (e.g., infrared) spectroscopy. Upon analysis, Figure 31A could not be associated with a single molecular entity. Instead, the spectrum was attributed to a mixture of partially saturated polycyclic hydrocarbons237 that, overall, signified the presence of a hydrocarbonaceous overlayer of the form described by Webb and co-workers for various metal-based heterogeneous catalytic systems.239
To overcome the resolution broadening issue evident in the employment of an indirect geometry spectrometer such as TOSCA (Figure 31A), based on spectrometer configurations considered in Section 3.1, measurements were subsequently undertaken using the direct geometry MAPS spectrometer using distinct incident energies and chopper configurations, as outlined by Parker and co-workers.31 These and further measurements on iron-based FTS catalyst formulations utilized laboratory prepared samples, thereby avoiding the challenges and inconvenience of extracting samples from the large-scale chemical manufacturing operation. CO hydrogenation of a syngas mixture at ambient pressure and elevated temperatures to produce methane was selected as a test reaction. This arrangement avoided producing high molecular weight hydrocarbon products favored at elevated pressures, as their formation would significantly complicate the INS spectra but provides information on the critical matter of Fe/CO/H2 surface chemistry.238Figure 31B,C presents MAPS spectra obtained at respective incident energies of 4840 and 2016 cm–1. Figure 31B(a),C(a) shows the spectra of the clean, activated, in-house prepared hematite catalyst (Fe2O3); Figure 31B/C(b),(c) shows the postreaction spectra of the catalyst after exposure to an ambient pressure syngas mixture at respective reaction temperatures of 623 and 723 K.238
Figure 31B provides information on C–H and O–H stretching modes, which are otherwise undiscernible in the TOSCA spectra (Figure 31A). It also shows that the distribution of sp2 and sp3 hybridized C–H stretching modes exhibits a temperature dependence. The features in the postreaction spectra of Figure 31C are attributable to a combination of C–H deformation modes, hydroxyl deformations, and certain Fe–O transitions. Comparing the low- and high-temperature spectra, consistent with the trends evident in Figure 31B, Figure 31C(b) is largely aliphatic, while Figure 31C(c) is predominantly aromatic.238
Subsequent studies of FTS catalysis concentrated on improved catalyst preparation procedures and the development of experimental protocols, not least sample environment options.240 These developments enabled Davidson and co-workers to apply the capability of the MAPS spectrometer to explore how the INS spectra of the hydrocarbonaceous overlayer correlated with (i) the reaction profile and (ii) inspection of the catalyst matrix over the reaction coordinate by a variety of analytical techniques, such as X-ray diffraction, Raman scattering, and temperature-programmed oxidation.241
Figure 32 presents the high (a) and low (b) energy scans for the hematite catalyst as a function of time-on-stream over a period of 10 days (240 h).241 Importantly, the progressive evolution of the hydrocarbonaceous overlayer as a function of time on stream (TOS) was evident in both sets of spectra, with the overlayer form seemingly maturing at approximately 100 h. Ultimately, reflecting aspects of the complexity of iron-based FTS catalysts highlighted by Schultz,232 this novel series of measurements revealed different aspects of the complex catalyst evolutionary process to be indirectly connected with catalytic turnover. Further work is needed to better understand the interdependence of the various physical parameters and sustained FTS catalysis. Just recently, those efforts have been extended to include analysis of candidate Fischer–Tropsch to olefins catalysts.242
Figure 32.

INS spectra for a Fe-based Fischer–Tropsch catalyst after continuous exposure to syngas (CO:H2 = 1:2) at 623 K in the large-scale reactor for 0 (black), 3 (purple), 6 (yellow), 48 (red), 96 (blue), and 240 h (green): (a) incident energy = 650 meV (5243 cm–1), (b) incident energy = 250 meV (2017 cm–1). Reproduced with permission from ref (241). Copyright 2020 American Chemical Society.
3.3.1.4. Methanol Synthesis
Alcohols constitute platform chemicals for several other compounds. A particular commodity alcohol molecule is methanol, from which a variety of chemistry can be derived.243 Methanol can be synthesized from CO2 or CO hydrogenation. Cu/MgO is considered as a good CO hydrogenation catalyst, whereas Cu/ZnO is preferred for CO2 hydrogenation, making it evident that the support has a role in the catalytic cycle.244 Kandemir et al. performed kinetic tests combined with INS experiments to elucidate the key reaction intermediates for methanol synthesis using Cu/MgO or Cu/ZnO under two different feed mixtures (CO/H2 or CO2/H2).245 During the catalytic reaction using CO/H2 as feed, the evolution of the products (CO2, H2O, CH3OH) with time-on-stream was very similar for the two catalysts. INS showed that after the reaction using the CO/H2 feed, both catalysts exhibited adsorbed methoxy as a stable intermediate, and Cu/MgO also had surface hydroxyl groups on the support. When the catalysts were tested using CO2/H2 as feed, Cu/ZnO showed much higher methanol conversion than Cu/MgO, and Cu/MgO instead produced CO through the reverse-WGS reaction. This time, with the CO2/H2 feed, both spent catalysts had methoxy, formate, and hydroxyl species on the surface, identified via INS experiments. However, for Cu/MgO, hydroxyls were on the support, and for Cu/ZnO, hydroxyls were on Cu (Figure 33). This work provides unique evidence of surface species formation on the catalysts and their adsorption sites, aiding in constructing a complete picture of the reaction mechanism.
Figure 33.

(left) Difference INS spectra after methanol synthesis in CO2/H2: (a) Cu/ZnO (CZ), (b) Cu/MgO (CM), (c) reference spectrum of Cu(HCOO)2·4H2O. (right) Peaks assignment. Reproduced with permission from ref (245). Copyright 2016 Royal Society of Chemistry.
To increase the rate of CO2 conversion, removing the product methanol as it is produced can be beneficial. This can be achieved by using catalyst supports capable of adsorbing the product to a large extent. In the work by Nikolic et al., INS was used to follow the transient production of methanol, water, and dimethyl ether (DME) over a Cu/zeolite catalyst at 200 and 250 °C and various reaction times, with the catalyst capable of adsorbing reaction species. A constant “water edge” at around 66 meV (532 cm–1) in INS spectra, despite changes in the signals for methanol and dimethyl ether, showed that the generation of these products was temporally decoupled from water generation.246
3.3.1.5. Hydrogenation of Unsaturated Hydrocarbons
Hydrogenation of unsaturated hydrocarbons over heterogeneous catalysts is tightly related to the ability of the catalyst surface to dissociate the hydrogen molecule. The mechanism for this dissociation step over metal oxides that do not contain precious metals has been debated for years. INS studies combined with DFT calculations were able to show the existence of surface (>623 K) and bulk (>673 K) cerium hydride after treating CeO2 with H2, supporting heterolytic dissociation of H2 on the metal oxide (producing Ce–H and O–H). However, Ce–H species were only observed after oxygen vacancies are created on reduced CeO2.164 In a follow-up study, the role of Ce–H and O–H species for acetylene semihydrogenation was discerned by combining INS and infrared spectroscopy.247 As shown in Figure 34, surface atomic hydrogen (32 cm–1) and hydride species (surface Ce–H, 400–650 cm–1) were created on CeO2 after H2 treatment at 533 and 623 K, respectively. Upon exposure to C2D2 at 423 K (C2D2 was used instead of C2H2 to avoid the signal from hydrogen in C2H2 dominating the spectra), atomic hydrogen and hydrides were consumed to produce ethylene. Thus, atomic hydrogen and hydrides were shown to be active for acetylene hydrogenation over ceria. Infrared spectroscopy showed that when CeO2 was treated in oxygen at 673 K, the bridging OH group was the reactive H species to hydrogenate acetylene.247
Figure 34.

INS spectra of (a) CeO2 treated in H2 at 533 K and (b) CeO2 treated in H2 at 623 K before and after reaction with C2D2. The DFT calculated INS spectra of ethylene and ethane are shown in panel (c). Reproduced with permission from ref (247). Copyright 2020 American Chemical Society.
When supported metal catalysts are used for the hydrogenation of unsaturated hydrocarbons, hydrogen species can be present both on the supported NP and the support, adopting various adsorption configurations and reactivities. Yamazoe et al. studied the hydrogenation of ethylene over Pt/Al2O3 using INS, IR spectroscopy, and DFT simulations.248 An INS spectrum was simulated using a DFT model containing 10 different adsorption sites for atomic hydrogen (Figure 35a). It was found that hydrogen adsorbed on Pt sites and on the Al2O3 support as AlO–H and Al–H–Al. Adsorption of hydrogen on the support was enabled by H spillover from Pt NPs. Further, it was shown that hydrogen species, generated when ethylidyne species were created, (CH3C–Pt3) were stored on both Pt and Al2O3 surfaces. When an H-containing surface was exposed to C2H4, INS (Figure 35b) and infrared (not shown) signals were reduced, showing that perimeter Pt–H–Pt, terrace Pt–H–Pt, Pt3–H, hydride Pt–H, and atop Pt–H were active species for C2H4 hydrogenation. In contrast, edge Pt–H–Pt was not (Figure 35b). Hydrogen adsorbed on the support (AlO–H and Al–H–Al) did not react with pure C2H4 directly, but the intensity of their signal reduced in the presence of C2H4 and H2; thus, it was hypothesized that some hydrogen adsorbed on the support could migrate back to Pt sites under reaction conditions (Figure 35c).248
Figure 35.

a) Optimized structure of ten H atoms on the supercell of Pt14(Al2O3)16 (H: green, Pt: gray, Al: light blue, O: red). The adsorption sites of H atoms are shown as follows: (1) AlO–H, (2) AlO–H, (3) AlO–H, (4) bridge Al–H–Al, (5) bridge Al–H–Al, (6) terrace Pt–H–Pt, (7) edge Pt–H–Pt, (8) perimeter Pt–H–Pt, (9) 3-fold Pt3–Hfcc, and (10) 3-fold Pt3–Hhcp. b) Assignment of the experimental INS spectra. (green) 5 wt % Pt/Al2O3 with 5% H2 (He balance), (blue) 5 wt % Pt/Al2O3 with 5% C2H4 (He balance), (red) 5 wt % Pt/Al2O3 with 5% C2H4 and 5% H2 (He balance), and (black) 5 wt % Pt/Al2O3 with He. c-i) Activated H species on Pt/Al2O3 in the presence of H2. c-ii) Reaction mechanism of active H species on Pt/Al2O3 in C2H4 hydrogenation. Reproduced with permission from ref (248). Copyright 2021 Royal Society of Chemistry.
3.3.2. Hydrocarbon Conversion, Including Coking
Hydrocarbon conversion over heterogeneous catalysts represents a broad area of activity within the chemical manufacturing sector, encompassing activities as diverse as petroleum reforming, synthesis gas generation, and fine chemicals production.249 Given that all these operations involve significant quantities of hydrogen in the transformation process, they are all ideally set up for investigation by neutron scattering techniques. However, despite the apparent economic relevance of these numerous process operations, the number of studies in recent years has been surprisingly modest. Admittedly it is now slowly ramping up, with INS featuring predominantly.37 Possibly the most significant impediment to the implementation of neutron techniques in hydrocarbon conversions to date has been the matter of defining the right sample environment conditions to employ that enable a previously working catalyst (high temperature and/or high pressure operation) to be suitably examined by a neutron spectrometer (INS acquisition temperatures of ≤20 K). Following sample environment developments outlined by Nichol for hydrocarbon adsorption over skeletal metals,207 Goodman and co-workers proposed an ex situ approach to INS analysis of heterogeneously catalyzed reaction systems that essentially involved “quenching” reaction before spectral acquisition.250,251 Further sample environment refinements have subsequently elaborated on the ex situ approach.240,252
A further matter contributing to the complexity of analyzing hydrocarbon conversion reactions is the not insignificant matter of catalyst deactivation. This phenomenon can take different forms (e.g., sintering, poisoning, disruption of active sites, etc.); however, a significant feature is carbon laydown, aka “coking”. Coke formation can take various strands, with the concepts of “hard” and “soft” coke in common use.249 Whereas significant coke deposition can seriously compromise catalytic performance (e.g., via pore blocking), the ability to access the vibrational spectrum of the black and partially deactivated catalyst, which would otherwise be inaccessible via conventional optical techniques (e.g., infrared spectroscopy),211 represents a distinct advantage for INS.253 Thus, in addition to providing information on the fate of hydrogenous moieties active within heterogeneously catalyzed reaction systems, it is possible for INS to contribute in terms of catalyst deactivation pathways involving “coke”. Given the ubiquitous nature of coking in applied heterogeneous catalysis, this is no small matter. INS studies will be discussed below on methane dry reforming and methanol conversion, along with other reactions.
3.3.2.1. Methane Dry Reforming
This subsection will concentrate on INS investigations of a single reaction system as an exemplar of how a neutron spectroscopic technique (INS) can be used to interrogate an industrially relevant hydrocarbon conversion. Specifically, methane reforming over supported nickel catalysts to produce syngas (CO + H2) is an important primary reaction for the chemical manufacturing sector,254 which McFarlane and co-workers have recently examined. While most of their endeavors concentrated on the so-called dry reforming reaction (which uses CO2 as the oxidant),255−258 they also considered the matter of the steam reforming variant259 that was most typically employed in large-scale industrial operations. This section will concentrate solely on the dry reforming reaction over a specific alumina-supported nickel catalyst.258
The production of syngas via the dry reforming of methane represents an alternative to the energy-intensive steam reforming variant that uses carbon dioxide as the oxidant (CH4 + CO2 → 2CO + 2H2). The dry reforming reaction has strong environmental credentials and yields a product mixture suited to upstream processes, such as the Fischer–Tropsch synthesis of relatively high molecular weight hydrocarbons.260 Supported nickel catalysts are often utilized for steam and dry methane reforming reactions, with the latter reaction, in particular, being plagued by rapid deactivation issues compared to noble metals (e.g., Pt, Pd), as characterized by excessive carbon retention by the catalyst.261 Against this background, it is desirable to secure a better understanding of the processes that lead to diminished activity with increasing time-on-stream for representative dry reforming catalysts. An important parameter in understanding how the catalysts operate is determining how hydrogen is partitioned within the carbonaceous matrix that ultimately impedes conversion. Consequently, INS was used to investigate the degree of hydrogen retained by the catalyst after “quenching” the reaction after a fixed duration of time-on-stream.258
Figure 36 presents the INS difference spectra of a 26 wt % Ni/Al2O3 catalyst after a 6 h reaction of methane dry reforming at 898 K, where the spectrum of the clean/activated catalyst has been subtracted from the spectrum of the reacted catalyst. Thus, Figure 36 represents the vibrational spectrum of material retained at the catalyst surface. Spectral acquisition at primary energies of (a) 4840 and (b) 2017 cm–1 provides access to the C–H/O–H stretch region and the fingerprint regions of the spectrum, respectively. Figure 36a is characterized by a single weak feature centered at 3050 cm–1, which is assigned as an sp2 carbon C–H stretch mode. This feature’s poor signal: noise ratio indicates minimal hydrogen retention by the catalyst. Calibration of the C–H stretching intensity using a previously described method256 determines the number of hydrogen atoms associated with carbon atoms to be 17.4 ± 1.0 μmol H g–1(cat). The absence of any ν(O–H) features in Figure 36a is additionally noted and is attributed to the catalyst preparative procedure adopted.258
Figure 36.

INS spectra of the Ni/Al2O3 catalyst after 6 h reaction at 898 K. The spectra are difference spectra acquired using the MAPS spectrometer operating at an incident neutron energy of (a) 4840 cm–1 and (b) 2017 cm–1. Reproduced with permission from ref (258). Copyright 2013 Royal Society of Chemistry.
The spectrum of the reacted catalyst recorded at an incident energy of 2017 cm–1 (Figure 36b) is characterized by four discernible bands observed at 1410, ca. 1200, 840, and 620 cm–1. Again, the poor signal:noise ratio indicates a low concentration of hydrogen within the carbonaceous matrix. The 1410 cm–1 band is close in energy to a CH2 scissors vibration. However, there is little evidence for saturated carbon species from the ν(C–H) region (Figure 36a). Instead, this mode is assigned to a coupled aromatic C–C stretch and C–H bend. The broad band centered at 1200 cm–1 is assigned to an aromatic in-plane C–H bending mode. The band at 840 cm–1 is assigned to an aromatic out-of-plane C–H bending mode, consistent with the ν(C–H) mode observed at 3050 cm–1 (Figure 36a), although there could additionally be a contribution from a C–C stretch at 875 cm–1. The 620 cm–1 band is attributed to the sp2 carbon network deformation mode. Collectively, the spectra in Figure 36 indicate the presence of extensive polycyclic aromatic domains that are largely graphitic in nature.
Figure 37 shows a post-reaction color-coded transmission electron micrograph energy map for the Ni/Al2O3 catalyst. Dispersed nickel particles (diameter ∼36 nm) are indicated in green. The alumina support material is indicated by the oxygen signal that is colored blue. However, the standout feature of Figure 37 is the extensive red zone that represents the carbon signal. Figure 37 indicates an extensive degree of carbon laydown, which corresponds to a concentration of 44.3 ± 3.5 mmol C g–1(cat) according to temperature-programmed oxidation measurements.258 The filamentous nature of a nickel-catalyzed carbon deposition pathway is evidenced by the “hook” like structure in the top left-hand corner of Figure 37.
Figure 37.

Color-coded energy map transmission electron micrograph of the Ni/Al2O3 catalyst recorded after 6 h of reaction at 898 K and subsequent INS measurement: red = carbon, green = nickel, and blue = oxygen. Reproduced with permission from ref (258). Copyright 2013 Royal Society of Chemistry.
Critical to this multi-technique investigation, the INS measurements unambiguously establish that a sample able to sustain syngas production at elevated temperatures retains minimal quantities of hydrogen (17.4 ± 1.0 μmol H g–1(cat)), in contrast to a significantly large degree of carbon laydown (44.3 ± 3.5 mmol C g–1(cat)); corresponding to a C: H ratio of 2546:1. The INS spectra are interpreted as representing the vibrational fingerprint for a small hydrogen population that is decorating terminations of an extensive carbonaceous matrix.258 This outcome has mechanistic significance.
3.3.2.2. Methanol to Hydrocarbons
Methanol can be converted to hydrocarbons using zeolite catalysts.211,262 Although this technology has been industrially implemented, a complete understanding of the catalyst operation is yet to be attained.262 INS is particularly useful for studying the surface species on deactivated catalysts. For instance, room temperature dissociation of methanol on H-ZSM-5 zeolites was observed from INS studies.263 DME was an intermediate product in the methanol-to-hydrocarbon (MTH) process. INS studies showed that the “hydrocarbon pool” during DME conversion over ZSM-5 was similar between the deactivated sample (2–3 days of reaction) and the initial catalyst (1 day of reaction). However, the deactivated samples contained more hydrocarbon content. Further, a comparison of surface species with durene and o-xylene spectra showed that the aromatic species in the used catalysts were better resembled by o-xylene, suggesting that the aromatic species on the spent catalyst were not highly methylated. The ZSM-5 catalyst deactivated quicker with DME as a reactant than with methanol. Quicker deactivation with DME was attributed to a lower water concentration, reducing the regeneration of acid sites.211,264
The synthesis of propylene from methanol has been intensively studied due to the growing demand of propylene.265,266 In a recent study of this conversion, INS spectra showed that the adsorption of methanol on TaAlS-1 induced the significant broadening of C–O–H deformation (697, 778 cm–1) and the O–H stretch (3241 cm–1) modes of Me–OH groups while features of – CH3 group remained largely the same.267 The results suggested that methanol adsorbed on TaAlS-1 via interaction between OH and Ta(V) and Brønsted acid sites. When the reaction was carried out at 350 °C, the presence of the C–O–C scissoring mode at 422 cm–1 and the methyl torsions mode at 194 and 245 cm–1 confirmed the formation of dimethyl ether (DME) on the catalyst. At 370 °C, the existence of trimethyloxonium (TMO, umbrella mode at 365 cm–1) and the librational modes of water at 500–700 cm–1 demonstrated that TMO was formed by reaction between DME and methanol. Moreover, the features of propylene were observed, such as methyl torsion (221 cm–1), C=C–C scissoring (429 cm–1), C=CH2 rocking (916 cm–1), and C=C stretching (1644 cm–1). Based on the INS results, a catalytic cycle was established for propylene synthesis from methanol over TaAlS-1 catalysts with trimethyloxonium as the key intermediate being observed for the first time.
3.3.2.3. Other Hydrocarbon and Hydrogenation Reactions
The conversion of cyclohexanone oxime into ε-caprolactam (Figure 38a) via the Beckmann rearrangement is of great interest to the chemical industry, as ε-caprolactam is necessary for the production of Nylon-6. Optimizing zeolite catalysts to perform this reaction requires understanding the dynamic diffusion of cyclohexanone oxime through the zeolite pores and its interaction with the surface sites. The work by Potter et al.268 using QENS showed Fickian diffusion of cyclohexanone oxime through the pores of Zeolite-Y, moving freely straight through the pore, whereas the reactant moved in a jump-like manner through the pores of SAPO-37. In contrast, cyclohexanone oxime did not access the internal sites of ZSM-5. INS experiments were performed to better understand this diffusional behavior. When SAPO-37 interacted with the oxime, the intensity corresponding to the O–H stretch of the framework hydroxyls (3650 cm–1) was reduced (Figure 38b-i). When comparing the pure oxime with its adsorbed form, intensities corresponding to the O–H vibration of the oxime were reduced when it adsorbed on the surface (Figure 38b-ii). This supported that −OH functionality of the oxime interacted with the acid sites of SAPO-37, which led to a jump-like diffusion through the pores. In catalytic tests, Zeolite-Y and SAPO-37 showed the highest conversions (versus ZSM-5) due to the accessibility to the pores. SAPO-37 showed the highest selectivity (Figure 38c), indicating the importance of the interaction of the reactant with the active sites inside the pores.
Figure 38.

a) Chemical structure of cyclohexanone oxime and ε-caprolactam. b) INS vibrational spectra showing the influence of cyclohexanone oxime binding to SAPO-37. c) Catalytic results of liquid phase Beckmann rearrangement of cyclohexanone oxime over zeolites. Reproduced with permission from ref (268). Copyright 2017 American Chemical Society.
The hydrodeoxygenation of biomass-derived oxygenates to chemicals and fuels is important to global carbon neutralization.269−271 Metal catalysts are widely applied for this reaction, and the adsorption mode of oxygenates on the catalysts is crucial to the products distribution and understandings in reaction mechanisms.272,273 Neutron scattering techniques are well positioned to study the conversion of biomass-based oxygenates as many functional groups of the oxygenates contain H.
In the hydrodeoxygenation of phenol over Ru/Nb2O5, INS revealed the formation of hydrogen-containing species (Nb–OH and/or Ru–H) after reduction at 150 °C.274 Compared with the spectrum of condensed phenol, the spectrum of phenol adsorbed over catalyst surface showed that the strong adsorption restricted the motion of phenol (C6-ring). The librational modes of phenol (155–240 cm–1), C6-ring deformation, and −CH– out-of-plane wagging mode disappeared upon adsorption. Besides, the adsorption caused the deprotonation of the phenol, evidenced by the significant decrease in the intensity of the −OH bending mode at 948 cm–1. A similar change in the spectrum upon the adsorption of phenol was observed over Nb2O5 support as well. At the beginning of the reaction between the adsorbed phenol and H2, INS detected the formation of cyclohexanol (C6-ring deformation mode at 236 cm–1 and ring-conformational modes at 341 cm–1) and benzene (398 and 606 cm–1). It proved the competition between ring hydrogenation and cleavage of the C–O bond. Adsorption of the phenol on Ru/ZrO2, Ru/Al2O3, and Ru/TiO2 catalysts showed similar but weaker features compared to the Ru/Nb2O5 catalyst.
The INS spectra of tetrahydrofuran (THF) adsorbed on Pt/Nb2O5 indicated that the adsorption hindered the motion of the intact THF structure and proceeded via O(δ–) on the Nb(δ+) site.275 At the first 10 min in H2 at 130 °C, the disappearance of −CH2– twisting and internal ring deformation modes of THF at 1,244 and 1,308 cm–1 suggested the cleavage of the THF ring. Moreover, INS detected methyl torsion (245 cm–1), −CH2CH2– rocking (744 cm–1), −CH2CH2CH3 rocking (805 cm–1), and C4 chain (477 cm–1) of 1-butanoxide on the catalyst. According to the INS spectra, it was proposed that the conversion of THF proceeded through adsorption, binding, ring-opening, partial hydrogenation, and complete hydrodeoxygenation to produce butane.
3.3.3. INS Investigations of Oxidation Reactions
Oxidation or redox reactions are critical chemical transformations in making value chemicals, environment remediation, etc. Neutron scattering studies of redox reactions are relatively scarce unless hydrogen-containing species are involved. Two examples involving INS work are presented below on H2 oxidation and CO oxidation.
3.3.3.1. H2 Oxidation: H2O2 Synthesis
Propylene oxide is an important chemical for synthesizing polyurethane plastics. It is traditionally produced via a multistep process with expensive oxidants and low efficiency.276 It is more attractive to carry out the direct vapor-phase conversion of propylene to propylene oxide using molecular oxygen and hydrogen. Some catalysts, including supported Au, have shown promise in the direct route, but the mechanism still needs to be discovered. An important goal in defining the mechanistic pathway of any reaction is to determine the nature of the surface species/intermediates present under reaction conditions. Sivadinarayana et al. used INS to provide the first direct spectroscopic evidence for surface hydroperoxyl species formed during the vapor phase H2–O2 reaction over Au/TiO2.251 As shown in Figure 39, except for the band between 500 and 900 cm–1 typical of the librations of bound or adsorbed water molecules on the Au/TiO2 surface, hydrogen peroxide species were indicated by the relatively sharp band at 1230 cm–1 attributed to the δas(OOH) mode. The features between 1525 and 1600 cm–1 were assigned to a hydroperoxyl species complexed to water or possibly bound to the catalyst surface. This INS observation provided direct experimental evidence for the hydroperoxyl species proposed previously277 in the H2–O2 reaction.
Figure 39.

(Top) INS spectrum of Au/TiO2 reacted with H2 and O2 at 523 K for 4 h in flowing H2:O2:He (1:1:7). (Bottom) INS spectrum of water at 523 K adsorbed on Au/TiO2 for comparison. Reproduced with permission from ref (251). Copyright 2004 American Chemical Society.
3.3.3.2. CO Oxidation
Low-temperature CO oxidation is critical for fuel cell application by removing CO from H2 generated from methane reforming and emission control catalysis.278 Pd is among the active low-temperature catalysts for CO oxidation in which hydroxyl groups associated with Pd are essential. Although infrared and Raman spectroscopy can readily detect the OH groups, quantification of them is challenging because the intensity of each type of OH group can be affected by different electronic factors. In contrast, the INS intensity of OH modes depends only on the density of OH groups but not on their chemical nature, i.e., all OH groups have the same neutron cross section. This virtue was used to quantify the OH groups on a Ni/Al2O3 catalyst for methane dry reforming.256 Parker further took advantage of INS to investigate the role of OH groups in CO oxidation over PdO·H2O and provided the first example of a room temperature INS study of a catalytic reaction.73 As shown in Figure 40A, the INS spectra recorded for PdO·H2O in situ at 25 °C under flowing He/CO(5%) at different times showed the gradual decrease of characteristic modes of hydroxyls (bending mode at 936 cm–1, bending mode overtone at 1850 cm–1, O–H stretch at 3450 cm–1) with the gradual increase of modes from water (librational bands at 300–600 cm–1, H–O–H scissors at 1600 cm–1, and O–H stretch at 3450 cm–1). To improve sensitivity, INS spectra collected at 5 K were shown in Figure 40B, along with the difference spectrum between prior- and postreaction of CO oxidation over PdO·H2O. Interestingly, the difference spectrum showed that the total number of O–H oscillators was unchanged, even though the number of hydroxyls and water molecules had decreased and increased, respectively. The author rationalized the observations as hydroxyls were converted to water. Thus, the reaction was stoichiometric in hydroxyls rather than catalytic: CO + 2OH → CO2 + H2O.
Figure 40.

(A) INS spectra of PdO·H2O under flowing He/CO(5%) (100 cm3 min–1) at 25 °C at different times (T, hours : mins). (a) T = 00 : 00 (blue) and T = 21 : 08 end of run (magenta). Difference spectra (all ×4 ordinate expanded relative to (a)) generated by subtraction of the T = 00 : 00 spectrum from that at time T, (b) T = 00 : 32, (c) T = 01 : 08, (d) T = 02 : 18, (e) T = 21 : 08, end of run. Spectra recorded at 25 °C. (B) INS spectra of PdO·H2O before (red) and after (blue) reaction with CO(100%) at 25 °C. The difference spectrum (magenta) is shown ×4 ordinate expanded. Positive-going bands correspond to an increase in the species, and negative-going bands to a decrease. Spectra recorded at 5 K. Reproduced with permission from ref (73). Copyright 2011 Royal Society of Chemistry.
Last but not least, this work is of particular significance because it demonstrates that it is possible to use INS to study a working catalyst in real time at ambient temperature for the first time. This is only possible because of the high sensitivity and the ability to access low momentum transfer offered by the direct geometry spectrometer (MAPS).
3.4. INS Studies of Oxygen- and Nitrogen-Containing Species
While neutron scattering is especially suited to study hydrogen, it can also be used to study other light elements such as oxygen and nitrogen. Although 1 order of magnitude lower than that of hydrogen, the neutron scattering cross section of oxygen or nitrogen is still comparable to other common elements found in catalysts such as transition metals44 (unlike for X-rays where scattering from transition metals overwhelms that of the light elements). This makes INS potentially valuable for studying catalytic processes associated with oxygen/nitrogen-containing (and non-hydrogen-containing) species. However, due to the comparably weaker scattering from O and N and limited neutron flux, a larger specific surface area is usually required for direct observation. An alternate approach is to measure the influence of the oxygen/nitrogen species on a hydrogen-containing surface (i.e., indirect observation).
In a study of CO2 interaction with nanoporous functionalized carbon (labeled as C-AO), INS was used to observe CO2 adsorption and its reaction with the surface groups to form H2O.279 Specifically, the presence of solid-like CO2 was observed in the unreacted sample (black curve in Figure 41), as indicated by the signature bending peak at 80 meV (645 cm–1). After heating to room temperature and holding for 1 h to allow for reaction, CO2 was consumed, as shown by the lower intensity in the red curve. In the meantime, the signal from water/ice was observed (librational edge near 67 meV (540 cm–1)). Also noted was the much-reduced translational band of CO2 (between 5 and 20 meV (40 and 161 cm–1)), indicating that the CO2 in the system was much less solid-like. In addition, compared to bulk ice, the librational edge of the reaction product had a blue-shift, which could be resulted from confinement from its adsorption environment. Before the reaction, the blank catalyst (C-AO) was also characterized with INS, and the spectrum in the inset of Figure 41 was consistent with terminating sp2 C–H bonds.
Figure 41.

Difference INS spectra before and after CO2 dosing in C-AO, in comparison with the reference spectra for bulk solid CO2 and H2O. The signal from the background and the blank C-AO has been subtracted. The inset shows the INS spectrum of the blank C-AO before dosing. Reproduced with permission from ref (279). Copyright 2016 Elsevier.
In another study,280 a MOF (MFM-520) was found to adsorb NO2 and subsequently catalyze the reaction of NO2 to HNO3 (2NO2 + H2O + 1/2O2 → 2HNO3). It thus had great potential for air purification and converting the pollutant into valuable chemicals. INS was used to study the nature of the interaction between NO2 and the MOF. In this case, the focus was the effect of NO2 adsorption on the spectrum of the MOF since the INS signal from NO2 itself was negligibly small compared to the signal from the MOF. By comparing the experimentally measured and simulated difference spectra (i.e., the spectrum after NO2 dosing minus the spectrum before NO2 dosing) in Figure 42, one could make an assignment of the peaks and trace the origin of the changes. Specifically, changes observed for peaks I–III in the low energy region (<80 meV (645 cm–1)) correspond to deformational modes of the pyridine ring, and changes in peaks IV–VI in the high energy region (110–150 meV (887–1210 cm–1)) correspond to −CH wagging/scissoring modes. These changes were indications of direct interaction between adsorbed N2O4 and the soft −CH groups.
Figure 42.

Comparison of the experimental (black) and DFT calculated (red) difference INS spectra between bare and upon NO2-dosing MFM-520. Reproduced with permission from ref (280). Copyright 2019 Nature Publishing Group.
4. Neutron Powder Diffraction of Catalysis
4.1. Introduction to Neutron Diffraction
Powder diffraction has been widely used to study functional materials, such as catalysts and electrode/electrolyte materials for batteries and fuel cells, in the past few decades.20,281−293 Although the three-dimensional structural information is collapsed into one-dimensional form in the powder diffraction data, the easy and fast data collection and better adaptability have made powder diffraction popular in studying complex materials.294 It becomes particularly useful when high-quality single crystals are not available or where the functional materials are operating in polycrystalline forms.294 One attractive application of powder diffraction is structural studies of catalytic materials, where the catalysts are often used in powder (e.g., nanocrystalline) or thin film forms. The versatile sample environments of powder diffraction also allow the in situ/operando monitoring of structural changes during the catalytic reactions under operating conditions, such as high temperatures or flowing gas.294
Because neutrons interact (for nuclear scattering) with matter by nuclear forces instead of electromagnetic force (as for X-rays), (coherent) nuclear scattering lengths are thus isotope sensitive instead of atomic number sensitive.42 Therefore, neutron diffraction has unique advantages in revealing the structure of materials containing light elements, such as H, C, and O, which are important components of many heterogeneous catalysts.34 In many cases, it also provides good contrast that enables neighboring elements (e.g., Mn, Fe, and Cu) to be distinguished. This attribute is helpful in many multiple-element (or entropy-stabilized) catalysts.295−297 The ability to perform isotope substitutions for a particular element (of which hydrogen/deuterium is by far the most important) is one of the unique advantages of neutron diffraction relative to X-ray or electron diffraction. This allows unambiguous determination of atomic coordination environments in complex composition materials. In addition, it is also nondestructive, revealing structural information of catalysts during the catalytic reactions, without the concerns of beam damage that is a potential problem for synchrotron studies.34
4.1.1. Instrumentation and Data Analysis
Neutron powder diffractometers are built at both reactor and pulsed neutron sources. The former usually operates in the constant wavelength (CW) configuration,298,299 while the latter operates in the time-of-flight (ToF) configuration (Figure 43).300−306 In recent years, the development of accelerator-based pulsed neutron sources allows neutron powder diffraction data to be collected with unprecedented high count rates and high resolution.291,301 In addition, the latter configuration also allows complete data collection at fixed scattering angles, a feature that benefits operando/in situ diffraction measurements of catalysts during the reaction by simplifying the construction of reaction cells/vessels.281
Figure 43.

Illustration of the layout of (A) CW powder neutron diffractometer at a reactor source, and (B) ToF neutron powder diffractometer at a spallation neutron source. Only key components are drawn for simplicity.
Quantitative structure analysis of neutron Bragg diffraction data by whole pattern fitting methods, such as Rietveld refinement, provides accurate long-range structural information such as lattice parameters, atomic positions, site occupancies, and, to some extent, atomic displacements.307,308 It can also provide helpful microscopic information about powder specimens, such as mean crystallite size and microstrain.309 One particularly fruitful application of neutron powder diffraction for catalytic research is in locating the positions of light atoms, such as oxygen defects in oxides or hydrogen in metal hydrides or porous materials.102,310,311Figure 44 shows the ToF neutron diffraction patterns (from NOMAD, SNS) obtained from ceria nanocubes and ceria nanorods. Since neutron scattering is highly sensitive to oxygen, it can be used to accurately extract the location and site occupancies of oxygen. It can also be seen that the Bragg peaks are much broader for the nanorod sample relative to the nanocube sample due to the much smaller crystallite size (coherent column lengths) of the nanorods.283
Figure 44.

Rietveld refinements of the structure of prereduced ceria nanocube (A) and nanorod (B) using neutron powder diffraction data (only the high resolution back scattering bank is shown here). Frenkel type oxygen defects are included in the refinement. The increasing (and relatively high) background as a function of d-spacing can be seen in the nanorod data (B), suggesting the presence of appreciable amounts of surface hydroxyl groups in the prereduced ceria nanorod sample. Reproduced with permission from ref (283). Copyright 2021 American Chemical Society.
In a neutron powder diffraction experiment, the observed scattering intensity is the integration of the dynamic scattering function S(Q,E) through a broad bandwidth of scattered neutron energies. It is related to the instantaneous real-space atomic correlation G(r,0) by a sine Fourier transform of the scattering function in momentum transfer space.312,313 Powder neutron diffraction signals are often categorized into Bragg diffraction and diffuse scattering components. The former contains the information of the time-averaged long-range static structure, while the latter can be due to either the structure dynamics (e.g., thermal diffuse scattering) or short-range structural ordering phenomena (e.g., short-range structure distortion, chemical or magnetic ordering, etc.).314,315 Modern neutron total scattering experiments are usually carried out at spallation neutron sources,313 where the high flux of high energy epithermal neutrons can be utilized, which is critical in realizing measurements of the scattering to very high momentum transfer (e.g., >30 Å–1). Total scattering is possible at reactor sources, but the absence of high energy neutrons limits the available Q-range (and hence the real space resolution). D4 at the ILL is an exception, as this views the hot source, so it has a maximum Q ∼ 24 Å–1.
To obtain good real space resolution and realize complete structure coverage, total scattering often uses very large bandwidth wavelengths of neutrons. The neutron energies used for these studies can range from meVs to several eVs. Thus, the energy nondiscriminated measurements of total neutron scattering contain both static and dynamic information. The structure analysis of total scattering data can be either carried out in reciprocal space through modeling the diffuse scattering signal or Fourier transformed into the real space pair distribution function (PDF) data. For nanosized catalysts, total neutron scattering is a powerful tool for studying both the average bulk structure and potential surface defect structure. The volume ratio of surface/subsurface to bulk is much higher in nanomaterials than in bulk materials, making PDF an ideal tool for studying the surface and bulk structures.283,285,316 To view these different bulk and surface structure features more clearly, it is often more convenient to show the structure in real space, i.e., using the PDF method, rather than inspecting the broad diffuse signal in reciprocal space scattering data.
PDF g(r) describes the probability of finding an atomic pair at specific distances r. Therefore, it is zero at atomic distances smaller than the first atomic pair and is approaching one at very large distances (Figure 45a). There are also other forms of pair/radial distribution functions used by different communities to emphasize various aspects of the investigated structural features.317,318 For crystalline or nanocrystalline materials, a more balanced display of both short and intermediate-range structure is preferred by introducing the reduced pair distribution (Figure 45b) function G(r). The other helpful expression is the radial distribution function R(r) (Figure 45c), where the integrated peak intensity (here only for a monatomic system) represents the coordination number for the corresponding atomic pairs
Figure 45.

Different types of commonly used (neutron) pair/radial distribution functions of Si. Pair distribution function g(r) (A), reduced pair distribution function G(r) (B) and radial distribution function R(r) (C). The experimental data are shown in blue dots, calculated results from small-box modeling are shown in red, and the difference curve is shown in gray. The dotted green curve shown in (C) is the average number density of Si, which is equal to 2πr2ρ0.
4.1.2. The Development of In Situ/Operando Neutron Diffraction/PDF for Catalytic Research
The report from Ozawa and Loong is probably the earliest work using in situ neutron diffraction to study the reduction reaction of CeO2 catalysts.319 With the increases in neutron flux in modern spallation neutron sources, it has become routine to monitor the structural changes of catalysts during catalytic reactions using in situ/operando neutron diffraction and even neutron total scattering. Advanced sample environments such as gas-flowing systems or reaction (e.g., high pressure) vessels are often needed to realize these capabilities. Dedicated gas-flow systems were reported to operate in several neutron diffractometers worldwide.
One of the early gas flow systems was reported by Turner et al. (Figure 46A).320 Vanadium sample cans were used, and a thin layer of gold was deposited on the internal surfaces to prevent the oxidation of vanadium. Four separate gas lines feeding into the common mixing vessel were constructed. The gas supply line was first taken into the vanadium sample cell, and the outgoing gas was allowed to pass into the analyzing line. They also built a separate vacuum line that could be connected to each circuit. Later, an improved high-temperature gas flow cell was developed at ISIS with a quartz sample holder (Figure 46B).321 This allowed gas to flow through the cell at a much higher temperature, e.g., up to 1300 K. This system has been successfully used to study the active site of NiNa–Zeolite Y catalysts during its reaction with acetylene.18
Figure 46.

(A) Sectional view of the catalyst furnace center-stick assembly for the ISIS neutron diffraction in situ gas flow sample environment. Reproduced with permission from ref (320). Copyright 1999 AIP Publishing. (B) The schematic illustration of the new ISIS high-temperature flow through the gas cell. Reproduced with permission from ref (321). Copyright 2010 IOP Publishing Ltd.
More recently, gas-flowing/doping systems have also been developed and commissioned at SNS’s two neutron powder diffractometers. At POWGEN, an integrated automated gas environment system (AGES) was commissioned (Figure 47), which allows the control of both gas flow and temperature (up to 850 °C).322 The neutron diffraction data can be collected by concurrently measuring the effluent gas with a mass spectrometer. This system has been widely used to study fuel cell electrode/electrolyte materials, particularly concerning the potential oxygen diffusion pathways in these materials.323 It can also monitor structural transitions during solid-state chemical synthesis.324 At the NOMAD beamline, a high-precision gas flow cell with a high temperature sample environment was developed (Figure 48). This sample environment can be used for both in situ neutron Bragg and total scattering (PDF) studies under dynamic gas flow conditions. It allows fast gas switch (<425 ms) and fast gas flow rates (up to 50 mL/min).325,326 This allows a stroboscopic isotope contrast experiment to be carried out.327 This sample environment can also be used to monitor the chemical synthesis or thermal decomposition process.326 An improved version of this gas-flowing sample environment, with improved gas flow control, use of hazardous gases, and more accurate positioning of reaction cells, is currently under development at the beamline.
Figure 47.

(A) Cross section of the quartz gas doping insert. (B) Schematic of the gas outbuilding for the POWGEN gas flowing system. (C) Two gas mixing cabinets, with the hazardous gas cabinet on the left and the nonhazardous gas cabinet on the right. Reproduced with permission from ref (322). Copyright 2018 AIP Publishing.
Figure 48.

(A) Quartz sample U-tube for high temperature gas flow cells on NOMAD. (B) Image of the flow controlling apparatus on NOMAD. Reproduced with permission from refs (325, 326). Copyright 2017 and 2018 AIP Publishing.
4.2. ND Studies of Surface and Bulk Oxygen and Vacancies
Defect engineering has been proven to be an effective strategy for altering the catalytic properties of materials.328 To obtain a catalyst with desired properties, it is essential to understand how different defects regulate the structure and properties of a catalyst. In a catalytic system in the form of supported metal nanoparticles, the defects affecting catalytic events could be on the surface of metal nanoparticles or on the support surface near the active metal sites. For the latter, the most seen defect is oxygen vacancies (Ov) in oxide supports. Due to the complexity and diversity of defect structures, a combination of spectroscopic and microscopic techniques are required to identify defects, quantify their concentration, distinguish defect distribution, and determine the local structure around defects.328 Among these techniques, ND is useful for detecting surface and bulk oxygen and vacancies due to the high penetration capability of neutrons and high neutron scattering cross section of light atoms.329,330 In addition, complementary results can be obtained by performing PDF analysis on the local to the intermediate structure of nanomaterials with different types of defects or short-range chemical order.
Ceria has been heavily investigated in defect engineering due to its reducibility, involvement in redox reactions, tunable surface, and relatively strong interaction with supported nanostructures. By performing refinement of single crystal ND data collected at ambient temperature, Kümmerle and Heger et al. could determine the crystal structures of CeO1.68, Ce7O12, and Ce11O20 with ordered oxygen vacancy distributions.331 Sun et al. found that the separately prepared Cu (4.8 ± 0.6 nm) nanocrystals could reconstruct and change oxidation state after being deposited on a ceria (5.9 ± 0.7 nm) support.284 Based on the ND and PDF results, Cu (≤20 mol %) incorporation did not alter the lattice parameter of ceria. However, the interfacial restructuring occurred and was associated with the creation of surface defects on ceria, which enhanced the activity of catalysts for the water–gas shift reaction.284 As a follow-up, Sun et al. were able to introduce more defects in ceria by building surface-confined high-entropy oxide (HEO) layers.285 When comparing the series of CeO2, Cu-CeO2, CuCo-CeO2, and CuCoFeNiMn-CeO2, ND analysis suggested a similar amount of interstitial Ov in the bulk of these oxides. Taking advantage of the sensitivity of NPDF to the short- and intermediate-range structures at the nanoscale, it was shown that the transition metal substituents mostly formed a separate phase on ceria and impacted the surface density of Ov of the system. The Ce7O12 phase provided the best fit of the PDF patterns, demonstrating the enrichment of surface-confined, oxygen-deficient phases. The density of the Ce7O12-like Ov followed the sequence CeO2 (<1%), Cu-CeO2 (3.0%), CuCo-CeO2 (5.0%), and CuCoFe-NiMn-CeO2 (13.4%), this correlated with the enhanced activity of CuCoFeNiMn-ceria for the CO oxidation reaction.285 The results manifested two orthogonal strategies to modulate the amount of the bulk and surface oxygen defects in ceria. By tuning the geometric parameters such as size and shape, the bulk intrinsic interstitial Ov could be modified, as demonstrated below.283 This work shows that modulating the number of transition-metal substituents can control the extent of extrinsic, surface-confined Ov on ceria.
The oxygen defects in oxides not only form during synthesis but also respond to external environment change. By combining ND and PDF, Luo et al. revealed the nature of the surface and bulk defect sites in ceria nanocrystals (nanorod and nanocube) when annealed at high temperatures and after exposure to SO2.283 As shown in Figure 49, the surface oxygen defects were predominantly the partially reduced Ce3O5+x. The bulk defect structures were dominated by interstitial Frenkel-type Ov. Interestingly, annealing the nanorod sample at 600 °C in a vacuum, Ce3O5+x with long-range oxygen vacancy ordering was observed. In addition, upon exposure to SO2, a drastic decrease in the surface vacancies in the ceria nanocrystals was observed.283 These results suggested the dynamic evolution of oxygen defects in responding to the change in external environments. Such a change might affect the catalytic behavior of catalytic systems involving ceria supports.
Figure 49.

(a) Two-phase modeling of ceria nanorods (CeO2 with Frenkel-type defects and P2nn-type Ce3O5+x) with the numerical nanorod shape correction. The contribution from surface Ce3O5+x is highlighted in olive (shifted for clarification). The experimental data is shown in black, calculated curve in red, and difference curve in blue. The numerical approximation of the envelope function of the nanorod shape [γ0(r)] is shown in purple. (b) Schematic illustration of the small spherical Ce3O5+x nanoparticles decorating the surface of ceria nanorods (assuming that there is no interatomic interaction between these two phases). Crystal structures of the bulk fluorite CeO2 phase and the surface defect Ce3O5+x phase are shown at the bottom. Reproduced with permission from ref (283). Copyright 2021 American Chemical Society.
The investigations of dynamic characteristics of defect sites in oxides require the application of in situ techniques. Taking advantage of the large X-ray fluxes available for kinetic studies, the keen sensitivity to oxygen displacements of neutrons, and the efficiency of time-of-flight diffraction, Ozawa and Loong studied redox behavior in ceria-containing oxide catalysts.319 An analysis of the X-ray data collected under a CO/N2 atmosphere at 500–700 °C was used to characterize the reduction kinetics for CeO2 and Ce1–xLaxO2–x/2. In comparison, ND measurements on Pt-impregnated Ce0.1Zr0.9O2 under both CO/Ar and O2/Ar atmospheres up to ∼700 °C showed that Pt-impregnation accelerated the reduction of Ce4+ to Ce3+ first on the interface of the metal and oxide particles. The generated Ov subsequently migrated to the bulk of the oxide.319 Li et al. studied Ce0.8Y0.2O1.9−δ by performing in situ time-of-flight ND at 900 °C in the oxygen partial pressure pO2 range from 10–1 to 10–18 atm.332 The data showed that the lattice parameter moderately increased with decreasing pO2 in the range of pO2 > 10–14 atm, while a dramatic expansion (∼0.6%) of the fluorite structure occurred at a pO2 of 10–18 atm. In addition, an approximately linear relationship between the lattice parameter and oxygen vacancy δ was observed.332
In addition to ceria, ND has been used to study Ov on other oxides. Cox-Galhotra et al. studied the crystal structure of PrBaCo2O5+δ at high temperatures and controlled oxygen partial pressures by employing in situ ND.333 According to the results, the Ov were found localized within the Pr layer, with total oxygen stoichiometry between 5.57(1) and 5.17(2). The location of these vacancies and the anisotropic displacement of the surrounding oxygen anion sites indicated that ion transport occurred via a hopping mechanism between O sites in the Pr layer and the nearest neighbor sites in the Co layer.333 Tonus et al. investigated the chemical reduction of the K2NiF4-type oxides, Ln2Sr2CrNiO8-δ (Ln = La, Nd) and Nd2.25Sr1.75CrNiO8−δin situ under a dynamic hydrogen atmosphere at high temperatures using ND.334 The results showed that hydrogen reduction of the K2NiF4-type materials, Ln2Sr2CrNiO8−δ, proceeded via oxygen deintercalation from the (Cr/Ni)O2 layers; the occupancy of the oxygen site within the rocksalt (Ln/Sr)O layers remained unchanged throughout the heating/cooling cycle under H2-gas.334 The reduction of La2Sr2CrNiO8−δ first yielded a pure Ni(II) phase, La2Sr2CrNiO7.5, and then a mixed Ni(II,I) oxide, La2Sr2CrNiO7.40. In contrast, hydrogen reduction of Nd2Sr2CrNiO8−δ and Nd2.25Sr1.75CrNiO8−δ proceeded continuously from Ni(III) to an average oxidation state of 1.80 for the nickel ion.334 By using ND, Ozawa et al. found that at 900–1000 °C 10 mol % CuO was doped into a γ′-phase alumina, and this CuO-alumina catalyst showed a 20% lean de-NOx removal efficiency in a test using a model exhaust gas mixture of space velocity = 100,000 h–1.335 The γ → θ → α phase transformation was also observed in La-doped (1 mol %) Al2O3 powders by in situ ND from 500 to 1300 °C.336
Briefly, in this section, we demonstrate that oxides as support materials or catalytic species can be quite complex in catalysis studies: oxygen atoms and defect sites are easily affected by dopants/supported metals or by changing external environments. ND has displayed its power in studying oxygen and defects in oxides with catalytic implications as a complementary tool. The obtained results can be linked with the local structures of active species/sites and their working mechanisms.
4.3. ND of Catalyst Structural Transformations During Catalysis
ND is a powerful tool for studying the structural transformation of catalytic materials in working conditions for two reasons.287,319 First, as a bulk sensitive tool, ND can provide real-time integral information on structures such as phase compositions, domain sizes, lattice strain, and defects. Moreover, ND can give excellent diffraction patterns for highly symmetric materials as the neutron’s scattering power is independent of the diffraction angle.337 Second, due to the high penetration ability of neutrons (mm level), neutron beam interacts weakly with many materials. As a result, constructing materials of in situ/operando ND reactors can be chosen only based on the requirements of reactions. Such characteristics of neutron beams are especially important for reactions involving harsh conditions such as high temperatures and pressures. For instance, ND is one of a few available techniques that can be used to study the structure evolution of catalysts for high pressure ammonia and methanol synthesis.
4.3.1. Ammonia Synthesis and Decomposition
Ammonia is of great importance in industry. As a fertilizer, ammonia plays an essential role in the agricultural industry. It provides artificially fixed nitrogen to support the sustenance of about half of the world’s population.20 It can also be used to produce other industrial chemicals (such as polyimides, nitric acid, pharmaceuticals, refrigerants, dyes, and cleaning solutions). Moreover, ammonia is considered as an attractive candidate for hydrogen storage due to the high volumetric (121 kg H2/m3 at 10 bar) and gravimetric (17.8 wt %) hydrogen density.338−340 In this section, we will focus on both ammonia synthesis and decomposition and the applications of neutron diffraction in these two processes.
The most utilized method for ammonia synthesis is the Haber–Bosch process; its main disadvantage is that it requires large amounts of energy. Specifically, to obtain acceptable ammonia yields (18 vol%) in the exhaust gas, the conventional Haber–Bosch process needs to operate at 500 °C and 200 bar using the so-called “ammonia iron” catalyst.341 It is estimated that 1–2% of global energy is used for ammonia synthesis.93 Thus, developing new catalysts to improve the process economics for ammonia synthesis is of great research interest. Currently, representative catalysts for ammonia synthesis are based on Fe, Ru, metal hydrides (e.g., VH0.39), metal nitrides (e.g., Ni2Mo3N), and lithium hydride–transition metal (nitride).92,342−347
One question for NH3 synthesis over Fe-based catalysts is whether Fe–N phases formed in the reaction condition as the nitriding process has been observed over iron-based catalysts in NH3 decomposition.348−350 To address this question, in situ neutron diffraction was employed to study the “ammonia iron” catalyst at 425 °C and under 75 bar N2/D2 (1/3) mixture. The results showed the presence of the α-Fe phase rather than the nitridation of bulk Fe (Figure 50), suggesting that the pressure of N2 in this study was unlikely to cause the nitriding of Fe.341 It was proposed that the catalyst preparation, activation process and/or additives could influence the microstructure and subsequent stability of the α-Fe phase in the catalyst.
Figure 50.

Neutron diffraction patterns of the ammonia synthesis catalyst under different conditions. The black line indicates the fitted contribution α-Fe phase to the patterns. (Top) Reduced, initial catalyst in 4.4 bar D2 at 180 °C (the dark gray line is the profile of magnetite, peaks additionally marked by asterisks). (Top-middle) Prereaction catalyst at 425 °C under 75 bar N2/D2 = 1/3 at TOS = 0 h. (Bottom-middle) In situ reaction state at 425 °C under 75 bar syngas, which is converted to yield 12 vol % ND3 at TOS = 88 h. (Bottom) Postreaction catalyst in 75 bar Ar at room temperature. The insets show the magnification of the 200 peak of α-Fe, wherein the black asterisks mark the contribution from the Ni reactor tube. Reproduced with permission ref (341). Copyright 2013 Wiley-VCH.
Ru is one of the best monometallic catalysts for ammonia synthesis due to the optimum N2 adsorption energy.351,352 However, hydrogen atoms preferentially adsorbed on the B5 sites of Ru at low temperatures (e.g., 350 °C), and that prevented the adsorption of N2, causing “hydrogen poisoning”.351 It was found that using electride and hydride materials as supports for Ru catalysts could significantly alleviate the hydrogen poisoning effect due to the presence of anionic electrons on the catalysts in the reaction.224,225,352−355 Kammert et al. studied the structure of Ru/C12A7:e– catalysts under different environments (e.g., He, D2:N2 = 3:1, pure D2, pure N2, and D2:15N2 = 3:1) via neutron-scattering techniques (Figure 51).20 They observed an isolated D species encaged in the lattice of C12A7:e– support of Ru/C12A7:e– catalyst during the D2/N2 reaction. The encaged D species was stable in the applied environments once it formed at 673 K (Figure 51b–f) and thus unlikely to catalyze the reaction.
Figure 51.

Difference Fourier maps created from results obtained using neutron diffraction. All maps are representations of the (001) planes in C12A7:e–. Diffraction patterns were obtained at 673 K after continuous reaction under conditions in the order (a) to (f) in 0.1 MPa gas pressure: (a) He treatment for 30 min, (b) D2:N2 = 3:1 for 3 h, (c) D2 for 2 h, (d) N2 for 2 h, (e) D2:N2 = 3:1 for 2 h, and (f) D2:15N2 = 3:1 for 2 h. Note that the scale for neutron-scattering length density is the same in all maps. Reproduced with permission from ref (20). Copyright 2020 American Chemical Society.
It was reported that Co3Mo3N catalysts exhibited about two times the ammonia synthesis rate of Fe–K2O–Al2O3 at atmospheric pressure and 400 °C.356 However, the role of N in the catalyst was unclear. When using Co3Mo3C in NH3 synthesis, in situ powder neutron diffraction indicated that nitrogen gradually replaced the carbon atoms (Figure 52).93 Analysis of the postreaction samples with different techniques verified that the substitution of carbon by nitrogen proceeded until close to complete substitution, suggesting that the active species was Co3Mo3N and the origin of its high activity was correlated with lattice nitrogen. It was proposed that NH3 synthesis over Co3Mo3N catalysts followed Mars–van Krevelen mechanism with lattice nitrogen as a key surface species.
Figure 52.

Evolution of the C/N occupancy of the 16c Wyckoff lattice site in Co3Mo3C as a function of reaction time with 60 mL min–1 of 75 vol% H2 in N2 (BOC, 99.98%) at 500 °C. (▲) Fractional carbon content and (●) fractional nitrogen content as determined from the Rietveld refinement against powder neutron diffraction data. Reproduced with permission from ref (93). Copyright 2017 American Chemical Society.
The idea of using ammonia as a carrier for hydrogen delivery has gained much attention in recent years because ammonia has a number of favorable attributes including its high capacity for hydrogen storage and the strong hydrogen bonding between molecules, which makes it easier to liquefy ammonia than hydrogen. However, in order to use ammonia for hydrogen storage, one has to lower the energy input required for releasing hydrogen from ammonia because ammonia decomposition (cracking) is endothermic. Since the temperature required for efficient cracking depends on the catalyst, it is essential to develop efficient catalysts for releasing H2 from NH3 (ammonia cracking) at moderate temperature.
As alternatives to the use of rare or transition metal catalysts, light metal (e.g., Li, Na, K) imide–amide systems were studied because they showed high NH3 decomposition efficiencies over extended periods at moderate temperatures.339 It was suggested that light metal imide–amide systems possessed activity for ammonia decomposition via a cycle of decomposition and formation of the metal amide (MNH2).339,357 However, it was unclear about the reaction mechanism as the reaction conditions (e.g., ammonia flow rate, temperature) could influence the existing active phases.358 To address it, neutron powder diffraction was applied and useful information was obtained. For instance, for Na/NaNH2 system, neutron powder diffraction of postreaction samples showed that stoichiometric NaNH2 was the major phase under NH3 decomposition conditions.339 For the lithium imide catalyst, lithium-transition metal nitrides were not detected by in situ neutron powder diffraction under the reaction condition.338 Analysis revealed that the lattice parameter of the lithium imide catalyst increased when exposed to ND3 at 500 and 550 °C. The average stoichiometry of the Li2ND sample was calculated by Rietveld refinement using a continuum of stoichiometry between Li2ND and LiND2 as a single phase (Table 3). The results suggested that the lithium imide phase was converted to an intermediate phase between lithium amide and lithium imide when ND3 was introduced. The lithium imide phase was regenerated when ND3 was replaced with Ar. Adding ND3 at a higher temperature (550 °C) shifted the stoichiometry toward lithium amide to a lesser extent. Based on these results, it was proposed that nonstoichiometric lithium imide was the active phase in NH3 decomposition. A nonstoichiometric structure was also observed over a lithium–calcium imide catalyst for ammonia decomposition.358
Table 3. Refined Values for the Lattice Constant and Average Stoichiometry of Li2ND Samplea.
| Segment | Temp. (°C) | Gas | a Li2ND (Å) | p Value/Average stoichiometry |
|---|---|---|---|---|
| i | 500 | Ar | 5.174(3) | 0.002(33)/Li1.998ND1.002 |
| ii | 500 | ND3 | 5.190(5) | 0.37(3)/Li1.63ND1.37 |
| iii | 550 | Ar | 5.172(2) | 0.19(2)/Li1.81ND1.19 |
| iv | 550 | ND3 | 5.177(3) | 0.24(2)/Li1.76ND1.24 |
Reproduced with permission from ref (338). Copyright 2015 Royal Society of Chemistry.
In exploring effective catalysts, it was found that the mixture of lithium imide and transition metals/metal nitrides (e.g., Li2NH-MnN, Li2NH-FexN) exhibited higher activity than Ru catalysts for ammonia decomposition. In addition, the formation/decomposition of ternary nitrides (e.g., Li7MnN4) was proposed to account for the activity.359−362 The bulk phase behavior of Li2NH-MnN and Li2NH-FexN was investigated by in situ neutron and X-ray powder diffraction (Figure 53).362 Under NH3 decomposition conditions, only Li2NH and metallic Fe, rather than FexN, were observed in the bulk phase of the Li2NH-FexN catalyst, due to the denitriding of the Fe3–xN in the temperature range 400–500 °C.363 For the Li2NH-MnN system, Li2NH and MnN were detected at 500 °C while Li2NH and ternary nitrides (LixMn2–xN and a small proportion of Li7MnN4) existed at 550 °C. However, the Li2NH-MnN catalyst still exhibited significant activity for NH3 decomposition without the presence of bulk ternary nitride phases. Thus, a bulk ternary nitride might not be required for NH3 decomposition over lithium imide–transition metal catalysts.
Figure 53.

Results of the neutron powder diffraction experiment on lithium imide–manganese nitride. The panels show (a) the temperature of the sample and gas flow rate and composition, (b) the molar gas fractions of the various gas species monitored in the experiment, (c) a contour plot of the neutron powder diffraction with regions used for the analysis of summed diffraction data indicated with numbered, white lines, and (d) the molar composition of the sample obtained from Rietveld analysis of the diffraction data. Reproduced with permission from ref (362). Copyright 2018 Royal Society of Chemistry.
4.3.2. Methanol Synthesis from CO2/CO Hydrogenation
Lunkenbein et al. applied ND to study the phase and size changes of a Cu/ZnO/Al2O3 catalyst for methanol synthesis over different time on stream (TOS) under industrially relevant conditions (60 bar, 230 °C, syngas (8% CO2/6% CO/59% H2/27% inert)).337 As shown in Figure 54a, three Cu and Zn phases were detected at the beginning of the reaction: metallic Cu, ZnO, and a Zn, Al-spinel phase. With increasing reaction time, the phase composition of metallic Cu remained almost unchanged at 50%. The concentration of the Zn, Al-spinel phase increased from 14% to 21%, and the concentration of the ZnO phase decreased from 30% to 23% over 50 days of reaction, after which the concentration of the Zn-containing phases barely changed. The domain size of the Cu- and Zn-containing phases was also tracked with the reaction time, and differences could be observed. The domain size change occurred within 50 days of reaction for all three phases. The metallic Cu only experienced weak sintering, as evidenced by the small increase in the particle size (7.1 ± 0.2 to 9.1 ± 0.3 nm) for 148 days of time on stream whereas the domain size of the Zn, Al-spinel phase increased from 2.4 ± 0.5 to 4.2 ± 0.6 nm for the first 30 days of TOS. A significant change was observed in ZnO: the coherent scattering domain size of ZnO increased from 3.9 ± 0.7 to 9.3 ± 1.3 nm in the first 50 days of TOS. These results suggested that the ZnO phase was quite dynamic under reaction conditions. It could react with Al-oxide species forming the Zn, Al-spinel phase and aggregate into large particles. Such a dynamic change of the Zn-containing phases, combined with the time-dependent change of methanol production, was suggested to be the reason for the deactivation of the catalyst.
Figure 54.

Quantitative analysis of the ND data. a) Phase composition of Cu, ZnO, and Zn, Al-spinel of the catalysts over different TOS durations. The data were obtained by Rietveld’s refinement of the ND patterns. b) Volume weighted mean domain sizes (Lvol@IB) of the corresponding phases, calculated from the width of the reflections. Key: Cu NPs (red), ZnO (blue), Zn, Al-spinel(green). Reproduced with permission from ref (337). Copyright 2016 Wiley-VCH.
It is generally agreed that the Cu–ZnO interface plays an important role in improving methanol selectivity. With the dynamic change of ZnO (as discussed above), the surface of the Cu phase should also change due to Cu–ZnO interaction. By applying ND, Kandemir et al. also found that metallic Cu was the major phase in the Cu/ZnO/Al2O3 catalyst, and with the increase of reaction time (over 24 h), the particle size of Cu slightly increased from 5.9 ± 0.1 to 6.4 ± 0.1 nm (Figure 55).287 In addition, stacking faults were observed in the Cu phase as evidenced by the shift of the (111), (200), (222), and (400) Cu peaks from ex situ ND data.364 However, the microstructure of the Cu phase with defects was relatively stable under working conditions. Stacking fault annealing and brass formation were only observed at temperatures higher than those used in the methanol synthesis process.
Figure 55.

Rietveld fits of the catalyst before (0.1 MPa Ar, upper panel), at the beginning (center), and after 24 h of methanol synthesis (bottom) at 523 K and 6 MPa. Experimental data is shown in gray, and the calculated pattern of the catalyst as a black line. The thin gray line is the difference between the experimental and calculated patterns. The contribution of the Cu phase and ZnO is marked as red and green lines with tick marks at the positions of Bragg reflections. Additional strong peaks from the Al reactor wall were treated as peak-phase during Rietveld analysis and are excluded from the overall calculated profile shown here. Reproduced with permission from ref (287). Copyright 2013 Wiley-VCH.
4.4. NPDF of Adsorbates and Reactions
Total scattering refers to the measurement and analysis of the complete diffraction pattern, including Bragg and diffuse components.313 This is an approach frequently applied to systems that exhibit short-range order, such as amorphous glasses, liquids, or highly disordered crystals.365,366 The sensitivity of neutron scattering to light elements, particularly 1H and 2H, means that the technique is well-suited to studies of catalysts. However, it has been relatively little exploited for this purpose to date. One example is the use of the technique to directly measure metal–hydrogen distances for hydrogen adsorbed on Raney nickel and on a supported platinum catalyst.117
A recent application is the study of the platinum catalyzed hydrogenation of aromatic molecules in MCM-41. Figure 56 shows the total scattering structure factor of evacuated 3 wt % Pt/MCM-41.23 The material comprises aggregates of grains that give rise to small angle (Porod) scattering at small Q values, columnar pores of ∼33 Å that give the sharp peaks at 0.1–1 Å–1 and the usual tetrahedral silica structure that gives the peaks at 1–10 Å–1. This illustrates the technique’s power: in a single measurement, information at the microscopic, mesoscopic, and macroscopic length scales can be obtained.
Figure 56.

Total neutron scattering structure factor obtained for evacuated MCM-41 on NIMROD. In a single measurement, information about the size and shape of sample’s grains can be obtained (low Q-range), as well as unit cell size from Bragg scattering features and interatomic correlations within the sample, such as average distances between silicon and oxygen in MCM-41 (high Q-range). Reproduced with permission from ref (23). Copyright 2016 Royal Society of Chemistry.
Introduction of deuterated benzene24 or deuterated toluene23 by capillary condensation followed by exposure to D2 results in the catalyzed hydrogenation of the aromatic to perdeutero cyclohexane and perdeutero methylcyclohexane, respectively. The reaction is relatively slow at room temperature, so it can be followed in real time, as shown in Figure 57a for benzene hydrogenation. By taking cuts at particular Q values with respect to time, the kinetics corresponding to different length scales in the system can be determined, Figure 57b.
Figure 57.

(a) F(Q)/time domain data over the course of the reaction. (b) Slices taken through (a) at specific Q values, and the corresponding exponential fits to the data. Curves are offset vertically for clarity. (c) Sample temperature as measured at the top and bottom extremes of the TiZr cell. (d) Pressure of D2 gas present in 4 L supply reservoir. Reproduced with permission from ref (24). Copyright 2013 Royal Society of Chemistry.
The first diffraction peak (Q = 0.19 Å–1) exhibits both a fast (rate constant k0 = 2.146 h–1) and a slow (k1 = 0.138 h–1) component, while at Q = 1.2, 3.1, and 4.3 Å–1 there is an intermediate rate (k2,3,4 ≈ 0.35 h–1). The fast process (k0) is attributed to the dissociative adsorption of D2. This is consistent with the rapid and relatively large increase in temperature over the first 30 min following the introduction of the D2, Figure. 57c. The slow component (k1) also does not reflect a chemical change and is likely related to pore diffusion. The change at Q = 1.22 Å–1 reflects nearest-neighbor molecular interactions, while those at Q = 3.1 and 4.3 Å–1 are associated with atomistic chemical changes within the system. These three features evolve with similar time constants and are correlated with the reduction process and the formation of the cyclohexane product. These time constants suggest that the overall process is likely to be limited by liquid diffusion (k1), as this is the slowest rate observed, while the overall reaction rate is governed by the hydrogenation process (k2,3,4) rather than the dissociation of D2 (k0).
While the rate constants can be extracted from the data by conventional analysis of the kinetics, understanding what gives rise to these, particularly the liquid structure in a confined volume, is much more complex. Neutron total scattering is sensitive to these effects, and the liquid structure, both confined and in the bulk, has been determined by Empirical Potential Structure Refinement (EPSR).367 This is a Monte Carlo simulation of a representative box of molecules (hundreds to thousands) that uses a reference interatomic potential. A comparison between the experimental and calculated (from the model) structure factors is used to construct a perturbing potential (the empirical potential) that is applied to the Monte Carlo simulation. This ensures that the final model will reproduce the experimental data. This then allows properties of interest, such as site–site radial distribution functions, angular distribution functions and spatial probability densities to be extracted from the model.368 To provide additional constraints to the model, an NMR capability has been added to the experimental setup.369,370
The diffusion of benzene in MCM-41 has been investigated by QENS and molecular dynamics (MD) and is much slower than in the bulk.371 The MD model is largely in agreement with that obtained by EPSR;372 both show concentric layers in the MCM-41 pores. Notably, the nanoscale confinement of the liquid has a major effect on the spatial and orientational correlations observed between the molecules, when compared with the structure of the bulk liquid.373
The sensitivity of neutron scattering to light elements has been used to characterize other materials374,375 (N2, O2, D2, CD4) in MCM-41. Reactions involving these species have yet to be studied, but there is obvious potential to do so.
5. Other Neutron Scattering Techniques for Catalysis Research
5.1. Introduction to Quasielastic Neutron Scattering (QENS)
As with any INS measurement, a QENS experiment is concerned with obtaining the S(Q,E) as a function of momentum (Q) and energy transfer (E). However, QENS is specifically aimed at measuring the thermally activated stochastic motions. Therefore, unlike vibrational spectroscopy, which is best performed at the lowest practically attainable temperature, QENS is employed at finite temperatures (which could include ambient and higher temperatures). QENS measurements present especially stringent requirements to the energy resolution of the neutron spectrometer because the characteristic energy scale of the stochastic processes lies well below those of the intra- and even intermolecular vibrational motions. In other words, QENS is concerned with the dynamics on a much longer time scale than those probed in a vibrational INS measurement. The characteristic microscopic time associated with stochastic processes, τ, follows an Arrhenius law, τ(T) = τ0exp(Ea/T), with an activation energy Ea and a prefactor τ0. The activation energy may be temperature-dependent, Ea(T), leading to the non-Arrhenius temperature dependence of the τ(T).
Thus, a better energy resolution of the spectrometer allows measurements of the stochastic dynamics at lower temperatures. At the same time, access to higher energy transfers enables measurements of the stochastic dynamics over a broad temperature range. High energy-resolution backscattering neutron spectrometers, widely employed for QENS measurements, suffer from the limited range of accessible energy transfers. In contrast, broadband vibrational spectrometers do not have sufficient energy resolution for QENS measurements. The new spectrometer design for simultaneous QENS and vibrational INS studies will address this long-standing instrumentation challenge.376
In most QENS experiments, the scattering signal is dominated by the hydrogen atoms in the sample, as the neutron scattering cross section of protons is large compared to other elements. Besides, this cross section is predominantly incoherent. Thus, QENS probes single-particle (not collective) microscopic dynamics. For example, commonly encountered continuous (Fickian) diffusion gives rise to the QENS signal, which is a Lorentz function in energy, S(Q,E) = Γ(Q)/(π(Γ(Q)2 + E2)), with a half-width at half-maximum (HWHM) Γ(Q) = ηDQ2, where D is the diffusion coefficient and η is the reduced Planck’s constant. Therefore, the diffusion coefficient can be directly determined from the slope of the Γ(Q) plotted as a function of Q2.
Another commonly encountered case is jump diffusion, where instead of moving continuously, a particle resides for a specific time, τ, between successive jumps. For jump diffusion, HWHM is often described by a Chudley-Elliot model: Γ(Q) = ηDQ2/(1 + τDQ2), which is reduced to the continuous diffusion model when τ = 0. Because of the D = L2/(6τ) relationship between the diffusion coefficient, the residence time between jumps, and the jump length, L, the Γ(Q) can be expressed as a function of two different variables: (τ,D), (τ,L), or (D,L). Besides, for spatially constrained diffusion, or localized jumps the Γ(Q) can present as a Q-independent variable over a specific Q range.25
Often, the S(Q,E) is not described by a Lorentz function, especially for heterogeneous systems, but a “stretched” function. A numerical Fourier transformation of a stretched exponential, exp[−(t/τ(Q))β(Q)], which becomes a Lorentz function in the limiting case of β = 1, is commonly used for a “stretched” S(Q,E). Alternatively, the Cole–Cole relaxation function could describe a “stretched” S(Q,E) in an analytical form in the energy space.377 In the limiting case when the “stretching” parameter is vanishingly small, the Cole–Cole expression is also reduced to a Lorentz function. Besides being analytical in the energy space, another advantage of the Cole–Cole expression for S(Q,E) is that its average relaxation time does not depend on the value of the “stretching” parameter. In contrast, for a Fourier-transformed stretched exponential the average relaxation time depends on both τ and β, which increases the uncertainty in the calculated average relaxation time.
5.1.1. QENS Instrumentation
QENS is a technique that uses very low energy neutrons to look at energy transfers in the range ±10 meV (±80 cm–1) and generally much smaller than this. The energy resolution of a spectrometer, ΔE, and the time scale τ of the motion are related by the Heisenberg uncertainty principle: ΔEτ ∼ ℏ, thus rapid motions require relaxed resolution, while slower motions require high resolution. The time scale to be probed can be separated into three regimes, each of which uses a different technique: for τ ∼ 10–11 s, ΔE is 10–100 μeV and direct geometry time-of-flight is used; for τ ∼ 10–9 s, ΔE is 0.3–20 μeV and backscattering crystal analyzer is used; for τ ∼ 10–7 s (and slower), ΔE is 0.005–1 μeV and neutron spin echo is used.300
The need for low energy neutrons means that this is an area where reactor sources excel, especially the ILL, as they have greater fluxes at these energies than spallation sources. However, spallation sources typically have much lower backgrounds than reactors and pulsed sources are particularly suited to ToF instruments. As a result, QENS is becoming an increasingly important part of the instrumentation suite at spallation sources.
ToF QENS spectrometers are conceptually similar to those used for vibrational spectroscopy (see Section 3.1) but require more sophisticated chopper systems to achieve the resolution needed. Examples used for studies of catalysis include IN5 at the ILL LET at ISIS and CNCS at SNS.378−380
The design of backscattering QENS spectrometers varies between reactors and spallation sources. At reactors, an incident wavelength is selected by a monochromator. The bandwidth is increased by either moving the monochromator to give a Doppler broadening to the incident beam or heating/cooling the monochromator crystal so as to change the lattice spacing and hence the selected wavelength. This results in high resolution (better than 1 μeV) but very restricted energy transfer range. A recent development (BATS on IN16B at the ILL) has extended the energy transfer range, albeit at the cost of flux.381,382 At spallation sources the instruments are indirect geometry spectrometers: a (relatively) broad band of energies is selected by a chopper system and the analysis is by Bragg reflection from a crystal, typically graphite (002)/(004) or Si(111)/(311). The higher order indices result in a wider energy transfer range but with lower resolution. Backscattering instruments at spallation sources (BASIS at SNS and OSIRIS at ISIS) are those that are most commonly used for catalyst studies.382,383
For the very slowest motions spin echo instruments are used. Here, the velocities of a beam of polarized neutrons incident on, and scattered from, a sample are coded as the number of Larmor precessions that the neutron spins undergo in a well-defined applied magnetic field. If the scattering at the sample is elastic and the precession fields before and after the sample are identical in magnitude and spatial extent, all neutrons will be in phase at the point in space where they leave the second precession region, the “echo”. If the scattering is not purely elastic, the spins will not be completely in phase, weakening the echo. The distribution of phases is then a measure of the distribution of the atomic velocities in the sample. The high resolution of this technique arises from the large number of precessions the neutron undergoes, ∼105 precessions/m, hence the velocity can be measured to an accuracy of better than 10–5 consequently the energy transfer can be measured to similar accuracy. The technique is slow compared to direct geometry and backscattering instruments because the flux is low as a result of the need to polarize the neutrons. To date, it has been little used for catalysis studies, although it has considerable promise for the study of complex molecules in confinement, as shown by a study of isobutane in silicalite.384
The sample environment for QENS is similar to that used for other neutron techniques, e.g., INS and neutron powder diffraction. There are two key requirements: (i) as QENS measurements are routinely made as a function of temperature, the sample can must be suitable for the temperature range, and (ii) QENS is a Q-resolved technique. Thus, it is essential to avoid multiple scattering that will destroy the Q information. Annular aluminum cans are usually employed for samples that can be prepared off-line and are stable. The thickness of the annulus is chosen such that the sample scatters, at most, 10% of the incident neutrons. (This level of scattering means that multiple scattering is negligible). Air sensitive samples can be loaded into the cans in a glovebox and are usually sealed with indium wire. The indium seal limits the maximum temperature to ∼100 °C (mp In = 157 °C). For measurements where the sample needs to be treated in situ (e.g., diffusion of a gas through a zeolite), versions of the cells are available that allow gas loading either statically (by exposure to a gas reservoir) or under flow. For measurements above 100 °C, Cu gasket (Conflat) sealed steel or niobium cells are used. The disadvantage of these materials is that they introduce a significant number of Bragg peaks into the data, which reduces the coverage in Q and complicates the analysis.
5.1.2. The Use of QENS in Catalysis
Even though QENS measurements are commonly used for probing the geometry of the local atomic or molecular jumps, it is the translational (albeit suppressed by confinement) diffusivity that has been of prime interest in QENS studies of catalysis, with only a few exceptions385−388 concerned with rotational molecular motions. This is because the mass transport of reactants or products linked to translational diffusivity could be an essential step in a chemical process. Historically, most QENS studies of catalytically active materials have been concerned with the mobility of hydrocarbons in zeolites. Accordingly, several reviews in the existing literature focused on QENS application in catalytic science29,389,390 with an emphasis on zeolites and related materials. Early QENS measurements of catalytic materials involved studies of diffusion of methane,391 ethane and propane,392 and isobutane393 in ZSM-5 zeolite. Comparative studies of diffusion of longer n-alkanes in Na-ZSM and silicalite394,395 were carried out shortly afterward. A detailed comparison of diffusivities of n-alkanes in these MFI-type zeolites measured by QENS and NMR was subsequently presented.396 A comparison of methanol adsorbed in HZSM-5 and a mesoporous MCM-41 silica397 revealed much more restricted dynamics of methanol in the former matrix than in the latter. Figure 58 presents the variation of the QENS signal HWHM as a function of Q2 for methanol adsorbed in MCM-41, with the solid line indicating a fit to a Chudley-Elliot jump-diffusion model.
Figure 58.

Variation of the half-width half-maximum as a function of Q2 for methanol adsorbed in MCM-41. The solid line is the fit to a Chudley-Elliot jump diffusion model. Reproduced with permission from ref (397). Copyright 2006 American Chemical Society.
In general, mesoporous confinement does not impede the translational diffusivity to the extent that confinement in zeolites does. Further QENS studies of methanol mobility in H-ZSM5 and HY zeolites263,398 revealed immobilization of methanol in H-ZSM5, suggesting the framework methoxylation, whereas methanol in HY remained intact and mobile. The translational immobility of methanol in ZSM-5 on the time scale accessible to QENS was further confirmed in an experiment399 where isotropic methanol rotation was eventually observed in a sample that developed mesoporosity due to spending a long time at a high reaction temperature. The mobility of propylene in Na-ZSM5400 was also probed. Another early target of QENS studies was NaY zeolite material, in which diffusion of propane401 and acetylene402 was studied. These studies were followed by a detailed comparison of the mobility of propylene403,404 and acetylene405 between ZSM-5 and NaY zeolites. The systems less systematically investigated by QENS included n-octane in faujasite type X,406 ammonia diffusion in NH3-SCR zeolite407 and cyclohexanone oxime in SAPO-37 compared with Zeolite-Y and ZSM-5.268 In the latter case, QENS measurements provided information on the critical role of diffusion and interaction of the substrate with the desired active site. Specifically, QENS showed cyclohexanone oxime to access the internal sites of SAPO-37 and Zeolite-Y but not ZSM-5. Figure 59 presents a mechanistic pathway for the acid-catalyzed Beckmann rearrangement of cyclohexanone oxime to form ε-caprolactam, an important feedstock in the production of Nylon-6.
Figure 59.

A representative mechanistic pathway for the acid-catalyzed Beckmann rearrangement of cyclohexanone oxime. Reproduced with permission from ref (268). Copyright 2017 American Chemical Society.
There are a couple of points concerning QENS studies of zeolites and related materials that are worth noting. First is the prominent role often played in such studies by MD simulations. Second are the notable recent attempts aimed at operando measurements, albeit at present realized only for homogeneous systems. For example, the complexation of NiCl2 with 2,2′-bipyridine was followed using QENS to monitor the progress of the reaction.408 Such QENS studies are expected to become more prevalent in the future.
Besides probing zeolites, another class of QENS studies relevant for catalytic science are measurements of dynamics of surface species, which form a distinct subfield with its own peculiarities within the extensive research on confined species. Only a few review articles have been published on surface species studied by QENS,409 and molecular dynamics simulations of such systems are considered more challenging, mainly due to some ambiguity in defining the two-dimensional parameters such as self-correlation functions and diffusivities.410,411 Following early work on the diffusion of hydrogen on the surface of nickel catalyst,412,413 QENS measurements of two-dimensional surface diffusion were reported for methane414,415 as well as butane and hexane416 on graphite, methane on magnesium oxide,417 and water on zirconium oxide.418,419 The QENS data analysis used in these studies had much in common with the approach utilized for two-dimensional layered materials, such as protons in (CsOH)(H2O)420 and water in clays,421 or the alternative approach applied to the diffusion of xenon on platinum422 and benzene on graphite.423 However, many QENS studies of surface adsorbates, e.g., gallium on alumina,424 water on SrF2 and ZnO,425 acetonitrile on TiO2,426 and cyclohexane and benzene on nickel,427 do not invoke a two-dimensional formalism. This is especially true for QENS studies of water on oxide surfaces, many of which aim at investigating not the well separated adsorbate molecules but the surface coverage levels at which the water adsorbate demonstrates some essential dynamic characteristics of bulk water, albeit without undergoing crystallization at any temperature.428−431 Interestingly, the dynamics of phenanthrenequinone molecules on onion-like carbon surfaces measured by QENS as a function of temperature and surface coverage432 bears qualitative resemblance to the dynamics of water molecules on oxide surfaces, suggesting the universality of some dynamics features across different classes of surface adsorbates. Finally, some QENS studies of surface water, particularly in minerals, attempt to analyze the dynamics of water molecules associated with specific surface atoms.433,434
In summary, QENS plays an increasing role in interrogating the diffusional dynamics of catalytically active reaction systems. Coincident molecular dynamics simulations are proving to be particularly insightful. Given the relevance of diffusional characteristics within confined geometries to selectivity profiles (for example, as encountered in hydrocarbon reactions in zeolite catalysts), this activity is anticipated to increase over the coming years.
5.2. SANS: Introduction and Its Application in Catalysis
Since Stuhrmann et al. demonstrated the feasibility of small-angle neutron scattering (SANS), it has become an important characterization method in the fields of polymer and colloid science because of the length scales it probes.435 Different from wide-angle diffraction methods, which probe atomic distances, SANS uses elastic neutron scattering at small scattering angles to study structures of various substances at a mesoscopic scale of 1–1000 nm. SANS is a powerful complementary method to small-angle X-ray scattering (SAXS), and both techniques share the same basic principles. Specifically, in a SANS setup, the incident neutron beam is monochromated and collimated before it hits the sample. The detector records the neutrons scattered by the sample and the nonscattered neutrons are absorbed by the beam stop in the center of the detector. Due to the differences in the physics of X-ray–matter and neutron–matter interaction, SANS has some unique and valuable features. For instance, the scattering lengths of hydrogen and deuterium have opposite signs, allowing the important technique of contrast variation/matching, which can selectively highlight different parts of samples. In addition, due to the strong scattering by magnetic moments, magnetic SANS has played a vital role in the fields of nanomagnetism.
With the development of in situ setups, in situ SANS has been used to investigate several different systems, as demonstrated in Figure 60. By using in situ SANS and a custom reaction chamber (Figure 60a), Yan et al. studied deuteride formation on the surface of cerium (coated with a surface oxide layer).436,437 It was found that deuterides were formed as soon as deuterium was absorbed on the sample with a thin oxide layer, while for the sample with a thick oxide layer, the precipitation of deuterides was delayed.436 Prabhu et al. developed an in situ electrochemical SANS methodology, which enabled direct measurements of nanomaterial dispersion structure under redox reactions at the vitreous carbon electrode (Figure 60b).438,439 A feasibility test was performed on ZnO nanoparticles in 50 mmol/L NaCl deuterium oxide solution under bulk electrolysis at negative potentials.438,439 The in situ SANS results showed irreversible nanoparticle structural changes during the potential cycle.438,439 To follow the structural changes under continuous chemical reactions, Hayward et al. proposed to use the setup shown in Figure 60c for SANS experiments.440 The approach was validated by performing single and multiple potentiometric titrations on an aqueous anionic surfactant solution (oligo-oxyethylene alkylether carboxylic acid in D2O) with addition times varying from 1 s to 2 h.440
Figure 60.

(a) A schematic diagram of the in situ SANS experiment of the deuterium-cerium reaction. Reproduced with permission from ref (436). Copyright 2020 American Chemical Society. The two ends of the reactor are sapphire windows with a neutron transmission of 95%. The 316L stainless steel cylinder is connected to the gas inlet/outlet. A multiplate 316L stainless steel sample holder is mounted in the middle of the reactor. Inset: Using the multiplate sample holder, the deuterium reaction of multiple wafers can be realized. Reproduced with permission from ref (437). Copyright 2021 Elsevier. (b) A schematic of the transmission SANS quartz cell with working electrode under potentiostatic control.438,439 Reproduced with permission from ref (438). Copyright 2012 American Chemical Society. (c) A schematic of a continuous flow setup. The experimental setup includes a reaction vessel, a pH electrode, a peristaltic pump, an observation cell, and two syringe pumps. Reproduced with permission from ref (440). Copyright 2018 Nature Publishing Group.
SANS has been used in the field of catalysis to provide information about the particle size and shape of catalytic systems. For instance, Larichev et al. showed the possibility of using SANS to determine the particle size of the active component in catalysts. They demonstrated that the combination of SANS and SAXS made it possible to obtain the distributions of particles of the deposited active component in a wide range of sizes.441 By employing SANS, Kim et al. were able to measure the structure of the γ-Al2O3 supports over four orders of length scales (from nanometer to micrometer) and showed that the catalytic activities and dispersion of Pt particles on the γ-Al2O3 support were dependent on the shape of the support.442 By using SANS, Acharya et al. found that the coke (a monolayer with an average composition of CH0.3) preferred to coat the 3.3 nm diameter capillary solid structures in a silica–alumina catalyst.443
Taking advantage of its sensitivity to pore filling, SANS has been utilized to study liquids (including water) and ions confined inside porous materials such as electrocatalysts. Boukhalfa et al. demonstrated the unique ability of SANS to monitor organic electrolyte ion adsorption in carbon pores as a function of the applied potential and pore size.444,445 The in situ SANS measurements revealed that ion adsorption was strongly enhanced in the smallest subnanometer pores, despite their incomplete wetting by the electrolyte solvent.444,445 Based on SANS results, Rother et al. were able to model the spatial distribution of confined supercritical CO2 in nanoporous silica aerogel.446 Chathoth et al. correlated the pore size distribution in nanoporous carbon aerogel with methane diffusion.447 The combined quasi-elastic and small-angle neutron scattering showed that at low pressures (≤2.76 MPa), the methane adsorption process began in small, subnanometer pores and moved progressively to bigger pores, leading to the initially increased diffusion coefficient with pressure.447 At higher pressures (>2.76 MPa), the effect of intermolecular collisions became important, resulting in a decrease in the diffusion coefficient.447 To develop automotive exhaust purification systems, Yoshimune et al. studied the evaporation process of immersed water from exhaust gas catalysts by applying in situ SANS.448 The time-resolved measurements showed that water started to evaporate from the secondary pores of Al2O3 supports in tens of seconds and subsequently from the primary pores in a hundred seconds and revealed that the drying rate depended on the secondary pore size of porous Al2O3.448
The contrast-variation/matching capability of neutron scattering is particularly advantageous for studying catalytic reactions involving the interaction between catalysts and water. For instance, to overcome the diffusion loss in polymer electrolyte fuel cells that could occur when generated water overflows and hinders oxygen gas diffusion at the surface of the cathode catalyst Pt, Koizumi et al. investigated the microstructure and water distribution in carbon supported Pt catalysts by combining SANS and scanning electron microscopy (SEM).449 It was found that the Nafion ionomer over the carbon-supported Pt absorbed water at the 17 wt % level. The catalyst bound by the ionomer showed water repellence, whereas the catalyst powder without the ionomer was covered with water.449 To understand the influence of the quality of the dispersion medium on the hierarchical structure of the electrocatalysts layer of the proton-exchange membrane fuel cell, Balu et al. systematically investigated the effects of reducing the alcohol content in isopropyl alcohol/water (IPA/H2O) binary mixtures as dispersion medium (DM) on the structural evolution of water-rich catalyst ink using contrast-variation small angle and ultrasmall-angle neutron scattering techniques.450 The catalyst ink prepared using 70% IPA was shown to consist of randomly distributed globular carbon aggregates (mean radius of gyration of ∼178.9 nm) stabilized by an ionomer mass fractal shell (thickness of ∼13.0 nm), which was dispersed in the matrix of rodlike (∼1.3 nm radius and ∼35.0 nm length) negatively surface-charged ionomer NPs (as shown in Figure 61). While for DM formulations of lower IPA content, there was an increase in the ionomer NP radius and electrostatic repulsion and a decrease in the carbon aggregate size and ionomer shell thickness of the catalyst ink. The results suggested that adjustments of the DM composition could be used as a controlling parameter to tailor the hierarchical structure of the colloidal fuel cell catalyst ink and to further optimize the performance of the electrocatalysts layer.450
Figure 61.

Schematic illustration of the colloidal structure of fuel cell catalyst ink prepared using IPA/H2O mixtures as DM. Reproduced with permission from ref (450). Copyright 2019 American Chemical Society.
In brief, SANS has unique capabilities in determining the size and shape distribution of active metal species in supported catalysts, the formation and location of coking, and the adsorption, diffusion and confinement of ions and molecules in porous structures. With the development of in situ setups, chemical processes can be tracked in situ or by performing time-resolved measurements.451 In particular, using contrast variation SANS, different parts of a sample can be selectively highlighted by exchanging hydrogen for deuterium, which is especially useful for studying catalytic reactions that involve hydrogen species.
5.3. Neutron Imaging of Catalysts
Neutron imaging has a long history,452 the first experiments were carried out in the 1930s, shortly after the discovery of the neutron by Chadwick in 1932. The current status is that all of the major neutron scattering facilities either already have or will have an imaging capability.453 The interest in the method arises from the range of contrast mechanisms, and hence the wide applicability of the technique,454−456 see Figure 62.
Figure 62.

Different contrast mechanisms can be used to explore various length scales in materials and to study their properties and related processes. The relation between contrast mechanisms and different application fields is presented. The length scale shown on the lower axis relates to the corresponding contrast mechanism specified on the upper axis. For the attenuation-based image techniques the large length scale was emphasized by grouping the scales from μm to cm. Reproduced with permission from ref (455). Copyright 2018 Elsevier.
The spatial and temporal resolution are inversely related. State-of-the-art instruments can achieve ∼50 μm spatial resolution with an acquisition time of minutes,455,457−459 5–10 μm resolution is possible with a limited field of view.459,460 High-speed imaging with 10–1000 ms time resolution with 200–500 μm spatial resolution is also possible.461
The major use of neutron imaging in catalysis-related research has been the study of water management in proton-exchange membrane fuel cells (PEM-FC).462 This is an ideal system for neutron imaging because the presence of water provides excellent contrast. In neutron imaging, most of the contrast arises from absorption and by scattering neutrons out of the beam. For the latter, the total cross section (coherent + incoherent) is the relevant quantity, and the 82 barn cross section of 1H makes it optimal for imaging.
The change in scattering caused by the loss of materials was used to follow the pyrolysis of biomass,463 the same methodology would be applicable to follow the calcination and drying of a zeolite or the activation of a catalyst.
In addition to 2D radiography, neutron computed tomography can provide a 3D reconstruction of an object. This requires significantly longer time to acquire the data but does allow the object to be better viewed. An example using particulate filters for a diesel engine464 is shown in the upper right corner of Figure 62.
The nuclear-spin conversion of ortho (o-H2) to para (p-H2) hydrogen is important in fields as diverse as NMR spectroscopy, neutron scattering, and hydrogen storage. In the liquid phase at 20 K, the process takes days. However, it is catalyzed by paramagnetic materials, commonly γ-Fe2O3. At energies below the J = 0 → J = 1 rotational transition at 117 cm–1 of H2, the cross sections of o-H2 and p-H2 are very different. By selecting neutrons with an energy of 10–250 cm–1, o-H2 and p-H2 are readily distinguished. This was used to provide both spatial and kinetic information on the process in situ.465 (A video of the process is available in the Supporting Information of ref (465).) The cross sections of ice and liquid water are also different at low energies, and this is used to distinguish between them in a fuel cell.466
The conversion of CO2 with hydrogen into methane is an important step in the power-to-gas concept for the seasonal storage of renewable energy. The process is the Sabatier reaction (4H2 + CO2 → 2H2O + CH4) and uses a supported nickel catalyst. By removing the water that is formed, the yield can be enhanced. This can be done by sorption catalysts made of Ni particles embedded in a 5A zeolite matrix. The water generated during the reaction is readily observed by neutron imaging.467,468 The technique provides quantitative results on the amount and location of water in the reactor. The difference in the cross section between 1H and 2H means a large contrast between protonated and deuterated species, which enables steady-state isotopic transient kinetic analysis (SSITKA) to be carried out.
Although pivotal in heterogeneous hydrogenation reactions, the amount of hydrogen on catalysts during reactions is seldom known. Neutron imaging was used to follow and quantify hydrogen containing species in Cu/ZnO/Al2O3 catalysts during operando methanol synthesis.469Figure 63 shows the experimental arrangement and the catalyst pellet under low and high hydrogen conditions.
Figure 63.

Neutron transmission image of a Cu/ZnO catalyst pellet (optical photo on the left) placed in an aluminum reactor (left large picture). The pellet’s cylindrical axis is aligned parallel to the neutron beam. Middle and right pictures show the neutron contrast image under different conditions, one with hardly any excess hydrogen adsorption in the catalyst, (middle) and one with marked adsorption in the catalyst exceeding that of the gas phase (right). The contrast is maximized for each image for better visibility. The yellow line is a guide to the eyes to indicate the reactor walls. Reproduced with permission from ref (469). Copyright 2020 Royal Society of Chemistry.
Steady-state measurements reveal that the amount of hydrogen-containing intermediates is related to the reaction yields of CO and methanol. Hydrogen–deuterium exchange experiments showed that hydrogen reduction modifies the catalyst so that, at operating temperatures, hydrogen is dynamically absorbed in the ZnO-nanoparticles. Thus, ZnO functions as a hydrogen reservoir, supplying hydrogen to the surface.
Time resolved operando measurements are shown in Figure 64 for a working catalyst at 12 bar, 473 K, and with a H2:CO2 ratio of 6. The neutron contrast was used as a proxy for the amount of hydrogen on the catalyst. The surface reaches a steady-state rapidly after switching from H2 to H2/CO2 mixtures, as does the CO yield. The methanol yield has a brief maximum on the fresh sample, presumably because none of the sites are blocked. The water signal shows a slow increase with time. Switching off the CO2 and reducing the pressure to ambient conditions, cause the desorption of intermediates and products. The immediate decrease of the CO signal indicates that there is only little CO adsorbed. At the same time, the spike in methanol and water production demonstrate that a substantial number of methanol-related intermediates and the products themselves are adsorbed. This is also apparent by the slow decay of the neutron contrast (the line is a fit to an exponential function). The presence of surface intermediates agrees with the INS studies described earlier.245
Figure 64.

Time resolved operando measurements for a working methanol synthesis catalyst, Cu/ZnO/Al2O3, at 12 bar, 473 K, and H2:CO2 = 6. Reproduced with permission from ref (469). Copyright 2020 Royal Society of Chemistry.
In brief, neutron imaging of catalysts is in its infancy, but the potential is clear. The latest instruments that offer multiple contrast mechanisms, particularly wavelength resolved methods, combined with the use of H/D substitution, are ideally suited to studying catalytic processes. The technique is readily used operando. It will not achieve the atomic scale resolution possible with X-ray methods. Instead, it provides information about the location of hidden (e.g., by the can or support) materials within objects and how these change with time. Thermal and mass transport limitations mean that industrial chemical processes are carried out over relatively long (>seconds) times, and these are ideally suited to neutron imaging.
5.4. Multimodal Neutron Approaches: Integration of Two or More Neutron Techniques
Examples of using one or more neutron scattering techniques are less common than may initially be expected. In general chemistry, several examples of studies combining elastic and inelastic neutron scattering techniques are known. For instance, Rols and co-workers used a combination of the Institute Laue-Langevin’s D20 two-axis diffractometer and the IN6 time-of-flight spectrometer to obtain, respectively, the structure and generalized density of states of single-wall nanotubes.470 There are several examples of neutron techniques combined with photon-based spectroscopic probes such as infrared spectroscopy, for the characterization of heterogeneously catalyzed reaction systems. For example, Hawkins and co-workers used a combination of INS measurements complemented by infrared spectroscopy (in this case, DRIFTS) to evaluate the role of intermediates species in zeolite catalysis.471 A similar case of combining INS and DRIFTS was used to study the selective hydrogenation of acetylene over ceria surfaces.247 The combination of neutron scattering with online gas analysis was also demonstrated, such as in situ INS with a gas chromatograph,472 and in situ ND with mass spectrometry.20 However, there is a paucity of examples of multiple neutron techniques used in catalytic science. This is surprising, given the different perspectives and benefits that the wide range of neutron instrumentation can potentially provide.
5.4.1. INS and QENS
One area of endeavor that is showing real promise, and is being increasingly taken up by several researchers, is to supplement INS investigations with QENS. INS provides access to the vibrational spectrum of a heterogeneous catalyst, which can be insightful in determining molecular/atomic entities retained within the catalyst matrix.37 Supplementing that perspective, QENS provides access to diffusional information on the atomic scale300 and is useful when examining samples that possess porous networks, such as zeolites or supported metal catalysts. In this way, QENS has found applications in assessing how mass transfer effects may be contributing to the performance of a particular catalytic system.473 Thus, a combined experimental approach has the potential to (i) discern what entities are engaged in the chemical transformation under consideration (INS) and (ii) determine whether the accumulation of such entities may be moderating mass diffusion within the solid matrix (QENS). Ultimately, these factors influence the critical parameters of catalytic activity and selectivity.
A single example is selected here to demonstrate the benefits of a combined INS and QENS investigation of a catalytic system: namely, the dynamics of 1-octene adsorption at 293 K on a ZSM-5 zeolite catalyst.387 The interaction of 1-octene with ZSM-5 is intended to be a model for gasoline-to-olefin chemistry that can play a role in fluidized catalytic cracking unit operations performed in petroleum refining facilities.474 The study is limited to a temperature of 293 K to assess the scope of the interaction between the linear alkene and the solid acid zeolite under conditions that avoid the formation of a wide number of product molecules, which would otherwise significantly complicate the analysis.
To obtain the vibrational spectrum at a fair resolution over the energy range 20–4000 cm–1, two INS spectrometers were utilized in the study:31 MAPS and TOSCA, both located at the ISIS Facility. Figure 65 presents a set of INS spectra recorded using the MAPS and TOSCA spectrometers. The increased resolution of TOSCA at low energies is readily apparent, as are the advantages of MAPS above ∼1200 cm–1.
Figure 65.

INS spectra (20–4000 cm–1) of clean ZSM-5 (black), pure 1-octene (blue), and 1-octene in ZSM-5 (red) recorded on (A) the MAPS spectrometer at incident energies of 2017 (left) and 5244 (right) cm–1, and on (B) the TOSCA spectrometer. Reproduced with permission from ref (387). Copyright 2019 American Chemical Society.
On addition of the 1-octene to the zeolite, Figure 65A,B shows that the observed spectrum differs significantly from the spectra of the individual components, indicating chemisorption involving a degree of molecular rearrangement to be occurring. The intensity of the (C–H) stretch region above 3000 cm–1 is reduced relative to that observed for pure 1-octene, with the 2400–3600 cm–1 region of the ZSM-5/1-octene spectrum only showing contributions from the sp3 (C–H) stretch modes. Together with the complete disappearance of the (=CH2)-associated peaks at 639, 911, and 967 cm–1, the change in adsorption is attributed to the carbocation-forming protonation of the octene.
QENS spectra of ZSM-5 loaded with 1-octene at 293 K are presented in Figure 66 and exhibit a degree of quasielastic broadening that increases with the temperature of the QENS acquisition, indicating that motion occurs on the ∼2–50 ps time scales visible to the OSIRIS spectrometer383 utilized for these measurements. The identification of the exact motion responsible for the quasielastic intensity observed is simplified by the results of the vibrational analysis completed above. Since the hydrocarbon is a long chain constrained within zeolite pores whose diameter is less than the chain length, only a few types of rotation are physically possible: namely, the reorientation of the terminal methyl groups around their C–C bond, either continuously or as a series of 120° jumps between equivalent orientations, or the uniaxial rotation of the entire alkyl chain.387
Figure 66.

QENS spectra at selected Q values for 1-octene in ZSM-5 measured at 373 K following subtraction of the immobile zeolite contributions (black). The Lorentzian fit component modeling the quasielastic contribution at each Q value is also shown (red). Reproduced with permission from ref (387). Copyright 2019 American Chemical Society.
Localized motions in a QENS spectrum may be characterized by deriving the Elastic Incoherent Structure Factor (EISF), a parameter that defines the fraction of the total scattering intensity that is elastic.300,473 Analysis of the experimental EISF values from Figure 66 as a function of momentum transfer (Q) indicates uniaxial rotation to be responsible for the majority of this quasielastic character and that contributions of other motions are likely to be negligible.387
From these combined results, the interaction of ZSM-5 and 1-octene at 293 K is characterized by the catalytic oligomerization of the 1-octene that leads to the formation of long-chain linear hydrocarbons that are large enough to be immobilized within the zeolite pores. This level of detailed and precise information on the selected adsorption system would only be achievable by applying the two neutron scattering techniques described.
5.4.2. INS and ND
Combining both INS and ND is another area with promise for catalysis studies as they can tackle both the chemical nature (INS) and structure (ND) of catalysts and reaction species. As shown in the INS and ND sections, the structural evolution of the Ru/C12A7:e– electride catalyst was followed by both in situ ND and INS during ammonia synthesis conditions.20 While the ND result (Figure 51) from the NOMAD beamline indicates the inclusion of extra species into the cage of the electride support, the INS spectra (Figure 28) obtained from the VISION beamline, aided with computational modeling, provide unambiguous evidence for the formation of hydride species in the C12A7 cages.
The power of combining INS and ND was recently demonstrated even at a single beamline—VISION at SNS for studying a Ni/BaH2 catalyst during N2–H2 chemical looping for ammonia synthesis.101 The INS spectra collected during the looping process are shown in Figure 29 in Section 3.3.1, and the corresponding ND patterns collected simultaneously are exhibited in Figure 67. The few extra diffraction peaks appearing at ∼1.68, 2.22, 2.64, 2.88, and 3.12 Å (indicated by arrows) after the N2 reaction step could be due to the formation of different types of NH species. By comparing the simulated patterns from BaH2, BaNH, Ba2NH, and Ba(NH2)2, it is clear that BaNH and BaH2 can account for most of the observed peaks, confirming the formation of BaNH in the nitridation step, as also observed in the INS spectra in Figure 29. The extra diffraction peaks remain after the H2 step, although peaks due to BaH2 also show up, suggesting a partial regeneration of the starting hydride material. This is again consistent with the INS results, where the hydrogenation of NHx species is more difficult than the N2 fixation (nitridation) step. Interestingly, the diffraction intensity decreases after the N2 reaction step and regains after the H2 step, suggesting H abstraction and addition into the sample since the ND intensity is mainly from the incoherent scattering of H atoms.
Figure 67.

Neutron diffraction patterns collected at VISION for Ni/BaH2 with and without ball milling, and in situ during the N2–H2 cycling process. The peaks from several standards including Ba(NH2)2, BaH2, Ba2NH, BaNH, Ni, and BaO are also shown at the bottom. Reproduced with permission from ref (101). Copyright 2021 Springer. Corresponding in situ INS spectra are shown in Figure 29.
In brief, the outcomes from the above few exemplar case studies of combining two neutron techniques are inspirational in encouraging more multitechnique neutron scattering investigations on other catalytic materials, adsorption, and/or reaction systems.
6. Conclusions and Perspectives
In this review, we have provided an overview of the progress made mainly in the past decade or so by neutron scattering studies of heterogeneous catalysis. It demonstrates that neutron scattering has provided significant insights into understanding the role of various hydrogen and hydrogenous species in catalytic reactions and played a unique role in revealing the structures of heterogeneous catalysts, including light atoms and neighboring elements. In each section, we have reviewed the theoretical fundamentals and the catalytic applications of major neutron scattering techniques, including inelastic neutron scattering (INS), neutron diffraction (ND), quasi-elastic neutron scattering (QENS), small angle neutron scattering (SANS), neutron imaging along with the combination of multiple neutron techniques. The examples provided show that INS can deliver distinctive perspectives on the chemical nature of adsorbates and sometimes surface reaction intermediates on catalysts, complementary to other techniques such as infrared and Raman spectroscopies. ND’s strengths are the location of light elements and distinguishing neighboring elements in the periodic table. It also gives better data at higher diffraction angles with stronger intensity than X-ray techniques. QENS excels in understanding the transport motions of hydrogen-containing species on catalyst surfaces and in catalyst pores at fast time scales (ps–ns). SANS is particularly powerful in studying ions and molecules’ adsorption, diffusion, location, and confinement in porous structures enabled by contrast variation. Neutron imaging is still in its infancy and has seen its major use in the study of water management in fuel cells and potentially electrochemistry at a spatial resolution down to the mm scale. The coupling of two or more neutron techniques, such as INS-ND and INS-QENS, is not common but has shown its power in catalysis research and should be encouraged.
It is noteworthy that computational modeling is indispensable to interpreting and understanding neutron scattering results. Lattice dynamics or molecular dynamics based on DFT have been used to help assignment of INS peaks and reveal the structural origin behind the experimental observations; the reverse Monte Carlo method has been employed to interpret the complicated neutron diffraction patterns measured on a disordered or nanomaterial and to search for structural models that can reproduce the total scattering intensities. Thanks to the recent advances in exascale computers and quantum chemistry, it is expected that the coupling of modeling and data science with experiments could further revolutionize the field of neutron scattering for catalyst research.
At the outset of this review, the aim was to provide a balanced overview of the state of neutron scattering of catalysis. However, it is apparent that neutron spectroscopy, i.e. INS, has dominated the catalysis research field over other neutron techniques and continues to do so. Why this is the case is not obvious. In part, this is because much of heterogeneous catalysis involves shuttling hydrogen atoms from one molecule to another and INS is especially sensitive to hydrogen. The transparency of most catalysts and supports to neutrons is an added advantage as it enables a wide spectral range to be accessed. However, we believe that the major reason is history: the first chemists to use neutron scattering came largely from a physical chemistry background, so it gravitated toward spectroscopic applications. Indirect geometry instruments provide data that is at least conceptually similar to that from infrared and Raman spectrometers, so these were the instruments of choice. The realization that INS could produce novel and useful information inspired others and spawned a virtuous circle of increasing usage, which resulted in the extensive sample environment options now available at INS beamlines.
With the ever-increasing drive for in situ/operando studies in catalysis, it is imperative that catalysis researchers and neutron scientists work closely together to develop and advance sample environments adapted for different neutron beamlines. Some promising developments have been recently made, for example, at the NOMAD beamline in SNS, as shown in Section 4.1. Neutron diffraction is one of the few neutron techniques where in situ/operando studies of catalysis have been demonstrated. However, demonstration examples with neutron imaging, QENS, and INS with direct geometry spectrometers do exist and provide a basis for further development.
As with any technique, there are threats as well as opportunities. The biggest problem faced by neutron scattering is the reduction in the number of neutron sources (mostly reactors) as a result of obsolescence or nuclear proliferation concerns. Closing sources increases the demand on the operating facilities and makes obtaining beam time more challenging. The continuing increase in brightness of synchrotron sources means that inelastic X-ray scattering is becoming competitive with INS for some applications. There is also an increasing expectation of “black box” operation, where no knowledge of the mechanics of the experiment are needed. This approach relies on the availability of experts to ensure that the results are reliable. These are becoming scarcer.
One area that has not been discussed is the use of polarized neutrons. As noted in Section 2, neutron scattering can be coherent or incoherent. For 1H, it is the incoherent scattering that is dominant; for most other elements (and isotopes), the coherent scattering is larger than the incoherent scattering. For hydrogenous materials, it is generally assumed that the coherent scattering can be either neglected (INS) or subtracted out (QENS). The use of polarized neutrons enables the coherent and incoherent scattering to be analyzed separately. Recent work suggests that for QENS, this assumption may not be completely valid.475 Generating polarized neutrons is a very inefficient process, so the technique is very flux-demanding but offers the possibility of better agreement between experiment and MD calculations for QENS.
Overall, it is clear from this review that neutron scattering in its various forms provides a useful supplement to more traditional catalyst characterization methods. Given the prominence of hydrogen as a fuel within the emerging Net Zero agenda (including the use of hydrogen chemical vectors such as ammonia and methanol) and the suitability of neutron techniques to monitor hydrogen, the recently realized expansion of neutron methods in catalysis research is expected to increase over the coming years. That said, the limited number of neutron facilities around the globe needs to be recognized as a potentially rate-limiting parameter. Investment in existing and new facilities and in situ/operando sample environments is necessary to continue facilitating advances in catalytic science and energy research required by our modern society.
Acknowledgments
This research is supported by the U.S. Department of Energy, Office of Science, Office of Basic Energy Sciences, Chemical Sciences, Geosciences, and Biosciences Division, Catalysis Science program. This research is benefited from the use of beamlines at the Spallation Neutron Source, a DOE Office of Science User Facility operated by the Oak Ridge National Laboratory. This paper has been authored in part by UT-Battelle, LLC, under contract DE-AC05-00OR22725 with the U.S. Department of Energy (DOE). The U.S. Government retains and the publisher, by accepting the article for publication, acknowledges that the U.S. Government retains a nonexclusive, paid-up, irrevocable, worldwide license to publish or reproduce the published form of this paper, or allow others to do so, for U.S. Government purposes. DOE will provide public access to these results of federally sponsored research in accordance with the DOE Public Access Plan (http://energy.gov/downloads/doe-public-access-plan).
Glossary
ABBREVIATIONS
- CSNS
China Spallation Neutron Source
- DFT
Density Functional Theory
- DGS
Direct Geometry Spectrometer
- DM
Dispersion Medium
- DME
Dimethyl Ether
- EISF
Elastic Incoherent Structure Factor
- ESS
European Spallation Source
- FTS
Fischer–Tropsch Synthesis
- HEO
High-Entropy Oxide
- IGS
Indirect Geometry Spectrometer
- ILL
Institut Laue Langevin (France)
- INS
Inelastic Neutron Scattering
- IPA
Isopropyl Alcohol
- ISIS
ISIS Neutron and Muon Source (UK)
- MD
Molecular Dynamics
- MTH
Methanol-To-Hydrocarbon
- ND
Neutron Diffraction
- NMR
Nuclear Magnetic Resonance
- NPs
Nanoparticles
- NPDF
Neutron powder diffractometer
- NVS
Neutron Vibrational Spectroscopy
- ORNL
Oak Ridge National Laboratory
Pair Distribution Function
- PEM-FC
Proton-Exchange Membrane Fuel Cell
- QENS
Quasi-elastic Neutron Scattering
- SANS
Small-Angle Neutron Scattering
- SAXS
Small-Angle X-ray Scattering
- SEM
Scanning Electron Microscopy
- SINQ
Swiss Spallation Neutron Source (Switzerland)
- SNS
Spallation Neutron Source (USA)
- SSITKA
Steady-State Isotopic Transient Kinetic Analysis
- STS
Second Target Station at SNS (USA)
- TAS
Triple Axis Spectrometer
- THF
Tetrahydrofuran
- ToF
Time-of-Flight
- TOS
Time on Stream
- WGS
Water–Gas Shift
Biographies
Xinbin Yu is a postdoctoral researcher at Chemical Sciences Division, Oak Ridge National Laboratory (ORNL). He obtained his Ph.D. degree in Chemical Engineering from the University of South Carolina in 2020. He is currently working under the supervision of Dr. Zili Wu and Dr. Anibal Ramirez Cuesta. His research interests focus on developing efficient catalysts for various reactions (e.g., semihydrogenation of acetylene, hydrogenation of C=O bond) and in situ spectroscopy.
Yongqiang Cheng is a Senior Research & Development Staff member in the Neutron Sciences Directorate at ORNL. He obtained his Ph.D. in Materials Science in 2010 from Johns Hopkins University. In 2011 he received the Clifford G. Shull Distinguished Fellowship to join ORNL. His research aims to integrate atomistic modeling, neutron scattering, and advanced data analysis to understand and predict fundamental processes in structural and functional materials. His recent scientific interests include host–guest interactions in chemical systems such as catalysts and metal–organic frameworks, solid-state ionic conductors for batteries and fuel cells, and disordered metals and semiconductors.
Yuanyuan Li is a Research & Development Staff member in the Surface Chemistry and Catalysis Group at the Chemical Sciences Division of ORNL. She obtained her Ph.D. degree from the University of Science and Technology of China in 2012. Her research interest focuses on tracking the structural dynamics of catalysts under reaction conditions and their correlation with catalytic performances for the rational design of catalysts.
Felipe Polo-Garzon is a Research & Development Staff member in the Surface Chemistry and Catalysis Group at the Chemical Sciences Division of ORNL. He received his B.S. in Chemical Engineering from Universidad del Valle in 2011 (Colombia) and his Ph.D. in Chemical Engineering from Clemson University in 2015 (United States). After obtaining his doctorate, he joined ORNL in 2016 as a postdoctoral researcher, and then he transitioned to a R&D Staff position in 2019. His research interests are in developing reactivity descriptors for reconstructing heterogeneous catalysts, as well as the elucidation of governing reaction mechanisms through in situ and operando characterization techniques, kinetic analysis, and computational tools.
Jue Liu is currently a beamline scientist at NOMAD. He obtained his B.S. degree in Materials Chemistry from the University of Science and Technology of China. He received his Ph.D. in Chemistry from Stony Brook University (President’s Award) in 2015. He then started a postdoc at ORNL’s Spallation Neutron Source before moving to his current position. His research interests include crystallography, solid-state chemistry, neutron and X-ray scattering, and their applications in studying energy storage and catalytic materials.
Eugene Mamontov received his Ph.D. in Materials Science and Engineering from the University of Pennsylvania in 1999. He was a postdoctoral researcher with Professor Takeshi Egami at the University of Pennsylvania until 2003 when he became a research associate at the National Institute of Standards and Technology Center for Neutron Research and the University of Maryland. He is currently a distinguished research & development staff member at ORNL, where he has been employed since 2006. His current research interests concern neutron instrumentation and microscopic dynamics in various systems, from liquids to biological and soft matter. He is a coauthor of more than 250 peer-reviewed publications.
Meijun Li is currently a Research Staff member in the Chemical Process Scale Up group at the Manufacturing Sciences Division of ORNL. She received her Ph.D. in Physical Chemistry in 2002 from the Dalian Institute of Chemical Physics (DICP) Chinese Academy of Sciences (CAS). Her research interests include novel materials synthesis for catalyst development, heterogeneous catalysis, electrocatalysis, biomass conversion, and in situ spectroscopy investigations of catalytic mechanisms.
David Lennon is a Professor of Physical Chemistry at the University of Glasgow, where he heads the Heterogeneous Catalysis Section. He has approximately 30 years of experience applying neutron scattering techniques (mainly INS) to examine chemistry at the gas/solid interface. A significant body of that work has been undertaken in partnership with industry. In 2021 D.L. was awarded the STFC ISIS Facility Impact Award – Economy.
Stewart F. Parker is the ISIS Catalysis Scientist and is an STFC Individual Merit Fellow. He joined ISIS in 1993, having completed a Ph.D. at the University of California at Santa Barbara, a postdoctoral fellowship at the University of East Anglia working on reflection absorption infrared spectroscopy of surface species in Mike Chesters’ group, and worked at the BP Research Centre for eight years. His interests are the application of vibrational spectroscopy (especially INS) to chemical problems, particularly in the areas of catalysis, hydrogen storage materials, and inorganic chemistry. He was awarded the Norman Sheppard prize for Vibrational Spectroscopy in 2021.
Anibal J. (Timmy) Ramirez-Cuesta is the Leader of the Instrument Development Group and a Distinguished Research & Development Staff member at the Neutron Sciences Directorate at ORNL. He studied Physics at the University of San Luis in Argentina, and his Ph.D. Thesis was Monte Carlo computer modeling of chemical reactions on surfaces. Following a postdoc at the University of Reading in the UK, he worked at the Rutherford Appleton Laboratory in the UK as a senior instrument scientist at the TOSCA spectrometer. He rigorously developed the methodology to calculate the inelastic neutron spectra during this time using DFT methods. He joined ORNL in 2013 as Leader of the Chemical Spectroscopy Group. He is the author of the ICEMAN software and the coauthor of the book Vibrational Spectroscopy with Neutrons: with Applications in Chemistry, Materials Science and Catalysis; World Scientific 2005. His research interest includes computational methods, software development, data analysis, sample environment and instrumentation in neutron scattering science, catalysis, hydrogen storage, porous materials, and gas adsorption.
Zili Wu is currently the Leader of the Surface Chemistry and Catalysis Group at the Chemical Sciences Division and a Distinguished Research & Development Staff member with a joint appointment at the Center for Nanophase Materials Sciences of ORNL, the Thrust 2 Leader in the UNCAGE-ME Center, one of US-DOE’s Energy Frontier Research Centers. He received his Ph.D. in Physical Chemistry in 2001 from the Dalian Institute of Chemical Physics (DICP) Chinese Academy of Sciences (CAS). After over three years at Northwestern University as a postdoctoral associate, he joined the staff of ORNL in 2006. He is a recent recipient of the Excellence in Catalysis Award (2019) from the Catalysis Society of Metropolitan New York. His research interests include fundamental understanding of catalytic active sites on the surfaces and interfaces involved in heterogeneous catalysis, photocatalysis and electrocatalysis, developing in situ and operando characterization methods including optical and neutron spectroscopy, and fabricating nanomaterials with well-defined structures.
Supporting Information Available
The Supporting Information is available free of charge at https://pubs.acs.org/doi/10.1021/acs.chemrev.3c00101.
Neutron sources listed in Table S1; INS studies of catalysts, adsorbates, and reaction species are briefly summarized in Table S2 (PDF)
Author Contributions
CRediT: Xinbin Yu writing-original draft, writing-review & editing; Yongqiang Cheng writing-original draft, writing-review & editing; Yuanyuan Li writing-original draft, writing-review & editing; Felipe Polo-Garzon writing-original draft, writing-review & editing; Jue Liu writing-original draft, writing-review & editing; Eugene Manontov writing-original draft, writing-review & editing; Meijun Li writing-original draft, writing-review & editing; David Lennon conceptualization, writing-original draft, writing-review & editing; Stewart F. Parker conceptualization, writing-original draft, writing-review & editing; Anibal J. Ramirez–Cuesta conceptualization, writing-review & editing; Zili Wu conceptualization, funding acquisition, project administration, supervision, writing-original draft, writing-review & editing.
The authors declare no competing financial interest.
Special Issue
Published as part of the Chemical Reviewsvirtual special issue “Operando and In Situ Studies in Catalysis and Electrocatalysis”.
Supplementary Material
References
- Bernstein S.; Hoffmann M. The Politics of Decarbonization and the Catalytic Impact of Subnational Climate Experiments. Policy Sci. 2018, 51, 189–211. 10.1007/s11077-018-9314-8. [DOI] [PMC free article] [PubMed] [Google Scholar]
- Papanikolaou G.; Centi G.; Perathoner S.; Lanzafame P. Catalysis for e-Chemistry: Need and Gaps for a Future De-Fossilized Chemical Production, with Focus on the Role of Complex (Direct) Syntheses by Electrocatalysis. ACS Catal. 2022, 12, 2861–2876. 10.1021/acscatal.2c00099. [DOI] [PMC free article] [PubMed] [Google Scholar]
- Weckhuysen B. M. Determining the Active Site in a Catalytic Process: Operando Spectroscopy is More than a Buzzword. Phys. Chem. Chem. Phys. 2003, 5, 4351–4360. 10.1039/b309650p. [DOI] [Google Scholar]
- Chakrabarti A.; Ford M. E.; Gregory D.; Hu R.; Keturakis C. J.; Lwin S.; Tang Y. D.; Yang Z.; Zhu M. H.; Bañares M. A.; et al. A decade+ of Operando Spectroscopy Studies. Catal. Today 2017, 283, 27–53. 10.1016/j.cattod.2016.12.012. [DOI] [Google Scholar]
- Dou J.; Sun Z. C.; Opalade A. A.; Wang N.; Fu W. S.; Tao F. Operando Chemistry of Catalyst Surfaces during Catalysis. Chem. Soc. Rev. 2017, 46, 2001–2027. 10.1039/C6CS00931J. [DOI] [PubMed] [Google Scholar]
- Timoshenko J.; Roldan Cuenya B. In Situ/Operando Electrocatalyst Characterization by X-ray Absorption Spectroscopy. Chem. Rev. 2021, 121, 882–961. 10.1021/acs.chemrev.0c00396. [DOI] [PMC free article] [PubMed] [Google Scholar]
- Li Y. Y.; Frenkel A. I. Deciphering the Local Environment of Single-Atom Catalysts with X-ray Absorption Spectroscopy. Acc. Chem. Res. 2021, 54, 2660–2669. 10.1021/acs.accounts.1c00180. [DOI] [PubMed] [Google Scholar]
- Zaera F. In-situ and Operando Spectroscopies for the Characterization of Catalysts and of Mechanisms of Catalytic Reactions. J. Catal. 2021, 404, 900–910. 10.1016/j.jcat.2021.08.013. [DOI] [Google Scholar]
- Lamberti C.; Zecchina A.; Groppo E.; Bordiga S. Probing the Surfaces of Heterogeneous Catalysts by In Situ IR Spectroscopy. Chem. Soc. Rev. 2010, 39, 4951–5001. 10.1039/c0cs00117a. [DOI] [PubMed] [Google Scholar]
- Hess C. New Advances in Using Raman Spectroscopy for the Characterization of Catalysts and Catalytic Reactions. Chem. Soc. Rev. 2021, 50, 3519–3564. 10.1039/D0CS01059F. [DOI] [PubMed] [Google Scholar]
- Bañares M. A.; Wachs I. E. Molecular Structures of Supported Metal Oxide Catalysts under Different Environments. J. Raman Spectrosc. 2002, 33, 359–380. 10.1002/jrs.866. [DOI] [Google Scholar]
- Bravo-Suárez J. J.; Srinivasan P. D. Design Characteristics of In Situ and Operando Ultraviolet-visible and Vibrational Spectroscopic Reaction Cells for Heterogeneous Catalysis. Catal. Rev.: Sci. Eng. 2017, 59, 295–445. 10.1080/01614940.2017.1360071. [DOI] [Google Scholar]
- Hwang S.; Chen X. B.; Zhou G. W.; Su D. In Situ Transmission Electron Microscopy on Energy-Related Catalysis. Adv. Energy Mater. 2020, 10, 1902105. 10.1002/aenm.201902105. [DOI] [Google Scholar]
- Tao F.; Crozier P. A. Atomic-Scale Observations of Catalyst Structures under Reaction Conditions and during Catalysis. Chem. Rev. 2016, 116, 3487–3539. 10.1021/cr5002657. [DOI] [PubMed] [Google Scholar]
- Gao W. P.; Hood Z. D.; Chi M. F. Interfaces in Heterogeneous Catalysts: Advancing Mechanistic Understanding through Atomic-Scale Measurements. Acc. Chem. Res. 2017, 50, 787–795. 10.1021/acs.accounts.6b00596. [DOI] [PubMed] [Google Scholar]
- Albers P. W.; Parker S. F.. Inelastic Incoherent Neutron Scattering in Catalysis Research. In Advances in Catalysis; Gates B. C., Knözinger H., Eds.; Vol. 51; Academic Press, 2007; pp 99–132. 10.1016/S0360-0564(06)51003-X [DOI] [Google Scholar]
- Parker S. F.; Lennon D. Applications of Neutron Scattering to Heterogeneous Catalysis. J. Phys. Conf. Ser. 2016, 746, 012066. 10.1088/1742-6596/746/1/012066. [DOI] [Google Scholar]
- Turner J. F. C.; Benmore C. J.; Barker C. M.; Kaltsoyannis N.; Thomas J. M.; David W. I. F.; Catlow C. R. A. Probing the Nature of Acetylene Bound to the Active Site of a NiNa-Zeolite Y Catalyst by in situ Neutron Scattering. J. Phys. Chem. B 2000, 104, 7570–7573. 10.1021/jp0017994. [DOI] [Google Scholar]
- Thomas J. M.High-Resolution Electron Microscopy, Neutron Diffraction with Isotopic Substitution and X-Ray Absorption Fine Structure for the Characterisation of Active Sites in Oxide Catalysts. In Studies in Surface Science and Catalysis; Gamba A., Colella C., Coluccia S., Eds.; Vol. 140; Elsevier, 2001; pp 1–12. 10.1016/S0167-2991(01)80131-2 [DOI] [Google Scholar]
- Kammert J.; Moon J.; Cheng Y. Q.; Daemen L.; Irle S.; Fung V.; Liu J.; Page K.; Ma X. H.; Phaneuf V.; et al. Nature of Reactive Hydrogen for Ammonia Synthesis over a Ru/C12A7 Electride Catalyst. J. Am. Chem. Soc. 2020, 142, 7655–7667. 10.1021/jacs.0c02345. [DOI] [PubMed] [Google Scholar]
- Wright P. A.; Thomas J. M.; Cheetham A. K.; Nowak A. K. Localizing Active Sites in Zeolitic Catalysts: Neutron Powder Profile Analysis and Computer Simulation of Deuteropyridine Bound to Gallozeolite-L. Nature 1985, 318, 611–614. 10.1038/318611a0. [DOI] [Google Scholar]
- Goyal R.; Fitch A. N.; Jobic H. Powder Neutron and X-ray Diffraction Studies of Benzene Adsorbed in Zeolite ZSM-5. J. Phys. Chem. B 2000, 104, 2878–2884. 10.1021/jp992984o. [DOI] [Google Scholar]
- Falkowska M.; Chansai S.; Manyar H. G.; Gladden L. F.; Bowron D. T.; Youngs T. G. A.; Hardacre C. Determination of Toluene Hydrogenation Kinetics with Neutron Diffraction. Phys. Chem. Chem. Phys. 2016, 18, 17237–17243. 10.1039/C6CP01494A. [DOI] [PubMed] [Google Scholar]
- Youngs T. G. A.; Manyar H.; Bowron D. T.; Gladden L. F.; Hardacre C. Probing Chemistry and Kinetics of Reactions in Heterogeneous Catalysts. Chem. Sci. 2013, 4, 3484–3489. 10.1039/c3sc51477c. [DOI] [Google Scholar]
- Bee M.Quasielastic neutron scattering: principles and applications in solid state chemistry, biology, and materials science; Adam Hilger: Bristol, UK, 1988. [Google Scholar]
- Blasco T. Insights into Reaction Mechanisms in Heterogeneous Catalysis Revealed by In Situ NMR Spectroscopy. Chem. Soc. Rev. 2010, 39, 4685–4702. 10.1039/c0cs00033g. [DOI] [PubMed] [Google Scholar]
- Zhang W. P.; Xu S. T.; Han X. W.; Bao X. H. In Situ Solid-state NMR for Heterogeneous Catalysis: A Joint Experimental and Theoretical Approach. Chem. Soc. Rev. 2012, 41, 192–210. 10.1039/C1CS15009J. [DOI] [PubMed] [Google Scholar]
- Ramirez-Cuesta A. J.; Mitchell P. C. H.. Neutrons and Neutron Spectroscopy. In Local Structural Characterisation, John Wiley & Sons, 2013; pp 173–224. [Google Scholar]
- O’Malley A. J.; Parker S. F.; Catlow C. R. A. Neutron Spectroscopy as a Tool in Catalytic Science. Chem. Commun. 2017, 53, 12164–12176. 10.1039/C7CC05982E. [DOI] [PubMed] [Google Scholar]
- Neumann D. A. Neutron Scattering and Hydrogenous Materials. Mater. Today 2006, 9, 34–41. 10.1016/S1369-7021(05)71336-5. [DOI] [Google Scholar]
- Parker S. F.; Lennon D.; Albers P. W. Vibrational Spectroscopy with Neutrons: A Review of New Directions. Appl. Spectrosc. 2011, 65, 1325–1341. 10.1366/11-06456. [DOI] [Google Scholar]
- Lennon D.; Parker S. F. Inelastic Neutron Scattering Studies of Methyl Chloride Synthesis over Alumina. Acc. Chem. Res. 2014, 47, 1220–1227. 10.1021/ar400271c. [DOI] [PubMed] [Google Scholar]
- Ramirez-Cuesta A. J.; Jones M. O.; David W. I. F. Neutron Scattering and Hydrogen Storage. Mater. Today 2009, 12, 54–61. 10.1016/S1369-7021(09)70299-8. [DOI] [Google Scholar]
- Polo-Garzon F.; Luo S.; Cheng Y. Q.; Page K. L.; Ramirez-Cuesta A. J.; Britt P. F.; Wu Z. L. Neutron Scattering Investigations of Hydride Species in Heterogeneous Catalysis. ChemSusChem 2019, 12, 93–103. 10.1002/cssc.201801890. [DOI] [PubMed] [Google Scholar]
- Xue Z. L.; Ramirez-Cuesta A. J.; Brown C. M.; Calder S.; Cao H. B.; Chakoumakos B. C.; Daemen L. L.; Huq A.; Kolesnikov A. I.; Mamontov E.; et al. Neutron Instruments for Research in Coordination Chemistry. Eur. J. Inorg. Chem. 2019, 2019, 1065–1089. 10.1002/ejic.201801076. [DOI] [PMC free article] [PubMed] [Google Scholar]
- Parker S. F.; Lennon D. Net Zero and Catalysis: How Neutrons Can Help. Physchem 2021, 1, 95. 10.3390/physchem1010007. [DOI] [Google Scholar]
- Albers P. W.; Lennon D.; Parker S. F.. Chapter 5 - Catalysis. In Experimental Methods in the Physical Sciences; Fernandez-Alonso F., Price D. L., Eds.; Vol. 49; Academic Press, 2017; pp 279–348. [Google Scholar]
- Huq A.; Chen W. R.. Neutron Scattering for In-situ Characterization of Heterogeneous Catalysis. In In-situ Characterization of Heterogeneous Catalysts; Rodriguez J. A., Hanson J. C., Chupas P. J., Eds.; John Wiley & Sons, 2013; pp 169–189. [Google Scholar]
- Mittal R.; Chaplot S. L.; Choudhury N.. Inelastic Neutron Scattering, Lattice Dynamics, Computer Simulation and Thermodynamic Properties. In Thermodynamic Properties of Solids: Experiment and Modeling; Chaplot S. L., Mittal R., Choudhury N., Eds.; Wiley-VCH, 2010; pp 75–121. [Google Scholar]
- Mitchell P.; Parker S.; Ramirez-Cuesta A.; Tomkinson J.. Vibrational Spectroscopy With Neutrons: With Applications in Chemistry, Biology, Materials Science and Catalysis; World Scientific: Singapore, 2005. 10.1142/5628 [DOI] [Google Scholar]
- Chadwick J. The Existence of a Neutron. Proc. R. Soc. A 1932, 136, 692–708. 10.1098/rspa.1932.0112. [DOI] [Google Scholar]
- Squires G. L.Introduction to the Theory of Thermal Neutron Scattering; Cambridge University Press: Cambridge, UK, 2012. [Google Scholar]
- Nobel Prize in Physics. https://www.nobelprize.org/prizes/physics/1994/summary/ (accessed 2023-02-13).
- Sears V. F. Neutron Scattering Lengths and Cross Sections. Neutron News 1992, 3, 26–37. 10.1080/10448639208218770. [DOI] [Google Scholar]
- Willis B.; Carlile C.. Experimental Neutron Scattering; Oxford University Press: Oxford, UK, 2009. [Google Scholar]
- Mason T. E. Pulsed Neutron Scattering for the 21st Century. Phys. Today 2006, 59, 44–49. 10.1063/1.2216961. [DOI] [Google Scholar]
- ISIS Neutron and Muon Source. https://www.isis.stfc.ac.uk/Pages/home.aspx (accessed 2023-02-13).
- Neutron Instruments at Japan Proton Accelerator Research Complex. https://j-parc.jp/researcher/MatLife/en/instrumentation/ns.html (accessed 2023-02-13).
- Spallation Neutron Source at Oak Ridge National Laboratory. https://neutrons.ornl.gov/sns (accessed 2023-02-13).
- China Spallation Neutron Source. http://english.ihep.cas.cn/csns/ (accessed 2023-02-13).
- European Spallation Source. https://europeanspallationsource.se/ (accessed 2023-02-13).
- Second Target Station at SNS. https://neutrons.ornl.gov/sts (accessed 2023-02-13).
- McGreevy R. L.; Pusztai L. Reverse Monte Carlo Simulation: A New Technique for the Determination of Disordered Structures. Mol. Simul. 1988, 1, 359–367. 10.1080/08927028808080958. [DOI] [Google Scholar]
- Tucker M. G.; Keen D. A.; Dove M. T.; Goodwin A. L.; Hui Q. RMCProfile: Reverse Monte Carlo for Polycrystalline Materials. J. Phys.: Condens. Matter 2007, 19, 335218. 10.1088/0953-8984/19/33/335218. [DOI] [PubMed] [Google Scholar]
- Kresse G.; Furthmüller J. Efficiency of ab-initio Total Energy Calculations for Metals and Semiconductors Using a Plane-wave Basis Set. Comput. Mater. Sci. 1996, 6, 15–50. 10.1016/0927-0256(96)00008-0. [DOI] [PubMed] [Google Scholar]
- Refson K.; Tulip P. R.; Clark S. J. Variational Density-functional Perturbation Theory for Dielectrics and Lattice Dynamics. Phys. Rev. B 2006, 73, 155114. 10.1103/PhysRevB.73.155114. [DOI] [Google Scholar]
- Kühne T. D.; Iannuzzi M.; Del Ben M.; Rybkin V. V.; Seewald P.; Stein F.; Laino T.; Khaliullin R. Z.; Schütt O.; Schiffmann F.; et al. CP2K: An Electronic Structure and Molecular Dynamics Software Package - Quickstep: Efficient and Accurate Electronic Structure Calculations. J. Chem. Phys. 2020, 152, 194103. 10.1063/5.0007045. [DOI] [PubMed] [Google Scholar]
- Cheng Y. Q.; Daemen L. L.; Kolesnikov A. I.; Ramirez-Cuesta A. J. Simulation of Inelastic Neutron Scattering Spectra Using OCLIMAX. J. Chem. Theory Comput. 2019, 15, 1974–1982. 10.1021/acs.jctc.8b01250. [DOI] [PubMed] [Google Scholar]
- Cheng Y. Q.; Kolesnikov A. I.; Ramirez-Cuesta A. J. Simulation of Inelastic Neutron Scattering Spectra Directly from Molecular Dynamics Trajectories. J. Chem. Theory Comput. 2020, 16, 7702–7708. 10.1021/acs.jctc.0c00937. [DOI] [PubMed] [Google Scholar]
- Armstrong J.; O’Malley A. J.; Ryder M. R.; Butler K. T. Understanding Dynamic Properties of Materials Using Neutron Spectroscopy and Atomistic Simulation. J. Phys. Commun. 2020, 4, 072001. 10.1088/2399-6528/ab9c2e. [DOI] [Google Scholar]
- Harrelson T. F.; Dettmann M.; Scherer C.; Andrienko D.; Moulé A. J.; Faller R. Computing Inelastic Neutron Scattering Spectra from Molecular Dynamics Trajectories. Sci. Rep. 2021, 11, 7938. 10.1038/s41598-021-86771-5. [DOI] [PMC free article] [PubMed] [Google Scholar]
- Goret G.; Aoun B.; Pellegrini E. MDANSE: An Interactive Analysis Environment for Molecular Dynamics Simulations. J. Chem. Inf. Model. 2017, 57, 1–5. 10.1021/acs.jcim.6b00571. [DOI] [PubMed] [Google Scholar]
- Dymkowski K.; Parker S. F.; Fernandez-Alonso F.; Mukhopadhyay S. AbINS: The Modern Software for INS Interpretation. Phys. B: Condens. Matter 2018, 551, 443–448. 10.1016/j.physb.2018.02.034. [DOI] [Google Scholar]
- Fair R.; Jackson A.; Voneshen D.; Jochym D.; Le D.; Refson K.; Perring T. Euphonic: Inelastic Neutron Scattering Simulations from Force Constants and Visualization Tools for Phonon Properties. J. Appl. Crystallogr. 2022, 55, 1689–1703. 10.1107/S1600576722009256. [DOI] [PMC free article] [PubMed] [Google Scholar]
- Parker S. F. Vibrational Spectroscopy of N-phenylmaleimide. Spectrochim. Acta A Mol. Biomol. Spectrosc. 2006, 63, 544–549. 10.1016/j.saa.2005.06.001. [DOI] [PubMed] [Google Scholar]
- SINQ: The Swiss Spallation Neutron Source. https://www.psi.ch/en/sinq (accessed 05-05).
- Fåk B.; Rols S.; Manzin G.; Meulien O.. Panther—the New Thermal Neutron Time-of-flight Spectrometer at the ILL. In EPJ. Web of Conferences; Paper 02001; EDP Sciences, 2022.
- DCS Disk Chopper Spectrometer. https://www.nist.gov/ncnr/dcs-disk-chopper-spectrometer (accessed 05-05).
- Shirane G.; Shapiro S. M.; Tranquada J. M.. Neutron scattering with a triple-axis spectrometer: basic techniques; Cambridge University Press: Cambridge, UK, 2002. [Google Scholar]
- Udovic T. J.; Neumann D. A.; Leao J.; Brown C. M. Origin and Removal of Spurious Background Peaks in Vibrational Spectra Measured by Filter-analyzer Neutron Spectrometers. Nucl. Instrum. Methods Phys. Res. A: Accel. Spectrom. Detect. Assoc. Equip. 2004, 517, 189–201. 10.1016/j.nima.2003.10.083. [DOI] [Google Scholar]
- Ivanov A.; Jimenéz-Ruiz M.; Kulda J. IN1-LAGRANGE-the New ILL Instrument to Explore Vibration Dynamics of Complex Materials. J. Phys. Conf. Ser. 2014, 554, 012001. 10.1088/1742-6596/554/1/012001. [DOI] [Google Scholar]
- Parker S. F.; Ramirez-Cuesta A. J.; Albers P. W.; Lennon D. The Use of Direct Geometry Spectrometers in Molecular Spectroscopy. J. Phys. Conf. Ser. 2014, 554, 012004. 10.1088/1742-6596/554/1/012004. [DOI] [Google Scholar]
- Parker S. F. The Role of Hydroxyl Groups in Low Temperature Carbon Monoxide Oxidation. Chem. Commun. 2011, 47, 1988–1990. 10.1039/c0cc04991c. [DOI] [PubMed] [Google Scholar]
- Young J. A.; Koppel J. U. Slow Neutron Scattering by Molecular Hydrogen and Deuterium. Phys. Rev. 1964, 135, A603–A611. 10.1103/PhysRev.135.A603. [DOI] [Google Scholar]
- Brown C. M.; Liu Y.; Yildirim T.; Peterson V. K.; Kepert C. J. Hydrogen Adsorption in HKUST-1: A Combined Inelastic Neutron Scattering and First-principles Study. Nanotechnology 2009, 20, 204025. 10.1088/0957-4484/20/20/204025. [DOI] [PubMed] [Google Scholar]
- Xu M. Z.; Bačić Z. Inelastic Neutron Scattering Spectra of a Hydrogen Molecule in a Nanocavity: Methodology for Quantum Calculations Incorporating the Coupled Five-dimensional Translation-rotation Egenstates. Phys. Rev. B 2011, 84, 195445. 10.1103/PhysRevB.84.195445. [DOI] [Google Scholar]
- Larese J. Z.; Arnold T.; Frazier L.; Hinde R. J.; Ramirez-Cuesta A. J. Direct Observation of H2 Binding to a Metal Oxide Surface. Phys. Rev. Lett. 2008, 101, 165302. 10.1103/PhysRevLett.101.165302. [DOI] [PubMed] [Google Scholar]
- Larese J. Z.; Arnold T.; Barbour A.; Frazier L. R. Neutron Investigations of Rotational Motions in Monolayer and Multilayer Films at the Interface of MgO and Graphite Surfaces. Langmuir 2009, 25, 4078–4083. 10.1021/la802929b. [DOI] [PubMed] [Google Scholar]
- Hartl M.; Gillis R. C.; Daemen L.; Olds D. P.; Page K.; Carlson S.; Cheng Y. Q.; Hügle T.; Iverson E. B.; Ramirez-Cuesta A. J.; et al. Hydrogen Adsorption on Two Catalysts for the Ortho- to Parahydrogen Conversion: Cr-doped Silica and Ferric Oxide Gel. Phys. Chem. Chem. Phys. 2016, 18, 17281–17293. 10.1039/C6CP01154C. [DOI] [PubMed] [Google Scholar]
- Ramirez-Cuesta A. J.; Mitchell P. C. H. Hydrogen Adsorption in a Copper ZSM5 Zeolite: An Inelastic Neutron Scattering Study. Catal. Today 2007, 120, 368–373. 10.1016/j.cattod.2006.09.024. [DOI] [Google Scholar]
- Eckert J.; Nicol J. M.; Howard J.; Trouw F. R. Adsorption of Hydrogen in Ca-Exchanged Na-A Zeolites Probed by Inelastic Neutron Scattering Spectroscopy. J. Phys. Chem. 1996, 100, 10646–10651. 10.1021/jp952982d. [DOI] [Google Scholar]
- Ren Y.; Price D. L. Neutron Scattering Study of H2 Adsorption in Single-walled Carbon Nanotubes. Appl. Phys. Lett. 2001, 79, 3684–3686. 10.1063/1.1421639. [DOI] [Google Scholar]
- Olsen R. J.; Beckner M.; Stone M. B.; Pfeifer P.; Wexler C.; Taub H. Quantum Excitation Spectrum of Hydrogen Adsorbed in Nanoporous Carbons Observed by Inelastic Neutron Scattering. Carbon 2013, 58, 46–58. 10.1016/j.carbon.2013.02.026. [DOI] [Google Scholar]
- Yang S. H.; Ramirez-Cuesta A. J.; Schröder M. Inelastic Neutron Scattering Study of Binding of Para-hydrogen in an Ultra-microporous Metal-organic Framework. Chem. Phys. 2014, 428, 111–116. 10.1016/j.chemphys.2013.11.004. [DOI] [Google Scholar]
- Parker S. F. The Interaction of Hydrogen with Iron Benzene-1,3,5-Tricarboxylate (Fe-BTC). Catalysts 2020, 10, 1255. 10.3390/catal10111255. [DOI] [Google Scholar]
- Sumida K.; Her J. H.; Dincǎ M.; Murray L. J.; Schloss J. M.; Pierce C. J.; Thompson B. A.; FitzGerald S. A.; Brown C. M.; Long J. R. Neutron Scattering and Spectroscopic Studies of Hydrogen Adsorption in Cr3(BTC)2—A Metal-Organic Framework with Exposed Cr2+ Sites. J. Phys. Chem. C 2011, 115, 8414–8421. 10.1021/jp200638n. [DOI] [Google Scholar]
- Weinrauch I.; Savchenko I.; Denysenko D.; Souliou S. M.; Kim H-H; Le Tacon M.; Daemen L. L.; Cheng Y.; Mavrandonakis A.; Ramirez-Cuesta A. J.; Volkmer D.; Schutz G.; Hirscher M.; Heine T. Capture of Heavy Hydrogen Isotopes in a Metal-organic Framework with Active Cu(I) Sites. Nat. Commun. 2017, 8, 14496. 10.1038/ncomms14496. [DOI] [PMC free article] [PubMed] [Google Scholar]
- Kubas G. J. Fundamentals of H2 Binding and Reactivity on Transition Metals Underlying Hydrogenase Function and H2 Production and Storage. Chem. Rev. 2007, 107, 4152–4205. 10.1021/cr050197j. [DOI] [PubMed] [Google Scholar]
- Eckert J.; Kubas G. J.; Dianoux A. J. Rotational Tunneling of Bound H2 in a Tungsten Complex. J. Chem. Phys. 1988, 88, 466–468. 10.1063/1.454625. [DOI] [Google Scholar]
- Wang Q. R.; Guo J. P.; Chen P. Recent Progress Towards Mild-condition Ammonia Synthesis. J. Energy Chem. 2019, 36, 25–36. 10.1016/j.jechem.2019.01.027. [DOI] [Google Scholar]
- Daisley A.; Hargreaves J. S. J. Nitrides, Hydrides and Carbides as Alternative Heterogeneous Catalysts for Ammonia Synthesis: A Brief Overview. Johnson Matthey Technol. Rev. 2022, 66, 326–330. 10.1595/205651322X16493249558666. [DOI] [Google Scholar]
- Jacobsen C. J. H. Novel Class of Ammonia Synthesis Catalysts. Chem. Commun. 2000, 1057–1058. 10.1039/b002930k. [DOI] [Google Scholar]
- AlShibane I.; Daisley A.; Hargreaves J. S. J.; Hector A. L.; Laassiri S.; Rico J. L.; Smith R. I. The Role of Composition for Cobalt Molybdenum Carbide in Ammonia Synthesis. ACS Sustain. Chem. Eng. 2017, 5, 9214–9222. 10.1021/acssuschemeng.7b02168. [DOI] [Google Scholar]
- Laassiri S.; Zeinalipour-Yazdi C. D.; Bion N.; Catlow C. R. A.; Hargreaves J. S. J. Combination of Theoretical and In Situ Experimental Investigations of the Role of Lithium Dopant in Manganese Nitride: A Two-stage Reagent for Ammonia Synthesis. Faraday Discuss. 2021, 229, 281–296. 10.1039/C9FD00131J. [DOI] [PubMed] [Google Scholar]
- Zeinalipour-Yazdi C. D.; Hargreaves J. S. J.; Catlow C. R. A. Low-T Mechanisms of Ammonia Synthesis on Co3Mo3N. J. Phys. Chem. C 2018, 122, 6078–6082. 10.1021/acs.jpcc.7b12364. [DOI] [Google Scholar]
- Guo J. P.; Chen P. Interplay of Alkali, Transition Metals, Nitrogen, and Hydrogen in Ammonia Synthesis and Decomposition Reactions. Acc. Chem. Res. 2021, 54, 2434–2444. 10.1021/acs.accounts.1c00076. [DOI] [PubMed] [Google Scholar]
- Auffermann G.; Barrera G. D.; Colognesi D.; Corradi G.; Ramirez-Cuesta A. J.; Zoppi M. Hydrogen Dynamics in Heavy Alkali Metal Hydrides Obtained through Inelastic Neutron Scattering. J. Phys.: Condens. Matter 2004, 16, 5731. 10.1088/0953-8984/16/32/010. [DOI] [Google Scholar]
- Schimmel H. G.; Johnson M. R.; Kearley G. J.; Ramirez-Cuesta A. J.; Huot J.; Mulder F. M. The vibrational Spectrum of Magnesium Hydride from Inelastic Neutron Scattering and Density Functional Theory. Mater. Sci. Eng. B Solid State Mater. Adv. Technol. 2004, 108, 38–41. 10.1016/j.mseb.2003.10.035. [DOI] [Google Scholar]
- Colognesi D.; Barrera G.; Ramirez-Cuesta A. J.; Zoppi M. Hydrogen Self-dynamics in Orthorhombic Alkaline Earth Hydrides through Incoherent Inelastic Neutron Scattering. J. Alloys Compd. 2007, 427, 18–24. 10.1016/j.jallcom.2006.03.031. [DOI] [Google Scholar]
- Parker S. F. Spectroscopy and Bonding in Ternary Metal Hydride Complexes—Potential Hydrogen Storage Media. Coord. Chem. Rev. 2010, 254, 215–234. 10.1016/j.ccr.2009.06.016. [DOI] [Google Scholar]
- Moon J.; Cheng Y. Q.; Daemen L.; Novak E.; Ramirez-Cuesta A. J.; Wu Z. L. On the Structural Transformation of Ni/BaH2 During a N2-H2 Chemical Looping Process for Ammonia Synthesis: A Joint In Situ Inelastic Neutron Scattering and First-Principles Simulation Study. Top. Catal. 2021, 64, 685–692. 10.1007/s11244-021-01445-w. [DOI] [Google Scholar]
- Kobayashi Y.; Hernandez O. J.; Sakaguchi T.; Yajima T.; Roisnel T.; Tsujimoto Y.; Morita M.; Noda Y.; Mogami Y.; Kitada A.; et al. An Oxyhydride of BaTiO3 Exhibiting Hydride Exchange and Electronic Conductivity. Nat. Mater. 2012, 11, 507–511. 10.1038/nmat3302. [DOI] [PubMed] [Google Scholar]
- Granhed E. J.; Lindman A.; Eklöf-Österberg C.; Karlsson M.; Parker S. F.; Wahnström G. Band vs. Polaron: Vibrational Motion and Chemical Expansion of Hydride Ions as Signatures for the Electronic Character in Oxyhydride Barium Titanate. J. Mater. Chem. A 2019, 7, 16211–16221. 10.1039/C9TA00086K. [DOI] [Google Scholar]
- Eklöf-Österberg C.; Mazzei L.; Granhed E. J.; Wahnström G.; Nedumkandathil R.; Häussermann U.; Jaworski A.; Pell A. J.; Parker S. F.; Jalarvo N. H.; et al. The Role of Oxygen Vacancies on the Vibrational Motions of Hydride Ions in the Oxyhydride of Barium Titanate. J. Mater. Chem. A 2020, 8, 6360–6371. 10.1039/C9TA11912D. [DOI] [Google Scholar]
- Fjellvåg Ø. S.; Armstrong J.; Vajeeston P.; Sjåstad A. O. New Insights into Hydride Bonding, Dynamics, and Migration in La2LiHO3 Oxyhydride. J. Phys. Chem. Lett. 2018, 9, 353–358. 10.1021/acs.jpclett.7b03098. [DOI] [PubMed] [Google Scholar]
- Jalowiecki-Duhamel L.; Debeusscher S.; Zarrou H.; D’Huysser A.; Jobic H.; Payen E. Hydrogen Storage in CeNiXOY and CeM0.5NiXOY (M = Zr or Al) Mixed Oxides. Catal. Today 2008, 138, 266–271. 10.1016/j.cattod.2008.06.031. [DOI] [Google Scholar]
- Kitano M.; Kujirai J.; Ogasawara K.; Matsuishi S.; Tada T.; Abe H.; Niwa Y.; Hosono H. Low-Temperature Synthesis of Perovskite Oxynitride-Hydrides as Ammonia Synthesis Catalysts. J. Am. Chem. Soc. 2019, 141, 20344–20353. 10.1021/jacs.9b10726. [DOI] [PubMed] [Google Scholar]
- Miyazaki M.; Ogasawara K.; Nakao T.; Sasase M.; Kitano M.; Hosono H. Hexagonal BaTiO(3-x)Hx Oxyhydride as a Water-Durable Catalyst Support for Chemoselective Hydrogenation. J. Am. Chem. Soc. 2022, 144, 6453–6464. 10.1021/jacs.2c00976. [DOI] [PubMed] [Google Scholar]
- Pirez C.; Capron M.; Jobic H.; Dumeignil F.; Jalowiecki-Duhamel L. Highly Efficient and Stable CeNiHZOY Nano-Oxyhydride Catalyst for H2 Production from Ethanol at Room Temperature. Angew. Chem., Int. Ed. 2011, 50, 10193–10197. 10.1002/anie.201102617. [DOI] [PubMed] [Google Scholar]
- Fang W. H.; Pirez C.; Paul S.; Capron M.; Jobic H.; Dumeignil F.; Jalowiecki-Duhamel L. Room Temperature Hydrogen Production from Ethanol over CeNiXHZOY Nano-Oxyhydride Catalysts. ChemCatChem. 2013, 5, 2207–2216. 10.1002/cctc.201300087. [DOI] [Google Scholar]
- Fang W. H.; Pirez C.; Paul S.; Jiménez-Ruiz M.; Jobic H.; Dumeignil F.; Jalowiecki-Duhamel L. Advanced Functionalized Mg2AlNiXHZ.OY Nano-Oxyhydrides Ex-hydrotalcites for Hydrogen Production from Oxidative Steam Reforming of Ethanol. Int. J. Hydrogen Energy 2016, 41, 15443–15452. 10.1016/j.ijhydene.2016.04.019. [DOI] [Google Scholar]
- Pirez C.; Fang W. H.; Capron M.; Paul S.; Jobic H.; Dumeignil F.; Jalowiecki-Duhamel L. Steam Reforming, Partial Oxidation and Oxidative Steam Reforming for Hydrogen Production from Ethanol over Cerium Nickel Based Oxyhydride Catalyst. Appl. Catal., A 2016, 518, 78–86. 10.1016/j.apcata.2015.10.035. [DOI] [Google Scholar]
- Greenwood N. N.; Earnshaw A.. Chemistry of the Elements; Pergamon Press: Oxford, UK, 1984. [Google Scholar]
- Antonov V. E.; Fedotov V. K.; Ivanov A. S.; Kolesnikov A. I.; Kuzovnikov M. A.; Tkacz M.; Yartys V. A. Lattice Dynamics of High-pressure Hydrides Studied by Inelastic Neutron Scattering. J. Alloys Compd. 2022, 905, 164208. 10.1016/j.jallcom.2022.164208. [DOI] [Google Scholar]
- Christmann K. Interaction of Hydrogen with Solid Surfaces. Surf. Sci. Rep. 1988, 9, 1–163. 10.1016/0167-5729(88)90009-X. [DOI] [Google Scholar]
- Sheppard N.; Erkelens J. Vibrational Spectra of Species Adsorbed on Surfaces: Forms of Vibrations and Selection Rules for Regular Arrays of Adsorbed Species. Appl. Spectrosc. 1984, 38, 471–485. 10.1366/0003702844555133. [DOI] [Google Scholar]
- Parker S. F.; Bowron D. T.; Imberti S.; Soper A. K.; Refson K.; Lox E. S.; Lopez M.; Albers P. Structure Determination of Adsorbed Hydrogen on a Real Catalyst. Chem. Commun. 2010, 46, 2959–2961. 10.1039/c001779e. [DOI] [PubMed] [Google Scholar]
- Jobic H.; Renouprez A. Inelastic Neutron Scattering Spectroscopy of Hydrogen Adsorbed on Raney Nickel. J. Chem. Soc., Faraday Trans. 1 1984, 80, 1991–1997. 10.1039/f19848001991. [DOI] [Google Scholar]
- Davidson A. L.; Lennon D.; Webb P. B.; Albers P. W.; Berweiler M.; Poss R.; Roos M.; Reinsdorf A.; Wolf D.; Parker S. F. The Characterisation of Hydrogen on Nickel and Cobalt Catalysts. Top. Catal. 2021, 64, 644–659. 10.1007/s11244-021-01425-0. [DOI] [Google Scholar]
- Radivojevic D.; Naumann D.; Saberi S.; Bae J.; Poss R.. Surface Modified Metallic Foam Body, Process for Its Production and Use Thereof. EP 2764 916 B1, 2017.
- Graham T. XVIII. On the Absorption and Dialytic Separation of Gases by Colloid Septa. Philos. Trans. R. Soc. London 1866, 156, 399–439. 10.1098/rstl.1866.0018. [DOI] [Google Scholar]
- Manchester F. D.; San-Martin A.; Pitre J. M. The H-Pd (Hydrogen-palladium) System. J. Phase Equilib. 1994, 15, 62–83. 10.1007/BF02667685. [DOI] [Google Scholar]
- Ross D. K.; Antonov V. E.; Bokhenkov E. L.; Kolesnikov A. I.; Ponyatovsky E. G.; Tomkinson J. Strong Anisotropy in the Inelastic Neutron Scattering from PdH at High Energy Transfer. Phys. Rev. B 1998, 58, 2591–2595. 10.1103/PhysRevB.58.2591. [DOI] [Google Scholar]
- Maimaitiyili T.; Steuwer A.; Blomqvist J.; Bjerkén C.; Blackmur M. S.; Zanellato O.; Andrieux J.; Ribeiro F. Observation of the δ to ε Zr-hydride Transition by In-situ Synchrotron X-ray Diffraction. Cryst. Res. Technol. 2016, 51, 663–670. 10.1002/crat.201600234. [DOI] [Google Scholar]
- Akiba H.; Kofu M.; Kobayashi H.; Kitagawa H.; Ikeda K.; Otomo T.; Yamamuro O. Nanometer-Size Effect on Hydrogen Sites in Palladium Lattice. J. Am. Chem. Soc. 2016, 138, 10238–10243. 10.1021/jacs.6b04970. [DOI] [PubMed] [Google Scholar]
- Lindlar H. Ein neuer Katalysator für selektive Hydrierungen. Helv. Chim. Acta 1952, 35, 446–450. 10.1002/hlca.19520350205. [DOI] [Google Scholar]
- Parker G. L.; Smith L. K.; Baxendale I. R. Development of the Industrial Synthesis of Vitamin A. Tetrahedron 2016, 72, 1645–1652. 10.1016/j.tet.2016.02.029. [DOI] [Google Scholar]
- Albers P. W.; Möbus K.; Frost C. D.; Parker S. F. Characterization of β-Palladium Hydride Formation in the Lindlar Catalyst and in Carbon-Supported Palladium. J. Phys. Chem. C 2011, 115, 24485–24493. 10.1021/jp205951c. [DOI] [Google Scholar]
- Parker S. F.; Walker H. C.; Callear S. K.; Grünewald E.; Petzold T.; Wolf D.; Möbus K.; Adam J.; Wieland S. D.; Jiménez-Ruiz M.; et al. The Effect of Particle Size, Morphology and Support on the Formation of Palladium Hydride in Commercial Catalysts. Chem. Sci. 2019, 10, 480–489. 10.1039/C8SC03766C. [DOI] [PMC free article] [PubMed] [Google Scholar]
- Möbus K.; Grünewald E.; Wieland S. D.; Parker S. F.; Albers P. W. Palladium-catalyzed Selective Hydrogenation of Nitroarenes: Influence of Platinum and Iron on Activity, Particle Morphology and Formation of β-palladium Hydride. J. Catal. 2014, 311, 153–160. 10.1016/j.jcat.2013.11.019. [DOI] [Google Scholar]
- Albers P. W.; Parker S. F. Applications of Neutron Scattering in Technical Catalysis: Characterisation of Hydrogenous Species on/in Unsupported and Supported Palladium. Top. Catal. 2021, 64, 603–613. 10.1007/s11244-021-01424-1. [DOI] [Google Scholar]
- Borodziński A.; Bond G. C. Selective Hydrogenation of Ethyne in Ethene-Rich Streams on Palladium Catalysts. Part 1. Effect of Changes to the Catalyst During Reaction. Catal. Rev.: Sci. Eng. 2006, 48, 91–144. 10.1080/01614940500364909. [DOI] [Google Scholar]
- McLennan K. G.; Gray E. M.; Dobson J. F. Deuterium Occupation of Tetrahedral Sites in Palladium. Phys. Rev. B 2008, 78, 014104. 10.1103/PhysRevB.78.014104. [DOI] [Google Scholar]
- Lin B. Q.; Wu X.; Xie L.; Kang Y. Q.; Du H. D.; Kang F. Y.; Li J.; Gan L. Atomic Imaging of Subsurface Interstitial Hydrogen and Insights into Surface Reactivity of Palladium Hydrides. Angew. Chem., Int. Ed. 2020, 59, 20348–20352. 10.1002/anie.202006562. [DOI] [PubMed] [Google Scholar]
- Kofu M.; Hashimoto N.; Akiba H.; Kobayashi H.; Kitagawa H.; Iida K.; Nakamura M.; Yamamuro O. Vibrational States of Atomic Hydrogen in Bulk and Nanocrystalline Palladium Studied by Neutron Spectroscopy. Phys. Rev. B 2017, 96, 054304. 10.1103/PhysRevB.96.054304. [DOI] [Google Scholar]
- Kofu M.; Hashimoto N.; Akiba H.; Kobayashi H.; Kitagawa H.; Tyagi M.; Faraone A.; Copley J. R. D.; Lohstroh W.; Yamamuro O. Hydrogen Diffusion in Bulk and Nanocrystalline Palladium: A Quasielastic Neutron Scattering Study. Phys. Rev. B 2016, 94, 064303. 10.1103/PhysRevB.94.064303. [DOI] [Google Scholar]
- Parker S. F.; Frost C. D.; Telling M.; Albers P.; Lopez M.; Seitz K. Characterisation of the Adsorption Sites of Hydrogen on Pt/C Fuel Cell Catalysts. Catal. Today 2006, 114, 418–421. 10.1016/j.cattod.2006.02.043. [DOI] [Google Scholar]
- Carosso M.; Lazzarini A.; Piovano A.; Pellegrini R.; Morandi S.; Manzoli M.; Vitillo J. G.; Ruiz M. J.; Lamberti C.; Groppo E. Looking for the Active Hydrogen Species in a 5 wt% Pt/C Catalyst: A Challenge for Inelastic Neutron Scattering. Faraday Discuss. 2018, 208, 227–242. 10.1039/C7FD00214A. [DOI] [PubMed] [Google Scholar]
- Carosso M.; Vottero E.; Lazzarini A.; Morandi S.; Manzoli M.; Lomachenko K. A.; Ruiz M. J.; Pellegrini R.; Lamberti C.; Piovano A.; et al. Dynamics of Reactive Species and Reactant-Induced Reconstruction of Pt Clusters in Pt/Al2O3 Catalysts. ACS Catal. 2019, 9, 7124–7136. 10.1021/acscatal.9b02079. [DOI] [Google Scholar]
- Vottero E.; Carosso M.; Ricchebuono A.; Jiménez-Ruiz M.; Pellegrini R.; Chizallet C.; Raybaud P.; Groppo E.; Piovano A. Evidence for H2-Induced Ductility in a Pt/Al2O3 Catalyst. ACS Catal. 2022, 12, 5979–5989. 10.1021/acscatal.2c00606. [DOI] [Google Scholar]
- Parker S. F.; Mukhopadhyay S.; Jiménez-Ruiz M.; Albers P. W. Adsorbed States of Hydrogen on Platinum: A New Perspective. Chem. - Eur. J. 2019, 25, 6496–6499. 10.1002/chem.201900351. [DOI] [PMC free article] [PubMed] [Google Scholar]
- Renouprez A. J.; Jobic H. Neutron Scattering Study of Hydrogen Adsorption on Platinum Catalysts. J. Catal. 1988, 113, 509–516. 10.1016/0021-9517(88)90276-X. [DOI] [Google Scholar]
- Qi Z. Y.; Chen L. N.; Zhang S. C.; Su J.; Somorjai G. A. A Mini Review of Cobalt-based Nanocatalyst in Fischer–Tropsch Synthesis. Appl. Catal., A 2020, 602, 117701. 10.1016/j.apcata.2020.117701. [DOI] [Google Scholar]
- Adeleke A. A.; Liu X. Y.; Lu X. J.; Moyo M.; Hildebrandt D. Cobalt Hybrid Catalysts in Fischer–Tropsch Synthesis. Rev. Chem. Eng. 2020, 36, 437–457. 10.1515/revce-2018-0012. [DOI] [Google Scholar]
- ten Have I. C.; Weckhuysen B. M. The Active Phase in Cobalt-based Fischer–Tropsch Synthesis. Chem. Catal. 2021, 1, 339–363. 10.1016/j.checat.2021.05.011. [DOI] [Google Scholar]
- Ernst K. H.; Schwarz E.; Christmann K. The Interaction of Hydrogen with a Cobalt(1010) Surface. J. Chem. Phys. 1994, 101, 5388–5401. 10.1063/1.467392. [DOI] [Google Scholar]
- Chojecki A.; Jobic H.; Jentys A.; Müller T. E.; Lercher J. A. Inelastic Neutron Scattering of Hydrogen and Butyronitrile Adsorbed on Raney-Co Catalysts. Catal. Lett. 2004, 97, 155–162. 10.1023/B:CATL.0000038578.67273.b0. [DOI] [Google Scholar]
- Schärringer P.; Müller T. E.; Jentys A.; Lercher J. A. Identification of Reaction Intermediates during Hydrogenation of CD3CN on Raney-Co. J. Catal. 2009, 263, 34–41. 10.1016/j.jcat.2009.01.009. [DOI] [Google Scholar]
- Xiang S.; Dong L.; Wang Z.-Q.; Han X.; Daemen L. L.; Li J.; Cheng Y.; Guo Y.; Liu X.; Hu Y.; Ramirez-Cuesta A. J.; Yang S.; Gong X.-Q.; Wang Y. A Unique Co@ CoO Catalyst for Hydrogenolysis of Biomass-derived 5-hydroxymethylfurfural to 2, 5-dimethylfuran. Nat. Commun. 2022, 13, 3657. 10.1038/s41467-022-31362-9. [DOI] [PMC free article] [PubMed] [Google Scholar]
- Waugh K. C. Methanol Synthesis. Catal. Lett. 2012, 142, 1153–1166. 10.1007/s10562-012-0905-2. [DOI] [Google Scholar]
- Wurtz A. Sur l’hydrure de cuivre. C. R. Hebd. Seances Acad. Sci. 1844, 18, 702–704. [Google Scholar]
- Goedkoop J. A.; Andresen A. F. The Crystal Structure of Copper Hydride. Acta Crystallogr. 1955, 8, 118–119. 10.1107/S0365110X55000480. [DOI] [Google Scholar]
- Auer H.; Kohlmann H. Reinvestigation of Crystal Structure and Non-Stoichiometry in Copper Hydride, CuH1-x (0 ≤ x ≤ 0.26). Z. Anorg. Allg. Chem. 2014, 640, 3159–3165. 10.1002/zaac.201400236. [DOI] [Google Scholar]
- Bennett E.; Wilson T.; Murphy P. J.; Refson K.; Hannon A. C.; Imberti S.; Callear S. K.; Chass G. A.; Parker S. F. How the Surface Structure Determines the Properties of CuH. Inorg. Chem. 2015, 54, 2213–2220. 10.1021/ic5027009. [DOI] [PubMed] [Google Scholar]
- Bennett E. L.; Wilson T.; Murphy P. J.; Refson K.; Hannon A. C.; Imberti S.; Callear S. K.; Chass G. A.; Parker S. F. Structure and Spectroscopy of CuH Prepared via Borohydride Reduction. Acta. Crystallogr. B. Struct. Sci. Cryst. Eng. Mater. 2015, 71, 608–612. 10.1107/S2052520615015176. [DOI] [PMC free article] [PubMed] [Google Scholar]
- Schoenbaum C. A.; Schwartz D. K.; Medlin J. W. Controlling the Surface Environment of Heterogeneous Catalysts Using Self-Assembled Monolayers. Acc. Chem. Res. 2014, 47, 1438–1445. 10.1021/ar500029y. [DOI] [PubMed] [Google Scholar]
- Rogers S. M.; Dimitratos N.; Jones W.; Bowker M.; Kanaras A. G.; Wells P. P.; Catlow C. R. A.; Parker S. F. The Adsorbed State of a Thiol on Palladium Nanoparticles. Phys. Chem. Chem. Phys. 2016, 18, 17265–17271. 10.1039/C6CP00957C. [DOI] [PubMed] [Google Scholar]
- Li Z. R.; Huang W. X. Hydride Species on Oxide Catalysts. J. Phys.: Condens. Matter 2021, 33, 433001. 10.1088/1361-648X/ac17ad. [DOI] [PubMed] [Google Scholar]
- Garcia-Melchor M.; Lopez N. Homolytic Products from Heterolytic Paths in H2 Dissociation on Metal Oxides: The Example of CeO2. J. Phys. Chem. C 2014, 118, 10921–10926. 10.1021/jp502309r. [DOI] [Google Scholar]
- Copéret C.; Estes D. P.; Larmier K.; Searles K. Isolated Surface Hydrides: Formation, Structure, and Reactivity. Chem. Rev. 2016, 116, 8463–8505. 10.1021/acs.chemrev.6b00082. [DOI] [PubMed] [Google Scholar]
- Werner K.; Weng X.; Calaza F.; Sterrer M.; Kropp T.; Paier J.; Sauer J.; Wilde M.; Fukutani K.; Shaikhutdinov S.; Freund H.-J. Toward an Understanding of Selective Alkyne Hydrogenation on Ceria: On the Impact of O Vacancies on H2 Interaction with CeO2 (111). J. Am. Chem. Soc. 2017, 139, 17608–17616. 10.1021/jacs.7b10021. [DOI] [PubMed] [Google Scholar]
- Livneh T.; Avisar D. Raman Scattering from Cerium Hydride Growth Centers Overlayered by Hydrogen-incorporated Oxide. J. Phys. Chem. C 2020, 124, 28018–28025. 10.1021/acs.jpcc.0c06689. [DOI] [Google Scholar]
- Lamonier C.; Payen E.; Mitchell P. C. H.; Parker S. F.; Mayers J.; Tomkinson J.. Hydrogen Species in Cerium—Nickel Oxides Catalysts: Inelastic and Compton Neutron Scattering Studies. In Studies in Surface Science and Catalysis; Corma A., Melo F. V., Mendioroz S., Fierro J. L. G., Eds.; Vol. 130; Elsevier, 2000; pp 3161–3166. 10.1016/S0167-2991(00)80508-X [DOI] [Google Scholar]
- Wu Z. L.; Cheng Y. Q.; Tao F.; Daemen L.; Foo G. S.; Nguyen L.; Zhang X. Y.; Beste A.; Ramirez-Cuesta A. J. Direct Neutron Spectroscopy Observation of Cerium Hydride Species on a Cerium Oxide Catalyst. J. Am. Chem. Soc. 2017, 139, 9721–9727. 10.1021/jacs.7b05492. [DOI] [PubMed] [Google Scholar]
- Li Z. R.; Werner K.; Chen L.; Jia A. P.; Qian K.; Zhong J. Q.; You R.; Wu L. H.; Zhang L. Y.; Pan H. B.; et al. Interaction of Hydrogen with Ceria: Hydroxylation, Reduction, and Hydride Formation on the Surface and in the Bulk. Chem. - Eur. J. 2021, 27, 5268–5276. 10.1002/chem.202005374. [DOI] [PMC free article] [PubMed] [Google Scholar]
- García-Melchor M.; Bellarosa L.; López N. r. Unique Reaction Path in Heterogeneous Catalysis: The Concerted Semi-hydrogenation of Propyne to Propene on CeO2. ACS Catal. 2014, 4, 4015–4020. 10.1021/cs5011508. [DOI] [Google Scholar]
- Li Z. R.; Werner K.; Qian K.; You R.; Płucienik A.; Jia A. P.; Wu L. H.; Zhang L. Y.; Pan H. B.; Kuhlenbeck H.; et al. Oxidation of Reduced Ceria by Incorporation of Hydrogen. Angew. Chem., Int. Ed. 2019, 58, 14686–14693. 10.1002/anie.201907117. [DOI] [PMC free article] [PubMed] [Google Scholar]
- Paier J.; Nelin C. J.; Bagus P. S.; Plucienik A.; Kuhlenbeck H.; Freund H. J. Electronic Structure of Reduced CeO2 (111) Surfaces Interacting with Hydrogen as Revealed Through Electron Energy Loss Spectroscopy in Comparison with Theoretical Investigations. J. Electron Spectrosc. Relat. Phenom. 2022, 257, 147088. 10.1016/j.elspec.2021.147088. [DOI] [Google Scholar]
- Wang Z. Q.; Chu D. R.; Zhou H.; Wu X. P.; Gong X. Q. Role of Low-Coordinated Ce in Hydride Formation and Selective Hydrogenation Reactions on CeO2 Surfaces. ACS Catal. 2022, 12, 624–632. 10.1021/acscatal.1c04856. [DOI] [Google Scholar]
- Matz O.; Calatayud M. Breaking H2 with CeO2: Effect of Surface Termination. ACS Omega 2018, 3, 16063–16073. 10.1021/acsomega.8b02410. [DOI] [PMC free article] [PubMed] [Google Scholar]
- Kiss J.; Witt A.; Meyer B.; Marx D. Methanol Synthesis on ZnO (0001). I. Hydrogen Coverage, Charge State of Oxygen Vacancies, and Chemical Reactivity. J. Chem. Phys. 2009, 130, 184706. 10.1063/1.3126682. [DOI] [PubMed] [Google Scholar]
- Howard J.; Braid I. J.; Tomkinson J. Spectroscopic Studies of Hydrogen Adsorbed on Zinc Oxide (Kadox 25). J. Chem. Soc., Faraday Trans. 1 1984, 80, 225–235. 10.1039/f19848000225. [DOI] [Google Scholar]
- French S. A.; Sokol A. A.; Bromley S. T.; Catlow C. R. A.; Rogers S. C.; Sherwood P. Assignment of the Complex Vibrational Spectra of the Hydrogenated ZnO Polar Surfaces Using QM/MM Embedding. J. Chem. Phys. 2003, 118, 317–320. 10.1063/1.1523897. [DOI] [Google Scholar]
- Boccuzzi F.; Borello E.; Zecchina A.; Bossi A.; Camia M. Infrared Study of ZnO Surface Properties: I. Hydrogen and Deuterium Chemisorption at Room Temperature. J. Catal. 1978, 51, 150–159. 10.1016/0021-9517(78)90288-9. [DOI] [Google Scholar]
- Zhang L. Y.; Zhang X. Y.; Qian K.; Li Z. R.; Cheng Y. Q.; Daemen L. L.; Wu Z. L.; Huang W. X. Activation and Surface Reactions of CO and H2 on ZnO Powders and Nanoplates under CO Hydrogenation Reaction Conditions. J. Energy Chem. 2020, 50, 351–357. 10.1016/j.jechem.2020.03.038. [DOI] [Google Scholar]
- Slade R. C. T.; Ramanan A.; Nicol J. M.; Ritter C. Synthesis, Characterization and Inelastic Neutron Scattering Spectra of Hydrogen Insertion Compounds of the Mixed VMo Oxide V9Mo6O40. Mater. Res. Bull. 1988, 23, 647–651. 10.1016/0025-5408(88)90028-1. [DOI] [Google Scholar]
- Hibble S. J.; Dickens P. G. Hydrogen Insertion Compounds of the Mixed Molybdenum Tungsten Oxides MoyW1-y3 (0.1< y< 0.9). Mater. Res. Bull. 1985, 20, 343–349. 10.1016/0025-5408(85)90193-X. [DOI] [Google Scholar]
- Dickens P. G.; Hawke S. V.; Weller M. T. Hydrogen Insertion Compounds of UO3. Mater. Res. Bull. 1984, 19, 543–547. 10.1016/0025-5408(84)90120-X. [DOI] [Google Scholar]
- Dickens P. G.; Crouch-Baker S.; Weller M. T. Hydrogen Insertion in Oxides. Solid State Ion. 1986, 18, 89–97. 10.1016/0167-2738(86)90092-5. [DOI] [Google Scholar]
- Wright C. J. Inelastic Neutron Scattering Spectra of the Hydrogen Tungsten Bronze H0.4WO3. J. Solid State Chem. 1977, 20, 89–92. 10.1016/0022-4596(77)90054-8. [DOI] [Google Scholar]
- Weller M. T.; Dickens P. G. Studies of Some Hydrogen Rhenium Bronzes. Solid State Ion. 1983, 9, 1081–1085. 10.1016/0167-2738(83)90134-0. [DOI] [Google Scholar]
- Chippindale A. M.; Dickens P. G.; Powell A. V. Synthesis, Characterization, and Inelastic Neutron Scattering Study of Hydrogen Insertion Compounds of VO2 (Rutile). J. Solid State Chem. 1991, 93, 526–533. 10.1016/0022-4596(91)90327-E. [DOI] [Google Scholar]
- Dickens P. G.; Hibble S. J.; Jarman R. H. Hydrogen Insertion Compounds of Transition Metal Oxides. J. Electron. Mater. 1981, 10, 999–1009. 10.1007/BF02661189. [DOI] [Google Scholar]
- Ayyappan S.; Rao C. N. R. A Simple Method of Hydrogen Insertion in Transition Metal Oxides to Obtain Bronzes. Mater. Res. Bull. 1995, 30, 947–951. 10.1016/0025-5408(95)00088-7. [DOI] [Google Scholar]
- Sotani N.; Eda K.; Sadamatu M.; Takagi S. Preparation and Characterization of Hydrogen Molybdenum Bronzes, HxMoO3. Bull. Chem. Soc. Jpn. 1989, 62, 903–907. 10.1246/bcsj.62.903. [DOI] [Google Scholar]
- Dickens P. G.; Weller M. T. The Structure of a Cubic Hydrogen Rhenium Bronze, H1.36ReO3. J. Solid State Chem. 1983, 48, 407–411. 10.1016/0022-4596(83)90099-3. [DOI] [Google Scholar]
- Crouch-Baker S.; Dickens P. G. Hydrogen Insertion Compounds of the Molybdic Acids, MoO3· nH2O (n= 1, 2). Mater. Res. Bull. 1984, 19, 1457–1462. 10.1016/0025-5408(84)90259-9. [DOI] [Google Scholar]
- Dickens P. G.; Chippindale A. M.; Hibble S. J.; Lancaster P. Hydrogen Insertion Compounds of V6O13 and V2O5. Mater. Res. Bull. 1984, 19, 319–324. 10.1016/0025-5408(84)90173-9. [DOI] [Google Scholar]
- Powell A. V.; Dickens P. G. Inelastic Neutron Scattering Spectra of HxUO3. J. Mater. Chem. 1992, 2, 273–275. 10.1039/jm9920200273. [DOI] [Google Scholar]
- Slade R. C. T.; Ramanan A.; Hirst P. R.; Pressman H. A. Inelastic Neutron Scattering Spectra of Hydrogen and Ammonium Insertion Compounds of Metal Oxides MO3 (M= Mo and/or W). Mater. Res. Bull. 1988, 23, 793–798. 10.1016/0025-5408(88)90071-2. [DOI] [Google Scholar]
- Dickens P. G.; Birtill J. J.; Wright C. J. Elastic and Inelastic Neutron Studies of Hydrogen Molybdenum Bronzes. J. Solid State Chem. 1979, 28, 185–193. 10.1016/0022-4596(79)90071-9. [DOI] [Google Scholar]
- Sienko M. J.; Oesterreicher H. Infrared and Electron Spin Resonance Study of Hydrogen Tungsten Bronze. J. Am. Chem. Soc. 1968, 90, 6568–6570. 10.1021/ja01025a089. [DOI] [Google Scholar]
- Xie W.; Su M.; Zheng Z.; Wang Y.; Gong L.; Xie F.; Zhang W.; Luo Z.; Luo J.; Liu P.; Xu N.; Deng S.; Chen H.; Chen J. Nanoscale Insights into the Hydrogenation Process of Layered α-MoO3. ACS Nano 2016, 10, 1662–1670. 10.1021/acsnano.5b07420. [DOI] [PubMed] [Google Scholar]
- Zeng H. C.; Xie F.; Wong K. C.; Mitchell K. A. R. Insertion and Removal of Protons in Single-crystal Orthorhombic Molybdenum Trioxide under H2S/H2 and O2/N2. Chem. Mater. 2002, 14, 1788–1796. 10.1021/cm011506z. [DOI] [Google Scholar]
- Dickens P. G.; Kay S. A.; Crouch-Baker S.; Claridge D. A. Thermochemistry of the Hydrogen Insertion Compounds Formed by the Molybdic and Tungstic Acids HxMO3· nH2O (M= Mo, n= 1; M= W, n= 1, 2). Solid State Ion. 1987, 23, 9–14. 10.1016/0167-2738(87)90075-0. [DOI] [Google Scholar]
- Crouch-Baker S.; Dickens P. G. Hydrogen Insertion Compounds of the Molybdic Acids. Polyhedron 1986, 5, 63–66. 10.1016/S0277-5387(00)84886-X. [DOI] [Google Scholar]
- Dickens P. G.; Birtill J. J. Hydrogen Molybdenum Bronzes. J. Electron. Mater. 1978, 7, 679–686. 10.1007/BF02655442. [DOI] [Google Scholar]
- Mitchell P. C.; Green D. A.; Payen E.; Evans A. C. Hydrogen in Molybdenum and Cobalt Sulfide Catalysts. A Neutron Compton Scattering Study on the ISIS Electronvolt Spectrometer. J. Chem. Soc., Faraday Trans. 1995, 91, 4467–4469. 10.1039/ft9959104467. [DOI] [Google Scholar]
- Heise W. H.; Lu K.; Kuo Y. J.; Udovic T. J.; Rush J. J.; Tatarchuk B. J. Neutron Scattering Study of Hydrogen on Ruthenium Sulfide. J. Phys. Chem. 1988, 92, 5184–5188. 10.1021/j100329a024. [DOI] [Google Scholar]
- Jobic H.; Clugnet G.; Lacroix M.; Yuan S. B.; Mirodatos C.; Breysse M. Identification of New Hydrogen Species Adsorbed on Ruthenium Sulfide by Neutron Spectroscopy. J. Am. Chem. Soc. 1993, 115, 3654–3657. 10.1021/ja00062a033. [DOI] [Google Scholar]
- Skripov A. V.; Wu H.; Udovic T. J.; Huang Q.; Hempelmann R.; Soloninin A. V.; Rempel A. A.; Gusev A. I. Hydrogen in Nonstoichiometric Cubic Niobium Carbides: Neutron Vibrational Spectroscopy and Neutron Diffraction Studies. J. Alloys Compd. 2009, 478, 68–74. 10.1016/j.jallcom.2008.12.012. [DOI] [Google Scholar]
- Wyvratt B. M.; Gaudet J. R.; Pardue D. B.; Marton A.; Rudic S.; Mader E. A.; Cundari T. R.; Mayer J. M.; Thompson L. T. Reactivity of Hydrogen on and in Nanostructured Molybdenum Nitride: Crotonaldehyde Hydrogenation. ACS Catal. 2016, 6, 5797–5806. 10.1021/acscatal.6b00936. [DOI] [Google Scholar]
- Howard J.; Waddington T. C. An Inelastic Neutron Scattering Study of C2H2 Adsorbed on Type 13X Zeolites. Surf. Sci. 1977, 68, 86–95. 10.1016/0039-6028(77)90193-5. [DOI] [Google Scholar]
- Jobic H.; Renouprez A. Neutron Inelastic Spectroscopy of Benzene Chemisorbed on Raney Platinum. Surf. Sci. 1981, 111, 53–62. 10.1016/0039-6028(81)90474-X. [DOI] [Google Scholar]
- Graham D.; Howard J. Adsorption of Benzene on Platinum Black. A Neutron Scattering Study. J. Chem. Soc., Faraday Trans. 1 1984, 80, 3365–3378. 10.1039/f19848003365. [DOI] [Google Scholar]
- Kelley R. D.; Cavanagh R. R.; Rush J. J.; Madey T. E. Neutron Spectroscopic Studies of the Adsorption and Decomposition of C2H2 and C2H4 on Raney Nickel. Surf. Sci. 1985, 155, 480–498. 10.1016/0039-6028(85)90010-X. [DOI] [Google Scholar]
- Nicol J. M. Chemisorbed Hydrogen and Hydrogenous Molecules. Spectrochim. Acta A Mol. Biomol. Spectrosc. 1992, 48, 313–327. 10.1016/0584-8539(92)80061-Z. [DOI] [Google Scholar]
- Henson N. J.; Eckert J.; Hay P. J.; Redondo A. Adsorption of Ethane and Ethene in Na-Y Studied by Inelastic Neutron Scattering and Computation. Chem. Phys. 2000, 261, 111–124. 10.1016/S0301-0104(00)00239-1. [DOI] [Google Scholar]
- Lennon D.; McNamara J.; Phillips J. R.; Ibberson R. M.; Parker S. F. An Inelastic Neutron Scattering Spectroscopic Investigation of the Adsorption of Ethene and Propene on Carbon. Phys. Chem. Chem. Phys. 2000, 2, 4447–4451. 10.1039/b005144f. [DOI] [Google Scholar]
- Beta I. A.; Jobic H.; Geidel E.; Böhlig H.; Hunger B. Inelastic Neutron Scattering and Infrared Spectroscopic Study of Furan Adsorption on Alkali-Metal Cation-exchanged Faujasites. Spectrochim. Acta A Mol. Biomol. Spectrosc. 2001, 57, 1393–1403. 10.1016/S1386-1425(00)00481-9. [DOI] [PubMed] [Google Scholar]
- Zachariou A.; Hawkins A.; Parker S. F.; Lennon D.; Howe R. F. Neutron Spectroscopy Studies of Methanol to Hydrocarbons Catalysis over ZSM-5. Catal. Today 2021, 368, 20–27. 10.1016/j.cattod.2020.05.030. [DOI] [Google Scholar]
- Schenkel R.; Jentys A.; Parker S. F.; Lercher J. A. Investigation of the Adsorption of Methanol on Alkali Metal Cation Exchanged Zeolite X by Inelastic Neutron Scattering. J. Phys. Chem. B 2004, 108, 7902–7910. 10.1021/jp049819f. [DOI] [Google Scholar]
- McInroy A. R.; Lundie D. T.; Winfield J. M.; Dudman C. C.; Jones P.; Parker S. F.; Taylor J. W.; Lennon D. An Infrared and Inelastic Neutron Scattering Spectroscopic Investigation on the Interaction of η-alumina and Methanol. Phys. Chem. Chem. Phys. 2005, 7, 3093–3101. 10.1039/b505974g. [DOI] [PubMed] [Google Scholar]
- Munn A. S.; Ramirez-Cuesta A. J.; Millange F.; Walton R. I. Interaction of Methanol with the Flexible Metal-organic Framework MIL-53(Fe) Observed by Inelastic Neutron Scattering. Chem. Phys. 2013, 427, 30–37. 10.1016/j.chemphys.2013.05.017. [DOI] [Google Scholar]
- McInroy A. R.; Winfield J. M.; Dudman C. C.; Jones P.; Lennon D. The Development of a New Generation of Methyl Chloride Synthesis Catalyst. Faraday Discuss. 2016, 188, 467–479. 10.1039/C5FD00202H. [DOI] [PubMed] [Google Scholar]
- Poulston S.; Holroyd R. P.; Bowker M.; Parker S. F.; Mitchell P. C. H. An Inelastic Neutron Scattering Study of Formate on Copper Surfaces. Surf. Sci. 1998, 402–404, 599–603. 10.1016/S0039-6028(98)00006-5. [DOI] [Google Scholar]
- Chutia A.; Silverwood I. P.; Farrow M. R.; Scanlon D. O.; Wells P. P.; Bowker M.; Parker S. F.; Catlow C. R. A. Adsorption of Formate Species on Cu(h,k,l) Low Index Surfaces. Surf. Sci. 2016, 653, 45–54. 10.1016/j.susc.2016.05.002. [DOI] [Google Scholar]
- Duong T. D.; Sapchenko S. A.; da Silva I.; Godfrey H. G. W.; Cheng Y. Q.; Daemen L. L.; Manuel P.; Ramirez-Cuesta A. J.; Yang S. H.; Schröder M. Optimal Binding of Acetylene to a Nitro-Decorated Metal-Organic Framework. J. Am. Chem. Soc. 2018, 140, 16006–16009. 10.1021/jacs.8b08504. [DOI] [PMC free article] [PubMed] [Google Scholar]
- Pinna R. S.; Rudić S.; Parker S. F.; Armstrong J.; Zanetti M.; Škoro G.; Waller S. P.; Zacek D.; Smith C. A.; Capstick M. J.; et al. The Neutron Guide Upgrade of the TOSCA Spectrometer. Nucl. Instrum. Methods Phys. Res. A: Accel. Spectrom. Detect. Assoc. Equip. 2018, 896, 68–74. 10.1016/j.nima.2018.04.009. [DOI] [Google Scholar]
- Jones E.; Inns D. R.; Dann S. E.; Silverwood I. P.; Kondrat S. A. Characterisation of Ethylene Adsorption on Model Skeletal Cobalt Catalysts by Inelastic and Quasi-elastic Neutron Scattering. Catal. Commun. 2022, 163, 106409. 10.1016/j.catcom.2022.106409. [DOI] [Google Scholar]
- Aziz M.; Wijayanta A. T.; Nandiyanto A. B. D. Ammonia as Effective Hydrogen Storage: A Review on Production, Storage and Utilization. Energies 2020, 13, 3062. 10.3390/en13123062. [DOI] [Google Scholar]
- Lamb K. E.; Dolan M. D.; Kennedy D. F. Ammonia for Hydrogen Storage; A Review of Catalytic Ammonia Decomposition and Hydrogen Separation and Purification. Int. J. Hydrogen Energy 2019, 44, 3580–3593. 10.1016/j.ijhydene.2018.12.024. [DOI] [Google Scholar]
- Erisman J. W.; Sutton M. A.; Galloway J.; Klimont Z.; Winiwarter W. How a Century of Ammonia Synthesis Changed the World. Nat. Geosci. 2008, 1, 636–639. 10.1038/ngeo325. [DOI] [Google Scholar]
- Kitano M.; Inoue Y.; Yamazaki Y.; Hayashi F.; Kanbara S.; Matsuishi S.; Yokoyama T.; Kim S. W.; Hara M.; Hosono H. Ammonia Synthesis Using a Stable Electride as an Electron Donor and Reversible Hydrogen Store. Nat. Chem. 2012, 4, 934–940. 10.1038/nchem.1476. [DOI] [PubMed] [Google Scholar]
- Kitano M.; Inoue Y.; Ishikawa H.; Yamagata K.; Nakao T.; Tada T.; Matsuishi S.; Yokoyama T.; Hara M.; Hosono H. Essential Role of Hydride Ion in Ruthenium-based Ammonia Synthesis Catalysts. Chem. Sci. 2016, 7, 4036–4043. 10.1039/C6SC00767H. [DOI] [PMC free article] [PubMed] [Google Scholar]
- Yu X. B.; Moon J.; Cheng Y. Q.; Daemen L. L.; Liu J.; Kim S. W.; Kumar A.; Chi M. F.; Fung V.; Ramirez-Cuesta A. J.; et al. In Situ Neutron Scattering Study of the Structure Dynamics of the Ru/Ca2N: e–- Catalyst in Ammonia Synthesis. Chem. Mater. 2023, 35, 2456–2462. 10.1021/acs.chemmater.2c03599. [DOI] [Google Scholar]
- Gao W. B.; Guo J. P.; Wang P. K.; Wang Q. R.; Chang F.; Pei Q. J.; Zhang W. J.; Liu L.; Chen P. Production of Ammonia via a Chemical Looping Process Based on Metal Imides as Nitrogen Carriers. Nat. Energy 2018, 3, 1067–1075. 10.1038/s41560-018-0268-z. [DOI] [Google Scholar]
- Jalama K. Carbon Dioxide Hydrogenation over Nickel-, Ruthenium-, and Copper-based Catalysts: Review of Kinetics and Mechanism. Catal. Rev.: Sci. Eng. 2017, 59, 95–164. 10.1080/01614940.2017.1316172. [DOI] [Google Scholar]
- Terreni J.; Sambalova O.; Borgschulte A.; Rudić S.; Parker S. F.; Ramirez-Cuesta A. J. Volatile Hydrogen Intermediates of CO2 Methanation by Inelastic Neutron Scattering. Catalysts 2020, 10, 433. 10.3390/catal10040433. [DOI] [Google Scholar]
- Polo-Garzon F.; Fung V.; Nguyen L.; Tang Y.; Tao F.; Cheng Y. Q.; Daemen L. L.; Ramirez-Cuesta A. J.; Foo G. S.; Zhu M. H.; et al. Elucidation of the Reaction Mechanism for High-Temperature Water Gas Shift over an Industrial-Type Copper-Chromium-Iron Oxide Catalyst. J. Am. Chem. Soc. 2019, 141, 7990–7999. 10.1021/jacs.9b03516. [DOI] [PubMed] [Google Scholar]
- Webb P. B.; Filot I. A. W.. Promoted Fischer–Tropsch Catalysts. In Reference Module in Chemistry, Molecular Sciences and Chemical Engineering; Elsevier, 2021. [Google Scholar]
- Claeys M.; Cowan R.; Schulz H. Temporal Changes of Fischer–Tropsch Activity and Selectivity Using Ruthenium. Top. Catal. 2003, 26, 139–143. 10.1023/B:TOCA.0000012994.27890.4c. [DOI] [Google Scholar]
- Shroff M. D.; Kalakkad D. S.; Coulter K. E.; Kohler S. D.; Harrington M. S.; Jackson N. B.; Sault A. G.; Datye A. K. Activation of Precipitated Iron Fischer–Tropsch Synthesis Catalysts. J. Catal. 1995, 156, 185–207. 10.1006/jcat.1995.1247. [DOI] [Google Scholar]
- Niemantsverdriet J. W.; Van der Kraan A. M.; Van Dijk W. L.; Van der Baan H. S. Behavior of Metallic Iron Catalysts during Fischer–Tropsch Synthesis Studied with Mössbauer Spectroscopy, X-ray Diffraction, Carbon Content Determination, and Reaction Kinetic Measurements. J. Phys. Chem. 1980, 84, 3363–3370. 10.1021/j100462a011. [DOI] [Google Scholar]
- Herranz T.; Rojas S.; Pérez-Alonso F. J.; Ojeda M.; Terreros P.; Fierro J. L. G. Genesis of Iron Carbides and Their Role in the Synthesis of Hydrocarbons from Synthesis Gas. J. Catal. 2006, 243, 199–211. 10.1016/j.jcat.2006.07.012. [DOI] [Google Scholar]
- Dictor R. A.; Bell A. T. Fischer–Tropsch Synthesis over Reduced and Unreduced Iron Oxide Catalysts. J. Catal. 1986, 97, 121–136. 10.1016/0021-9517(86)90043-6. [DOI] [Google Scholar]
- Hamilton N. G.; Silverwood I. P.; Warringham R.; Kapitán J.; Hecht L.; Webb P. B.; Tooze R. P.; Parker S. F.; Lennon D. Vibrational Analysis of an Industrial Fe-Based Fischer–Tropsch Catalyst Employing Inelastic Neutron Scattering. Angew. Chem., Int. Ed. 2013, 52, 5608–5611. 10.1002/anie.201210179. [DOI] [PubMed] [Google Scholar]
- Hamilton N. G.; Warringham R.; Silverwood I. P.; Kapitán J.; Hecht L.; Webb P. B.; Tooze R. P.; Zhou W.; Frost C. D.; Parker S. F.; et al. The Application of Inelastic Neutron Scattering to Investigate CO Hydrogenation over an Iron Fischer–Tropsch Synthesis Catalyst. J. Catal. 2014, 312, 221–231. 10.1016/j.jcat.2014.02.004. [DOI] [Google Scholar]
- Webb G. The Formation and Role of Carbonaceous Residues in Metal-catalysed Reactions of Hydrocarbons. Catal. Today 1990, 7, 139–155. 10.1016/0920-5861(90)85013-E. [DOI] [Google Scholar]
- Warringham R.; Bellaire D.; Parker S. F.; Taylor J.; Ewings R. A.; Goodway C. M.; Kibble M.; Wakefield S. R.; Jura M.; Dudman M. P.; et al. Sample Environment Issues Relevant to the Acquisition of Inelastic Neutron Scattering Measurements of Heterogeneous Catalyst Samples. J. Phys. Conf. Ser. 2014, 554, 012005. 10.1088/1742-6596/554/1/012005. [DOI] [Google Scholar]
- Davidson A. L.; Webb P. B.; Parker S. F.; Lennon D. Hydrogen Partitioning as a Function of Time-on-Stream for an Unpromoted Iron-Based Fischer–Tropsch Synthesis Catalyst Applied to CO Hydrogenation. Ind. Eng. Chem. Res. 2020, 59, 52–60. 10.1021/acs.iecr.9b04636. [DOI] [Google Scholar]
- Davidson A. L.; Gibson E. K.; Cibin G.; van Rensburg H.; Parker S. F.; Webb P. B.; Lennon D. The Application of Inelastic Neutron Scattering to Investigate Iron-based Fischer–Tropsch to Olefins Catalysis. J. Catal. 2020, 392, 197–208. 10.1016/j.jcat.2020.09.025. [DOI] [Google Scholar]
- Stangeland K.; Li H. L.; Yu Z. X. CO2 Hydrogenation to Methanol: The Structure-Activity Relationships of Different Catalyst Systems. Energy Ecol. Environ. 2020, 5, 272–285. 10.1007/s40974-020-00156-4. [DOI] [Google Scholar]
- Zander S.; Kunkes E. L.; Schuster M. E.; Schumann J.; Weinberg G.; Teschner D.; Jacobsen N.; Schlögl R.; Behrens M. The Role of the Oxide Component in the Development of Copper Composite Catalysts for Methanol Synthesis. Angew. Chem., Int. Ed. 2013, 52, 6536–6540. 10.1002/anie.201301419. [DOI] [PubMed] [Google Scholar]
- Kandemir T.; Friedrich M.; Parker S. F.; Studt F.; Lennon D.; Schlögl R.; Behrens M. Different Routes to Methanol: Inelastic Neutron Scattering Spectroscopy of Adsorbates on Supported Copper Catalysts. Phys. Chem. Chem. Phys. 2016, 18, 17253–17258. 10.1039/C6CP00967K. [DOI] [PubMed] [Google Scholar]
- Nikolic M.; Daemen L.; Ramirez-Cuesta A. J.; Xicohtencatl R. B.; Cheng Y. Q.; Putnam S. T.; Stadie N. P.; Liu X. C.; Terreni J.; Borgschulte A. Neutron Insights into Sorption Enhanced Methanol Catalysis. Top. Catal. 2021, 64, 638–643. 10.1007/s11244-021-01461-w. [DOI] [PMC free article] [PubMed] [Google Scholar]
- Moon J.; Cheng Y. Q.; Daemen L. L.; Li M. J.; Polo-Garzon F.; Ramirez-Cuesta A. J.; Wu Z. L. Discriminating the Role of Surface Hydride and Hydroxyl for Acetylene Semihydrogenation over Ceria through In Situ Neutron and Infrared Spectroscopy. ACS Catal. 2020, 10, 5278–5287. 10.1021/acscatal.0c00808. [DOI] [Google Scholar]
- Yamazoe S.; Yamamoto A.; Hosokawa S.; Fukuda R.; Hara K.; Nakamura M.; Kamazawa K.; Tsukuda T.; Yoshida H.; Tanaka T. Identification of Hydrogen Species on Pt/Al2O3 by In Situ Inelastic Neutron Scattering and Their Reactivity with Ethylene. Catal. Sci. Technol. 2021, 11, 116–123. 10.1039/D0CY01968B. [DOI] [Google Scholar]
- Bartholomew C. H.; Farrauto R. J.. Fundamentals of Industrial Catalytic Processes; John Wiley & Sons: Hoboken, NJ, 2005. [Google Scholar]
- Chinta S.; Choudhary T. V.; Daemen L. L.; Eckert J.; Goodman D. W. Characterization of C2 (CxHy) Intermediates from Adsorption and Decomposition of Methane on Supported Metal Catalysts by in situ INS Vibrational Spectroscopy. Angew. Chem., Int. Ed. 2002, 41, 144–146. . [DOI] [PubMed] [Google Scholar]
- Sivadinarayana C.; Choudhary T. V.; Daemen L. L.; Eckert J.; Goodman D. W. The Nature of the Surface Species Formed on Au/TiO2 during the Reaction of H2 and O2: An Inelastic Neutron Scattering Study. J. Am. Chem. Soc. 2004, 126, 38–39. 10.1021/ja0381398. [DOI] [PubMed] [Google Scholar]
- Silverwood I. P.; Hamilton N. G.; McFarlane A.; Ormerod R. M.; Guidi T.; Bones J.; Dudman M. P.; Goodway C. M.; Kibble M.; Parker S. F.; et al. Experimental Arrangements Suitable for the Acquisition of Inelastic Neutron Scattering Spectra of Heterogeneous Catalysts. Rev. Sci. Instrum. 2011, 82, 034101. 10.1063/1.3553295. [DOI] [PubMed] [Google Scholar]
- Wang C.; Chu Y. Y.; Zheng A. M.; Xu J.; Wang Q.; Gao P.; Qi G. D.; Gong Y. J.; Deng F. New Insight into the Hydrocarbon-Pool Chemistry of the Methanol-to-Olefins Conversion over Zeolite H-ZSM-5 from GC-MS, Solid-State NMR Spectroscopy, and DFT Calculations. Chem. - Eur. J. 2014, 20, 12432–12443. 10.1002/chem.201403972. [DOI] [PubMed] [Google Scholar]
- Rostrup-Nielsen J.; Christiansen L. J.. Concepts in Syngas Manufacture; World Scientific: Singapore, 2011. [Google Scholar]
- Silverwood I. P.; Hamilton N. G.; Staniforth J. Z.; Laycock C. J.; Parker S. F.; Ormerod R. M.; Lennon D. Persistent Species Formed during the Carbon Dioxide Reforming of Methane over a Nickel-alumina Catalyst. Catal. Today 2010, 155, 319–325. 10.1016/j.cattod.2010.07.009. [DOI] [Google Scholar]
- Silverwood I. P.; Hamilton N. G.; Laycock C. J.; Staniforth J. Z.; Ormerod R. M.; Frost C. D.; Parker S. F.; Lennon D. Quantification of Surface Species Present on a Nickel/Alumina Methane Reforming Catalyst. Phys. Chem. Chem. Phys. 2010, 12, 3102–3107. 10.1039/b919977b. [DOI] [PubMed] [Google Scholar]
- Silverwood I. P.; Hamilton N. G.; McFarlane A. R.; Kapitán J.; Hecht L.; Norris E. L.; Mark Ormerod R.; Frost C. D.; Parker S. F.; Lennon D. Application of Inelastic Neutron Scattering to Studies of CO2 Reforming of Methane over Alumina-supported Nickel and Gold-doped Nickel Catalysts. Phys. Chem. Chem. Phys. 2012, 14, 15214–15225. 10.1039/c2cp42745a. [DOI] [PubMed] [Google Scholar]
- McFarlane A. R.; Silverwood I. P.; Warringham R.; Norris E. L.; Ormerod R. M.; Frost C. D.; Parker S. F.; Lennon D. The Application of Inelastic Neutron Scattering to Investigate the ‘Dry’ Reforming of Methane over an Alumina-supported Nickel Catalyst Operating under Conditions Where Filamentous Carbon Formation Is Prevalent. RSC Adv. 2013, 3, 16577–16589. 10.1039/C3RA42435A. [DOI] [Google Scholar]
- McFarlane A. R.; Silverwood I. P.; Norris E. L.; Ormerod R. M.; Frost C. D.; Parker S. F.; Lennon D. The Application of Inelastic Neutron Scattering to Investigate the Steam Reforming of Methane over an Alumina-supported Nickel Catalyst. Chem. Phys. 2013, 427, 54–60. 10.1016/j.chemphys.2013.10.012. [DOI] [PubMed] [Google Scholar]
- Dry M. E. Present and Future Applications of the Fischer–Tropsch Process. Appl. Catal., A 2004, 276, 1–3. 10.1016/j.apcata.2004.08.014. [DOI] [Google Scholar]
- Rostrupnielsen J. R.; Hansen J. H. B. CO2-Reforming of Methane over Transition Metals. J. Catal. 1993, 144, 38–49. 10.1006/jcat.1993.1312. [DOI] [Google Scholar]
- Yarulina I.; Chowdhury A. D.; Meirer F.; Weckhuysen B. M.; Gascon J. Recent Trends and Fundamental Insights in the Methanol-to-hydrocarbons Process. Nat. Catal. 2018, 1, 398–411. 10.1038/s41929-018-0078-5. [DOI] [Google Scholar]
- O’Malley A. J.; Parker S. F.; Chutia A.; Farrow M. R.; Silverwood I. P.; García-Sakai V.; Catlow C. R. A. Room Temperature Methoxylation in Zeolites: Insight into a Key Step of the Methanol-to-hydrocarbons Process. Chem. Commun. 2016, 52, 2897–2900. 10.1039/C5CC08956E. [DOI] [PubMed] [Google Scholar]
- Zachariou A.; Hawkins A.; Lennon D.; Parker S. F.; Suwardiyanto; Matam S. K.; Catlow C. R. A.; Collier P.; Hameed A.; McGregor J.; et al. Investigation of ZSM-5 Catalysts for Dimethylether Conversion Using Inelastic Neutron Scattering. Appl. Catal., A 2019, 569, 1–7. 10.1016/j.apcata.2018.10.010. [DOI] [Google Scholar]
- Yang M.; Fan D.; Wei Y. X.; Tian P.; Liu Z. M. Recent Progress in Methanol-to-olefins (MTO) Catalysts. Adv. Mater. 2019, 31, 1902181. 10.1002/adma.201902181. [DOI] [PubMed] [Google Scholar]
- Mei C. S.; Wen P. Y.; Liu Z. C.; Liu H. X.; Wang Y. D.; Yang W. M.; Xie Z. K.; Hua W. M.; Gao Z. Selective Production of Propylene from Methanol: Mesoporosity Development in High Silica HZSM-5. J. Catal. 2008, 258, 243–249. 10.1016/j.jcat.2008.06.019. [DOI] [Google Scholar]
- Lin L. F.; Fan M. T.; Sheveleva A. M.; Han X.; Tang Z. M.; Carter J. H.; Da Silva I.; Parlett C. M.; Tuna F.; McInnes E. J. Control of Zeolite Microenvironment for Propene Synthesis from Methanol. Nat. Commun. 2021, 12, 822. 10.1038/s41467-021-21062-1. [DOI] [PMC free article] [PubMed] [Google Scholar]
- Potter M. E.; O’Malley A. J.; Chapman S.; Kezina J.; Newland S. H.; Silverwood I. P.; Mukhopadhyay S.; Carravetta M.; Mezza T. M.; Parker S. F.; et al. Understanding the Role of Molecular Diffusion and Catalytic Selectivity in Liquid-Phase Beckmann Rearrangement. ACS Catal. 2017, 7, 2926–2934. 10.1021/acscatal.6b03641. [DOI] [Google Scholar]
- Chen J. X.; Yang Y.; Shi H.; Li M. F.; Chu Y.; Pan Z. Y.; Yu X. B. Regulating Product Distribution in Deoxygenation of Methyl Laurate on Silica-supported Ni-Mo Phosphides: Effect of Ni/Mo Ratio. Fuel 2014, 129, 1–10. 10.1016/j.fuel.2014.03.049. [DOI] [Google Scholar]
- Yu X. B.; Chen J. X.; Ren T. Y. Promotional Effect of Fe on Performance of Ni/SiO2 for Deoxygenation of Methyl Laurate as a Model Compound to Hydrocarbons. RSC Adv. 2014, 4, 46427–46436. 10.1039/C4RA07932A. [DOI] [Google Scholar]
- Kim S.; Kwon E. E.; Kim Y. T.; Jung S.; Kim H. J.; Huber G. W.; Lee J. Recent Advances in Hydrodeoxygenation of Biomass-derived Oxygenates over Heterogeneous Catalysts. Green Chem. 2019, 21, 3715–3743. 10.1039/C9GC01210A. [DOI] [Google Scholar]
- Yu X. B.; Williams C. T. Recent Advances in the Applications of Mesoporous Silica in Heterogenous Catalysis. Catal. Sci. Technol. 2022, 12, 5765. 10.1039/D2CY00001F. [DOI] [Google Scholar]
- Yu X. B.; Williams C. T. Recent Applications of Nickel and Nickel-based Bimetallic Catalysts for Hydrodeoxygenation of Biomass-derived Oxygenates to Fuels. Catal. Sci. Technol. 2023, 13, 802. 10.1039/D2CY01179D. [DOI] [Google Scholar]
- Shao Y.; Xia Q.; Dong L.; Liu X.; Han X.; Parker S. F.; Cheng Y.; Daemen L. L.; Ramirez-Cuesta A. J.; Yang S.; Wang Y. Selective Production of Arenes via Direct Lignin Upgrading over a Niobium-based Catalyst. Nat. Commun. 2017, 8, 16104. 10.1038/ncomms16104. [DOI] [PMC free article] [PubMed] [Google Scholar]
- Xia Q. N.; Chen Z. J.; Shao Y.; Gong X. Q.; Wang H. F.; Liu X. H.; Parker S. F.; Han X.; Yang S. H.; Wang Y. Q. Direct Hydrodeoxygenation of Raw Woody Biomass into Liquid Alkanes. Nat. Commun. 2016, 7, 1–10. 10.1038/ncomms11162. [DOI] [PMC free article] [PubMed] [Google Scholar]
- Teržan J.; Huš M.; Likozar B.; Djinović P. Propylene Epoxidation using Molecular Oxygen over Copper- and Silver-Based Catalysts: A Review. ACS Catal. 2020, 10, 13415–13436. 10.1021/acscatal.0c03340. [DOI] [Google Scholar]
- Dissanayake D. P.; Lunsford J. H. Evidence for the Role of Colloidal Palladium in the Catalytic Formation of H2O2 from H2 and O2. J. Catal. 2002, 206, 173–176. 10.1006/jcat.2001.3501. [DOI] [Google Scholar]
- Ciuparu D.; Lyubovsky M. R.; Altman E.; Pfefferle L. D.; Datye A. Catalytic Combustion of Methane over Palladium-Based Catalysts. Catal. Rev.: Sci. Eng. 2002, 44, 593–649. 10.1081/CR-120015482. [DOI] [Google Scholar]
- Bandosz T. J.; Seredych M.; Rodríguez-Castellón E.; Cheng Y. Q.; Daemen L. L.; Ramírez-Cuesta A. J. Evidence for CO2 Reactive Adsorption on Nanoporous S- and N-doped Carbon at Ambient Conditions. Carbon 2016, 96, 856–863. 10.1016/j.carbon.2015.10.007. [DOI] [Google Scholar]
- Li J. N.; Han X.; Zhang X. R.; Sheveleva A. M.; Cheng Y. Q.; Tuna F.; McInnes E. J. L.; McCormick McPherson L. J.; Teat S. J.; Daemen L. L.; et al. Capture of Nitrogen Dioxide and Conversion to Nitric Acid in a Porous Metal-organic Framework. Nat. Chem. 2019, 11, 1085–1090. 10.1038/s41557-019-0356-0. [DOI] [PubMed] [Google Scholar]
- Cheetham A. K.; Wilkinson A. P. Synchrotron X-ray and Neutron Diffraction Studies in Solid-State Chemistry. Angew. Chem., Int. Ed. 1992, 31, 1557–1570. 10.1002/anie.199215571. [DOI] [Google Scholar]
- Liu J.; Olds D.; Peng R.; Yu L.; Foo G. S.; Qian S.; Keum J.; Guiton B. S.; Wu Z. L.; Page K. Quantitative Analysis of the Morphology of {101} and {001} Faceted Anatase TiO2 Nanocrystals and Its Implication on Photocatalytic Activity. Chem. Mater. 2017, 29, 5591–5604. 10.1021/acs.chemmater.7b01172. [DOI] [Google Scholar]
- Luo S.; Li M. J.; Fung V.; Sumpter B. G.; Liu J.; Wu Z. L.; Page K. New Insights into the Bulk and Surface Defect Structures of Ceria Nanocrystals from Neutron Scattering Study. Chem. Mater. 2021, 33, 3959–3970. 10.1021/acs.chemmater.1c00156. [DOI] [Google Scholar]
- Sun Y. F.; Polo-Garzon F.; Bao Z. H.; Moon J.; Huang Z. N.; Chen H.; Chen Z. T.; Yang Z. Z.; Chi M. F.; Wu Z. L.; et al. Manipulating Copper Dispersion on Ceria for Enhanced Catalysis: A Nanocrystal-based Atom-Trapping Strategy. Adv. Sci. 2022, 9, 2104749. 10.1002/advs.202104749. [DOI] [PMC free article] [PubMed] [Google Scholar]
- Sun Y. F.; Wu T.; Bao Z. H.; Moon J.; Huang Z. N.; Chen Z. T.; Chen H.; Li M. J.; Yang Z. Z.; Chi M. F.; et al. Defect Engineering of Ceria Nanocrystals for Enhanced Catalysis via a High-entropy Oxide Strategy. ACS Cent. Sci. 2022, 8, 1081–1090. 10.1021/acscentsci.2c00340. [DOI] [PMC free article] [PubMed] [Google Scholar]
- Mamontov E.; Egami T. Structural Defects in a Nano-scale Powder of CeO2 Studied by Pulsed Neutron Diffraction. J. Phys. Chem. Solids 2000, 61, 1345–1356. 10.1016/S0022-3697(00)00003-2. [DOI] [Google Scholar]
- Kandemir T.; Girgsdies F.; Hansen T. C.; Liss K. D.; Kasatkin I.; Kunkes E. L.; Wowsnick G.; Jacobsen N.; Schlögl R.; Behrens M. In Situ Study of Catalytic Processes: Neutron Diffraction of a Methanol Synthesis Catalyst at Industrially Relevant Pressure. Angew. Chem., Int. Ed. 2013, 52, 5166–5170. 10.1002/anie.201209539. [DOI] [PubMed] [Google Scholar]
- Zinth V.; Von Lüders C.; Hofmann M.; Hattendorff J.; Buchberger I.; Erhard S.; Rebelo-Kornmeier J.; Jossen A.; Gilles R. Lithium Plating in Lithium-ion Batteries at Sub-ambient Temperatures Investigated by In Situ Neutron Diffraction. J. Power Sources 2014, 271, 152–159. 10.1016/j.jpowsour.2014.07.168. [DOI] [Google Scholar]
- Peterson V. K.; Auckett J. E.; Pang W. K. Real-time Powder Diffraction Studies of Energy Materials under Non-equilibrium Conditions. IUCrJ. 2017, 4, 540–554. 10.1107/S2052252517010363. [DOI] [PMC free article] [PubMed] [Google Scholar]
- Chien P. H.; Wu X. Y.; Song B. H.; Yang Z. J.; Waters C. K.; Everett M. S.; Lin F.; Du Z. J.; Liu J. New Insights into Structural Evolution of LiNiO2 Revealed by Operando Neutron Diffraction. Batteries Supercaps 2021, 4, 1701–1707. 10.1002/batt.202100135. [DOI] [Google Scholar]
- Liu J.; Du Z. J.; Wang X. L.; Tan S.; Wu X. Y.; Geng L. X.; Song B. H.; Chien P. H.; Everett S. M.; Hu E. Y. Anionic Redox Induced Anomalous Structural Tansition in Ni-rich Cathodes. Energy Environ. Sci. 2021, 14, 6441–6454. 10.1039/D1EE02987H. [DOI] [Google Scholar]
- Wu X. Y.; Song B. H.; Chien P. H.; Everett S. M.; Zhao K. J.; Liu J.; Du Z. J. Structural Evolution and Transition Dynamics in Lithium Ion Battery under Fast Charging: An Operando Neutron Diffraction Investigation. Adv. Sci. 2021, 8, 2102318. 10.1002/advs.202102318. [DOI] [PMC free article] [PubMed] [Google Scholar]
- Alonso J. A.; Martínez-Lope M. J.; Aguadero A.; Daza L. Neutron Powder Diffraction as a Characterization Tool of Solid Oxide Fuel Cell Materials. Prog. Solid State Chem. 2008, 36, 134–150. 10.1016/j.progsolidstchem.2007.03.004. [DOI] [Google Scholar]
- Cheetham A. K.; Goodwin A. L. Crystallography with Powders. Nat. Mater. 2014, 13, 760–762. 10.1038/nmat4044. [DOI] [PubMed] [Google Scholar]
- Albedwawi S. H.; AlJaberi A.; Haidemenopoulos G. N.; Polychronopoulou K. High Entropy Oxides-exploring a Paradigm of Promising Catalysts: A Review. Mater. Des. 2021, 202, 109534. 10.1016/j.matdes.2021.109534. [DOI] [Google Scholar]
- Katiyar N. K.; Biswas K.; Yeh J. W.; Sharma S.; Tiwary C. S. A Perspective on the Catalysis Using the High Entropy Alloys. Nano Energy 2021, 88, 106261. 10.1016/j.nanoen.2021.106261. [DOI] [Google Scholar]
- Sun Y. F.; Dai S. High-entropy Materials for Catalysis: A New Frontier. Sci. Adv. 2021, 7, eabg1600 10.1126/sciadv.abg1600. [DOI] [PMC free article] [PubMed] [Google Scholar]
- Wang K.; Wu Z.; Jiang D. E. Ammonia synthesis on BaTiO2.5H0.5: computational insights into the role of hydrides. Phys. Chem. Chem. Phys. 2022, 24, 1496–1502. 10.1039/D1CP05055A. [DOI] [PubMed] [Google Scholar]
- Avdeev M.; Hester J. R.; Peterson V. K.; Studer A. J. Wombat and Echidna: The Powder Diffractometers. Neutron News 2009, 20, 29–33. 10.1080/10448630903241100. [DOI] [Google Scholar]
- Telling M. T. F.A Practical Guide to Quasi-elastic Neutron Scattering; Royal Society of Chemistry: London, UK, 2020. [Google Scholar]
- Neuefeind J.; Feygenson M.; Carruth J.; Hoffmann R.; Chipley K. K. The Nanoscale Ordered MAterials Diffractometer NOMAD at the Spallation Neutron Source SNS. Nucl. Instrum. Methods Phys. Res. B: Beam Interact. Mater. At. 2012, 287, 68–75. 10.1016/j.nimb.2012.05.037. [DOI] [Google Scholar]
- Huq A.; Kirkham M.; Peterson P. F.; Hodges J. P.; Whitfield P. S.; Page K.; Hugle T.; Iverson E. B.; Parizzi A.; Rennich G. POWGEN: Rebuild of a Third-generation Powder Diffractometer at the Spallation Neutron Source. J. Appl. Crystallogr. 2019, 52, 1189–1201. 10.1107/S160057671901121X. [DOI] [PMC free article] [PubMed] [Google Scholar]
- Calder S.; An K.; Boehler R.; Dela Cruz C. R.; Frontzek M. D.; Guthrie M.; Haberl B.; Huq A.; Kimber S. A. J.; Liu J.; et al. A Suite-level Review of the Neutron Powder Diffraction Instruments at Oak Ridge National Laboratory. Rev. Sci. Instrum. 2018, 89, 092701. 10.1063/1.5033906. [DOI] [PubMed] [Google Scholar]
- Day P.; Enderby J.; Williams W.; Chapon L.; Hannon A.; Radaelli P.; Soper A. Scientific Reviews: GEM: The General Materials Diffractometer at ISIS-Multibank Capabilities for Studying Crystalline and Disordered Materials. Neutron News 2004, 15, 19–23. 10.1080/00323910490970564. [DOI] [Google Scholar]
- Ibberson R. M. Design and Performance of the New Supermirror Guide on HRPD at ISIS. Nucl. Instrum. Methods Phys. Res. A: Accel. Spectrom. Detect. Assoc. Equip. 2009, 600, 47–49. 10.1016/j.nima.2008.11.066. [DOI] [Google Scholar]
- Ishigaki T.; Hoshikawa A.; Yonemura M.; Morishima T.; Kamiyama T.; Oishi R.; Aizawa K.; Sakuma T.; Tomota Y.; Arai M.; et al. IBARAKI Materials Design Dffractometer (iMATERIA)—Versatile Neutron Diffractometer at J-PARC. Nucl. Instrum. Methods Phys. Res. A: Accel. Spectrom. Detect. Assoc. Equip. 2009, 600, 189–191. 10.1016/j.nima.2008.11.137. [DOI] [Google Scholar]
- McCusker L. B.; Von Dreele R. B.; Cox D. E.; Louer D.; Scardi P. Rietveld Refinement Guidelines. J. Appl. Crystallogr. 1999, 32, 36–50. 10.1107/S0021889898009856. [DOI] [Google Scholar]
- Rietveld H. A Profile Refinement Method for Nuclear and Magnetic Structures. J. Appl. Crystallogr. 1969, 2, 65–71. 10.1107/S0021889869006558. [DOI] [Google Scholar]
- Young R. A.The Rietveld Method; Oxford University Press: Oxford, UK, 1993; pp 1–38. [Google Scholar]
- Titcomb C. G.; Cheetham A. K.; Fender B. E. F. A Neutron Diffraction Study of the Hydrides of the Early Lanthanide Elements at Room Temperature. J. Phys. C: Solid State Phys. 1974, 7, 2409. 10.1088/0022-3719/7/14/005. [DOI] [Google Scholar]
- Park J. G.; Collins B. A.; Darago L. E.; Runčevski T.; Ziebel M. E.; Aubrey M. L.; Jiang H. Z. H.; Velasquez E.; Green M. A.; Goodpaster J. D.; et al. Magnetic Ordering Through Itinerant Ferromagnetism in a Metal-organic Framework. Nat. Chem. 2021, 13, 594–598. 10.1038/s41557-021-00666-6. [DOI] [PubMed] [Google Scholar]
- Van Hove L. Correlations in Space and Time and Born Approximation Scattering in Systems of Interacting Particles. Phys. Rev. 1954, 95, 249–262. 10.1103/PhysRev.95.249. [DOI] [Google Scholar]
- Egami T.; Billinge S.. Underneath the Bragg Peaks - Structural Analysis of Complex Materials; Elsevier: Amsterdam, Netherlands, 2012. [Google Scholar]
- Barabash R. I.; Ice G. E.; Turchi P. E. A.. Diffuse Scattering and the Fundamental Properties of Materials; Momentum Press: New York, NY, 2009. [Google Scholar]
- Welberry T. R.; Weber T. One Hundred Years of Diffuse Scattering. Crystallogr. Rev. 2016, 22, 2–78. 10.1080/0889311X.2015.1046853. [DOI] [Google Scholar]
- Jiang B.; Zhao C. H.; Metz P. C.; Jothi P. R.; Kavey B.; Reven L.; Lindner-D’Addario M.; Jones J. L.; Caruntu G.; Page K. Temperature Dependent Local Structure Coherence of Surface-modified BaTiO3 Nanocubes. J. Mater. Chem. C 2022, 10, 10832–10842. 10.1039/D2TC00477A. [DOI] [Google Scholar]
- Keen D. A Comparison of Various Commonly Used Correlation Functions for Describing Total Scattering. J. Appl. Crystallogr. 2001, 34, 172–177. 10.1107/S0021889800019993. [DOI] [Google Scholar]
- Peterson P. F.; Olds D.; McDonnell M. T.; Page K. Illustrated Formalisms for Total Scattering Data: A Guide for New Practitioners. J. Appl. Crystallogr. 2021, 54, 317–332. 10.1107/S1600576720015630. [DOI] [PMC free article] [PubMed] [Google Scholar]
- Ozawa M.; Loong C. K. In Situ X-ray and Neutron Powder Diffraction Studies of Redox Behavior in CeO2-containing Oxide Catalysts. Catal. Today 1999, 50, 329–342. 10.1016/S0920-5861(98)00513-6. [DOI] [Google Scholar]
- Turner J. F. C.; Done R.; Dreyer J.; David W. I. F.; Catlow C. R. A. On Apparatus for Studying Catalysts and Catalytic Processes Using Neutron Scattering. Rev. Sci. Instrum. 1999, 70, 2325–2330. 10.1063/1.1149758. [DOI] [Google Scholar]
- Haynes R.; Norberg S. T.; Eriksson S. G.; Chowdhury M. A. H.; Goodway C. M.; Howells G. D.; Kirichek O.; Hull S. New High Temperature Gas Flow Cell Developed at ISIS. J. Phys. Conf. Ser. 2010, 251, 012090. 10.1088/1742-6596/251/1/012090. [DOI] [Google Scholar]
- Kirkham M.; Heroux L.; Ruiz-Rodriguez M.; Huq A. AGES: Automated Gas Environment System for In Situ Neutron Powder Diffraction. Rev. Sci. Instrum. 2018, 89, 092904. 10.1063/1.5031432. [DOI] [PubMed] [Google Scholar]
- Cox-Galhotra R. A.; Huq A.; Hodges J. P.; Kim J. H.; Yu C. F.; Wang X. Q.; Jacobson A. J.; McIntosh S. Visualizing Oxygen Anion Transport Pathways in NdBaCo2O5+δ by In Situ Neutron Diffraction. J. Mater. Chem. A 2013, 1, 3091–3100. 10.1039/c3ta01308a. [DOI] [Google Scholar]
- Todd P. K.; Wustrow A.; McAuliffe R. D.; McDermott M. J.; Tran G. T.; McBride B. C.; Boeding E. D.; O’Nolan D.; Liu C. H.; Dwaraknath S. S.; et al. Defect-Accommodating Intermediates Yield Selective Low-Temperature Synthesis of YMnO3 Polymorphs. Inorg. Chem. 2020, 59, 13639–13650. 10.1021/acs.inorgchem.0c02023. [DOI] [PubMed] [Google Scholar]
- Olds D.; Page K.; Paecklar A.; Peterson P. F.; Liu J.; Rucker G.; Ruiz-Rodriguez M.; Olsen M.; Pawel M.; Overbury S. H.; et al. A High Precision Gas Flow Cell for Performing In Situ Neutron Studies of Local Atomic Structure in Catalytic Materials. Rev. Sci. Instrum. 2017, 88, 034101. 10.1063/1.4978287. [DOI] [PubMed] [Google Scholar]
- Olds D.; Mills R. A.; McDonnell M. T.; Liu J.; Kim J. R.; Dunstan M. T.; Gaultois M. W.; Everett S. M.; Tucker M. G.; Page K. A High Temperature Gas Flow Environment for Neutron Total Scattering Studies of Complex Materials. Rev. Sci. Instrum. 2018, 89, 092906. 10.1063/1.5033464. [DOI] [PubMed] [Google Scholar]
- Olds D.; Lawler K. V.; Paecklar A. A.; Liu J.; Page K.; Peterson P. F.; Forster P. M.; Neilson J. R. Capturing the Details of N2 Adsorption in Zeolite X Using Stroboscopic Isotope Contrasted Neutron Total Scattering. Chem. Mater. 2018, 30, 296–302. 10.1021/acs.chemmater.7b04594. [DOI] [Google Scholar]
- Xie C.; Yan D. F.; Li H.; Du S. Q.; Chen W.; Wang Y. Y.; Zou Y. Q.; Chen R.; Wang S. Y. Defect Chemistry in Heterogeneous Catalysis: Recognition, Understanding, and Utilization. ACS Catal. 2020, 10, 11082–11098. 10.1021/acscatal.0c03034. [DOI] [Google Scholar]
- Jacobson A. A Powder Neutron Diffraction Study of the Structure of and Oxygen Vacancy Distribution in 6H BaFeO2.79. Acta. Crystallogr. B. Struct. Sci. Cryst. Eng. Mater. 1976, 32, 1087–1090. 10.1107/S056774087600472X. [DOI] [Google Scholar]
- Kennedy B. J. Oxygen Vacancies in Pyrochlore Oxides: Powder Neutron Diffraction Study of Pb2Ir2O6.5 and Bi2Ir2O7-y. J. Solid State Chem. 1996, 123, 14–20. 10.1006/jssc.1996.0146. [DOI] [Google Scholar]
- Kümmerle E. A.; Heger G. The Structures of C-Ce2O3+δ, Ce7O12, and Ce11O20. J. Solid State Chem. 1999, 147, 485–500. 10.1006/jssc.1999.8403. [DOI] [Google Scholar]
- Li Y. P.; Maxey E. R.; Richardson Jr J. W.; Ma B.; Lee T. H.; Song S. J. Oxygen Non-Stoichiometry and Thermal-Chemical Expansion of Ce0.8Y0.2O1.9-δ Electrolytes by Neutron Diffraction. J. Am. Ceram. Soc. 2007, 90, 1208–1214. 10.1111/j.1551-2916.2007.01606.x. [DOI] [Google Scholar]
- Cox-Galhotra R. A.; Huq A.; Hodges J. P.; Yu C. F.; Wang X. Q.; Gong W. Q.; Jacobson A. J.; McIntosh S. An In-situ Neutron Diffraction Study of the Crystal Structure of PrBaCo2O5+δ at High Temperature and Controlled Oxygen Partial Pressure. Solid State Ion. 2013, 249–250, 34–40. 10.1016/j.ssi.2013.07.017. [DOI] [Google Scholar]
- Tonus F.; Bahout M.; Battle P. D.; Hansen T.; Henry P. F.; Roisnel T. In Situ Neutron Diffraction Study of the High-Temperature Redox Chemistry of Ln3-xSr1+xCrNiO8-δ (Ln = La, Nd) under Hydrogen. J. Mater. Chem. 2010, 20, 4103–4115. 10.1039/b926282b. [DOI] [Google Scholar]
- Ozawa M.; Suzuki S.; Loong C. K.; Richardson J. W.; Thomas R. R. Structural Phase Transitions and Lean NO Removal Activity of Copper-modified Alumina. Appl. Surf. Sci. 1997, 121–122, 441–444. 10.1016/S0169-4332(97)00321-8. [DOI] [Google Scholar]
- Loong C. K.; Richardson J. W.; Ozawa M. Structural Phase Transformations of Rare-earth Modified Transition Alumina to Corundum. J. Alloys Compd. 1997, 250, 356–359. 10.1016/S0925-8388(96)02550-9. [DOI] [Google Scholar]
- Lunkenbein T.; Girgsdies F.; Kandemir T.; Thomas N.; Behrens M.; Schlögl R.; Frei E. Bridging the Time Gap: A Copper/Zinc Oxide/Aluminum Oxide Catalyst for Methanol Synthesis Studied under Industrially Relevant Conditions and Time Scales. Angew. Chem., Int. Ed. 2016, 55, 12708–12712. 10.1002/anie.201603368. [DOI] [PubMed] [Google Scholar]
- Makepeace J. W.; Wood T. J.; Hunter H. M. A.; Jones M. O.; David W. I. F. Ammonia Decomposition Catalysis using Non-stoichiometric Lithium Imide. Chem. Sci. 2015, 6, 3805–3815. 10.1039/C5SC00205B. [DOI] [PMC free article] [PubMed] [Google Scholar]
- David W. I. F.; Makepeace J. W.; Callear S. K.; Hunter H. M. A.; Taylor J. D.; Wood T. J.; Jones M. O. Hydrogen Production from Ammonia Using Sodium Amide. J. Am. Chem. Soc. 2014, 136, 13082–13085. 10.1021/ja5042836. [DOI] [PubMed] [Google Scholar]
- Ogasawara K.; Nakao T.; Kishida K.; Ye T. N.; Lu Y.; Abe H.; Niwa Y.; Sasase M.; Kitano M.; Hosono H. Ammonia Decomposition over CaNH-Supported Ni Catalysts via an NH2—Vacancy-Mediated Mars-van Krevelen Mechanism. ACS Catal. 2021, 11, 11005–11015. 10.1021/acscatal.1c01934. [DOI] [Google Scholar]
- Kandemir T.; Schuster M. E.; Senyshyn A.; Behrens M.; Schlögl R. The Haber-Bosch Process Revisited: On the Real Structure and Stability of “Ammonia Iron” under Working Conditions. Angew. Chem., Int. Ed. 2013, 52, 12723–12726. 10.1002/anie.201305812. [DOI] [PubMed] [Google Scholar]
- Kojima R.; Aika K. I. Rhenium Containing Binary Catalysts for Ammonia Synthesis. Appl. Catal., A 2001, 209, 317–325. 10.1016/S0926-860X(00)00764-X. [DOI] [Google Scholar]
- Mcaulay K.; Hargreaves J. S. J.; McFarlane A. R.; Price D. J.; Spencer N. A.; Bion N.; Can F.; Richard M.; Greer H. F.; Zhou W. Z. The Influence of Pre-treatment Gas Mixture upon the Ammonia Synthesis Activity of Co-Re Catalysts. Catal. Commun. 2015, 68, 53–57. 10.1016/j.catcom.2015.04.016. [DOI] [Google Scholar]
- Cao Y.; Saito A.; Kobayashi Y.; Ubukata H.; Tang Y.; Kageyama H. Vanadium Hydride as an Ammonia Synthesis Catalyst. ChemCatChem. 2021, 13, 191–195. 10.1002/cctc.202001084. [DOI] [Google Scholar]
- Hara M.; Kitano M.; Hosono H. Ru-loaded C12A7: e-electride as a Catalyst for Ammonia Synthesis. ACS Catal. 2017, 7, 2313–2324. 10.1021/acscatal.6b03357. [DOI] [Google Scholar]
- Gao W. B.; Wang P. K.; Guo J. P.; Chang F.; He T.; Wang Q. R.; Wu G. T.; Chen P. Barium Hydride-mediated Nitrogen Transfer and Hydrogenation for Ammonia Synthesis: A Case Study of Cobalt. ACS Catal. 2017, 7, 3654–3661. 10.1021/acscatal.7b00284. [DOI] [Google Scholar]
- Wang P. K.; Chang F.; Gao W. B.; Guo J. P.; Wu G. T.; He T.; Chen P. Breaking Scaling Relations to Achieve Low-temperature Ammonia Synthesis Through LiH-Mediated Nitrogen Transfer and Hydrogenation. Nat. Chem. 2017, 9, 64–70. 10.1038/nchem.2595. [DOI] [PubMed] [Google Scholar]
- Ertl G.; Huber M.; Thiele N. Formation and Decomposition of Nitrides on Iron Surfaces. Z. Naturforsch. A 1979, 34, 30–39. 10.1515/zna-1979-0106. [DOI] [Google Scholar]
- Widenmeyer M.; Niewa R. In Situ Neutron Diffraction in the System Fe-N. Z. Anorg. Allg. Chem. 2012, 638, 1628–1628. 10.1002/zaac.201204124. [DOI] [Google Scholar]
- Widenmeyer M.; Hansen T. C.; Meissner E.; Niewa R. Formation and Decomposition of Iron Nitrides Observed by In Situ Powder Neutron Diffraction and Thermal Analysis. Z. Anorg. Allg. Chem. 2014, 640, 1265–1274. 10.1002/zaac.201300676. [DOI] [Google Scholar]
- Foo C.; Fellowes J.; Fang H. H.; Large A.; Wu S.; Held G.; Raine E.; Ho P. L.; Tang C.; Tsang S. C. E. Importance of Hydrogen Migration in Catalytic Ammonia Synthesis over Yttrium-Doped Barium Zirconate-Supported Ruthenium Nanoparticles: Visualization of Proton Trap Sites. J. Phys. Chem. C 2021, 125, 23058–23070. 10.1021/acs.jpcc.1c04002. [DOI] [Google Scholar]
- Ooya K.; Li J.; Fukui K.; Iimura S.; Nakao T.; Ogasawara K.; Sasase M.; Abe H.; Niwa Y.; Kitano M.; Hosono H. Ruthenium Catalysts Promoted by Lanthanide Oxyhydrides with High Hydride-Ion Mobility for Low-Temperature Ammonia Synthesis. Adv. Energy Mater. 2021, 11, 2003723. 10.1002/aenm.202003723. [DOI] [Google Scholar]
- Kanbara S.; Kitano M.; Inoue Y.; Yokoyama T.; Hara M.; Hosono H. Mechanism Switching of Ammonia Synthesis over Ru-loaded Electride Catalyst at Metal-insulator Transition. J. Am. Chem. Soc. 2015, 137, 14517–14524. 10.1021/jacs.5b10145. [DOI] [PubMed] [Google Scholar]
- Mizoguchi H.; Okunaka M.; Kitano M.; Matsuishi S.; Yokoyama T.; Hosono H. Hydride-Based Electride Material, LnH2 (Ln= La, Ce, or Y). Inorg. Chem. 2016, 55, 8833–8838. 10.1021/acs.inorgchem.6b01369. [DOI] [PubMed] [Google Scholar]
- Kitano M.; Inoue Y.; Sasase M.; Kishida K.; Kobayashi Y.; Nishiyama K.; Tada T.; Kawamura S.; Yokoyama T.; Hara M.; Hosono H. Self-organized Ruthenium-Barium Core-Shell Nanoparticles on a Mesoporous Calcium Amide Matrix for Efficient Low-Temperature Ammonia Synthesis. Angew. Chem., Int. Ed. 2018, 57, 2648–2652. 10.1002/anie.201712398. [DOI] [PubMed] [Google Scholar]
- Kojima R.; Aika K. I. Cobalt Molybdenum Bimetallic Nitride Catalysts for Ammonia Synthesis: Part 2. Kinetic Study. Appl. Catal., A 2001, 218, 121–128. 10.1016/S0926-860X(01)00626-3. [DOI] [Google Scholar]
- David W. I. F.; Jones M. O.; Gregory D. H.; Jewell C. M.; Johnson S. R.; Walton A.; Edwards P. P. A Mechanism for Non-stoichiometry in the Lithium Amide/Lithium Imide Hydrogen Storage Reaction. J. Am. Chem. Soc. 2007, 129, 1594–1601. 10.1021/ja066016s. [DOI] [PubMed] [Google Scholar]
- Makepeace J. W.; Hunter H. M.; Wood T. J.; Smith R. I.; Murray C. A.; David W. I. Ammonia Decomposition Catalysis using Lithium-calcium Imide. Faraday Discuss. 2016, 188, 525–544. 10.1039/C5FD00179J. [DOI] [PubMed] [Google Scholar]
- Guo J.; Wang P.; Wu G.; Wu A.; Hu D.; Xiong Z.; Wang J.; Yu P.; Chang F.; Chen Z.; Chen P. Lithium imide synergy with 3d transition-metal nitrides leading to unprecedented catalytic activities for ammonia decomposition. Angew. Chem., Int. Ed. 2015, 54, 2950–2954. 10.1002/anie.201410773. [DOI] [PubMed] [Google Scholar]
- Guo J. P.; Chang F.; Wang P. K.; Hu D. Q.; Yu P.; Wu G. T.; Xiong Z. T.; Chen P. Highly Active MnN-Li2NH Composite Catalyst for Producing COx-Free Hydrogen. ACS Catal. 2015, 5, 2708–2713. 10.1021/acscatal.5b00278. [DOI] [Google Scholar]
- Guo J. P.; Chen Z.; Wu A. A.; Chang F.; Wang P. K.; Hu D. Q.; Wu G. T.; Xiong Z. T.; Yu P.; Chen P. Electronic Promoter or Reacting Species? The Role of LiNH2 on Ru in Catalyzing NH3 Decomposition. Chem. Commun. 2015, 51, 15161–15164. 10.1039/C5CC04645A. [DOI] [PubMed] [Google Scholar]
- Makepeace J. W.; Wood T. J.; Marks P. L.; Smith R. I.; Murray C. A.; David W. I. Bulk Phase Behavior of Lithium Imide-metal Nitride Ammonia Decomposition Catalysts. Phys. Chem. Chem. Phys. 2018, 20, 22689–22697. 10.1039/C8CP02824A. [DOI] [PubMed] [Google Scholar]
- Wood T. J.; Makepeace J. W.; David W. I. Neutron Diffraction and Gravimetric Study of the Iron Nitriding Reaction under Ammonia Decomposition Conditions. Phys. Chem. Chem. Phys. 2017, 19, 27859–27865. 10.1039/C7CP04494A. [DOI] [PubMed] [Google Scholar]
- Kandemir T.; Kasatkin I.; Girgsdies F.; Zander S.; Kühl S.; Tovar M.; Schlögl R.; Behrens M. Microstructural and Defect Analysis of Metal Nanoparticles in Functional Catalysts by Diffraction and Electron Microscopy: The Cu/ZnO Catalyst for Methanol Synthesis. Top. Catal. 2014, 57, 188–206. 10.1007/s11244-013-0175-2. [DOI] [Google Scholar]
- Dove M. T.; Tucker M. G.; Keen D. A. Neutron Total Scattering Method: Simultaneous Determination of Long-range and Short-range Order in Disordered Materials. Eur. J. Mineral. 2002, 14, 331–348. 10.1127/0935-1221/2002/0014-0331. [DOI] [Google Scholar]
- Hardacre C.; Holbrey J. D.; Nieuwenhuyzen M.; Youngs T. G. A. Structure and Solvation in Ionic Liquids. Acc. Chem. Res. 2007, 40, 1146–1155. 10.1021/ar700068x. [DOI] [PubMed] [Google Scholar]
- Soper A. K. Partial Structure Factors from Disordered Materials Diffraction Data: An Approach Using Empirical Potential Structure Refinement. Phys. Rev. B 2005, 72, 104204. 10.1103/PhysRevB.72.104204. [DOI] [Google Scholar]
- Falkowska M.; Bowron D. T.; Manyar H. G.; Hardacre C.; Youngs T. G. A. Neutron Scattering of Aromatic and Aliphatic Liquids. ChemPhysChem 2016, 17, 2043–2055. 10.1002/cphc.201600149. [DOI] [PMC free article] [PubMed] [Google Scholar]
- Hughes T. L.; Falkowska M.; Leutzsch M.; Sederman A. J.; Mantle M. D.; Headen T. F.; Youngs T. G. A.; Bowron D. T.; Hardacre C. Bulk and Confined Benzene-Cyclohexane Mixtures Studied by an Integrated Total Neutron Scattering and NMR Method. Top. Catal. 2021, 64, 722–734. 10.1007/s11244-021-01437-w. [DOI] [Google Scholar]
- Leutzsch M.; Falkowska M.; Hughes T. L.; Sederman A. J.; Gladden L. F.; Mantle M. D.; Youngs T. G. A.; Bowron D.; Manyar H.; Hardacre C. An Integrated Total Neutron Scattering - NMR Approach for the Study of Heterogeneous Catalysis. Chem. Commun. 2018, 54, 10191–10194. 10.1039/C8CC04740E. [DOI] [PubMed] [Google Scholar]
- Dervin D.; O’Malley A. J.; Falkowska M.; Chansai S.; Silverwood I. P.; Hardacre C.; Catlow C. R. A. Probing the Dynamics and Structure of Confined Benzene in MCM-41 Based Catalysts. Phys. Chem. Chem. Phys. 2020, 22, 11485–11489. 10.1039/D0CP01196G. [DOI] [PubMed] [Google Scholar]
- Falkowska M.; Bowron D. T.; Manyar H.; Youngs T. G. A.; Hardacre C. Confinement Effects on the Benzene Orientational Structure. Angew. Chem., Int. Ed. 2018, 57, 4565–4570. 10.1002/anie.201713115. [DOI] [PMC free article] [PubMed] [Google Scholar]
- Headen T. F.; Howard C. A.; Skipper N. T.; Wilkinson M. A.; Bowron D. T.; Soper A. K. Structure of π-π Interactions in Aromatic Liquids. J. Am. Chem. Soc. 2010, 132, 5735–5742. 10.1021/ja909084e. [DOI] [PubMed] [Google Scholar]
- Soper A. K.; Bowron D. T. Density Profile of Nitrogen in Cylindrical Pores of MCM-41. Chem. Phys. Lett. 2017, 683, 529–535. 10.1016/j.cplett.2017.03.060. [DOI] [Google Scholar]
- Soper A. K.; Bowron D. T. Adsorption of Simple Gases into the Porous Glass MCM-41. J. Chem. Phys. 2021, 154, 184503. 10.1063/5.0053555. [DOI] [PubMed] [Google Scholar]
- Mamontov E.; Boone C.; Frost M. J.; Herwig K. W.; Huegle T.; Lin J. Y. Y.; McCormick B.; McHargue W.; Stoica A. D.; Torres P.; et al. A Concept of a Broadband Inverted Geometry Spectrometer for the Second Target Station at the Spallation Neutron Source. Rev. Sci. Instrum. 2022, 93, 045101. 10.1063/5.0086451. [DOI] [PubMed] [Google Scholar]
- Mamontov E.; O’Neill H. Microscopic Relaxations in a Protein Sustained Down to 160K in a Non-glass Forming Organic Solvent. Biochim. Biophys. Acta Gen. Subj. 2017, 1861, 3513–3519. 10.1016/j.bbagen.2016.04.024. [DOI] [PubMed] [Google Scholar]
- Ollivier J.; Mutka H. IN5 Cold Neutron Time-of-flight Spectrometer, Prepared to Tackle Single Crystal Spectroscopy. J. Phys. Soc. Jpn. 2011, 80, SB003. 10.1143/JPSJS.80SB.SB003. [DOI] [Google Scholar]
- Bewley R. I.; Taylor J. W.; Bennington S. M. LET, a Cold Neutron Multi-disk Chopper Spectrometer at ISIS. Nucl. Instrum. Methods Phys. Res. A: Accel. Spectrom. Detect. Assoc. Equip. 2011, 637, 128–134. 10.1016/j.nima.2011.01.173. [DOI] [Google Scholar]
- Ehlers G.; Podlesnyak A. A.; Niedziela J. L.; Iverson E. B.; Sokol P. E. The New Cold Neutron Chopper Spectrometer at the Spallation Neutron Source: Design and Performance. Rev. Sci. Instrum. 2011, 82, 085108. 10.1063/1.3626935. [DOI] [PubMed] [Google Scholar]
- Appel M.; Frick B.; Magerl A. First Results with the Neutron Backscattering and TOF Spectrometer Option BATS on IN16B. Phys. B: Condens. Matter 2019, 562, 6–8. 10.1016/j.physb.2018.11.062. [DOI] [Google Scholar]
- Frick B.; Mamontov E.; Eijck L. V.; Seydel T. Recent Backscattering Instrument Developments at the ILL and SNS. Z. Phys. Chem. 2010, 224, 33–60. 10.1524/zpch.2010.6091. [DOI] [Google Scholar]
- Telling M. T. F.; Andersen K. H. Spectroscopic Characteristics of the OSIRIS Near-backscattering Crystal Analyser Spectrometer on the ISIS Pulsed Neutron Source. Phys. Chem. Chem. Phys. 2005, 7, 1255–1261. 10.1039/B413934H. [DOI] [PubMed] [Google Scholar]
- O’malley A. J.; Catlow C. R. A.; Monkenbusch M.; Jobic H. Diffusion of Isobutane in Silicalite: a neutron spin-echo and molecular dynamics simulation study. J. Phys. Chem. C 2015, 119, 26999–27006. 10.1021/acs.jpcc.5b08048. [DOI] [Google Scholar]
- Mukhopadhyay R.; Sayeed A.; Mitra S.; Anil Kumar A. V.; Rao M. N.; Yashonath S.; Chaplot S. L. Rotational Dynamics of Propane in Na-Y Zeolite: A Molecular Dynamics and Quasielastic Neutron-scattering Study. Phys. Rev. E 2002, 66, 061201. 10.1103/PhysRevE.66.061201. [DOI] [PubMed] [Google Scholar]
- Mukhopadhyay R.; Sayeed A.; Rao M. N.; Anilkumar A. V.; Mitra S.; Yashonath S.; Chaplot S. L. Rotation of Propane Molecules in Supercages of Na-Y Zeolite. Chem. Phys. 2003, 292, 217–222. 10.1016/S0301-0104(03)00082-X. [DOI] [Google Scholar]
- Hawkins A. P.; O’Malley A. J.; Zachariou A.; Collier P.; Ewings R. A.; Silverwood I. P.; Howe R. F.; Parker S. F.; Lennon D. Investigation of the Dynamics of 1-Octene Adsorption at 293 K in a ZSM-5 Catalyst by Inelastic and Quasielastic Neutron Scattering. J. Phys. Chem. C 2019, 123, 417–425. 10.1021/acs.jpcc.8b08420. [DOI] [Google Scholar]
- Sharma V. K.; Mitra S.; Maheshwari P.; Dutta D.; Pujari P. K.; Mukhopadhyay R. Effect of Guest-host Interaction on the Dynamics of Ethylene Glycol in H-ZSM5 Zeolite. Eur. Phys. J. Spec. Top. 2010, 189, 273–277. 10.1140/epjst/e2010-01332-x. [DOI] [Google Scholar]
- Jobic H.; Theodorou D. N. Quasi-elastic Neutron Scattering and Molecular Dynamics Simulation as Complementary Techniques for Studying Diffusion in Zeolites. Microporous Mesoporous Mater. 2007, 102, 21–50. 10.1016/j.micromeso.2006.12.034. [DOI] [Google Scholar]
- Mitra S.; Sharma V. K.; Mukhopadhyay R. Diffusion of Confined Fluids in Microporous Zeolites and Clay Materials. Rep. Prog. Phys. 2021, 84, 066501. 10.1088/1361-6633/abf085. [DOI] [PubMed] [Google Scholar]
- Jobic H.; Bée M.; Kearley G. J. Translational and Rotational Dynamics of Methane in ZSM-5 Zeolite: A Quasi-elastic Neutron Scattering Study. Zeolites 1989, 9, 312–317. 10.1016/0144-2449(89)90077-8. [DOI] [Google Scholar]
- Jobic H.; Bée M.; Kearley G. J. Dynamics of Ethane and Propane in Zeolite ZSM-5 Studied by Quasi-elastic Neutron Scattering. Zeolites 1992, 12, 146–151. 10.1016/0144-2449(92)90075-Z. [DOI] [Google Scholar]
- Millot B.; Méthivier A.; Jobic H.; Moueddeb H.; Bée M. Diffusion of Isobutane in ZSM-5 Zeolite: A Comparison of Quasi-Elastic Neutron Scattering and Supported Membrane Results. J. Phys. Chem. B 1999, 103, 1096–1101. 10.1021/jp982897g. [DOI] [Google Scholar]
- Leroy F.; Jobic H. Influence of Extra-framework Cations on the Diffusion of Alkanes in Silicalite: Comparison between Quasi-elastic Neutron Scattering and Molecular Simulations. Chem. Phys. Lett. 2005, 406, 375–380. 10.1016/j.cplett.2005.03.035. [DOI] [Google Scholar]
- Jobic H.; Theodorou D. N. Diffusion of Long n-Alkanes in Silicalite. A Comparison between Neutron Scattering Experiments and Hierarchical Simulation Results. J. Phys. Chem. B 2006, 110, 1964–1967. 10.1021/jp056924w. [DOI] [PubMed] [Google Scholar]
- Jobic H.; Schmidt W.; Krause C. B.; Kärger J. PFG NMR and QENS Diffusion Study of n-alkane Homologues in MFI-type Zeolites. Microporous Mesoporous Mater. 2006, 90, 299–306. 10.1016/j.micromeso.2005.10.020. [DOI] [Google Scholar]
- Gupta N. M.; Kumar D.; Kamble V. S.; Mitra S.; Mukhopadhyay R.; Kartha V. B. Fourier Transform Infrared and Quasielectron Neutron Scattering Studies on the Binding Modes of Methanol Molecules in the Confined Spaces of HMCM-41 and HZSM-5: Role of Pore Structure and Surface Acid Sites. J. Phys. Chem. B 2006, 110, 4815–4823. 10.1021/jp053668e. [DOI] [PubMed] [Google Scholar]
- O’Malley A. J.; García Sakai V.; Silverwood I. P.; Dimitratos N.; Parker S. F.; Catlow C. R. A. Methanol Diffusion in Zeolite HY: A Combined Quasielastic Neutron Scattering and Molecular Dynamics Simulation Study. Phys. Chem. Chem. Phys. 2016, 18, 17294–17302. 10.1039/C6CP01151A. [DOI] [PubMed] [Google Scholar]
- Matam S. K.; O’Malley A. J.; Catlow C. R. A.; Suwardiyanto; Collier P.; Hawkins A. P.; Zachariou A.; Lennon D.; Silverwood I.; Parker S. F.; et al. The Effects of MTG Catalysis on Methanol Mobility in ZSM-5. Catal. Sci. Technol. 2018, 8, 3304–3312. 10.1039/C8CY00422F. [DOI] [Google Scholar]
- Sharma V. K.; Gautam S.; Mitra S.; Rao M. N.; Tripathi A. K.; Chaplot S. L.; Mukhopadhyay R. Dynamics of Adsorbed Hydrocarbon in Nanoporous Zeolite Framework. J. Phys. Chem. B 2009, 113, 8066–8072. 10.1021/jp9014405. [DOI] [PubMed] [Google Scholar]
- Sayeed A.; Mitra S.; Anil Kumar A. V.; Mukhopadhyay R.; Yashonath S.; Chaplot S. L. Diffusion of Propane in Zeolite NaY: A Molecular Dynamics and Quasi-Elastic Neutron Scattering Study. J. Phys. Chem. B 2003, 107, 527–533. 10.1021/jp025576k. [DOI] [Google Scholar]
- Mitra S.; Gautam S.; Mukhopadhyay R.; Sumitra S.; Umarji A. M.; Yashonath S.; Chaplot S. L. Diffusion of Acetylene Embedded in Na-Y Zeolite: QENS and MD Simulation Studies. Phys. B: Condens. Matter 2006, 385–386, 275–278. 10.1016/j.physb.2006.05.066. [DOI] [Google Scholar]
- Gautam S.; Tripathi A. K.; Kamble V. S.; Mitra S.; Mukhopadhyay R. Diffusion of Propylene Adsorbed in Na-Y and Na-ZSM5 Zeolites: Neutron Scattering and FTIR Studies. Pramana 2008, 71, 1153–1157. 10.1007/s12043-008-0239-1. [DOI] [Google Scholar]
- Sharma V. K.; Gautam S.; Mitra S.; Mukhopadhyay R. Dynamics of Propylene adsorbed in Na-Y and Na-ZSM5 Zeolites: A QENS and MD Simulation Study. Z. Phys. Chem. 2010, 224, 133–152. 10.1524/zpch.2010.6096. [DOI] [Google Scholar]
- Mitra S.; Sharma V. K.; Mukhopadhyay R. Dynamics of Molecules Adsorbed in Zeolitic Systems: Neutron Scattering and MD Simulation Studies. AIP Conf. Proc. 2011, 1349, 54–57. 10.1063/1.3605738. [DOI] [Google Scholar]
- Feldhoff A.; Caro J.; Jobic H.; Ollivier J.; Krause C. B.; Galvosas P.; Kärger J. Intracrystalline Transport Resistances in Nanoporous Zeolite X. ChemPhysChem 2009, 10, 2429–2433. 10.1002/cphc.200900279. [DOI] [PubMed] [Google Scholar]
- O’Malley A. J.; Sarwar M.; Armstrong J.; Catlow C. R. A.; Silverwood I. P.; York A. P. E.; Hitchcock I. Comparing Ammonia Diffusion in NH3-SCR Zeolite Catalysts: A Quasielastic Neutron Scattering and Molecular Dynamics Simulation Study. Phys. Chem. Chem. Phys. 2018, 20, 11976–11986. 10.1039/C8CP01022F. [DOI] [PubMed] [Google Scholar]
- Skukauskas V.; Johnson Humphrey E. L. B.; Hitchcock I.; York A.; Kelleher J.; Gibson E. K.; Nelson D. J.; Silverwood I. P. Operando Neutron Scattering: Following Reactions in Real Time Using Neutrons. Top. Catal. 2021, 64, 693–698. 10.1007/s11244-021-01436-x. [DOI] [Google Scholar]
- Calvo-Almazán I.; Fouquet P. The Application of Quasi-elastic Neutron Scattering Techniques (QENS) in Surface Diffusion Studies. Eur. Phys. J. Spec. Top. 2012, 213, 149–163. 10.1140/epjst/e2012-01668-1. [DOI] [Google Scholar]
- Haji-Akbari A.; Debenedetti P. G. The Effect of Substrate on Thermodynamic and Kinetic Anisotropies in Atomic Thin Films. J. Chem. Phys. 2014, 141, 024506. 10.1063/1.4885365. [DOI] [PubMed] [Google Scholar]
- Hou J.; Liu L.; Mamontov E. Non-monotonic Behavior of the Lateral Diffusivity in an Adsorbate as a Function of the Surface Coverage. Comput. Mater. Sci. 2020, 172, 109299. 10.1016/j.commatsci.2019.109299. [DOI] [Google Scholar]
- Stockmeyer R. Zur Bestimmung der Beweglichkeit von Kohlenwasserstoffmolekülen auf Katalysatoroberflächen Mittels Neutronenstreuung. Ber. Bunsenges. Phys. Chem. 1976, 80, 625–629. 10.1002/bbpc.19760800710. [DOI] [Google Scholar]
- Renouprez A.; Fouilloux P.; Stockmeyer R.; Conrad H. M.; Goeltz G. Diffusion of Chemisorbed Hydrogen on a Nickel Catalyst. Ber. Bunsenges. Phys. Chem. 1977, 81, 429–432. 10.1002/bbpc.19770810415. [DOI] [Google Scholar]
- Coulomb J. P.; Bienfait M.; Thorel P. Mobility Measurements of Two Kinds of Two-dimensional Fluids. Methane Adsorbed on Graphite. J. Phys. (Paris) 1981, 42, 293–306. 10.1051/jphys:01981004202029300. [DOI] [Google Scholar]
- Bienfait M. Surface Premelting of CH4 Thin Films. Europhys. Lett. 1987, 4, 79–84. 10.1209/0295-5075/4/1/013. [DOI] [Google Scholar]
- Herwig K. W.; Wu Z.; Dai P.; Taub H.; Hansen F. Y. Quasielastic Neutron Scattering and Molecular Dynamics Simulation Studies of the Melting Transition in Butane and Hexane Monolayers Adsorbed on Graphite. J. Chem. Phys. 1997, 107, 5186–5196. 10.1063/1.474881. [DOI] [Google Scholar]
- Bienfait M.; Coulomb J. P.; Palmari J. P. Diffusivity of a Two-dimensional Lattice Fluid: CH4 Adsorbed on MgO(100). Surf. Sci. 1987, 182, 557–566. 10.1016/0039-6028(87)90020-3. [DOI] [Google Scholar]
- Mamontov E. Dynamics of Surface Water in ZrO2 Studied by Quasielastic Neutron Scattering. J. Chem. Phys. 2004, 121, 9087–9097. 10.1063/1.1804152. [DOI] [PubMed] [Google Scholar]
- Mamontov E. High-resolution Neutron-scattering Study of Slow Dynamics of Surface Water Molecules in Zirconium Oxide. J. Chem. Phys. 2005, 123, 024706. 10.1063/1.1949171. [DOI] [PubMed] [Google Scholar]
- Lechner R. E. Effects of Low-dimensionality in Solid-state Protonic Conductors. Solid State Ion. 1995, 77, 280–286. 10.1016/0167-2738(94)00308-F. [DOI] [Google Scholar]
- Malikova N.; Longeville S.; Zanotti J. M.; Dubois E.; Marry V.; Turq P.; Ollivier J. Signature of Low-Dimensional Diffusion in Complex Systems. Phys. Rev. Lett. 2008, 101, 265901. 10.1103/PhysRevLett.101.265901. [DOI] [PubMed] [Google Scholar]
- Martínez-Casado R.; Vega J. L.; Sanz A. S.; Miret-Artés S. Quasi-elastic Peak Lineshapes in Adsorbate Diffusion on Nearly Flat Surfaces at Low Coverages: the Motional Narrowing Effect in Xe on Pt(111). J. Phys.: Condens. Matter 2007, 19, 176006. 10.1088/0953-8984/19/17/176006. [DOI] [PubMed] [Google Scholar]
- Calvo-Almazán I.; Bahn E.; Koza M. M.; Zbiri M.; Maccarini M.; Telling M. T. F.; Miret-Artés S.; Fouquet P. Benzene Diffusion on Graphite Described by a Rough Hard Disk Model. Carbon 2014, 79, 183–191. 10.1016/j.carbon.2014.07.058. [DOI] [Google Scholar]
- Konrad H.; Weissmüller J.; Birringer R.; Karmonik C.; Gleiter H. Kinetics of Gallium Films Confined at Grain Boundaries. Phys. Rev. B 1998, 58, 2142–2149. 10.1103/PhysRevB.58.2142. [DOI] [Google Scholar]
- Takahara S.; Kittaka S.; Mori T.; Kuroda Y.; Yamaguchi T.; Shibata K. Neutron Scattering Study on the Dynamics of Water Molecules Adsorbed on SrF2 and ZnO Surfaces. J. Phys. Chem. B 2002, 106, 5689–5694. 10.1021/jp014461y. [DOI] [Google Scholar]
- Vaissier V.; Sakai V. G.; Li X. E.; Cabral J. T.; Nelson J.; Barnes P. R. F. How Mobile Are Dye Adsorbates and Acetonitrile Molecules on the Surface of TiO2 Nanoparticles? A Quasi-elastic Neutron Scattering Study. Sci. Rep. 2016, 6, 39253. 10.1038/srep39253. [DOI] [PMC free article] [PubMed] [Google Scholar]
- Silverwood I. P.; Armstrong J. Surface Diffusion of Cyclic Hydrocarbons on Nickel. Surf. Sci. 2018, 674, 13–17. 10.1016/j.susc.2018.03.012. [DOI] [Google Scholar]
- Mamontov E. Observation of Fragile-to-strong Liquid Transition in Surface Water in CeO2. J. Chem. Phys. 2005, 123, 171101. 10.1063/1.2125729. [DOI] [PubMed] [Google Scholar]
- Mamontov E.; Vlcek L.; Wesolowski D. J.; Cummings P. T.; Wang W.; Anovitz L. M.; Rosenqvist J.; Brown C. M.; Garcia Sakai V. Dynamics and Structure of Hydration Water on Rutile and Cassiterite Nanopowders Studied by Quasielastic Neutron Scattering and Molecular Dynamics Simulations. J. Phys. Chem. C 2007, 111, 4328–4341. 10.1021/jp067242r. [DOI] [Google Scholar]
- Mamontov E.; Wesolowski D. J.; Vlcek L.; Cummings P. T.; Rosenqvist J.; Wang W.; Cole D. R. Dynamics of Hydration Water on Rutile Studied by Backscattering Neutron Spectroscopy and Molecular Dynamics Simulation. J. Phys. Chem. C 2008, 112, 12334–12341. 10.1021/jp711965x. [DOI] [Google Scholar]
- Mamontov E.; Vlcek L.; Wesolowski D. J.; Cummings P. T.; Rosenqvist J.; Wang W.; Cole D. R.; Anovitz L. M.; Gasparovic G. Suppression of the Dynamic Transition in Surface Water at Low Hydration Levels: A Study of Water on Rutile. Phys. Rev. E 2009, 79, 051504. 10.1103/PhysRevE.79.051504. [DOI] [PubMed] [Google Scholar]
- Chathoth S. M.; Anjos D. M.; Mamontov E.; Brown G. M.; Overbury S. H. Dynamics of Phenanthrenequinone on Carbon Nano-Onion Surfaces Probed by Quasielastic Neutron Scattering. J. Phys. Chem. B 2012, 116, 7291–7295. 10.1021/jp302155a. [DOI] [PubMed] [Google Scholar]
- Stack A. G.; Borreguero J. M.; Prisk T. R.; Mamontov E.; Wang H. W.; Vlcek L.; Wesolowski D. J. Precise Determination of Water Exchanges on a Mineral Surface. Phys. Chem. Chem. Phys. 2016, 18, 28819–28828. 10.1039/C6CP05836A. [DOI] [PubMed] [Google Scholar]
- Liu T.; Gautam S.; Wang H.-W.; Anovitz L. M.; Mamontov E.; Allard L. F.; Cole D. R. Structure and Dynamics of Water on the Forsterite Surface. Phys. Chem. Chem. Phys. 2018, 20, 27822–27829. 10.1039/C8CP05075A. [DOI] [PubMed] [Google Scholar]
- Stuhrmann H. B. Neutron Small-angle Scattering of Biological Macromolecules in Solution. J. Appl. Crystallogr. 1974, 7, 173–178. 10.1107/S0021889874009071. [DOI] [Google Scholar]
- Yan G. Y.; Shi P.; Xia Y. H.; Chen J.; Ji H. F.; Fan Z. J.; Zou L.; Huang C. Q.; Sun G. G.; Wang X. L. In Situ Small-Angle Neutron Scattering Analysis of the Initial Deuteride Formation of Deuterium-Cerium Reactions under a Controlled Gas Flow. J. Phys. Chem. C 2020, 124, 20175–20183. 10.1021/acs.jpcc.0c05766. [DOI] [Google Scholar]
- Yan G. Y.; Ji H. F.; Zou L.; Xia Y. H.; Chen J.; Shi P.; Fan Z. J.; Peng M.; Sun G. G.; Wang X. L. In-situ Small Angle Neutron Scattering Analysis of Hydride Initiation on Oxide-coated Metal with Surface Signals Enhanced by a Multi-plate Reaction Chamber. Int. J. Hydrogen Energy 2021, 46, 4065–4071. 10.1016/j.ijhydene.2020.10.159. [DOI] [Google Scholar]
- Prabhu V. M.; Reipa V. In Situ Electrochemical Small-Angle Neutron Scattering (eSANS) for Quantitative Structure and Redox Properties of Nanoparticles. J. Phys. Chem. Lett. 2012, 3, 646–650. 10.1021/jz300124t. [DOI] [PubMed] [Google Scholar]
- Prabhu V. M.; Reipa V.; Rondinone A. J.; Formo E.; Bonnesen P. V. Development of In Situ Electrochemical Small-Angle Neutron Scattering (eSANS) for Simultaneous Structure and Redox Characterization of Nanoparticles. ECS Trans. 2016, 72, 179–188. 10.1149/07202.0179ecst. [DOI] [PMC free article] [PubMed] [Google Scholar]
- Hayward D. W.; Chiappisi L.; Prévost S.; Schweins R.; Gradzielski M. A Small-Angle Neutron Scattering Environment for In-Situ Observation of Chemical Processes. Sci. Rep. 2018, 8, 7299. 10.1038/s41598-018-24718-z. [DOI] [PMC free article] [PubMed] [Google Scholar]
- Larichev Y. V.; Ivankov O. I. Study of Supported Metal Catalysts by the Methods of the Small-Angle Scattering of Neutrons and X-rays. J. Surf. Invest.: X-ray, Synchrotron Neutron Technol. 2021, 15, 903–907. 10.1134/S1027451021050074. [DOI] [Google Scholar]
- Kim S. H.; Han S.; Ha H.; Byun J. Y.; Kim M. H. Support-shape Dependent Catalytic Activity in Pt/Alumina Systems using Ultra-small (USANS) and Small Angle Neutron Scattering (SANS). Catal. Today 2016, 260, 46–54. 10.1016/j.cattod.2015.05.031. [DOI] [Google Scholar]
- Acharya D. R.; Allen A. J.; Hughes R. A Small-angle Neutron Scattering Investigation of Coke Deposits on Catalysts. Ind. Eng. Chem. Res. 1990, 29, 1119–1125. 10.1021/ie00103a005. [DOI] [Google Scholar]
- Boukhalfa S.; He L.; Melnichenko Y. B.; Yushin G. Small-Angle Neutron Scattering for In Situ Probing of Ion Adsorption Inside Micropores. Angew. Chem., Int. Ed. 2013, 52, 4618–4622. 10.1002/anie.201209141. [DOI] [PubMed] [Google Scholar]
- Boukhalfa S.; Gordon D.; He L. L.; Melnichenko Y. B.; Nitta N.; Magasinski A.; Yushin G. In Situ Small Angle Neutron Scattering Revealing Ion Sorption in Microporous Carbon Electrical Double Layer Capacitors. ACS Nano 2014, 8, 2495–2503. 10.1021/nn406077n. [DOI] [PubMed] [Google Scholar]
- Rother G.; Vlcek L.; Gruszkiewicz M. S.; Chialvo A. A.; Anovitz L. M.; Bañuelos J. L.; Wallacher D.; Grimm N.; Cole D. R. Sorption Phase of Supercritical CO2 in Silica Aerogel: Experiments and Mesoscale Computer Simulations. J. Phys. Chem. C 2014, 118, 15525–15533. 10.1021/jp503739x. [DOI] [Google Scholar]
- Chathoth S. M.; Mamontov E.; Melnichenko Y. B.; Zamponi M. Diffusion and Adsorption of Methane Confined in Nano-porous Carbon Aerogel: A Combined Quasi-elastic and Small-angle Neutron Scattering Study. Microporous Mesoporous Mater. 2010, 132, 148–153. 10.1016/j.micromeso.2010.02.012. [DOI] [Google Scholar]
- Yoshimune W.; Kato S.; Harada M. In Situ Small-angle Neutron Scattering Analysis of Water Evaporation from Porous Exhaust-Gas-Catalyst Supports. ACS Appl. Mater. Interfaces 2022, 14, 17396–17404. 10.1021/acsami.2c01594. [DOI] [PMC free article] [PubMed] [Google Scholar]
- Koizumi S.; Ueda S.; Inada T.; Noda Y.; Robinson R. A. Microstructure and Water Distribution in Catalysts for Polymer Electrolyte Fuel Cells, Elucidated by Contrast Variation Small-angle Neutron Scattering. J. Appl. Crystallogr. 2019, 52, 791–799. 10.1107/S1600576719008343. [DOI] [Google Scholar]
- Balu R.; Choudhury N. R.; Mata J. P.; de Campo L.; Rehm C.; Hill A. J.; Dutta N. K. Evolution of the Interfacial Structure of a Catalyst Ink with the Quality of the Dispersing Solvent: A Contrast Variation Small-Angle and Ultrasmall-Angle Neutron Scattering Investigation. ACS Appl. Mater. Interfaces 2019, 11, 9934–9946. 10.1021/acsami.8b20645. [DOI] [PubMed] [Google Scholar]
- Hollamby M. J. Practical Applications of Small-angle Neutron Scattering. Phys. Chem. Chem. Phys. 2013, 15, 10566–10579. 10.1039/c3cp50293g. [DOI] [PubMed] [Google Scholar]
- Brenizer J. S. A Review of Significant Advances in Neutron Imaging from Conception to the Present. Phys. Procedia 2013, 43, 10–20. 10.1016/j.phpro.2013.03.002. [DOI] [Google Scholar]
- Lehmann E. H. Neutron Imaging Facilities in a Global Context. J. Imaging 2017, 3, 52. 10.3390/jimaging3040052. [DOI] [Google Scholar]
- Strobl M.; Manke I.; Kardjilov N.; Hilger A.; Dawson M.; Banhart J. Advances in Neutron Radiography and Tomography. J. Phys. D Appl. Phys. 2009, 42, 243001. 10.1088/0022-3727/42/24/243001. [DOI] [Google Scholar]
- Kardjilov N.; Manke I.; Woracek R.; Hilger A.; Banhart J. Advances in Neutron Imaging. Mater. Today 2018, 21, 652–672. 10.1016/j.mattod.2018.03.001. [DOI] [Google Scholar]
- Tran K. V.; Woracek R.; Kardjilov N.; Markötter H.; Hilger A.; Kockelmann W.; Kelleher J.; Puplampu S. B.; Penumadu D.; Tremsin A. S.; et al. Spectral Neutron Tomography. Mater. Today Adv. 2021, 9, 100132. 10.1016/j.mtadv.2021.100132. [DOI] [Google Scholar]
- Minniti T.; Kockelmann W.; Burca G.; Kelleher J. F.; Kabra S.; Zhang S. Y.; Pooley D. E.; Schooneveld E. M.; Mutamba Q.; Sykora J.; et al. Materials Analysis Opportunities on the New Neutron Imaging Facility IMAT@ISIS. J. Instrum. 2016, 11, C03014. 10.1088/1748-0221/11/03/C03014. [DOI] [Google Scholar]
- Shinohara T.; Kai T.; Oikawa K.; Nakatani T.; Segawa M.; Hiroi K.; Su Y. H.; Ooi M.; Harada M.; Iikura H.; et al. The Energy-resolved Neutron Imaging System, RADEN. Rev. Sci. Instrum. 2020, 91, 043302. 10.1063/1.5136034. [DOI] [PubMed] [Google Scholar]
- Tengattini A.; Lenoir N.; Andò E.; Giroud B.; Atkins D.; Beaucour J.; Viggiani G. NeXT-Grenoble, the Neutron and X-ray Tomograph in Grenoble. Nucl. Instrum. Methods Phys. Res. A: Accel. Spectrom. Detect. Assoc. Equip. 2020, 968, 163939. 10.1016/j.nima.2020.163939. [DOI] [Google Scholar]
- Trtik P.; Hovind J.; Grünzweig C.; Bollhalder A.; Thominet V.; David C.; Kaestner A.; Lehmann E. H. Improving the Spatial Resolution of Neutron Imaging at Paul Scherrer Institut - The Neutron Microscope Project. Phys. Procedia 2015, 69, 169–176. 10.1016/j.phpro.2015.07.024. [DOI] [Google Scholar]
- Tötzke C.; Kardjilov N.; Lenoir N.; Manke I.; Oswald S. E.; Tengattini A. What Comes NeXT?-High-Speed Neutron Tomography at ILL. Opt. Express 2019, 27, 28640–28648. 10.1364/OE.27.028640. [DOI] [PubMed] [Google Scholar]
- Boillat P.; Lehmann E. H.; Trtik P.; Cochet M. Neutron Imaging of Fuel Cells - Recent Trends and Future Prospects. Curr. Opin. Electrochem. 2017, 5, 3–10. 10.1016/j.coelec.2017.07.012. [DOI] [Google Scholar]
- Ossler F.; Finney C. E. A.; Warren J. M.; Bilheux J. C.; Zhang Y. X.; Mills R. A.; Santodonato L. J.; Bilheux H. Z. Dynamics of Hydrogen Loss and Structural Changes in Pyrolyzing Biomass Utilizing Neutron Imaging. Carbon 2021, 176, 511–529. 10.1016/j.carbon.2020.11.060. [DOI] [Google Scholar]
- Toops T. J.; Bilheux H. Z.; Voisin S.; Gregor J.; Walker L.; Strzelec A.; Finney C. E. A.; Pihl J. A. Neutron Tomography of Particulate Filters: A Non-Destructive Investigation TAool for applied and Industrial Research. Nucl. Instrum. Methods Phys. Res. A: Accel. Spectrom. Detect. Assoc. Equip. 2013, 729, 581–588. 10.1016/j.nima.2013.08.033. [DOI] [Google Scholar]
- Romanelli G.; Minniti T.; Škoro G.; Krzystyniak M.; Taylor J.; Fornalski D.; Fernandez-Alonso F. Visualization of the Catalyzed Nuclear-Spin Conversion of Molecular Hydrogen Using Energy-Selective Neutron Imaging. J. Phys. Chem. C 2019, 123, 11745–11751. 10.1021/acs.jpcc.9b01858. [DOI] [Google Scholar]
- Higuchi Y.; Setoyama D.; Isegawa K.; Tsuchikawa Y.; Matsumoto Y.; Parker J. D.; Shinohara T.; Nagai Y. Pulsed Neutron Imaging for Differentiation of Ice and Liquid Water Towards Fuel Cell Vehicle Applications. Phys. Chem. Chem. Phys. 2021, 23, 1062–1071. 10.1039/D0CP03887C. [DOI] [PubMed] [Google Scholar]
- Borgschulte A.; Delmelle R.; Duarte R. B.; Heel A.; Boillat P.; Lehmann E. Water Distribution in a Sorption Enhanced Methanation Reactor by Time Resolved Neutron Imaging. Phys. Chem. Chem. Phys. 2016, 18, 17217–17223. 10.1039/C5CP07686B. [DOI] [PubMed] [Google Scholar]
- Terreni J.; Trottmann M.; Delmelle R.; Heel A.; Trtik P.; Lehmann E. H.; Borgschulte A. Observing Chemical Reactions by Time-Resolved High-Resolution Neutron Imaging. J. Phys. Chem. C 2018, 122, 23574–23581. 10.1021/acs.jpcc.8b07321. [DOI] [Google Scholar]
- Terreni J.; Billeter E.; Sambalova O.; Liu X. C.; Trottmann M.; Sterzi A.; Geerlings H.; Trtik P.; Kaestner A.; Borgschulte A. Hydrogen in Methanol Catalysts by Neutron Imaging. Phys. Chem. Chem. Phys. 2020, 22, 22979–22988. 10.1039/D0CP03414B. [DOI] [PubMed] [Google Scholar]
- Rols S.; Anglaret E.; Sauvajol J. L.; Coddens G.; Schober H.; Dianoux A. J. Structure and Dynamics of Single-wall-carbon Nanotubes Probed by Neutron Scattering. Phys. B: Condens. Matter 2000, 276–278, 276–277. 10.1016/S0921-4526(99)01484-2. [DOI] [Google Scholar]
- Hawkins A. P.; Zachariou A.; Parker S. F.; Collier P.; Howe R. F.; Lennon D. Studies of Propene Conversion over H-ZSM-5 Demonstrate the Importance of Propene as an Intermediate in Methanol-to-hydrocarbons Chemistry. Catal. Sci. Technol. 2021, 11, 2924–2938. 10.1039/D1CY00048A. [DOI] [Google Scholar]
- Tan S.; Cheng Y. Q.; Daemen L. L.; Lutterman D. A. Design of a Facility for the In Situ Measurement of Catalytic Reaction by Neutron Scattering Spectroscopy. Rev. Sci. Instrum. 2018, 89, 014101. 10.1063/1.4991523. [DOI] [PubMed] [Google Scholar]
- O’Malley A. J.; Catlow C. R. A.. Chapter 6 - Sorbate Dynamics in Zeolite Catalysts. In Experimental Methods in the Physical Sciences; Fernandez-Alonso F., Price D. L., Eds.; Vol. 49; Academic Press, 2017; pp 349–401. [Google Scholar]
- Buchanan J. S. The Chemistry of Olefins Production by ZSM-5 Addition to Catalytic Cracking Units. Catal. Today 2000, 55, 207–212. 10.1016/S0920-5861(99)00248-5. [DOI] [Google Scholar]
- Arbe A.; Nilsen G. J.; Stewart J. R.; Alvarez F.; Sakai V. G.; Colmenero J. Coherent Structural Relaxation of Water from Meso-to Intermolecular Ccales Measured using Neutron Spectroscopy with Polarization Analysis. Phys. Rev. Res. 2020, 2, 022015. 10.1103/PhysRevResearch.2.022015. [DOI] [Google Scholar]
Associated Data
This section collects any data citations, data availability statements, or supplementary materials included in this article.