

Abstract
Background:
Delayed initiation and inadequate titration remain critical challenges to optimizing insulin therapy in type 2 diabetes (T2D). We aimed to study whether hemoglobin A1c (HbA1c) can be lowered in people with insulin-treated T2D using telemonitoring.
Methods:
This single-center study recruited adults with greater than or equal to six months of diabetes, greater than or equal to three months of insulin therapy, HbA1c ≥8.5% and ≤12.5%, and body mass index (BMI) ≤40 kg/m2. All participants received a connected glucose meter and the accompanying smartphone application. Participants sent weekly blood glucose (BG) diary to their primary endocrinologist via email. Adjustments in insulin doses were communicated to the participants. HbA1c, proportion of BG readings in range (70-180 mg/dL, PIR), below range (<70 mg/dL, PBR) and above range (>180 mg/dL, PAR), and glycemic variability as the coefficient of variation (% CV) were measured at baseline, week 12, and week 24 and compared using repeated-measures analysis of variance (ANOVA) or Friedman’s ANOVA.
Results:
We recruited 40 people (55% women). Mean age was 57.9 years, BMI 27.8 kg/m2, and baseline HbA1c 9.8% (83.7 mmol/mol). Mean HbA1c improved by 1.7%, % CV reduced from 32.9% to 30.7%, PIR increased from 58.8% to 67.1% (all P <.01) by week 24, without any change in PBR. This was achieved with a 0.04 U/kg/d median increase in total daily dose of insulin and 0.9 kg weight gain over 24 weeks.
Conclusion:
Telemonitoring and titration of insulin using a connected glucose meter resulted in significant improvements in glycemia, characterized by a reduction in HbA1c, increase in PIR, and reduction in glycemic variability without any increase in hypoglycemia.
Keywords: telemonitoring, type 2 diabetes, insulin, connected glucose meter, insulin titration, glycemic variability
Introduction
Type 2 diabetes (T2D) is a significant global health care burden with a projected worldwide prevalence of 643 million by 2030 and 783 million by 2045. 1 Health care costs are rising and may become unsustainable with current care models. Despite newer diabetes technology and medications, including insulin analogs becoming available, less than 50% of people living with diabetes achieve glycemic goals. 2 Limitations to glucose improvement especially in the setting of insulin initiation and titration include risk of hypoglycemia, delay or lack of insulin titration, limited access and/or inaccuracy of glucose data, and infrequent health care provider visits. 3 Telemonitoring is a modality that may combat clinical inertia for insulin titration.
Insulin therapy remains an effective and essential glucose-lowering strategy despite the availability of newer non-insulin agents. The progressive nature of T2D necessitates treatment with insulin when non-insulin therapies become ineffective, 4 occurring in 17% to 34% of people with T2D.5,6 The availability of newer insulin analogs has further reduced the risk of hypoglycemia, a significant barrier to insulin intensification. 7
However, optimal management of insulin therapy involves periodic review, interpretation of glucose data, and then adjusting insulin therapy. Consequently, adequate titration of insulin after initiation is fraught with multiple challenges. 3 First, insulin should be titrated every few days to weekly to achieve optimal glycemia, 4 but most people with T2D meet their health care provider just three to four times a year. Up to 80% remain on suboptimal insulin doses even six months after insulin initiation.8,9 This conservative and slow insulin intensification process is related to concerns of hypoglycemia with aggressive dose adjustments without adequate monitoring. Second, during these brief consultations, a comprehensive review of the glucose data is difficult due to the inability to review all blood glucose (BG) readings efficiently in a short time and the incomplete/inaccurate manual recording of BG data. Just 50% of the manual BG diary maintained by people with diabetes is accurate compared with the BG readings on their glucose meters. 10
A complete feedback loop of glucose monitoring, data interpretation, and therapy modification is associated with improved outcomes. 11 The implementation of this feedback loop has been challenging, but the disruption in conventional medical care delivery during the COVID-19 pandemic has accelerated the deployment of telemedicine as an alternative care delivery model.
This study explored the feasibility, safety, and efficacy of telemonitoring with an integrated connected glucose meter to improve glycemia in people with insulin-treated T2D.
Material and Methods
This study was a single-site, single-group, pre-post interventional study which recruited adults (≥21 years), with T2D of more than six months duration, on basal-plus or basal-bolus insulin therapy for greater than or equal to three months, with hemoglobin A1c (HbA1c) ≥8.5% and <12.5%, and body mass index (BMI) ≤40 kg/m2. A basal-plus regimen constitutes the use of basal insulin with 1 to 2 mealtime boluses. A basal-bolus regimen uses basal insulin with mealtime boluses for all meals. 12 We excluded those on premixed insulin given the inability to independently titrate the basal and bolus insulin. Participants must have used glucose monitoring and own a compatible smartphone. We excluded people with a reduced hypoglycemia awareness (Gold score >4) to limit the risk of severe hypoglycemia (SH), pregnant or breastfeeding women, those with renal impairment (estimated glomerular filtration rate [eGFR] <30 mL/min/1.73 m2), known hemoglobinopathies, systemic corticosteroid use, and any serious disease with less than one-year life expectancy. SingHealth Central Institutional Review Board approved the study (Ref. No 2020/2197). Participants were recruited from the Diabetes & Metabolism Centre, Singapore General Hospital, a tertiary referral hospital in Singapore, from December 2020 to April 2022.
All participants received the Contour Plus One (Ascensia Diabetes Care Holdings AG, Switzerland) BG monitoring system. It is a capillary blood glucose (CBG) meter that connects via Bluetooth to the accompanying Contour Diabetes Application on the smartphone. The glucose meter has a three-color display, indicating whether the result is below, in target, or above target. 13 Diabetes Nurse Educators (DNEs) trained the participants to use the glucose meter and smartphone application, for hypoglycemia detection and management. We recommended daily fasting CBG and three times a day (fasting, pre-bolus, and bedtime) testing twice a week for those on the basal-plus regimen, and daily fasting CBG and four times a day (pre-boluses and bedtime) testing thrice a week for those on basal-bolus regimen. The minimum readings expected per week were 11 and 16 for basal-plus and basal-bolus regimens, respectively. In addition, all participants were encouraged to do CBG checks if they had symptoms of hypoglycemia. Participants were free to do more frequent monitoring and were provided with enough test strips to support four times a day testing. The minimum recommended frequency was a consensus reached within the study team considering the data needed to make safe insulin dose adjustments, the resistance to frequent CBG monitoring, and the out-of-pocket payment for test strips (in routine care) due to the lack of insurance coverage for diabetes consumables in Singapore.
Participants sent their CBG diary from the smartphone application weekly for the first 12 weeks and bimonthly for the next 12 weeks providing 18 contacts with the endocrinologist for review and feedback, of which only two were face-to-face consultations. A study coordinator reminded the participants via text messages or email. The data were sent in .pdf format for review by the endocrinologist and in .csv format for analysis. The participant’s primary endocrinologist reviewed the CBG diary and communicated any dose change or feedback via email. We did not utilize any standardized insulin dose adjustment protocols. Instead, insulin doses were adjusted in keeping with the standard clinical practice, 4 and glucose targets for each participant were further individualized by their endocrinologist. Participants returned for a DNE and doctor consultation at 12 weeks and a final doctor consultation at 24 weeks.
The primary outcome was a change in HbA1c from baseline to week 12 and week 24. We calculated the percentage of BG readings in range, above range, and below range. We used the terminology proportion-in-range 14 to differentiate it from time-in-range (TIR), which is typically derived from continuous glucose monitoring (CGM) data. Secondary glycemic variables included proportion-in-range (PIR) (70-180 mg/dL, 3.9-10.0 mmol/L), proportion-above-range (PAR) (>180 mg/dL, >10.0 mmol/L), proportion-below-range (PBR) (<70 mg/dL, <3.9 mmol/L), and glucose variability (GV) measured as coefficient of variation (% CV, mean glucose/standard deviation × 100) for four weekly intervals. Baseline CBG variables (weeks 1-4) were compared with 12 weeks (weeks 9-12) and 24 weeks (weeks 21-24). We used this approach to capture the full extent of change in CBG metrics across each of these time points.
Other hypoglycemia-related parameters collected included self-reported episodes of SH in the preceding six months before baseline visit and between study visits, defined as an episode of hypoglycemia requiring another person’s assistance or loss of consciousness. We also collected data on the Gold score 15 and Dose Adjustment For Normal Eating (DAFNE) hypoglycemia awareness score 16 and calculated the participants’ adherence to prescribed CBG testing. All participants completed the study without any dropouts. All data were available for the primary outcome, HbA1c. However, not all participants adhered to the recommended minimum CBG during the study period. No imputation was done for missing CBG data, and CBG variables were calculated with available CBG data.
Statistical Analysis
We assumed that a sample size of 34 would give us 80% power to detect a decrease in HbA1c of 0.5% (standard deviation [SD] of 1%) at 12 weeks with an alpha of .05. We present data as mean and standard deviation (mean [SD]) if normally distributed and median and interquartile ranges (median [25th-75th centiles]) if non-normally distributed. Frequency is presented as count (%). We compared the variables at baseline, week 12, and week 24 using repeated-measures analysis of variance (ANOVA) for normally distributed variables, with post hoc paired samples t-test (Bonferroni correction) and Friedman’s ANOVA for non-normally distributed variables with post hoc Durbin-Conover test. We used the statistical package Jamovi (Version 2.3). 17
Results
Forty people with T2D consented and completed the study. The baseline characteristics of the participants are shown in Table 1.
Table 1.
Baseline Characteristics.
| Characteristic | Result |
|---|---|
| Age, years, mean (SD) | 57.9 (10.7) |
| Sex, n (%) | |
| Female | 22 (55%) |
| Male | 18 (45%) |
| Ethnicity, n (%) | |
| Chinese | 28 (70%) |
| Indian | 9 (22.5%) |
| Malay | 3 (7.5%) |
| BMI, kg/m2, mean (SD) | 27.8 (4.3) |
| HbA1c, %, mean (SD) | 9.8 (0.9) |
| HbA1c, mmol/mol | 83.7 (10.2) |
| Gold Score, n (%) | |
| <4 | 39 (97.5%) |
| 4 | 1 (2.5%) |
| DAFNE hypoglycemia score, n (%) | |
| ≥3 mmol/L | 19 (47.5%) |
| <3 mmol/L | 18 (45%) |
| Not at all | 3 (7.5%) |
| Severe hypoglycemia in the past six months, n (%) | |
| 0 | 38 (95%) |
| 1 | 1 (2.5%) |
| 2 | 1 (2.5%) |
| Insulin regimen, n (%) | |
| Basal-plus | 1 (2.5%) |
| Basal-bolus | 39 (97.5%) |
| Basal insulin type, n (%) | |
| Levemir | 1 (2.5%) |
| Glargine (U100) | 36 (90%) |
| Glargine (U300) | 3 (7.5%) |
| Bolus insulin type, n (%) | |
| Human regular | 1 (2.5%) |
| Glulisine | 18 (45%) |
| Aspart | 21 (52.5%) |
All data are expressed as mean (SD) or count (%).
Abbreviations: SD, standard deviation; BMI, body mass index; DAFNE, Dose Adjustment For Normal Eating.
The participants had a mean age of 57.9 (10.9) years, 55% were women, a mean BMI of 27.8 (4.3) kg/m2, and a mean baseline HbA1c of 9.8% (0.9) (83.7 [10.2] mmol/mol). Two participants (5%) reported SH in the preceding six months. The majority (39, 97.5%) had a good awareness of hypoglycemia (Gold score <4). However, the hypoglycemia detection threshold was <3.0 mmol/L for 18 (45%) participants. Most participants (39 [97.5%]) were on a basal-bolus insulin regimen, and the most used basal and bolus insulins were Glargine U100 (36 [90%]) and Aspart (21 [52%]), respectively.
HbA1c and Other Glycemic Variables
Mean HbA1c decreased from 9.8% at baseline to 8.2% at week 12 and 8.1% at week 24 (Figure 1, P <.001), resulting in an overall decrease in HbA1c of 1.7% (standard error, 0.16%) over 24 weeks (Table 2). The average number of dose adjustments was 7.8 (4.3) during the study (week 1-12: 5.5 [3.1]; week 13-24: 2.3 [1.7]). Only four participants (10%) achieved an HbA1c <7% by week 24.
Figure 1.
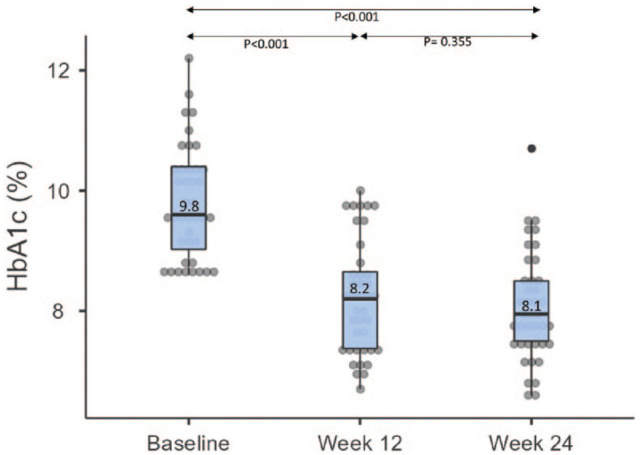
Change in HbA1c.
Table 2.
Key Outcomes From Baseline to Week 12 and Week 24.
| Variable | Baseline | Week 12 | Week 24 | P-value for trend |
|---|---|---|---|---|
| HbA1c, % HbA1c, mmol/mol |
9.8 (0.9) 83.7 (10.2) |
8.2 (0.9)
a
66.3 (10.3) a |
8.1 (0.9)
b
64.6 (9.8) b |
<.001 <.001 |
| Proportion-in-range, % (70-180 mg/dL, 3.9-10 mmol/L) | 58.8 (22) | 64.7 (20.8) a | 67.1 (21.6) b | .001 |
| Proportion-above-range, % (>180 mg/dL, >10 mmol/L) | 39 (22.7) | 33.7 (21.7) a | 31.3 (21.9) b | .005 |
| Proportion-below-range, % (<70 mg/dL, <3.9 mmol/L) | 0 (0, 2.6) | 0 (0, 2.3) | 1.3 (0, 2.3) | .540 |
| Coefficient of variation (CV), % | 32.9 (7.7) | 29.9 (7.3) a | 30.7 (7.6) b | <.001 |
| TDD of insulin (units/kg/d) | 0.80 (0.65, 0.97) | 0.82 (0.66, 1.1) | 0.84 (0.67, 1.1) b | .007 |
| TDD of basal insulin (units/kg/d) | 0.41 (0.35, 0.51) | 0.43 (0.33, 0.52) | 0.43 (0.33, 0.56) b | .112 |
| TDD of bolus insulin (units/kg/d) | 0.39 (0.28, 0.50) | 0.43 (0.28, 0.57) a | 0.40 (0.30, 0.53) b | <.001 |
| Body mass index, kg/m2 | 27.8 (4.3) | 28.2 (4.5) a | 28.2 (4.3) b | .008 |
| Body weight, kg | 74 (15.2) | 74.6 (15) a | 74.9 (15.2) b | .012 |
All data reported as mean (SD) except proportion below range and total daily doses of insulins reported as median (25th centile, 75th centile).
Abbreviations: CV, coefficient of variation; TDD, total daily dose; SD, standard deviation.
P < .05, baseline versus week 12.
P < .05, baseline versus week 24.
P < .05, week 12 versus week 24.
Proportion-in-range increased from 58.8% at baseline to 67.1% at week 24 (P < .05), and PAR decreased from 39% at baseline to 31.3% at week 24 (P < .05), without any change in PBR (P = .540). % CV, decreased from 32.9% to 30.7% (P < .001). Variables derived from four-weekly intervals throughout the study period are shown in Supplementary Table S1. The total daily dose (TDD) of insulin increased from 0.80 at baseline to 0.84 U/kg/d at week 24 (P = .007), primarily driven by an increase in TDD of the bolus from 0.39 at baseline, 0.43 at week 12, and 0.40 U/kg/d at week 24 (P < .001). Body weight increased from 74 to 74.9 kg (P = .012) during the study.
Only one SH occurred during the study in the initial 12 weeks (Table 3). This was managed at home without any ambulance callout or admission. There were no significant changes in Gold score; however, a higher proportion had lower DAFNE hypoglycemia scores by the end of the study (Friedman’s repeated-measures ANOVA: χ2, 19.9; df, 2; P < .001).
Table 3.
Hypoglycemia-Related Variables.
| Variable | Baseline | Week 12 | Week 24 |
|---|---|---|---|
| Severe hypoglycemia a episodes | |||
| 0 | 38 (95%) | 39 (97.5%) | 40 (100%) |
| 1 | 1 (2.5%) | 1 (2.5%) | 0 (0%) |
| 2 | 1 (2.5%) | 0 (0%) | 0 (0%) |
| Gold score | |||
| <4 | 39 (97.5%) | 40 (100%) | 38 (95%) |
| ≥4 | 1 (2.5%) | 0 (0%) | 2 (5%) |
| Dose Adjustment For Normal Eating hypoglycemia score | |||
| 1: ≥3 mmol/L | 19 (47.5%) | 26 (65%) | 36 (90%) |
| 2: <3 mmol/L | 18 (45%) | 12 (30%) | 2 (5%) |
| 3: Not at all | 3 (7.5%) | 2 (5%) | 2 (5%) |
All data are reported as n (%).
Severe hypoglycemia was measured as episodes for the past six months at baseline and as episodes in the past three months at week 12 and week 24.
Adherence to Glucose Testing
At week 12, 26 (65%), and by week 24, 23 (57.5%) were able to adhere to or exceed the testing frequency recommended. The average CBG testing frequency for the whole study was 2.5 ± 0.6 per day (week 1-12: 2.6 ± 0.6, week 13-24: 2.4 ± 0.6).
Discussion
Telemonitoring and insulin dose titration using a connected glucose meter significantly reduced the HbA1c and GV, and improved PIR without increasing hypoglycemia in people with T2D in a tertiary care setting.
In this study, an HbA1c reduction of 1.7% was achieved without any significant increase in hypoglycemia. This is similar to other studies on telemonitoring for diabetes showing no increase in hypoglycemia. 18 Exclusion of people with impaired awareness of hypoglycemia (IAH, Gold score >4) and eGFR <30 mL/min/1.73 m2 likely limited the hypoglycemia. Despite this, only 47.5% could detect hypoglycemia ≥3 mmol/L at baseline. Interestingly, by the end of the study, 90% could detect hypoglycemia ≥3 mmol/L despite no change in Gold scores. Previous studies have reported discordance between various assessment methods for IAH.19,20 More specifically, discordance between the hypoglycemia detection threshold and Gold score has also been reported. 21 One possibility is that the DAFNE hypoglycemia score which uses a specific glucose level to assess the threshold of awareness is more sensitive to improvement in awareness of IAH than the Gold score. However, this needs to be assessed in a future study.
Proportion-in-range of CBG readings is a useful parameter to assess glycemia where CGM use is not an option. The relationship between TIR derived from CGM and HbA1c is well known. A TIR of >70% correlates to an HbA1c of <7%. 22 However, CGM provides 96 to 288 readings/day distributed evenly, while CBG readings sample only a small portion of the glycemia over 24 hours and may be biased to fasting or pre-meal periods. Despite this, with >5 CBG per day, a PIR >60% correlates to an HbA1c of <7.5%. 14 However, in our study, despite a PIR of 67%, the HbA1c was 8.1%. This is due to the much lower frequency of CBG monitoring of only 2.5 ± 0.6 CBG/day in our study. Furthermore, a larger proportion of these would have been fasting glucose readings due to the structure of the CBG monitoring recommended. On the contrary, postprandial hyperglycemia is known to predominate as HbA1c decreases to 8%. 23 We believe that this also explains the stagnation of HbA1c at around 8% from week 12 to week 24. PIR at week 24 was 67%, denoting that majority of the readings reviewed by the endocrinologist were in target range negating the need for any increase in insulin doses. This suggests that CBG monitoring frequency was not sufficient to reveal the periods of postprandial hyperglycemia and trigger further intensification of insulin therapy. One solution might be to re-structure CBG testing to include more postprandial readings as fasting glycemia is optimal and HbA1c nears 8%. Other possible factors for the stagnation include a reduction in the frequency of monitoring from weekly to bimonthly or a sense of fatigue from the regular feedback, which was reflected in the decrease in adherence to monitoring frequency from week 12 to week 24. The optimal frequency and distribution of CBG testing over the HbA1c ranges and telemonitoring contacts need to be discerned in future studies.
Glucose variability, but not HbA1c, correlates with hypoglycemia. 24 Glucose variability is related to both microvascular and macrovascular complications and mortality in people with T2D independent of HbA1c.25,26 A higher GV has also been associated with cardiac autonomic neuropathy in people with type 1 diabetes. 27 In our study, the decrease in HbA1c occurred with a concomitant decrease in GV measured as % CV. While glucagon-like peptide-1 receptor agonists (GLP-1 RA) and basal insulin regimens are known to reduce GV, 28 this study highlights the impact of glucose-informed insulin titration on GV even in people with basal-bolus insulin therapy.
Telemonitoring likely improves glycemia via multiple mechanisms. In our study, an HbA1c lowering of 1.7% over 24 weeks was achieved with only a small median increase in average TDD of about 0.04 U/kg/d, translating to just 2.4 units of insulin for a 60-kg adult. This suggests the role of non-insulin factors. We speculate that some degree of behavior change and education accompanied the weekly CBG review and direct feedback. Behavior change could result from greater self-motivation and improved physician-patient communication. Changes like a lower carbohydrate intake, increased adherence to medications, and increased physical activity could explain the improvement in HbA1c disproportionate to the change in TDD of insulin. Previous studies have also acknowledged the role of non-pharmacological factors in the improvement of glycemia during telemonitoring. 29
Acceptability of telemonitoring in our study was high, suggested by the lack of dropouts. This is in keeping with the studies on the perceived intrusiveness of frequent feedback of clinical parameters, showing that people find CBG monitoring to be less intrusive than food monitoring. 30 Features associated with a successful interactive technology include perception of benefit, convenience of use, and integration into existing consumer technologies. 11 The system we used integrated well into the existing day-to-day device use pattern for both participants and doctors. In addition to convenience, telemonitoring in diabetes has also been shown to be cost-effective. 31
However, despite the high acceptability, adherence to the recommended minimum CBG monitoring declined over time to 57.5%. Previous observational studies report varying degrees of adherence to blood glucose monitoring across the world. A multinational study, DAWN2, 32 recruiting 1368 and 7228 people with type 1 and type 2 diabetes, respectively, reported higher adherence to recommended CBG testing in western countries like the United States, Poland, and Germany (adherence to recommended testing on 4.2-4.5 d/wk; 60%-64%) compared with Asian countries like India, China, and Japan (adherence to recommended testing on 2.1-3.3 d/wk; 30%-47%). Part of the reason for lower adherence in Asia is likely the lack of Universal Health Coverage and hence the lack of reimbursement for diabetes-related consumables. 33 In our study, although test strips were provided free, adherence eventually declined. This also highlights the fact that barriers other than cost are limiting the achievement of a high degree of glucose monitoring when relying on finger-prick CBG monitoring. CGM systems can overcome many of these challenges. With CGM, the frequency of measurement is much higher and they are evenly distributed over 24 hours. Systems that do not need finger-prick CBG calibration significantly reduce the burden 34 associated with glucose monitoring. Most CGMs also have automated cloud-based storage accessible remotely to health care professionals, making it ideal for telemonitoring. However, access to and affordability of CGM is still an issue in many countries, and in such scenarios, an integrated glucose meter like the system we used remains valuable.
The strengths of our study include the large improvement in HbA1c without worsening hypoglycemia and improved hypoglycemia awareness without major changes to therapy. We report the use of telemonitoring intervention delivered by participants’ primary endocrinologists in a tertiary care setting, unlike the majority of prior studies which are in the primary care setting and delivered by allied health professionals. 18 Our study was a practical and real-life assessment of the application of telemonitoring as we did not use any pre-specified insulin titration algorithm and allowed the primary endocrinologist to assess the optimal targets.
There were multiple limitations to our study. First, this study was a pre-post study with no comparator arm. We cannot exclude the impact of the Hawthorne effect on study participants. 35 However, compared to routine diabetes care in which there would have been only two opportunities for titration of insulin, our study had on average 7.8 titrations over 24 weeks, suggesting that periodic feedback and dose adjustment of insulin might have a significant impact on glycemia. Second, given the minimal change of TDD of insulin despite improvement in HbA1c, we hypothesize that lifestyle changes occurred. However, we did not evaluate behavior modification such as nutrition, activity, and adherence to medications. Third, since the intervention involved the use of the connected glucose meter as well as periodic review and feedback from the primary endocrinologist, the degree of contribution of each of these components to the HbA1c lowering cannot be differentiated from this study.
Conclusion
Telemonitoring using a connected glucose meter is a safe and efficient alternate care model to overcome suboptimal glycemia in insulin-treated T2D.
Supplemental Material
Supplemental material, sj-docx-1-dst-10.1177_19322968231157387 for Telemonitoring With a Connected Glucose Meter Improves Glycemia Among People With Insulin-Treated Type 2 Diabetes by Suresh Rama Chandran, Hong Chang Tan, Qifan Chen, Phong Ching Lee, Daphne Su-Lyn Gardner, Yun Ann Chin, Amanda Yun Rui Lam, Ming Ming Teh and Yong Mong Bee in Journal of Diabetes Science and Technology
Footnotes
Abbreviations: BG, blood glucose; CBG, capillary blood glucose, CV, coefficient of variation, DNE, Diabetes Nurse Educator, GV, glucose variability, PAR, proportion-above-range, PBR, proportion-below-range, PIR, proportion-in-range, SH, severe hypoglycemia, SMBG, self-monitored blood glucose, T2D, type diabetes; TIR, time-in-range.
The author(s) declared the following potential conflicts of interest with respect to the research, authorship, and/or publication of this article: Suresh Rama Chandran: Received speaker fees from Abbott, Astra Zeneca, Boehringer Ingelheim, Dexcom, Medtronic, and Sanofi. Hong Chang Tan: None. Qifan Chen: None. Phong Ching Lee: None. Daphne Su-Lyn Gardner: Received speaker fees/honoraria from Abbott, Astra Zeneca, Boehringer Ingelheim, Dexcom, Medtronic, and Sanofi. Yun Ann Chin: None. Amanda Yun Rui Lam: None. Ming Ming Teh: None. Yong Mong Bee: Received speaker fees/honoraria from Astra Zeneca, Boehringer Ingelheim, Sanofi and Roche.
Funding: The author(s) disclosed receipt of the following financial support for the research, authorship, and/or publication of this article: This research is supported by Ascensia Diabetes Care Holdings AG and the Agency for Science, Technology and Research (A*STAR), Singapore, under its Industry Alignment Pre-Positioning Fund (Grant No. H19/01/a0/023—Diabetes Clinic of the Future).
ORCID iDs: Suresh Rama Chandran  https://orcid.org/0000-0001-5944-4886
Qifan Chen https://orcid.org/0000-0001-6789-7906
Supplemental Material: Supplemental material for this article is available online.
References
- 1.International Diabetes Federation. Diabetes facts & figures. Date unknown. https://idf.org/aboutdiabetes/what-is-diabetes/facts-figures.html. Accessed November 19, 2022.
- 2.Ali MK, Bullard KM, Saaddine JB, Cowie CC, Imperatore G, Gregg EW. Achievement of goals in U.S. diabetes care, 1999-2010. N Engl J Med. 2013;368(17):1613-1624. [DOI] [PubMed] [Google Scholar]
- 3.Yen FS, Hwu CM. Challenges of optimizing insulin therapy for patients with type 2 diabetes mellitus. J Diabetes Investig. 2021;12(9):1523-1525. [DOI] [PMC free article] [PubMed] [Google Scholar]
- 4.American Diabetes Association Professional Practice Committee. 9. Pharmacologic approaches to glycemic treatment: standards of medical care in diabetes—2022. Diabetes Care. 2021;45(suppl 1):S125-S143. [DOI] [PubMed] [Google Scholar]
- 5.Ji LN, Lu JM, Guo XH, et al. Glycemic control among patients in China with type 2 diabetes mellitus receiving oral drugs or injectables. BMC Public Health. 2013;13(1):1-8. [DOI] [PMC free article] [PubMed] [Google Scholar]
- 6.Borgharkar SS, Das SS. Real-world evidence of glycemic control among patients with type 2 diabetes mellitus in India: the TIGHT study. BMJ Open Diabetes Res Care. 2019;7(1):e000654. [DOI] [PMC free article] [PubMed] [Google Scholar]
- 7.Mauricio D, Hramiak I. Second-generation insulin analogues—a review of recent real-world data and forthcoming head-to-head comparisons. Eur Endocrinol. 2018;14(suppl 1):2-9. [DOI] [PMC free article] [PubMed] [Google Scholar]
- 8.Khunti K, Wolden ML, Thorsted BL, Andersen M, Davies MJ. Clinical inertia in people with type 2 diabetes. Diabetes Care. 2013;36(11):3411-3417. [DOI] [PMC free article] [PubMed] [Google Scholar]
- 9.Mocarski M, Yeaw J, Divino V, et al. Slow titration and delayed intensification of basal insulin among patients with type 2 diabetes. J Manag Care Spec Pharm. 2018;24(4):390-400. [DOI] [PMC free article] [PubMed] [Google Scholar]
- 10.Given JE, O’Kane MJ, Bunting BP, Coates VE. Comparing patient-generated blood glucose diary records with meter memory in diabetes: a systematic review. Diabet Med. 2013;30(8):901-913. [DOI] [PubMed] [Google Scholar]
- 11.Jimison H, Gorman P, Woods S, et al. Barriers and drivers of health information technology use for the elderly, chronically ill, and underserved. Evid Rep Technol Assess (Full Rep). 2008(175):1-1422. [PMC free article] [PubMed] [Google Scholar]
- 12.Raccah D, Huet D, Dib A, et al. Review of basal-plus insulin regimen options for simpler insulin intensification in people with Type 2 diabetes mellitus. Diabet Med. 2017;34(9):1193-1204. [DOI] [PMC free article] [PubMed] [Google Scholar]
- 13.Bailey TS, Wallace JF, Pardo S, et al. Accuracy and user performance evaluation of a new, wireless-enabled blood glucose monitoring system that links to a smart mobile device. J Diabetes Sci Technol. 2017;11(4):736-743. [DOI] [PMC free article] [PubMed] [Google Scholar]
- 14.Sivasubramaniyam S, Amiel SA, Choudhary P. Proportion of daily capillary blood glucose readings required in the target range for target glycaemic control: shift of focus from target range to proportion in range. Diabet Med. 2017;34(10):1456-1460. [DOI] [PubMed] [Google Scholar]
- 15.Gold AE, MacLeod KM, Frier BM. Frequency of severe hypoglycemia in patients with type I diabetes with impaired awareness of hypoglycemia. Diabetes Care. 1994;17(7):697-703. [DOI] [PubMed] [Google Scholar]
- 16.Amiel SA, Choudhary P, Jacob P, et al. Hypoglycaemia Awareness restoration programme for people with type 1 diabetes and problematic hypoglycaemia persisting despite optimised self-care (HARPdoc): protocol for a group randomised controlled trial of a novel intervention addressing cognitions. BMJ Open. 2019;9(6):e030356. [DOI] [PMC free article] [PubMed] [Google Scholar]
- 17.Jamovi. About. Date unknown. https://www.jamovi.org/about.html. Accessed November 2, 2022
- 18.Lee SWH, Chan CKY, Chua SS, Chaiyakunapruk N. Comparative effectiveness of telemedicine strategies on type 2 diabetes management: a systematic review and network meta-analysis. Sci Rep. 2017;7(1):12680. [DOI] [PMC free article] [PubMed] [Google Scholar]
- 19.Geddes J, Wright RJ, Zammitt NN, Deary IJ, Frier BM. An Evaluation of methods of assessing impaired awareness of hypoglycemia in type 1 diabetes. Diabetes Care. 2007;30(7):1868-1870. [DOI] [PubMed] [Google Scholar]
- 20.Rubin NT, Seaquist ER, Eberly L, et al. Relationship between hypoglycemia awareness status on Clarke/gold methods and counterregulatory response to hypoglycemia. J Endocr Soc. 2022;6(9):bvac107. [DOI] [PMC free article] [PubMed] [Google Scholar]
- 21.Cook AJ, DuBose SN, Foster N, et al. Cognitions associated with hypoglycemia awareness status and severe hypoglycemia experience in adults with type 1 diabetes. Diabetes Care. 2019;42(10):1854-1864. [DOI] [PubMed] [Google Scholar]
- 22.Beck RW, Bergenstal RM, Cheng P, et al. The relationships between time in range, hyperglycemia metrics, and HbA1c. J Diabetes Sci Technol. 2019;13(4):614-626. [DOI] [PMC free article] [PubMed] [Google Scholar]
- 23.Lim LL, Brnabic AJ, Chan SP, et al. Relationship of glycated hemoglobin, and fasting and postprandial hyperglycemia in type 2 diabetes mellitus patients in Malaysia. J Diabetes Investig. 2017;8:453-461. doi: 10.1111/jdi.12596. [DOI] [PMC free article] [PubMed] [Google Scholar]
- 24.Rama Chandran S, Tay WL, Lye WK, et al. Beyond HbA1c: comparing glycemic variability and glycemic indices in predicting hypoglycemia in type 1 and type 2 diabetes. Diabetes Technol Ther. 2018;20(5):353-362. [DOI] [PubMed] [Google Scholar]
- 25.Martinez M, Santamarina J, Pavesi A, Musso C, Umpierrez GE. Glycemic variability and cardiovascular disease in patients with type 2 diabetes. BMJ Open Diabetes Res Care. 2021;9(1):e002032. [DOI] [PMC free article] [PubMed] [Google Scholar]
- 26.Siegelaar SE, Holleman F, Hoekstra JBL, DeVries JH. Glucose variability; does it matter? Endocr Rev. 2010;31(2):171-182. [DOI] [PubMed] [Google Scholar]
- 27.Naaman SH, Mizrak HI, Lind N, et al. Cardiovascular autonomic neuropathy is associated with increased glucose variability in people with type 1 diabetes. Diabetes Care. 2022;45(10):2461-2465. [DOI] [PubMed] [Google Scholar]
- 28.Bajaj HS, Venn K, Ye C, et al. Lowest glucose variability and hypoglycemia are observed with the combination of a GLP-1 receptor agonist and basal insulin (VARIATION study). Diabetes Care. 2017;40(2):194-200. [DOI] [PubMed] [Google Scholar]
- 29.Tildesley HD, Po MD, Ross SA. Internet blood glucose monitoring systems provide lasting glycemic benefit in type 1 and 2 diabetes. Med Clin North Am. 2015;99(1):17-33. [DOI] [PubMed] [Google Scholar]
- 30.Oikonomidi T, Ravaud P, James A, Cosson E, Montori V, Tran VT. An international, mixed-methods study of the perceived intrusiveness of remote digital diabetes monitoring. Mayo Clin Proc. 2021;96(5):1236-1247. [DOI] [PubMed] [Google Scholar]
- 31.Ben-Assuli O. Measuring the cost-effectiveness of using telehealth for diabetes management: a narrative review of methods and findings. Int J Med Inform. 2022;163:104764. [DOI] [PubMed] [Google Scholar]
- 32.Nicolucci A, Kovacs Burns K, Holt RIG, et al. Diabetes attitudes, wishes and needs second study (DAWN2TM): cross-national benchmarking of diabetes-related psychosocial outcomes for people with diabetes. Diabet Med. 2013;30(7):767-777. [DOI] [PubMed] [Google Scholar]
- 33.Patcharanarumol W, Panichkriangkrai W, Wangmo S, Thammatacharee J, Uechi M, Wanwong Y. Diabetes prevention and care in the universal health coverage context: the example of Thailand. WHO South East Asia J Public Health. 2016;5(1):27-33. [DOI] [PubMed] [Google Scholar]
- 34.Al Hayek AA, Robert AA, Al Dawish MA. Differences of FreeStyle libre flash glucose monitoring system and finger pricks on clinical characteristics and glucose monitoring satisfactions in type 1 diabetes using insulin pump. Clin Med Insights Endocrinol Diabetes. 2019;12:1179551419861102. [DOI] [PMC free article] [PubMed] [Google Scholar]
- 35.McCambridge J, Witton J, Elbourne DR. Systematic review of the Hawthorne effect: new concepts are needed to study research participation effects. J Clin Epidemiol. 2014;67(3):267-277. [DOI] [PMC free article] [PubMed] [Google Scholar]
Associated Data
This section collects any data citations, data availability statements, or supplementary materials included in this article.
Supplementary Materials
Supplemental material, sj-docx-1-dst-10.1177_19322968231157387 for Telemonitoring With a Connected Glucose Meter Improves Glycemia Among People With Insulin-Treated Type 2 Diabetes by Suresh Rama Chandran, Hong Chang Tan, Qifan Chen, Phong Ching Lee, Daphne Su-Lyn Gardner, Yun Ann Chin, Amanda Yun Rui Lam, Ming Ming Teh and Yong Mong Bee in Journal of Diabetes Science and Technology