Abstract
Background
Cancer-associated fibroblasts (CAFs) are a diverse subset of cells, that is recently gaining in popularity and have the potential to become a new target for breast cancer (BC) therapy; however, broader research is required to understand their mechanisms and interactions with breast cancer cells. The goal of the study was to isolate CAFs from breast cancer tumour and characterise isolated cell lines. We concentrated on numerous CAF biomarkers that would enable their differentiation.
Materials and methods
Flow cytometry, immunofluorescence, and reverse transcription quantitative real-time polymerase chain reaction (RT-qPCR) were used to phenotype the primary CAFs.
Results/Conclusions
According to our findings, there was no significant pattern in the classification of cancer-associated fibroblasts. The results of biomarkers expression were heterogeneous, thus no specific subtypes were identified. Furthermore, a comparison of cancer-associated fibroblasts derived from different BC subtypes (luminal A and B, triple-negative, HER2 positive) did not reveal any clear trend of expression.
Keywords: primary culture, breast cancer, cells isolation, cancer-associated fibroblasts, tumour heterogeneity
Introduction
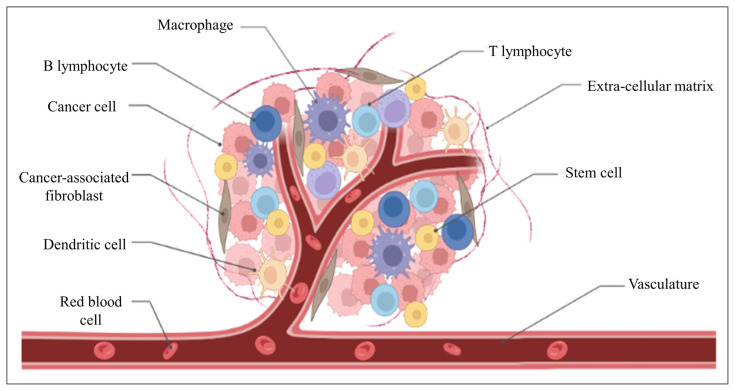
Breast cancer (BC) is the neoplasm with the highest morbidity in women and is distinguished by variations in the expression of oestrogen (ER), progesterone (PR), and human epidermal growth factor receptor 2 receptors (HER2). The expression of these receptors defines four biological subtypes: Luminal A (ER+/PR+/−), Luminal B (ER+/PR+/−/HER2+), HER2 positive (HER2+), and triple-negative (ER−/PR−/HER2−). The subgroups differ in terms of the likelihood of metastasis, disease mortality, and responsiveness to treatment [1]. The tumour’s existence is determined by various biological mechanisms and the cellular and non-cellular components of the tumour microenvironment (TME) [2]. TME is a complex, successively expanding entity that participates in the cross-talk between cancer cells and components of TME. This specific intercommunication drives tumour progression and survival [3]. The predominant elements of TME are cancer-associated fibroblasts (CAFs), macrophages, lymphocytes, stem cells (SCs), cancer cells and dendritic cells (Fig. 1) [4].
Figure 1.
Composition of the tumour microenvironment (Adapted from Anderson & Simon, 2020); figure created with Bio Render
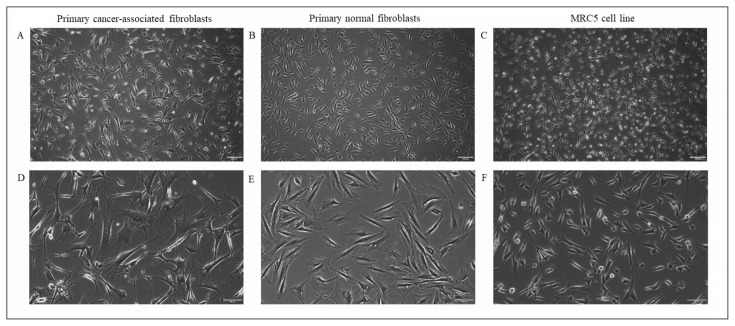
Cancer-associated fibroblasts (CAFs) are a diverse stromal cell population that contributes significantly to solid tumours’ microenvironment. CAFs are the most abundant stromal cell type in different types of cancer, including BC [5]. TME rich in fibroblasts is thought to be an important factor for tumour growth and development of metastatic BC [2]. Neoplastic fibroblasts are characterised by an elongated structure (Fig. 2) and are bigger than normal fibroblasts. They have dark nuclei and branched cytoplasm, often with a fibrous framework [6]. CAFs generate the majority of extracellular components in the TME, including growth hormones, cytokines, and extracellular matrix components. Moreover, this type of fibroblast alters the TME by influencing tumour growth and metastasis, neoangiogenesis, extracellular matrix, and immunosuppression [4]. CAFs can enhance tumour proliferation and treatment resistance by secreting growth factors, inflammatory cytokines, and extracellular matrix proteins. Based on the diverse characteristics of CAFs, some scientists [7] have attempted to identify distinct subtypes of them. This cell population is very diverse and there is no specific classification for their organisation. Neoplastic fibroblasts are often classified based on marker expression and are associated with the subtypes of cancer from which they were extracted [8].
Figure 2.
Fibroblasts of different origin. A culture of primary cancer-associated fibroblasts (A, D) isolated from breast cancer tissue, primary normal fibroblasts isolated from the breast skin (B, E) and established cell line MRC5 (C, F) representing normal fibroblasts. CAFs characterise with elongated, pointy shape with branched, fibrous cytoplasm compared to smaller MRC5 cells with compact cytoplasm. Magnification 4× (A–C), magnification 10× (D–F), Olympus IX83 Inverted Fluorescence Microscope
Primary cell cultures are a significant model to study characteristics of cells obtained from tumours and may serve as a tool for testing therapies or drug responsiveness. Primary cells preserve features of neoplastic cells and the cross-talk between cells of TME. Taking this into account, primary cell cultures have a huge biological value for scientific investigation [9the patient-derived specimen must be subjected to dissociation and isolation. Techniques for tumour dissociation are usually reliant on the organisation of connecting tissue. The most common methods include enzymatic digestion (with collagenase, dispase, and DNase].
The goal of this study was to isolate CAFs from BC tissue and to phenotype isolated cell lines. We concentrated on CAF-specific biomarkers and those that could distinguish different CAF subtypes. The findings of this study will provide information about neoplastic fibroblast cell lines which could be used to generate new BC models implementing CAFs and primary BC cells.
Materials and methods
Patients and tumours
Ten patients with a histological diagnosis of invasive BC (diameter ≤ 15 mm), who qualified for surgical treatment were recruited for the study. The core needle biopsies were collected from consented patients by the surgeon and were placed in a tube with a sterile medium to be delivered to the Radiobiology Department. Ethical approval for the study (number 283/21) was obtained from the Bioethics Committee of Poznan University of Medical Sciences and written consent from all the participants was collected.
Pathological review
The specimens of BC tissue were examined by pathologists to reveal their morphological and immunocytochemical characteristics. A haematoxylin-eosin (H&E) staining was performed to determine the shape and structure of cells, and antibody-coupled staining was used for the analysis of CK7, CK20, mammaglobin, GCDFP15, ER, PR, and HER2.
Cell culture
Cells were cultured in standard conditions at a temperature of 37°C, enriched with 5% CO2 at humidity ~100%. Cells were cultivated in two different culture media, dependent on the stage of growth. Freshly disaggregated cells were cultured in 1:1 DMEM and Ham’s F12, supplemented with 20% fetal bovine serum (FBS), 10 ng/mL epidermal growth factor (EGF), 2 mM L-glutamine, 0.5 μg/mL hydrocortisone, 100 U/mL insulin, 1% penicillin-streptomycin, and 0.5% amphotericin. For maintaining cell culture, after passages 4–5, a DMEM medium with 10% FBS and 1% penicillin/streptomycin was used. Cells were passaged with trypsin-EDTA when reached 80–90% confluency.
Primary cell culture isolation
Samples of human breast tumours were derived from consenting patients during BC biopsy at the Greater Poland Oncology Centre (GPCC). Obtained specimens were minced with a scalpel and digested in a mixture of 0.14 mg/mL of hyaluronidase (Thermo Fisher Scientific, France) with 1.6 mg/mL collagenase IV (Thermo Fisher Scientific, France). After incubation, the suspension was transferred to the tube containing 2 mL PBS. The tissue slurry was centrifuged at room temperature at 700 g for 5 min. The supernatant was removed and the tissue pellet was resuspended in the medium and seeded onto wells.
Cell lines
Ten primary cell lines of CAFs were used for characterisation. For every BC subtype (HER2+, TNBC, ER+, ER/PR+, ER/PR/HER2+), two primary cell lines were chosen. ER+ (CAF69 and CAF92) corresponds to the luminal A subtype, ER/PR+ (CAF48 and CAF68) and ER/PR/HER2+ (CAF61 and CAF83) correlate with the Luminal B subtype. Cell lines CAF27 and CAF126 were associated with HER2+ subtype, CAF44 and CAF127 with triple negative breast cancer (TNBC).
Flow cytometry (FC)
For the cytometric analysis, 200 000 primary CAF cells were used. Cells were centrifuged at 1500 rpm for 5 min and the pellet was resuspended in 400 mL of PBS with 1% bovine serum albumin (BSA) and centrifuged again. For each primary CAF cell line, FC was performed for the following markers: CD90, CD45, CD31, CD24, and CD44. Cells were incubated with 5 μL of each antibody for 30 min in the dark at 4ºC. After incubation, 400 μL of PBS + 1% BSA was added, and cells were centrifuged at 1500 rpm for 5 min. The supernatant was discarded, and the pellet was resuspended in 200 μL of PBS for cytometrical analysis. Flow cytometry was performed on Cytoflex Beckmann Coulter cytometer, and analysis of obtained results was performed in the FlowJo programme.
Immunofluorescence (IF)
For immunofluorescent analysis, 25,000 primary CAF cells were seeded onto the ChamberSlide plate. Cells were preserved in 400 μL of 4% paraformaldehyde in PBS solution and incubated for 20 min at room temperature and permeabilised with 100% methanol at −20ºC for 20 min. Next, the cells were washed with 400 μL PBS + 1% and incubated with 400 μL PBS + 1% BSA + 0.5% Tween at room temperature for 30 min. Then, the cells were incubated for 2h at room temperature with a solution of PBS + 1% BSA + 0.5% Tween with primary antibodies in a ratio of 1:500. A mixture of antibodies against fibroblast activation protein-α (FAP) (produced in rabbit, Sigma-Aldrich® Solutions, MO, United States) and α-smooth muscle actin (α-SMA) (produced in mice, Sigma-Aldrich® Solutions, MO, United States) was prepared for each cell line. After incubation, the cells were washed three times with 400 μL PBS. The secondary antibody was prepared in 250 μL of PBS + 1% BSA solution in a ratio of 1:500 and incubated with the cells for 1 h at 37ºC in the dark. Nuclei were stained with 400 μL of 1:10000 DAPI solution in H2O for 5 min at room temperature, in the dark. Fluorescence was observed under Olympus IX83 Inverted Fluorescence Microscope.
Wound healing assay
Around 20,000 primary cells were seeded onto 24-well plates and once they gained 80% confluency, the line was scratched in the middle of each well using a small pipette tip. The series of pictures was done in the time interval of 0 h, 24 h, 48 h and 72 h to observe the pace of cell migration, and the overgrowth of the scratch. The pictures were taken with the Olympus IX83 Inverted Fluorescence Microscope and an analysis of the results was performed in the ImageJ programme.
Reverse transcription quantitative real-time polymerase chain reaction (RT-qPCR)
RNA of primary CAFs was isolated with Direct-zol RNA MiniPrep (Zymo Research, Irvine, CA, United States). One million cells were suspended in TRI Reagent® (Sigma-Aldrich, St. Louis, MO, United States). After obtaining 1 μg of total RNA, the iScript kit (Bio-Rad, Hercules, CA, United States) was used for reverse transcription, according to the manufacturer’s protocol. The cDNA was amplified in a total volume of 20 μl and diluted 5 times. For the reverse transcription quantitative polymerase chain reaction (RT-qPCR), the iQ SYBR Green Supermix kit was used. The reaction mix was prepared individually for four primers corresponding to FAP, fibroblast-specific protein 1 (FSP-1) (S1004a), α-SMA, (ACTA2) and vimentin (VIM) genes with glyceraldehyde 3-phosphate dehydrogenase (GAPDH) as a reference (Tab. 1). The mix contained 3.5 μL nuclease-free water, 5 μL Sso Advanced Universal Supermix, 0.5 μL primer, and 1 μL template cDNA. The cDNA template was diluted 5 times before the reaction. The reaction mix was incubated in the thermal cycler according to the following protocol (Tab. 2). Relative expression was calculated with the delta-delta Ct (2−ΔΔCt) method.
Table 1.
Forward and reverse sequences of applied primers
| Gene | Forward sequence | Reverse sequence |
|---|---|---|
| FAP | GGAAGTGCCTGTTCCAGCAATG | TGTCTGCCAGTCTTCCCTGAAG |
| αSMA | CTATGCCTCTGGACGCACAACT | CAGATCCAGACGCATGATGGCA |
| FSP-1 | CAGAACTAAAGGAGCTGCTGACC | CTTGGAAGTCCACCTCGTTGTC |
| VIM | AGGCAAAGCAGGAGTCCACTGA | ATCTGGCGTTCCAGGGACTCAT |
| GAPDH | GTCTCCTCTGACTTCAACAGCG | ACCACCCTGTTGCTGTAGCCAA |
FAP — fibroblast activation protein-α; α-SMA — α-smooth muscle actin; FSP1 — fibroblast-specific protein-1; VIM — vimentin; GAPDH — glyceraldehyde 3-phosphate dehydrogenase
Table 2.
A typical 3-step real-time polymerase chain reaction (PCR) protocol
| Cycling step | Temperature | Time [min:sec] | Number of cycles |
|---|---|---|---|
| Initial denaturation | 95°C | 02:00 | 1 |
| Denaturing | 95°C | 00:15 | 40 |
| Annealing | 68°C | 00:30 | |
| Extension | 72°C | 00:30 | |
| Melt curve | 55–95°C (0.5°C increments) | 00:10 | 1 |
Statistical analysis
Statistical analysis was performed for the results of the RT-qPCR and wound healing assay with an ordinary one-way ANOVA Tukey test with multiple comparisons. Results with p > 0.05 were considered statistically insignificant.
Results
Flow cytometry
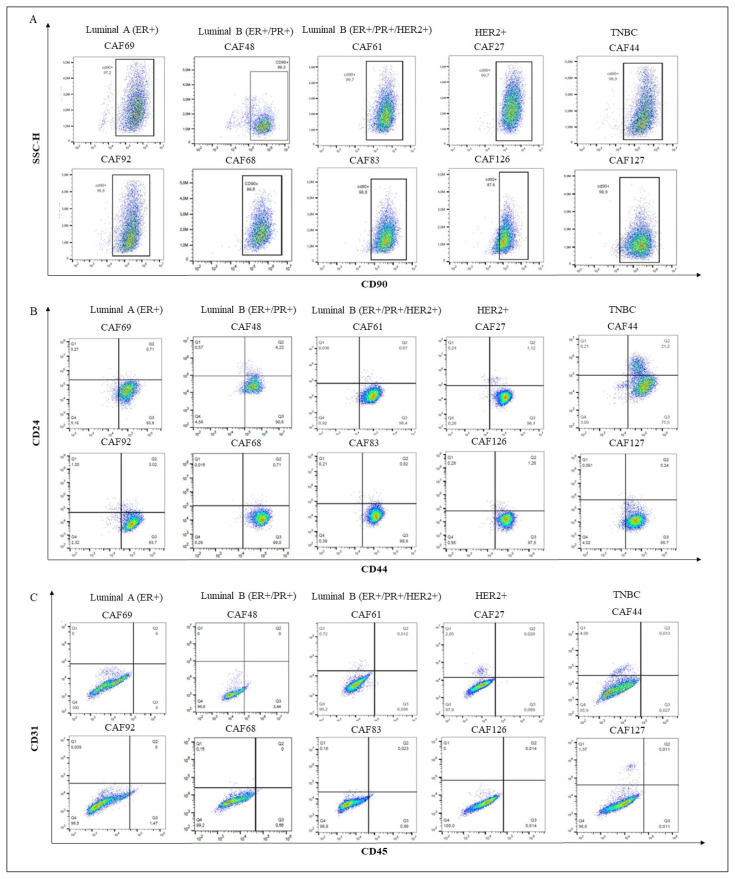
Markers CD31 and CD45 were used to check the presence of endothelial and hematopoietic cells, respectively. Other markers indicated fibroblastic origin (CD90), tumourigenicity and stemness (CD24 and CD44). It was observed that CAFs exhibited different phenotypes between BC subtypes, but also cells among one subtype were heterogeneous. Such an example are cells from the triple negative breast cancer (TNBC) subtype, where CAF44 displayed moderate expression of CD24 and weak expression of CD45, but in CAF127 those markers were negative (Fig. 3). A similar pattern was observed among the ER+ subtype, CAF69 did not express CD24 nor CD45; however, those markers were present in CAF83 (Fig. 3). TNBC cell lines exhibited similar expression of all markers, although in CAF48 there was a small population of cells positive for CD24. HER2+ cells were the only subgroup which was positive for CD24 in both cell lines. Characterised cells demonstrated moderate to high expression of CD44 and CD90, which confirmed that the examined cells are cancer-associated fibroblasts, and can be further studied with IF, RT-qPCR, and wound healing assay.
Figure 3.
Phenotyping of all primary cancer-associated fibroblast (CAF) cell lines. CAFs isolated from breast cancer (BC) patients were distinguished using CD90, CD31, CD45, CD24, and CD44 to confirm their malignant and fibroblast phenotype. A. Plots of cells stained for CD90, a characteristic biomarker of a fibroblasts phenotype; B. Plots of cells stained for CD24 and CD44, biomarkers of epithelial cells, cancer cells, stem cells; C. Plots of cells stained for CD31 and CD45 biomarkers to check the endothelial and leukocyte origin of the cells. ER — estrogen receptor; PR — progesterone receptor; HER2 — human epidermal growth factor receptor 2 receptor; TNBC — triple-negative breast cancer
Immunofluorescence
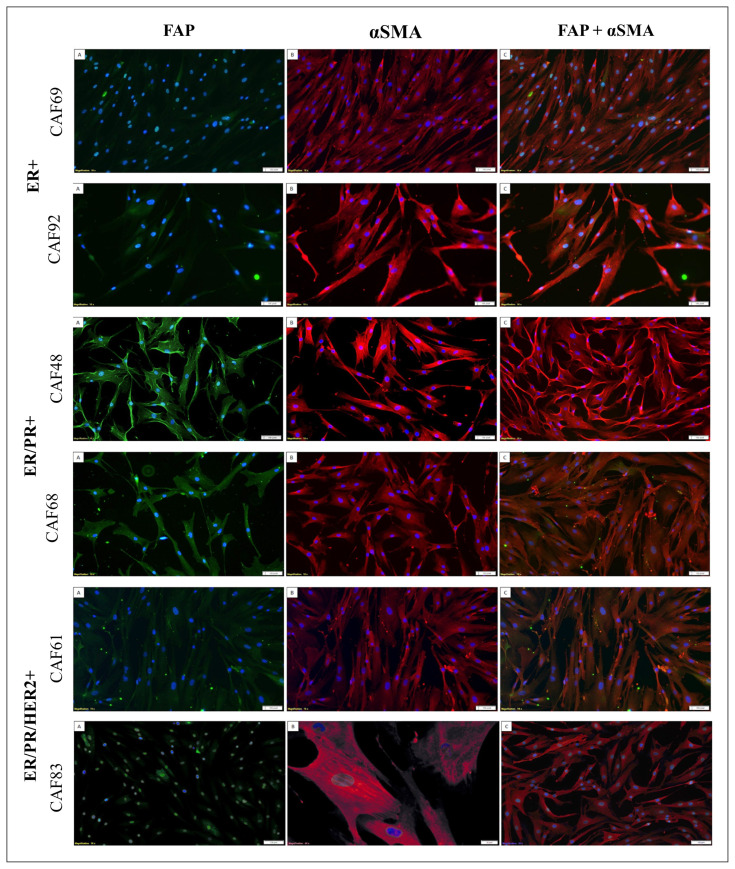
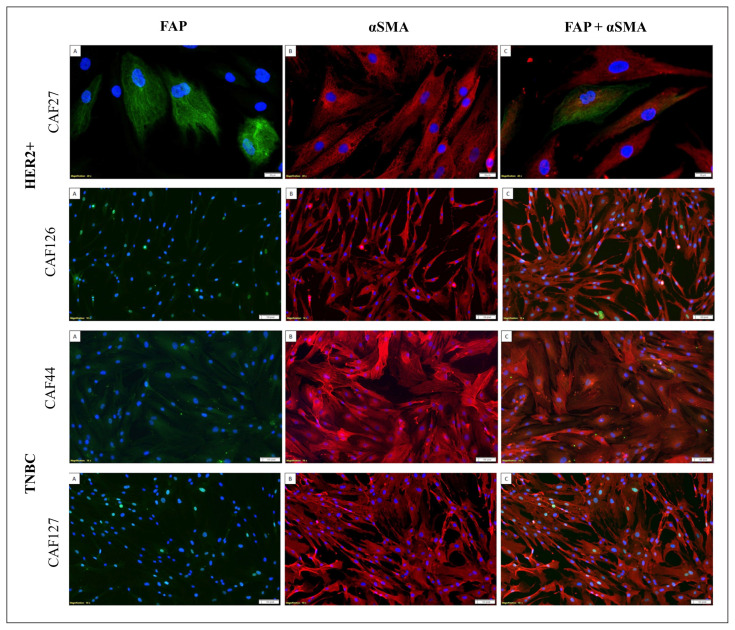
The highest expression of both markers was observed in ER/PR+ CAF cells. CAF48 showed the strongest association with FAP and α-SMA (Fig. 5), together with CAF27 (Fig. 4). However, the weakest expression of those markers was visible in ER/PR/HER2+ cells (Fig. 5). Examined cell lines were negative or weakly positive to FAP, but all of them were moderately or strongly positive to α-SMA. The most significant expression of α-SMA was visible in CAF44 (Fig. 4), CAF 48, and CAF92 (Fig. 5) which generated a bright red signal. The results of IF were further confirmed by RT-qPCR.
Figure 5.
Immunocytochemical staining for fibroblast activation protein-α (FAP) and α-smooth muscle actin (α-SMA) markers executed on the cancer-associated fibroblast (CAF) primary cell lines from the luminal (ER+, ER/PR+ and ER/PR/HER2+) subtype; magnification 10× for CAF83 α-SMA and 4× for remaining cells, Olympus IX83 Inverted Fluorescence Microscope. ER — estrogen receptor; PR — progesterone receptor; HER2 — human epidermal growth factor receptor 2 receptor
Figure 4.
Immunocytochemical staining for fibroblast activation protein-α (FAP) and α-smooth muscle actin (α-SMA) markers executed on the cancer-associated fibroblast (CAF) primary cell lines from the human epidermal growth factor receptor 2+ (HER2+) and triple-negative breast cancer (TNBC) subtype; magnification 4× and 10× in case of CAF27, Olympus IX83 Inverted Fluorescence Microscope
Wound healing assay
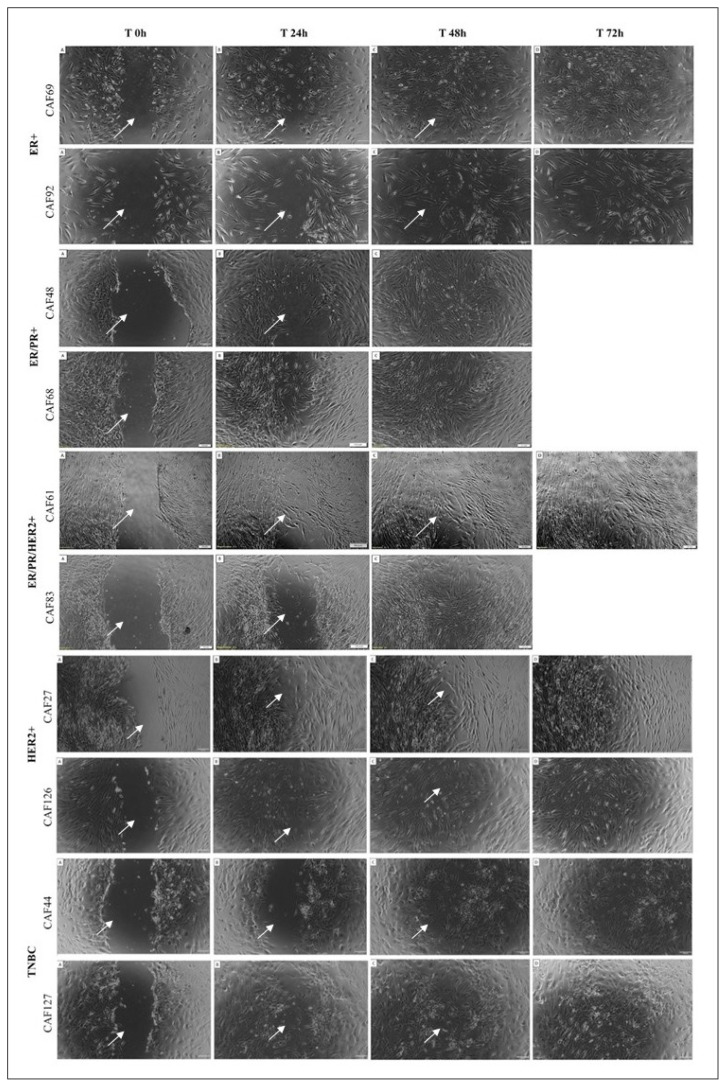
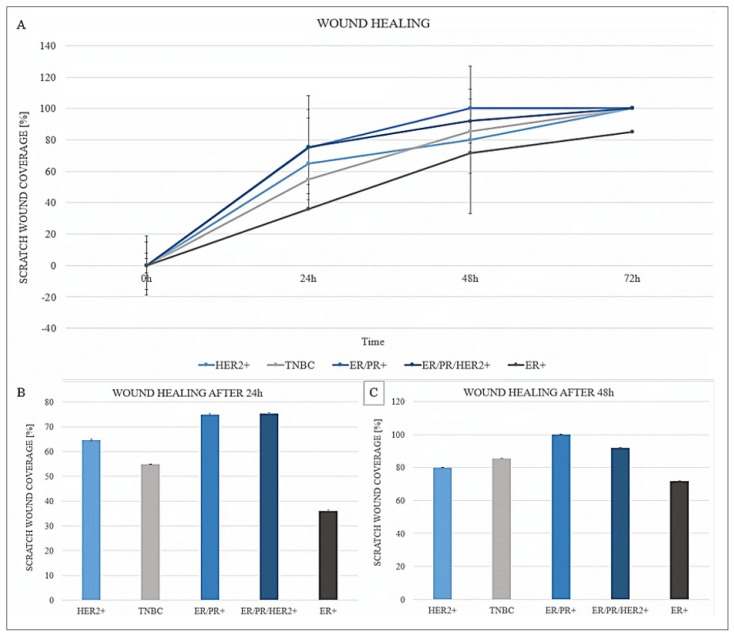
The wound healing procedure enabled the assessment of primary cells’ mobility by capturing the pace of scratch overgrowth. Figure 6 show scratch wound coverage by CAFs isolated from each BC subtype. After 24h, primary cells from subtypes ER/PR+ and ER/PR/HER2+ grew at an equal pace and covered the scratch in 75%, meanwhile, HER2+, TNBC, and ER+ cells covered the scrape in 65%, 55%, and 36%, respectively (Fig. 7b). CAF cells from the ER/PR+ subtype completely covered the scratch in 48h, whilst cells from the subtype ER/PR/HER2+ covered the scratch in 91%, TNBC in 85%, HER2+ in 80%, and ER+ in 72% (Fig. 7C). In the range between 24 and 48h, the growth of the HER2+ cells slowed down, while TNBC cells maintained their rate of growth, thus they enclosed the wound faster. The summary of the scratch overgrowth and the pace of cells’ growth is visualised in Figure 7A. Primary cells from the ER+ subtype never reached 100% wound coverage, due to the manner of growth of CAF92, which stopped after 72 h. The statistical analysis does not indicate any significant (p ≤ 0.05) differences between each of the compared groups.
Figure 6.
Scratch wound coverage during 72h for the cancer-associated fibroblasts (CAFs) derived from breast cancer (BC) tissue of the luminal A and B, human epidermal growth factor receptor 2+ (HER2+) and triple negative breast cancer (TNBC) subtype. Wound scratch is made to assess the pace of scratch overgrowth and is helpful method to determine cells’ mobility. Magnification 4x, Olympus IX83 Inverted Fluorescence Microscope.
Figure 7.
Analysis of the wound healing results. A. The summary of the scratch overgrowth throughout 72 h by primary cancer-associated fibroblasts (CAFs) represented by subtype from each breast cancer (BC) tumour from which CAF cells were derived; B. Wound scratch coverage after 24h for different CAF subtypes; C. Wound scratch coverage after 48 h for different CAF subtypes. Wound scratch coverage is the amount of space overgrown by cells expressed in percentage
RT-qPCR
RT-qPCR was executed to examine the expression of genes characteristic for CAFs — FAP, FSP-1, VIM and α-SMA. Mean relative gene expression of each gene was calculated by combining relative expression from two CAF cell lines per subtype. FAP gene was expressed the strongest in ER/PR+ CAF cells with a mean expression of 3.54. CAFs from other subtypes demonstrated much lighter signals with the expression of 0.89 for HER2+ cells, 0.53 for TNBC, and 0.50 for ER/PR/ HER2+. The CAF cells of the ER+ subtype had the lowest/negative (0.02) FAP expression (Tab. 3). FSP-1 was the most abundant in ER/PR/HER2+ subtype. ER/PR+ and TNBC CAF cells showed moderate expression of FSP-1, 1.41 and 1.04, respectively. In the HER2-positive CAF cells, FSP-1 was expressed at the 0.95 level. The weakest (0.02) expression of the FSP-1 gene was observed in ER+ CAF primary cell lines. Conversely, the expression of VIM in ER+ cells accounted for one of the highest at the level of 1.52 (Tab. 3). TNBC showed 0.71 VIM expression and HER2+ 0.13. The CAF primary cell lines of ER/PR+ subtype were negative for vimentin. Examination of α-SMA demonstrated the highest level of this gene in TNBC CAF cells (2.38) and ER/PR+ CAFs (1.52). This gene was moderately expressed in ER/PR/HER2+ CAFs (0.76) and less intensely in HER2+ (0.29). The weakest, nearly negative α-SMA level was observed in ER+ CAFs (0.06) (Tab. 3). Statistical analysis revealed no significant (p ≤ 0.05) differences between groups.
Table 3.
Reverse transcription quantitative real-time polymerase chain reaction (RT-qPCR) analysis expression of the genes characteristic for primary cancer-associated fibroblasts (CAFs) divided by subtype of breast cancer (BC) tumour from which CAFs were derived. Mean relative gene expression of each gene was calculated by combining relative expression from two CAF cell lines per subtype
| Gene of interest | BC Subtype | Relative mean gene expression |
|---|---|---|
| FAP | HER2+ | 0.89 |
| TNBC | 0.53 | |
| ER/PR+ | 3.54 | |
| ER/PR/HER2+ | 0.50 | |
| ER+ | 0.02 | |
| FSP-1 | HER2+ | 0.95 |
| TNBC | 1.04 | |
| ER/PR+ | 1.41 | |
| ER/PR/HER2+ | 2.07 | |
| ER+ | 0.02 | |
| VIM | HER2+ | 0.13 |
| TNBC | 0.71 | |
| ER/PR+ | 0.00 | |
| ER/PR/HER2+ | 3.24 | |
| ER+ | 1.52 | |
| α-SMA | HER2+ | 0.29 |
| TNBC | 2.38 | |
| ER/PR+ | 1.52 | |
| ER/PR/HER2+ | 0.76 | |
| ER+ | 0.06 |
FAP — fibroblast activation protein-α; FSP1 — fibroblast-specific protein-1; VIM — vimentin; α-SMA — α-smooth muscle actin; ER — estrogen receptor; PR — progesterone receptor; HER2 — human epidermal growth factor receptor 2 receptor; TNBC — triple-negative breast cancer
Discussion
Breast cancer is the most prevalent neoplasm diagnosed in 2020, accounting for 685 million deaths, making it the deadliest malignancy affecting women [10]. Surgery, chemotherapy, radiation, hormone therapy, targeted therapy, and personalised therapy are all available cancer treatment therapies [11]. Primary cell lines are ex-vivo cultures isolated directly from patients’ tissue that can be employed to examine hormone responsiveness and the effect of therapy on tumour cells. As a result, a short-term culture of primary cells from tumours holds enormous promise for personalised cancer therapy [9the patient-derived specimen must be subjected to dissociation and isolation. Techniques for tumour dissociation are usually reliant on the organisation of connecting tissue. The most common methods include enzymatic digestion (with collagenase, dispase, and DNase].
CAFs are a diverse stromal cell type that plays a pivotal role in the microenvironment of solid tumours. The presence and activity of CAFs in the TME are related to a poor prognosis. Furthermore, tumours with elevated stromal signatures are linked to therapeutic resistance and disease recurrence [5]. CAFs have been demonstrated to influence cell migration, invasion, and proliferation by altering the architecture and physical characteristics of the extracellular matrix (ECM) [12]. Despite increased interest in CAFs, they remain poorly understood habitants of TME and their cross-talk with cancer cells or impact on metastasis is being investigated. One of the most challenging tasks is the identification of CAFs biomarkers. Even though several CAF biomarkers have been described, none of them is selective to CAFs. It has been demonstrated that the most often used biomarkers are expressed in the majority of CAF subpopulations [3]. Neoplastic fibroblasts can originate from a wide range of tissues, including prostate, lung, breast, gastric, colorectal, and pancreatic cancer, thus CAFs identification may be constricted [13].
In this study, a set of markers (CD90, CD24, CD44, FAP, α-SMA, FSP-1, VIM) was used to assess the origin of described cells. FC analysis confirmed that every obtained CAF cell line is positive for CD90, which is one of the versatile fibroblast markers [14, 15], therefore it was confirmed that the examined cells are not BC cells. Research by Weigand and colleagues compared different cellular fractions and revealed that cells of epithelial origin are < 95% negative for CD90, compared to fibroblasts [16]. Thus, TNBC CAF cell lines (CAF44 and 127), CAF126 and CAF69 that were partially positive for CD90 could be interbred with cancer cells of non-fibroblastic origin. All tested cell lines are positive for CD44 — a marker associated with tumour origin and CSCs [17]. Moreover, cells with CD44+/CD24low/− phenotype are thought to be more aggressive and exhibit poor clinical outcomes in BC [18].
After the FC assessment, IF was executed to check the presence of FAP and α-SMA. Although those are markers characteristic of CAFs, they can be differently expressed among various CAFs [19], which is noticeable among the tested cell lines of different subtypes. ER/PR+ CAFs exhibit the highest FAP expression, which was further confirmed by RT-qPCR analysis. HER2+ cell lines exhibit moderate positivity to FAP and that is also consistent with RT-qPCR. The rest of the tested variants are weakly positive for FAP, i.e ER/PR/HER2+ CAFs, TNBC CAFs, or negative like ER+ CAFs. FAP was found to be readily expressed in the BC stroma, although its expression has either no association with clinicopathological outcomes or has been linked to extended survival [7]. According to the IF results, every cell line is positive for α-SMA, especially TNBC CAFs that also have the highest α-SMA expression (2.38) as reported by RT-qPCR. There is an inconsistency between IF and RT-qPCR results in the case of ER+ CAFs that are positive for α-SMA staining in IF but express the α-SMA gene very weakly (0.06). This might be a case of mutation in the α-SMA gene since CAFs are highly heterogenous and isolated from individual patients. CAFs positive for α-SMA are named myofibroblasts and are another subgroup of CAFs [20]. A profusion of myofibroblasts in BC is correlated with malignant, recurrent neoplasms [21]. The RT-qPCR analysis assessed the expression of two other genes characteristic of CAFs – FSP-1 and VIM, which belong to mesenchymal markers [20]. FSP-1 and VIM are expressed the most intensely by ER/PR/HER2+ CAF cell lines. ER+ CAF cells show high expression of VIM but barely express FSP-1. Conversely, ER/PR+ CAFs express FSP-1 but are negative to VIM. TNBC and HER2+ CAF cell lines both express FSP-1 moderately; however, HER2+ shows a weaker expression of VIM compared to TNBC CAF cell lines.
The purpose of primary cell line characterisation was to compare the molecular profile of CAFs derived from different tumour subtypes. Statistical analysis did not show any significant differences among those groups and CAFs are often different within one BC subtype. Another approach to the characterisation of CAFs was shown by Costa et al. who elaborated a system for the identification of the CAF subsets based on the expression of CD29, FAP, FSP-1, α-SMA, and PDGFRβ. This system consists of four following subgroups: CAF-S1, CAF-S2, CAF-S3 and CAF-S4. They assessed that most Luminal A tumours (ER+ or ER/PR+) correspond to the CAF-S2 group, HER2+ cells are enriched with CAF-S4 and TNBC cells suit to CAF-S1 or CAF-S4 [7, 22]. Despite differences in applied markers, it was possible to qualify the tested CAFs to the following groups: ER+ CAF-S2 and TNBC cell lines have characteristics of both CAF-S1 and CAF-S4 groups, thus those results are consistent with the authors’ assumption. Moreover, isolated HER2+ CAF cell lines are the closest related to CAF-S3, although they differ in FAP expression. Other results presented by Musielak et al. reveal high heterogeneity of CAFs among the luminal group [8].
The final experiment executed to characterise primary CAFs was a wound-healing assay, which aimed to determine CAFs’ motility and the ability for migration. Pieces of evidence suggest that HER2+ BC is the most motile and prone to metastasis followed by TNBC. Luminal BCs are less aggressive, however, they often metastasise to bones [23the relationship between breast cancer subtype, preferential sites of metastasis, and overall survival is not clear. Methods: A total of 414,528 patients from the National Cancer Database (2010–2013]. According to wound-healing assay results from this paper, the CAF cell lines of ER/PR+ (Luminal A) origin exhibited the highest mobility and covered the scratch in 48h. Then TNBC, HER2+, and ER/PR/HER2+ CAFs covered the scratch in 72h, in contrast to the CAF cells of ER+ origin that could not overgrow the scratch up to this time.
Conclusions
The results are highly heterogenous and, currently, it is impossible to characterise CAFs based on the BC subtype from which they have been isolated. Scientists shall investigate more samples and discover new, universal biomarkers for CAFs that will enable their identification and that will not depend on the BC subtype. Moreover, it is necessary to further understand CAFs’ behaviour and cross-talk with other cells since they might be involved in angiogenesis and metastasis. Investigation in this area can contribute to the development of new CAF-targeted therapy for various carcinomas.
Footnotes
Author’s contribution
OP, MM and WMS were responsible for conceptualisation and writing the manuscript. OP and MM conducted research. BA and MF collected biopsies from patients. IP and WMS provided editorial remarks and checked the manuscript. WMS and JM coordinated funding acquisition. All authors have read and agreed to the published version of the manuscript.
Conflict of interest
The authors declare that the research was conducted in the absence of any commercial or financial relationships that could be construed as a potential conflict of interest.
Funding
This research was funded by the National Science Centre Poland (grant number: 2019/35/B/ NZ7/04342).
References
- 1.Holliday DL, Speirs V. Choosing the right cell line for breast cancer research. Breast Cancer Res. 2011;13(4):215. doi: 10.1186/bcr2889. [DOI] [PMC free article] [PubMed] [Google Scholar]
- 2.Baghban R, Roshangar L, Jahanban-Esfahlan R, et al. Tumor microenvironment complexity and therapeutic implications at a glance. Cell Commun Signal. 2020;18(1):59. doi: 10.1186/s12964-020-0530-4. [DOI] [PMC free article] [PubMed] [Google Scholar]
- 3.Ping Q, Yan R, Cheng X, et al. Cancer-associated fibroblasts: overview, progress, challenges, and directions. Cancer Gene Ther. 2021;28(9):984–999. doi: 10.1038/s41417-021-00318-4. [DOI] [PubMed] [Google Scholar]
- 4.Anderson NM, Simon MC. The tumor microenvironment. Curr Biol. 2020;30(16):R921–R925. doi: 10.1016/j.cub.2020.06.081. [DOI] [PMC free article] [PubMed] [Google Scholar]
- 5.Monteran L, Erez N. The Dark Side of Fibroblasts: Cancer-Associated Fibroblasts as Mediators of Immunosuppression in the Tumor Microenvironment. Front Immunol. 2019;10:1835. doi: 10.3389/fimmu.2019.01835. [DOI] [PMC free article] [PubMed] [Google Scholar]
- 6.Raskov H, Orhan A, Gaggar S, et al. Cancer-Associated Fibroblasts and Tumor-Associated Macrophages in Cancer and Cancer Immunotherapy. Front Oncol. 2021;11:668731. doi: 10.3389/fonc.2021.668731. [DOI] [PMC free article] [PubMed] [Google Scholar]
- 7.Costa A, Kieffer Y, Scholer-Dahirel A, et al. Fibroblast Heterogeneity and Immunosuppressive Environment in Human Breast Cancer. Cancer Cell. 2018;33(3):463–479e10. doi: 10.1016/j.ccell.2018.01.011. [DOI] [PubMed] [Google Scholar]
- 8.Musielak M, Piwocka O, Kulcenty K, et al. Biological heterogeneity of primary cancer-associated fibroblasts determines the breast cancer microenvironment. Am J Cancer Res. 2022;12(9):4411–4427. [PMC free article] [PubMed] [Google Scholar]
- 9.Richter M, Piwocka O, Musielak M, et al. From Donor to the Lab: A Fascinating Journey of Primary Cell Lines. Front Cell Dev Biol. 2021;9:711381. doi: 10.3389/fcell.2021.711381. [DOI] [PMC free article] [PubMed] [Google Scholar]
- 10.Sung H, Ferlay J, Siegel RL, et al. Global Cancer Statistics 2020: GLOBOCAN Estimates of Incidence and Mortality Worldwide for 36 Cancers in 185 Countries. CA Cancer J Clin. 2021;71(3):209–249. doi: 10.3322/caac.21660. [DOI] [PubMed] [Google Scholar]
- 11.Tong CWS, Wu M, Cho WCS, et al. Recent Advances in the Treatment of Breast Cancer. Front Oncol. 2018;8:227. doi: 10.3389/fonc.2018.00227. [DOI] [PMC free article] [PubMed] [Google Scholar]
- 12.Erdogan B, Ao M, White LM, et al. Cancer-associated fibroblasts promote directional cancer cell migration by aligning fibronectin. J Cell Biol. 2017;216(11):3799–3816. doi: 10.1083/jcb.201704053. [DOI] [PMC free article] [PubMed] [Google Scholar]
- 13.Kanzaki R, Pietras K. Heterogeneity of cancer-associated fibroblasts: Opportunities for precision medicine. Cancer Sci. 2020;111(8):2708–2717. doi: 10.1111/cas.14537. [DOI] [PMC free article] [PubMed] [Google Scholar]
- 14.Patel AK, Singh S. Cancer associated fibroblasts: phenotypic and functional heterogeneity. Front Biosci (Landmark Ed) 2020;25(5):961–978. doi: 10.2741/4843. [DOI] [PubMed] [Google Scholar]
- 15.Sauzay C, Voutetakis K, Chatziioannou A, et al. CD90/Thy-1, a Cancer-Associated Cell Surface Signaling Molecule. Front Cell Dev Biol. 2019;7:66. doi: 10.3389/fcell.2019.00066. [DOI] [PMC free article] [PubMed] [Google Scholar]
- 16.Weigand A, Boos AM, Tasbihi K, et al. Selective isolation and characterization of primary cells from normal breast and tumors reveal plasticity of adipose derived stem cells. Breast Cancer Res. 2016;18(1):32. doi: 10.1186/s13058-016-0688-2. [DOI] [PMC free article] [PubMed] [Google Scholar]
- 17.Xu H, Niu M, Yuan X, et al. CD44 as a tumor biomarker and therapeutic target. Exp Hematol Oncol. 2020;9(1):36. doi: 10.1186/s40164-020-00192-0. [DOI] [PMC free article] [PubMed] [Google Scholar]
- 18.Camerlingo R, Ferraro GA, De Francesco F, et al. The role of CD44+/CD24-/low biomarker for screening, diagnosis and monitoring of breast cancer. Oncol Rep. 2014;31(3):1127–1132. doi: 10.3892/or.2013.2943. [DOI] [PubMed] [Google Scholar]
- 19.Zeltz C, Primac I, Erusappan P, et al. Cancer-associated fibroblasts in desmoplastic tumors: emerging role of integrins. Semin Cancer Biol. 2020;62:166–181. doi: 10.1016/j.semcancer.2019.08.004. [DOI] [PubMed] [Google Scholar]
- 20.Ishii G, Ochiai A, Neri S. Phenotypic and functional heterogeneity of cancer-associated fibroblast within the tumor microenvironment. Adv Drug Deliv Rev. 2016;99(Pt B):186–196. doi: 10.1016/j.addr.2015.07.007. [DOI] [PubMed] [Google Scholar]
- 21.Toullec A, Gerald D, Despouy G, et al. Oxidative stress promotes myofibroblast differentiation and tumour spreading. EMBO Mol Med. 2010;2(6):211–230. doi: 10.1002/emmm.201000073. [DOI] [PMC free article] [PubMed] [Google Scholar]
- 22.Pelon F, Bourachot B, Kieffer Y, et al. Cancer-associated fibroblast heterogeneity in axillary lymph nodes drives metastases in breast cancer through complementary mechanisms. Nat Commun. 2020;11(1):404. doi: 10.1038/s41467-019-14134-w. [DOI] [PMC free article] [PubMed] [Google Scholar]
- 23.Guo Yi, Arciero CA, Jiang R, et al. Different Breast Cancer Subtypes Show Different Metastatic Patterns: A Study from A Large Public Database. Asian Pac J Cancer Prev. 2020;21(12):3587–3593. doi: 10.31557/APJCP.2020.21.12.3587. [DOI] [PMC free article] [PubMed] [Google Scholar]


