Abstract
Non-enveloped viruses require cell lysis to release new virions from infected cells, suggesting that these viruses require mechanisms to induce cell death. Noroviruses are one such group of viruses, but there is no known mechanism that causes norovirus infection-triggered cell death and lysis1–3. Here we identify a molecular mechanism of norovirus-induced cell death. We found that the norovirus-encoded NS3 contains an N-terminal four-helix bundle domain homologous to the membrane-disruption domain of the pseudokinase mixed lineage kinase domain-like (MLKL). NS3 has a mitochondrial localization signal and thus induces cell death by targeting mitochondria. Full-length NS3 and an N-terminal fragment of the protein bound the mitochondrial membrane lipid cardiolipin, permeabilized the mitochondrial membrane and induced mitochondrial dysfunction. Both the N-terminal region and the mitochondrial localization motif of NS3 were essential for cell death, viral egress from cells and viral replication in mice. These findings suggest that noroviruses have acquired a host MLKL-like pore-forming domain to facilitate viral egress by inducing mitochondrial dysfunction.
Viruses mimic host factors to gain a selective advantage over the host and subvert host defence strategies4. Because programmed cell death is a critical host defence strategy against viral infection, many viruses have evolved strategies to evade or block programmed cell death5,6. Conversely, some viruses require cellular lysis as the final step of virus replication, suggesting that viruses may have also evolved mechanisms to induce cell death.
Noroviruses are small, positive-sense, single-stranded RNA viruses of the family Caliciviridae1–3. Human and mouse norovirus genomes7 are organized into 3 or 4 open reading frames, respectively, ranging in size from 7.3 to 7.5 kb. As non-enveloped viruses, noroviruses are classically thought to egress from infected cells by cellular lysis8–10, with some reports of exosomal release of virus in vitro and in vivo11. However, the requirement for particular cell death pathways is ill-defined and whether the induction of cell death is required for newly assembled viruses to egress from the host cell remains unclear.
NINJ1 is required for MNoV egress
Ninjurin-1 (NINJ1) is required for end-stage lysis of the plasma membrane in response to pyroptotic, necrotic and apoptotic cell death12. To investigate whether NINJ1 is also involved in norovirus-induced cytotoxicity and viral egress, we infected wild-type and Ninj1−/− cells of the BV2 mouse microglial cell line with acute and persistent strains of murine norovirus (MNoV)—CW3 and CR6, respectively. After infection, Ninj1−/− cells swelled, developing bubble-like herniations, and retained this balloon morphology even 48 h after infection (Fig. 1a). Consistent with previous data12, the absence of NINJ1 did not prevent virus-triggered cell death, as measured by ATP levels (Fig. 1b). However, NINJ1 deficiency inhibited the release of lactate dehydrogenase (LDH) in response to norovirus infection, indicating that the plasma membrane remained intact (Fig. 1c). To determine whether plasma membrane rupture was required for efficient virus release, we measured the virus titre in the supernatant of infected cells 12 and 24 h after virus infection. There was a marked decrease in virus detected in the supernatant of Ninj1−/− cells compared with wild-type cells, even though wild-type and knockout cells produced equivalent amounts of intracellular virus (Fig. 1d). Together, these data suggest that NINJ1 mediates plasma membrane rupture during norovirus infection and regulates virus egress from infected cells.
Fig. 1 |. Norovirus egress requires NINJ1-mediated plasma membrane rupture.
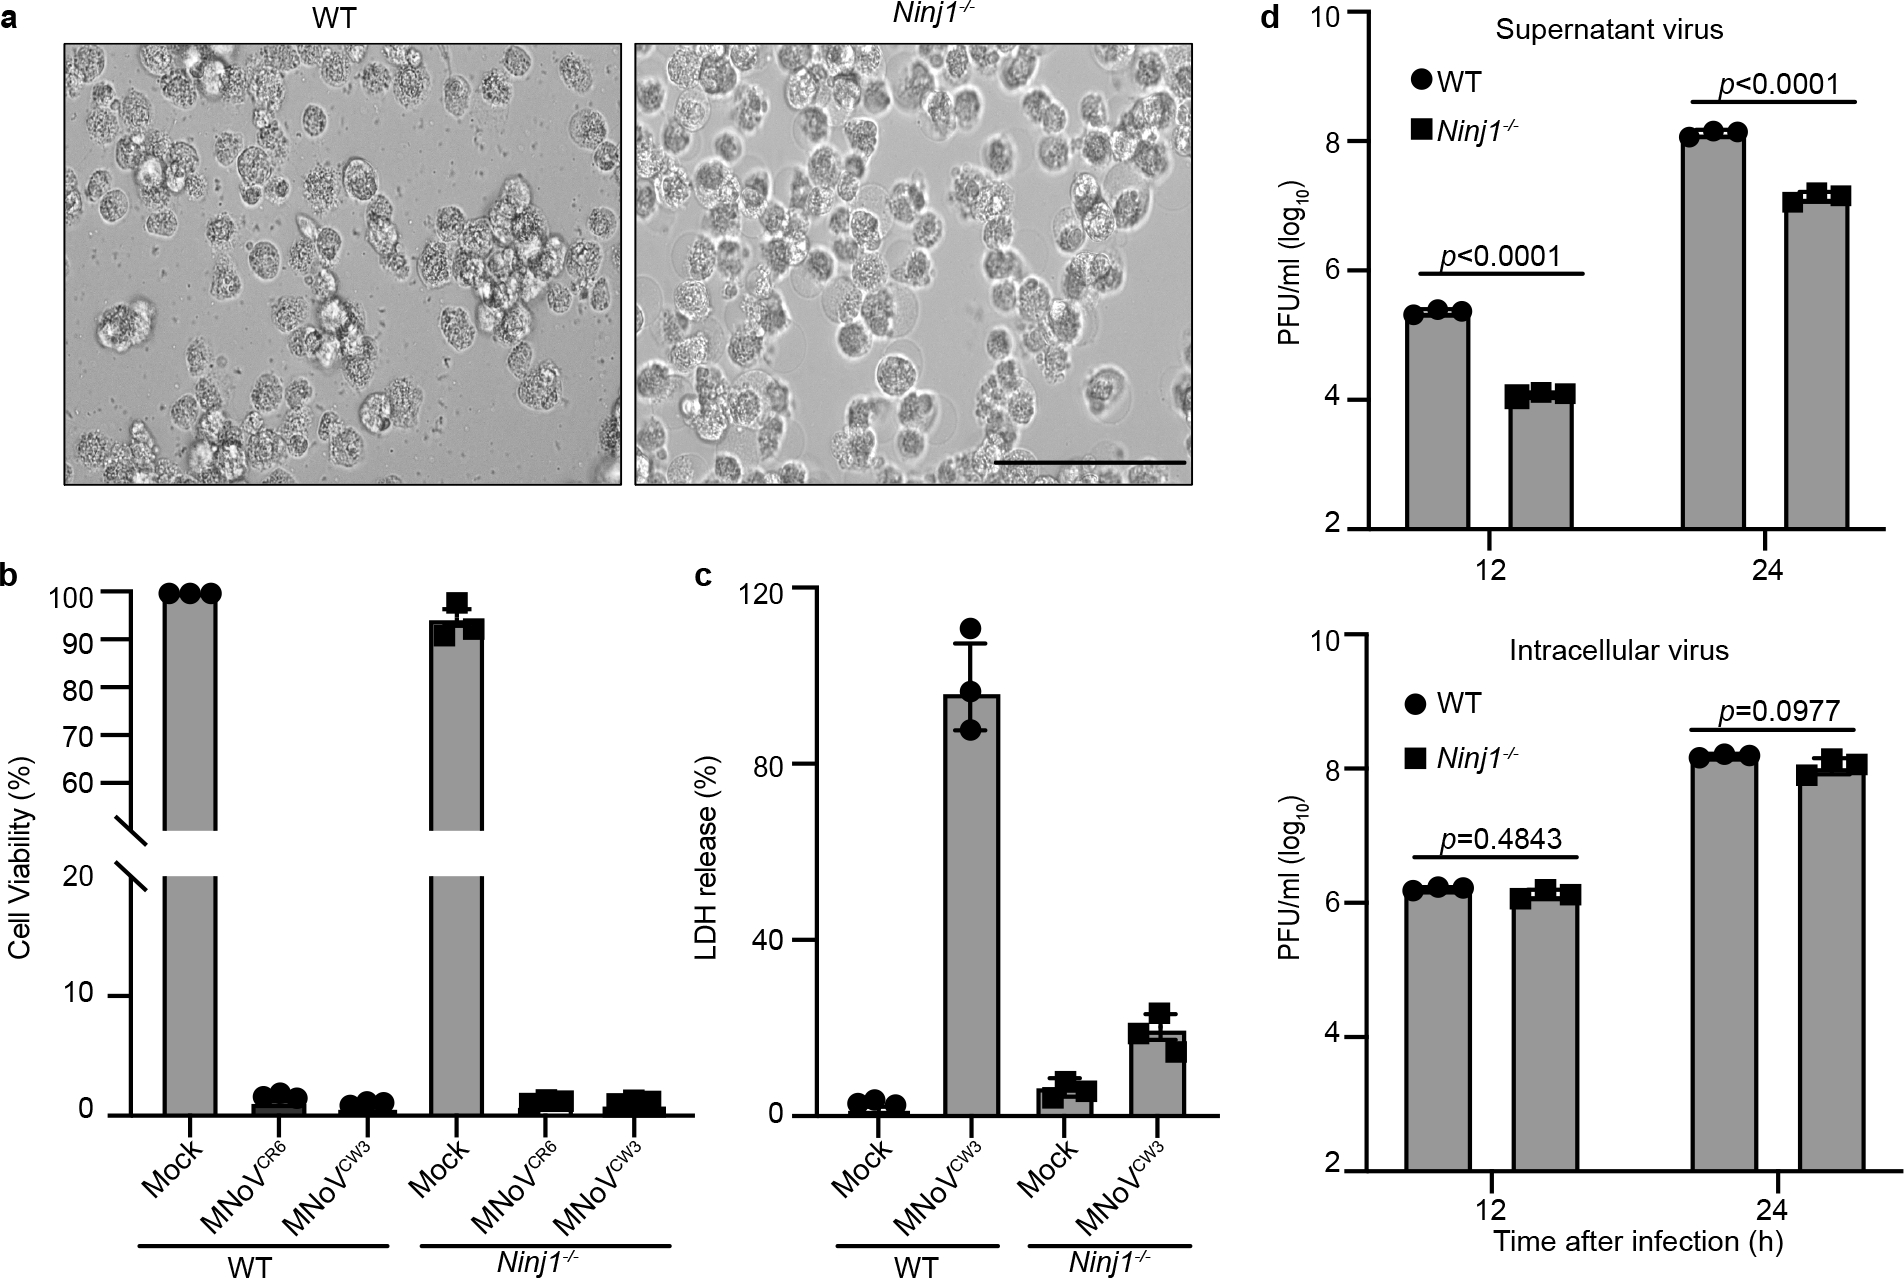
a, Representative bright-field images of wild-type (WT) and Ninj1−/−BV2 cells infected with MNoV CR6 at a multiplicity of infection (MOI) of 5 for 48 h. Images representative of three independent experiments. Scale bar, 100 μm. b, Viability of wild-type and Ninj1−/− BV2 cells infected with MNoV CW3 and CR6 at a MOI of 5 for 24 h. c, LDH release from wild-type and Ninj1−/− BV2 cells infected with CW3 at a MOI of 5 for 12 h. d, Wild-type and Ninj1−/− BV2 cells were infected with CR6 at a MOI of 1 and supernatant and cell-associated (intracellular) virus was measured by plaque assay at the indicated times. Data in b–d are pooled from three independent experiments with three technical replicates per experiment. Data are mean ± s.d. Two-way ANOVA followed by Tukey’s multiple comparison test. P values are shown at the top of the graphs.
Because NINJ1 is downstream of pyroptotic, necrotic and apoptotic cell death pathways, we next tested whether these cell death pathways are required for norovirus-induced cell lysis. To characterize the cytotoxicity of noroviruses infection, we infected either bone marrow-derived macrophages (BMDMs) or BV2 cells with MNoV CW3 or CR6, because noroviruses infect macrophages in vivo13. We observed a marked decrease in the viability of both cell types and detected LDH release into the culture medium 24 h after infection (Extended Data Fig. 1a,b,d,e). Infected cells swelled and stained positive for annexin V and propidium iodide at a late time point after infection (Extended Data Fig. 1c). To determine whether necroptosis, pyroptosis and/or apoptosis were required for the virus-induced cell death, we added the necroptosis inhibitor necrostatin-1 and the pan-caspase inhibitor z-VAD during MNoV infection to block programmed cell death14,15. None of these treatments, either individually or in combination, were able to block norovirus-induced cell death (Extended Data Fig. 2). These data suggest that key effectors of necroptosis, pyroptosis and apoptosis are not required for MNoV-induced cell death.
Taking a genetic approach, we assessed cell death in a variety of genetic knockout cells. To evaluate pyroptosis, we infected macrophages isolated from Casp1- and Casp4-deficient mice and BV2 cells deficient in Gsdmd with MNoV. We observed similar decreases in cell viability of infected wild-type and knockout cells, even in the presence of necroptosis inhibitors, indicating that pyroptosis-induced cell death is dispensable for virus-induced cell death (Extended Data Fig. 3a–d). To assess necroptosis, we infected BMDMs with MNoV CW3 and CR6 and measured MLKL phosphorylation, a hallmark of necroptotic signalling16. Neither MNoV strain induced phosphorylation of MLKL (Extended Data Fig. 3e). Furthermore, macrophages from Ripk3-deficient mice or BV2 cells deficient in Mlkl, exhibited similar decreases in cell viability after MNoV infection (Extended Data Fig. 3f–h). zVAD treatment of Mlkl-deficient cells did not rescue cell death, suggesting that necroptosis is also dispensable (Extended Data Fig. 3h). To evaluate apoptosis, we generated Bax/Bak double-knockout, Casp9/Gsdmd double-knockout and Casp3/Gsdmd double-knockout BV2 cells and measured their viability after MNoV infection. All three knockout lines exhibited cell death equivalent to the wild-type cells after MNoV infection (Extended Data Fig. 3i–l). Finally, we determined that Ern1 (also known as Ire1a)—a master mediator of the endoplasmic reticulum stress response—was not required for MNoV-induced cell death. Moreover, MNoV infection did not increase the amount of CHOP and ATF4 proteins, consistent with the idea that MNoV infection did not induce endoplasmic reticulum stress-mediated apoptosis (Extended Data Fig. 3m,n). These data indicate that MNoV-induced cell death does not require host mediators of pyroptosis, necroptosis or apoptosis.
Notably, we observed cleavage of caspase-3 and GSDMD in infected cells8–10 (Extended Data Fig. 4g). Although neither Casp3 nor Gsdmd were required for norovirus-induced cell death, these data indicate that MNoV infection initiates programmed cell death, which may trigger secondary necrosis. We next investigated whether norovirus-encoded protein could directly induce cell death.
Norovirus NS3 NTPase triggers cell death
To determine whether viral proteins directly trigger cell death, we ectopically expressed individual MNoV genes in human embryonic kidney (HEK) 293T cells. Expression of the NTPase NS3, but not other viral gene products, decreased cell viability, as indicated by ATP levels (Fig. 2a). NS3 from both CR6 and CW3 MNoV strains induced cell death and LDH release (Fig. 2b and Extended Data Fig. 4b–f).
Fig. 2 |. The N-terminal domain of norovirus NS3 directly triggers programmed cell death and has homology to the MLKL four-helix bundle domain.
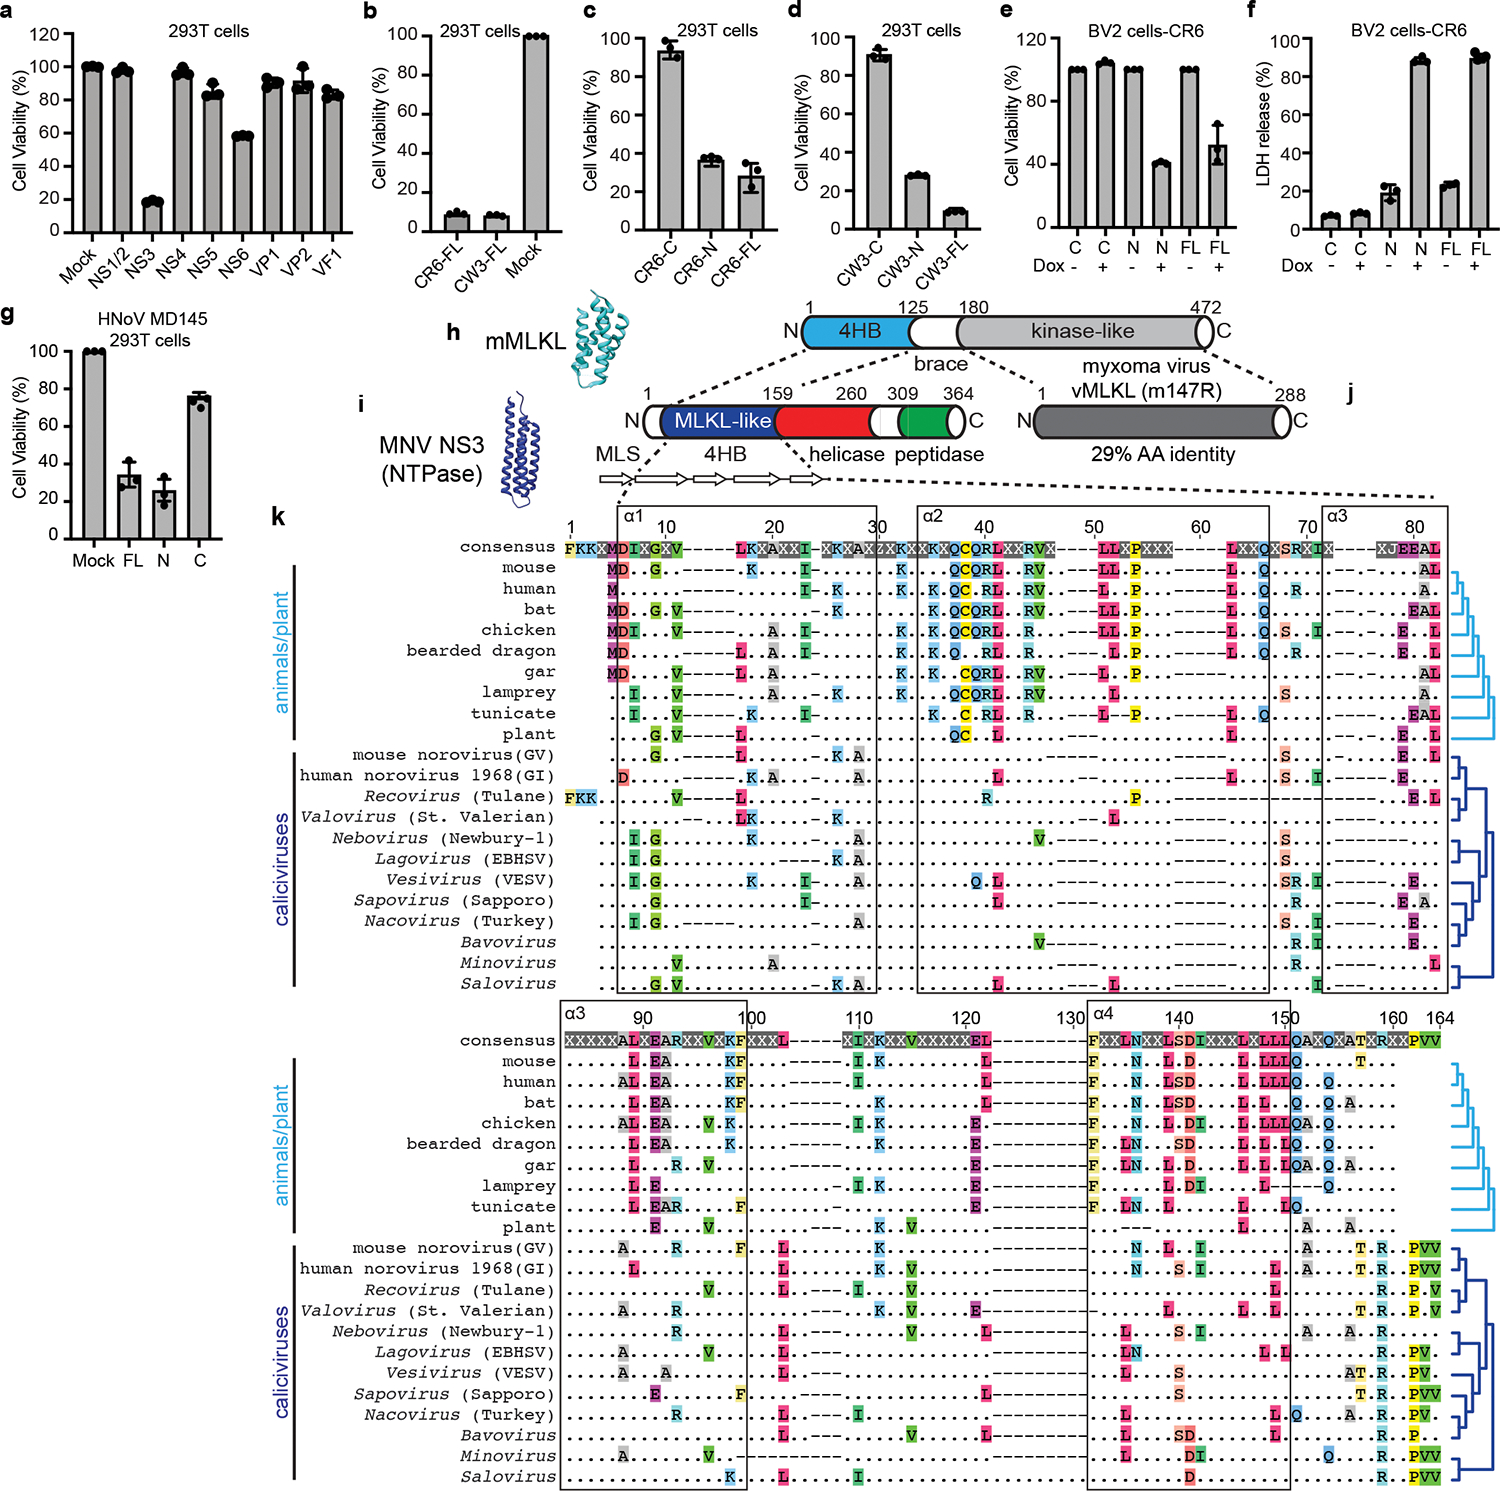
a, MNoV CR6 genes were individually transfected into HEK 293T cells. Cell death was determined by ATP-based cell viability assay 18 h after transfection. b, Cell death was determined by ATP-based cell viability assay 18 h after transfection of full-length CW3 NS3 (CW3-FL) or CR6 NS3 (CR6-FL) with an N-terminal Flag tag. c,d, N-terminally Flag-tagged constructs of CR6 (c) and CW3 (d) NS3-FL, NS3-N or NS3-C were transfected into HEK 293T cells. Cell death was determined by ATP-based cell viability assay 18 h after transfection. e,f, NS3-FL, NS3-N or NS3-C with a C-terminal Flag tag was stably expressed in BV2 cells under a tetracycline-inducible promoter. Transgene expression was induced with doxycycline. ATP-based cell viability (e) and LDH release (f) were analysed after 12 h of doxycycline induction. g, Full-length or N- or C-terminal constructs of HNoV MD145 NS3 were transfected into HEK 293T cells. Cell death was determined by ATP-based cell viability assay 18 h after transfection. Data in a–g are pooled from three independent experiments with three technical by ATP-based cell viability assay 18 h after transfection. Data in a–g are pooled from three independent experiments with three technical replicates per experiment. Data are mean ± s.d. h, Model (Protein Data Bank accession code 4BTF) and schematic of mouse MLKL, showing the 4HB domain26. i, Model of MNoV NS3 and schematic, showing the N-terminal 4HB (MLKL-like) domain. Bottom, α-helices are shown as white, right-facing arrows. Helicase and peptidase domain annotations are based on NCBI conserved domains. MLS, putative mitochondrial localization signal. j, Poxviruses encode an MLKL mimic (vMLKL) derived from the kinase-like domain37,38, such as the myxoma virus gene m147R. k, Amino acid sequence alignment for 4HB domains generated using MUSCLE with representative sequences from animals (8 species), plants41 (AtMLKL3) and caliciviruses (12 species). Helix boundaries are derived from the predicted structure of mouse MLKL. The top row shows the consensus sequence. Conserved amino acid residues are individually coloured. X and dots indicate hypervariable sites. Cladograms (light and dark blue; right margin) display known host and viral species relationships. GI, genogroup I; GV, genogroup V; EBHSV, European brown hare syndrome virus; VESV, vesicular exanthema of swine virus.
Norovirus NS3 is a highly conserved nonstructural protein with NTPase activity, which is essential for viral genome synthesis. Norovirus NS3 may also promote apoptosis in transfected cells17,18. NS3 comprises three domains19,20: the N-terminal domain (NTD) (amino acids 1–158), the core domain (amino acids 158–289) and the C-terminal domain (CTD) (amino acids 290–364). The core domain and the C-terminal domain, hereafter referred to collectively as NS3-C, contain the evolutionarily conserved viral helicase and peptidase, which is required for viral genome replication19–21 (Extended Data Fig. 4a). However, similar to proteins from many other small RNA viruses, norovirus proteins often perform multiple functions in the replicative cycle6,22,23. The N-terminal domain (NS3-N) has no known function in the viral life cycle.
We examined which domain of NS3 from different MNoV strains induced cell death in HEK 293T cells and in other cell types. We overexpressed N-terminal Flag-tagged full-length, N-terminal and C-terminal NS3 from MNoV CR6 and CW3 transiently in HEK 293T cells (Fig. 2c,d) or stably in BV2 cells under the control of a tetracycline-inducible promoter, with a C-terminal Flag tag (Fig. 2e,f). The N-terminal domain and full-length NS3, but not the C-terminal domain, induced cell death in both cell types (Fig. 2c–f and Extended Data Fig. 5a–e). When we overexpressed the full-length CR6 NS3 (NS3-FL), NS3-N and NS3-C in A20 B cells and HeLa cells, we observed that NS3-FL and NS3-N induced cell death, further demonstrating that NS3 elicited cell death in multiple cell types, including B cells that were also infected with MNoV24 (Extended Data Fig. 5f,g). These results indicate that the N-terminal domain of NS3 is sufficient to induce cell death regardless the position of the Flag tag. Moreover, the C-terminal domain, which contains the viral helicase and peptidase functions, is not required for cell death. Thus, the N-terminal domain of NS3 induced cell death in multiple cell types, including macrophages and B cells.
To gain insights into this NS3-associated cell death activity, we performed protein modelling and detailed sequence analysis. Previous protein modelling studies suggested that the N terminus of MNoV NS3 may encode a four-helix bundle (4HB) domain19. Given that MLKL, the executioner of necroptosis, also harbours a 4HB domain25,26, we hypothesized that the N terminus of MNoV NS3 may encode an MLKL-like protein. We predicted the secondary structure for residues 1–158 of MNoV NS3, because NCBI conserved domain database predicts that the RNA helicase starts at residue 159. JPred4 predicted that residues 1–158 included 5 α-helices (Fig. 2i). To determine whether the MNoV NS3 N-terminal domain resembles the 4HB domain of mouse MLKL, we performed protein modelling for NS3 residues 25–158 based on the structure of the mouse MLKL protein (PDB: 4BTF) (Fig. 2h). NS3 residues 1–24 were excluded, as this sequence comprises the predicted mitochondrial targeting sequence residing in the first putative α-helix (Extended Data Fig. 6a,b, discussed further below). We compared previous modelling of the N terminus of MNoV NS319 with AlphaFold prediction and observed similar tertiary structure with AlphaFold (Extended Data Fig. 6c). To further understand the relationship between the 4HB domain of cellular MLKL proteins and NS3, we analysed 34 divergent cellular MLKL sequences from animals and plants with 31 calicivirus sequences across known viral genera, including representatives from established norovirus genogroups (Supplementary Tables 1–3). This analysis (Fig. 2k and Extended Data Figs. 7 and 8) revealed residual sequence identity, which overlaps with the α-helices, between the cellular and viral 4HB domains even for the most divergent caliciviruses, such as saloviruses. These data suggest that the N-terminus of caliciviruses NS3 encodes a MLKL-like protein domain.
Even among the caliciviruses the sequence identity of the 4HB domain is relatively low. We therefore examined whether the NS3 from the human norovirus (HNoV) strain MD145 also triggered cell death. Similar to MNoV NS3, HNoV NS3 induced cell death in 293T cells overexpressing the full-length MD145 NS3 or the N-terminal fragment of MD145 NS3, but not the C-terminal fragment27 (Fig. 2g and Extended Data Fig. 5h–j). These results indicate that the N-terminal domain of the HNoV NS3 also directly triggers programmed cell death.
NS3 disrupts mitochondria
Given that MLKL localizes to the plasma membrane15,25, we examined the localization of NS3-N. DeepLoc analysis, which predicts subcellular localization for multiple compartments, indicated that MNoV NS3 may have a mitochondrial localization signal at its immediate N terminus28 (Extended Data Fig. 6a,b). We visualized the subcellular distribution of NS3 by immunofluorescence microscopy. Whereas NS3-C was diffuse throughout the cytosol, NS3-FL and NS3-N colocalized with the mitochondrial marker cytochrome c oxidase polypeptide IV (COX4) (Fig. 3a and Extended Data Fig. 9a). In contrast to MLKL, neither NS3-FL nor NS3-N colocalized with the plasma membrane marker Cell Mask Orange, suggesting that NS3-FL and NS3-N may target mitochondria rather than the plasma membrane to execute cell death25 (Extended Data Fig. 9b). To further determine subcellular localization, we fractionated the post-nuclear supernatant of doxycycline-induced cell lines expressing NS3-FL, NS3-N and NS3-C. Whereas NS3-C was detected only in the cytosolic fraction, NS3-FL and NS3-N were enriched in the mitochondrial fraction (Fig. 3b). Accordingly, cells expressing mutant forms of NS3-FL and NS3-N lacking the mitochondria localization motif displayed no cytotoxicity (Fig. 3c).
Fig. 3 |. Norovirus NS3 permeabilizes the mitochondrial membrane and induces mitochondrial disfunction.
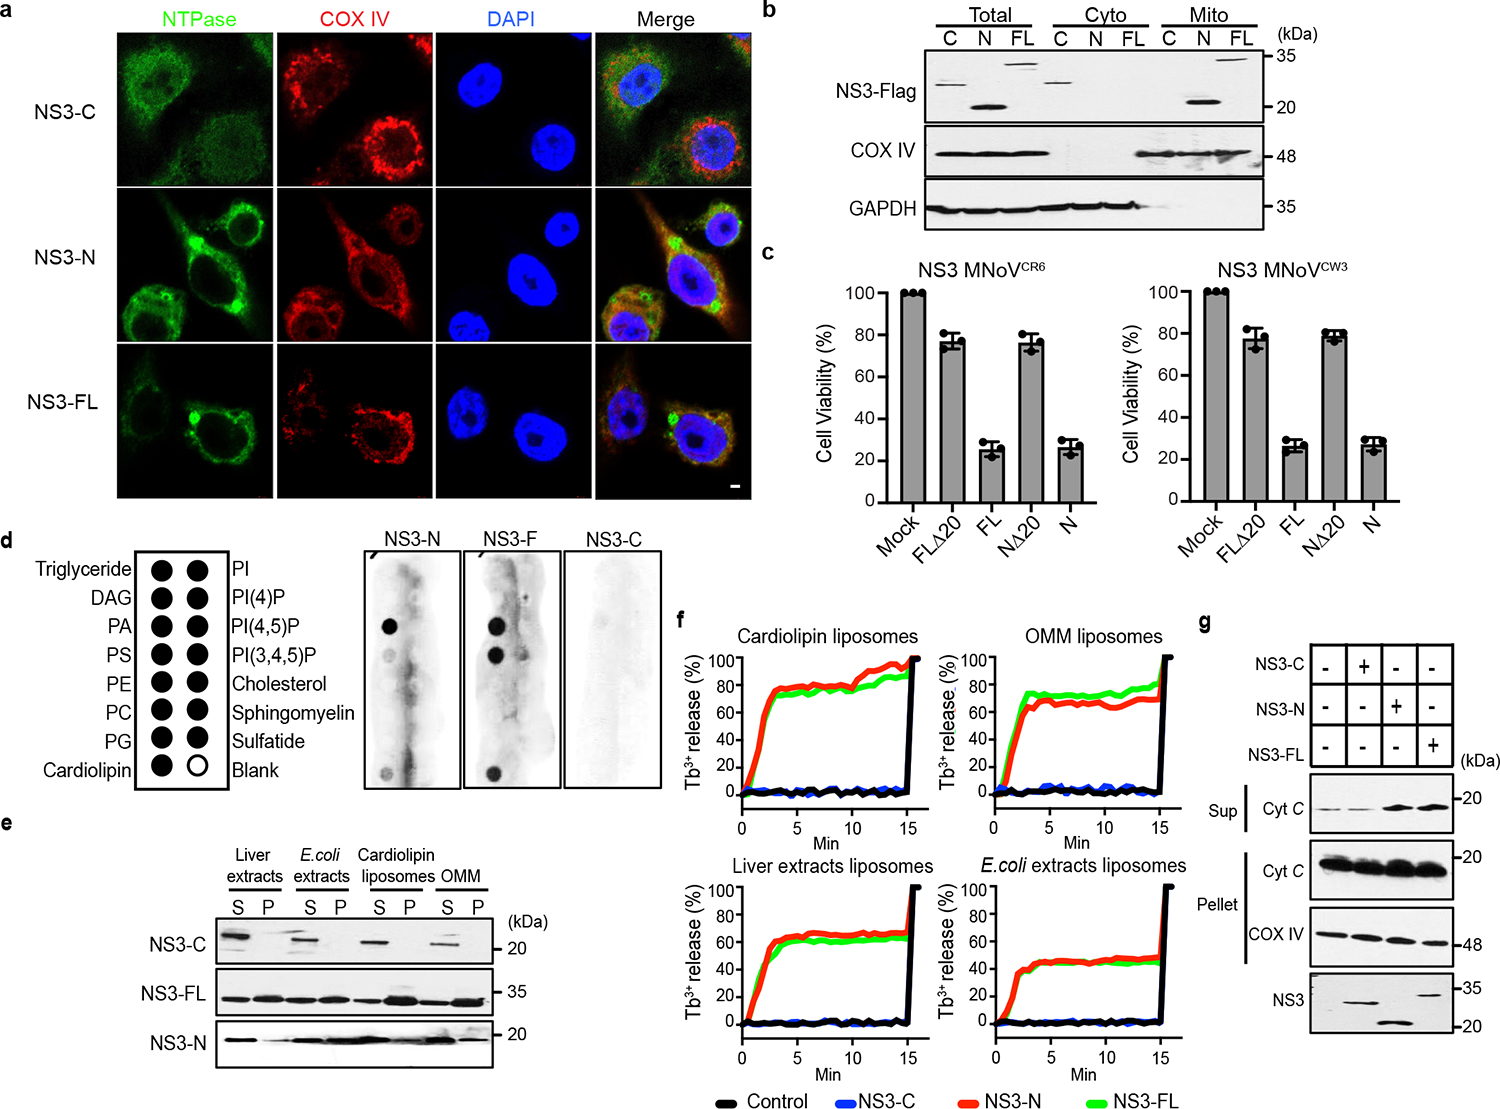
a, Representative confocal imaging of 293T cells after transfection with C-terminal Flag-tagged NS3-FL, NS3-N or NS3-C. COX IV, cytochrome c oxidase IV. Scale bar, 2 μm. b, C-terminal Flag-tagged constructs encoding NS3-FL, NS3-N or NS3-C were stably expressed in BV2 cells under a tetracycline-inducible promoter. Cells were separated into cytosol and mitochondrial fractions after doxycycline induction and analysed by immunoblotting with indicated antibodies. c, Flag-tagged NS3-FL, NS3-N, NS3 lacking the predicted mitochondrial localization signal (FLΔ20) or NS3-N lacking the predicted mitochondrial localization signal (NΔ20) from CR6 and CW3 were transfected into HEK 293T cells. Cell viability was determined by ATP assay 18 h after transfection. d, Purified NS3-FL, NS3-N or NS3-C was incubated with lipid strips. Right, anti-MBP antibodies were used to detect the NS3 proteins. Left, identity of lipids on the strips. PtdIns, phospohatidylinositol. e, Purified NS3-FL, NS3-N or NS3-C was incubated with liposomes of indicated composition. After ultracentrifugation, the liposome-free supernatant (S) and the liposome pellet (P) were analysed by immunoblotting. f, Purified NS3-FL, NS3-N or NS3-C was incubated with liposomes of indicated composition. Liposome leakage was monitored by measuring dipicolinic acid (DPA) chelating-induced fluorescence of released Tb3+ relative to Triton X-100 treatment. Liposome composition: cardiolipin, 80% phosphatidylcholine:20% cardiolipin; OMM, 46% phosphatidylcholine:phosphatidylethanolamine:11% PtdIns:10% phosphatidylserine:7% cardiolipin. g, Cytochrome c (cyt c) release into the reaction supernatant (sup) from purified mitochondria incubated with purified NS3 proteins. Data are representative of three (b,d–g) or two (a) independent experiments. Data in c are pooled from three independent experiments with three technical replicates per experiment. Data are mean ± s.d.
Given that NS3-FL and NS3-N localize to mitochondria, we next examined whether NS3 altered mitochondrial membrane potential. To determine whether NS3 depolarized mitochondria, cells expressing inducible NS3 constructs were stained with the cell-permeable dye tetra-methylrhodamine methyl ester (TMRM), which is sequestered by active mitochondria. Upon loss of mitochondrial membrane potential, TMRM fluorescence decreases. Induction of NS3-FL or NS3-N expression—but not NS3-C expression—led to depolarization of mitochondria, as evidenced by reduced TMRM staining and further confirmed by co-staining with MitoTracker Green and MitoTracker Deep Red (Extended Data Fig. 9c,d). Next, cells were incubated with MitoSOX after doxycycline induction of NS3 transgene expression to detect mitochondrial reactive oxygen species (ROS). NS3-FL and NS3-N, but not NS3-C expression, increased mitochondrial ROS abundance (Extended Data Fig. 9e). MNoV infection also increased mitochondria ROS and impaired mitochondrial membrane potential (Extended Data Fig. 9f,g). Thus, the N terminus of NS3 promotes mitochondrial dysfunction and depolarization. Consistent with this notion, induction of NS3-FL and NS3-N expression also triggered cleavage of caspase-3 (Extended Data Fig. 4h), suggesting that NS3 induces mitochondrial depolarization.
We hypothesized that NS3-N disrupts mitochondrial outer membranes to initiate cell death. To test this hypothesis, we generated recombinant NS3-FL, NS3-N and NS3-C proteins (Extended Data Fig. 10a–d) and incubated them with membrane lipid strips to determine their potential to interact with lipids from different membranes of the cell. NS3-FL and NS3-N bound to phosphatidylserine, phosphatidic acid and cardiolipin, which are mitochondrial and bacterial lipids, but not to other phosphoinositides found in the plasma membrane. NS3-C did not bind to any lipids (Fig. 3d). We also tested whether NS3 could interact with liposomes with different lipid compositions. NS3-N and NS3-FL, but not NS3-C, efficiently precipitated with liposomes containing cardiolipin and the carrier lipid phosphatidylcholine, as well as liposomes from bovine liver extracts and Escherichia coli polar extracts (Fig. 3e). We also observed interaction of NS3-N and NS3-FL, but not NS3-C, with liposomes that mimic the outer membrane of mitochondria (OMM) (Fig. 3e). We next determined whether NS3-FL and NS3-N induced liposome disruption. Both NS3-N and NS3-FL caused nearly 70% leakage of cardiolipin liposomes and OMM liposomes (Fig. 3f). Similar results were obtained when the NS3-FL or NS3-N were incubated with liposomes generated from bovine liver extracts and E. coli polar extracts. The proteins had no effect on reconstituted phosphatidylcholine liposomes (Extended Data Fig. 10e). NS3-C did not disrupt any liposomes (Fig. 3f). Additionally, NS3-FL could release small dextran (5 or 10 kDa) molecules from cardiolipin liposomes but not 70-kDa fluorescent dextran, indicating that NS3 could form a size-selective pore (Extended Data Fig. 10f). Consistent with the high binding affinity to cardiolipin and disruption of the liposome reconstituted from E. coli polar extracts, NS3-FL and NS3-N were also toxic to Escherichia coli (Extended Data Fig. 10g,h). Together, these results suggest that NS3 targets mitochondrial membranes to form size-selective pores.
Because other cell death executioners such as MLKL are hypothesized to form oligomers that insert into membranes, we next tested whether NS3 formed higher-order oligomers. We co-transfected HEK 293T cells with Flag-tagged NS3-FL and NS3-N and GFP-tagged NS3-FL and NS3-N. Immunoprecipitation with anti-Flag antibody readily pulled down the GFP-tagged NS3-FL and NS3-N, indicating that NS3-FL and NS3-N can self-associate (Extended Data Fig. 10i). The association of NS3-FL with NS3-N and NS3-C further implied that NS3 self-associates (Extended Data Fig. 10j). To determine whether NS3 has an intrinsic property to form oligomeric complexes, we incubated NS3 proteins with cardiolipin liposomes or OMM liposomes, followed by crosslinking with the amine-to-amine crosslinker BS3. In the absence of the crosslinker, the NS3 proteins ran at the monomeric molecular mass on SDS–PAGE. In the presence of the crosslinker, NS3 ran at a higher molecular mass, with or without liposome incubation (Extended Data Fig. 10k). These data suggest that NS3 intrinsically oligomerizes.
To provide direct evidence that NS3 permeabilizes the mitochondrial membrane, we incubated mitochondria from BV2 cells with purified MNoV NS3 proteins. Both NS3-FL and NS3-N strongly induced cytochrome c release from the mitochondria, whereas NS3-C did not (Fig. 3g). These data suggest that the N-terminal domain of MNoV NS3 disrupts mitochondria by forming pores in the outer mitochondrial membrane, potentially by a process that involves the assembly of oligomers. The above experiments suggest that NS3 interacts with mitochondrial cardiolipin and that this interaction is a key commitment step for MNoV-induced cell death. Since cardiolipin is found primarily on the inner membrane of mitochondria (IMM), we hypothesized that MNoV infection may redistribute cardiolipin to the outer surface of the mitochondria. To test this, mitochondria were isolated from untreated, staurosporine (STS)-treated or MNoV-infected BV2 cells and then incubated with fluorescently labelled annexin V which specifically binds cardiolipin at low calcium concentration29. As expected, annexin V bound less to mitochondria isolated from untreated cells. However, mitochondria isolated from STS-treated and MNoV-infected cells displayed increased staining for annexin V (Extended Data Fig. 11a). To determine whether the externalization of cardiolipin was important for MNoV-induced cell death, we knocked down phospholipid scramblase-3 (PLS3), a mitochondrial enzyme responsible for the translocation of cardiolipin from the inner mitochondrial membrane to the OMM30. Small interfering RNA (siRNA)-mediated knockdown of PLS3 reduced the MNoV infection-induced cell death (Extended Data Fig. 11b). To further validate the role of PLS3, we generated Pls3−/− BV2 cells using CRISPR–Cas9 (Extended Data Fig. 11c). Cells deficient in Pls3 were also partially resistant to MNoV-triggered cell death (Extended Data Fig. 11d,e). Together, these results suggest that MNoV infection primes infected cells for cell death by inducing externalization of cardiolipin to facilitate NS3 binding.
The NS3 4HB domain is required for viral egress
The finding that NS3-N is sufficient to disrupt the mitochondrial membrane through binding cardiolipin to induce programmed cell death raised the possibility that NS3-N may be required for viral egress from infected cells. To determine whether NS3-induced cell death was required for viral egress, we used the reverse genetics system for MNoV to generate mutant viruses lacking the N-terminal region of NS3 (CW3ΔN and CR6ΔN) or lacking the mitochondria localization motif of NS331 (CW3ΔN20 and CR6ΔN20). In contrast to wild-type MNoV, MNoV CW3ΔN and CR6ΔN were unable to lyse BV2 cells, despite expressing viral non-structural proteins and forming replication complexes (Fig. 4a–c and Extended Data Fig. 12a,b). By quantifying the viral genome copies that were associated with cells and in the supernatant, we found the ΔN mutant viruses lost the capacity to egress the cell even though they replicated to similar levels to the wild-type viruses (Fig. 4d,e and Extended Data Fig. 12c). Similarly, the mutant viruses lacking only the mitochondrial localization motif of NS3 did not induce cytotoxicity (Extended Data Fig. 12d). The impaired viral egress was consistent with our difficulty in obtaining high titres of mutant virus stocks (data not shown), necessitating the use of inducible complementing cell lines to produce infectious virus (Methods). The idea that NS3-N is required for viral egress through interaction with cardiolipin is further supported by the observation that there was less viral particle release into the supernatant upon infection of Pls3−/− cells (Extended Data Fig. 11f).
Fig. 4 |. NS3-triggered cell death is essential for norovirus egress.
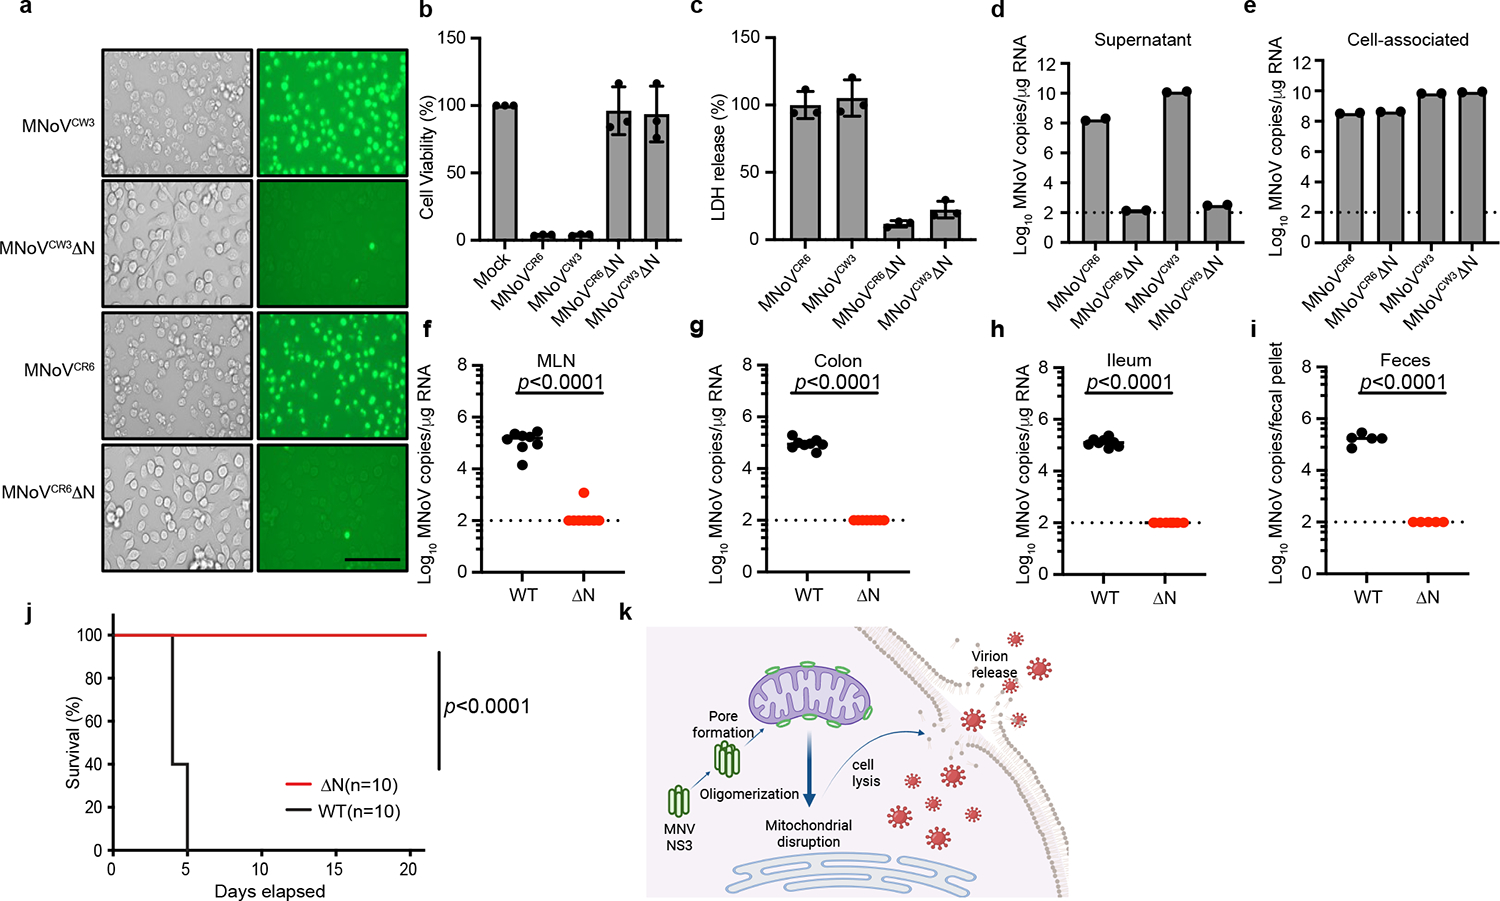
a, Representative images of SYTOX Green-stained BV2 cells infected with wild-type CR6 and CW3 and mutant (CR6ΔN and CW3ΔN) MNoV at MOI of 5 for 12 h. Scale bar, 100 μm. b, Viability of BV2 cells infected with wild-type CR6 and CW3 and mutant (CR6ΔN and CW3ΔN) MNoV at MOI of 5 for 24 h. c, LDH release from BV2 cells infected with wild-type CR6 and CW3 and mutant (CR6ΔN and CW3ΔN) MNoV at MOI of 5 for 24 h. d,e, BV2 cells infected with wild-type (CR6 and CW3) and mutant (CR6ΔN and CW3ΔN) MNoV at MOI of 1 and viral genomes that were in the supernatant (d) or cell-associated (intracellular) (e) were quantified by quantitative PCR at 24 h. f–i, Wild-type mice were challenged with 106 plaque-forming units (PFU) of CR6 and CR6ΔN perorally. Viral genomes were quantified by quantitative PCR in the mesenteric lymph node (MLN) (f), colon (g), ileum (h) and faeces (i) at 7 days after infection. n = 8 for both groups in f–h. n = 5 for both groups in i. The dashed line represents the limit of detection. j, Survival of Stat1−/− mice after challenge with 106 PFU of CW3 (n = 10) and CW3ΔN (n = 10). k, Model of NS3-triggered cell death before norovirus egress. Created with BioRender.com. Data in a are representative of three independent experiments. Data in b,c are pooled from three independent experiments with three technical replicates per experiment. Data in d,e are pooled from two independent experiments with three technical replicates in each. Data in f,i,j are pooled from two independent experiments. Data are mean ± s.d. f–i, Two-tailed Student’s t-test. j, Log-rank (Mantel–Cox) test. P values are shown at the top of the graphs.
To determine whether NS3-N-triggered cell death was essential for viral infection in vivo, we challenged mice with wild-type and mutant viruses. The CR6 strain of MNoV replicates in the intestines and is shed in the faeces32. We infected mice with MNoV CR6, CR6ΔN or CR6ΔN20 and detected viral genomes in the intestinal tissue and faeces seven days after infection. Wild-type CR6 was detectable in the ileum, colon, MLN and faeces. By contrast, viral genomes were rarely detected in intestinal tissues and faeces of mice challenged with CR6ΔN or CR6ΔN20 (Fig. 4f–i and Extended Data Fig. 12e–h). To further test whether the N-terminal domain of NS3 was essential for MNoV in vivo replication, we orally inoculated Stat1−/− mice with MNoV CW3, CW3ΔN, or CW3ΔN20. Consistent with previous studies, MNoV CW3 infection resulted in 100% lethality of Stat1−/− mice33 (Fig. 4j). However, we observed no lethality in Stat1−/− mice infected with MNoV CW3ΔN or CW3ΔN20 viruses (Fig. 4j and Extended Data Fig. 12i). These data suggest that NS3-N and the mitochondrial localization of NS3-N are essential for MNoV replication in vivo.
Discussion
Norovirus NS3-N directly initiates programmed cell death by targeting the mitochondrial outer membrane, leading to the permeabilization of mitochondria (Fig. 4k). This mitochondrial permeabilization by NS3 is required for viral egress in vitro and replication in vivo. The N-terminal domain of NS3 mimics the cell death domain of MLKL, but rather than targeting the plasma membrane, NS3 targets mitochondria. Thus, the 4HB domain of NS3 directly compromises mitochondrial function. These results suggest that mitochondrial integrity is a key checkpoint for apoptosis and pyroptosis, as well as virus-induced programmed cell death34–36. Comparisons of norovirus and host MLKL protein sequences suggest that the calicivirus 4HB domain originated from an ancestral host. Our results with NS3 mutant viruses suggest that noroviruses co-opted this domain to induce cellular lysis for viral egress.
In the evolutionary arms race between viral fitness and host defence, viruses incorporate host proteins and repurpose them for viral replication. MLKL activity is targeted by many different viruses, including poxviruses37,38. Notably, poxviruses encode a protein derived from the regulatory domain of MLKL—the kinase-like domain—that suppresses necroptosis27,38 (Fig. 2j). Conversely, noroviruses have repurposed the MLKL-like 4HB domain—the executioner domain—to facilitate virus replication. In summary, our study demonstrates a viral strategy for regulating programmed cell death and viral egress that may also be used by other viruses.
Viroporins comprise a family of viral proteins that cause membrane permeability39,40. These single- or double-transmembrane proteins homo-oligomerize and form ion channels in endoplasmic reticulum or plasma membranes. We propose that norovirus NS3 represents a pore-forming protein based on the putative 4HB domain structure, the homology to MLKL, the specific localization to the mitochondria and the ability to form size-selective pores.
Our findings that noroviruses encode a protein that induces cell death challenges the widely held view that virus-triggered programmed cell death is a host survival strategy. Although programmed cell death of host cells limits viral replication for many viruses, noroviruses actively induce cell death to facilitate viral spread. Given that the C-terminal domain of NS3 is essential for viral genome replication and the N-terminal domain is a cell death executor, it is possible that noroviruses regulate the timing, level of expression and localization of this multifunctional protein. Because viral egress is a rate-limiting step for viral infection, our work suggests a new putative target for antiviral therapies.
Methods
Plasmids, antibodies and reagents
Nucleotide sequences of norovirus genes were amplified with Q5 High-Fidelity 2× Master Mix (NEB) from pCR6, pCW3 and pSPORT MD145 plasmids. Flag-tagged constructs of Norovirus genes were generated by cloning the indicated genes into pCMV-6b-Flag vector with N-terminal Flag tag using Gibson Assembly Master Mix (NEB). GFP-tagged constructs were assembled by subcloning the indicated genes into pEGFP-C2 vector for transient expression in HEK 293T cells. Truncation mutants of NS3 were constructed by the standard PCR cloning strategy and inserted into pEGFP-C2 vector and pCMV-6b-Flag vector. For recombinant expression in E. coli, the cDNAs were cloned into a pMAL-c6T-His6-MBP vector (NEB). For inducible Tet-on overexpression, coding sequences of NS3 was amplified from pCR6 plasmids and subcloned into pLVX-TRE3G vector (Clontech) using Gibson Assembly Master Mix (NEB). All plasmids were verified by DNA sequencing.
Natural and synthetic lipid products used for liposome preparation were obtained from Avanti Polar Lipids. Lipid strips were purchased from Echelon Biosciences. MitoTracker Deep Red, MitoTracker Green, MitoSOX, Annexin V–Alexa Fluor 647 and TMRM were obtained from Invitrogen. Ultrapure lipopolysaccharide was obtained from InvivoGen. Bis (sulfo-succinimidyl) suberate (BS3) and CellMask Orange were obtained from Thermo Fisher Scientific. Doxycycline (D9891), terbium chloride (TbCl3), polybrene (H9268), DPA, tunicamycin, staurosporine, FITC–dextran and nigericin were purchased from Sigma-Aldrich. Necrostatin-1 was purchased from Selleck Chemicals. z-VAD (FMK007, R&D) was dissolved in DMSO. The antibodies used in this study include: anti-Flag (A8592, Sigma), anti-actin (A2066, Sigma), anti-GFP (SC9996, Santa Cruz), anti-cytochrome c (556433, BD Biosciences), anti-BAK (12105, Cell Signaling), anti-BAX (2772s, Cell Signaling), anti-MBP (E8032S, NEB), anti-MLKL (ZRB1142, Sigma), anti-pMLKL (196436, Abcam), anti-caspase-3 (9962, Cell Signaling), anti-caspase-9 (9504, Cell Signaling), anti-COX IV (4844, Cell Signaling), anti-GSDMD (209845, Abcam), anti-GAPDH (G8795, Sigma), anti-PLSCR3 (137128, Abcam), anti-IRE1α (3294t, Cell Signaling), anti-CHOP (2895s Cell Signaling), anti-ATF4 (11815s, Cell Signaling), anti-rabbit IgG, Peroxidase (711–035-152, Jackson ImmunoResearch Laboratory), anti-mouse IgG, Peroxidase (115–035-174, Jackson ImmunoResearch Laboratory). Antibodies for Flag and actin were used at 1:5,000 dilution and all other primary antibodies were used at 1:1,000 dilution for western blot. Secondary antibodies were used at 1:5,000 for western blot. Primary antibodies were used at 1:100 dilution for immunofluorescence.
Cell lines culture and transfection
BV2, HeLa and HEK 293T cells (ATCC) were maintained in Dulbecco’s modified Eagle medium (DMEM; Corning) supplemented with 10% heat-inactivated fetal bovine serum (Biowest), 1% penicillin-streptomycin (Corning), 2 mM l-glutamine (Corning), and 1% HEPES (Corning). A20 cells (ATCC) were cultured in RPMI 1640 (Corning) supplemented with 10% heat-inactivated fetal bovine serum (Biowest), 1% penicillin-streptomycin (Corning), 2 mM l-glutamine (Corning), 1% HEPES (Corning) and 50 mM 2-mercaptoethanol. All cell lines are routinely tested for mycoplasma contamination and grown from low-passage stocks. To obtain primary BMDMs, bone marrow cells were collected from mouse femurs and tibia. Cells were then cultured and differentiated in non-tissue culture-treated dishes with BMDM medium (DMEM, 10% heat-inactivated fetal bovine serum, 10% CMG14 conditioned medium, 2 mM l-glutamine, 1% penicillin-streptomycin and 1% HEPES) and incubated for 7 days at 37 °C and 5% CO2. All cell lines were mycoplasma negative. Transient transfection of HEK 293T and HeLa cells were performed using Lipofectamine 3000 (Invitrogen) according to the manufacturer’s instructions. A20 cells were electroporation transfected using SF Cell Line 4D-Nucleofector X Kit (Lonza) according to the manufacturer’s instructions. For siRNA knockdown, 40 nM siRNA (Sigma) and 1.2 μl of Lipofectamine RNAiMAX (Invitrogen) were used to transfect BMDMs in the 24-well plates (3 × 10⁵ cells per well). A mixture of the two specific siRNAs (GGAAGAUCAGCUUUAAUGA and GUAGACAUGUCAUACCCAU) was used to knock down PLS3 expression. The knockdown was performed for 48 h before subsequent analyses.
Mouse strains and infections
C57BL/6J, Casp1/Casp4−/− ( Jackson Laboratories) and Stat1−/− ( Jackson Laboratories)42 mice in this study were bred and maintained under pathogen-free animal care facility under a 12 h:12 h light: dark cycle with a temperature of 24 °C and humidity of 35%. Ripk3−/− mice were provided by Z.Wang and generated in the laboratory of X. Wang43. A mix of male and female mice between 6–10 weeks of age were used for infections. Mice were perorally inoculated with 25 μl of 106 PFU MNoV diluted in DMEM with 10% FBS. Single fecal pellet and tissues were collected into 2 ml tubes with 1 mm zirconia/silica beads (Biospec). All of samples frozen in a dry ice/EtOH bath and stored at −80 °C. All experiments were performed according to experimental protocols approved by the Institutional Animal Care and Use Committee and complied with all relevant ethical regulations. No method was used for sample size choice. No randomization or blinding was done.
Generation of viral stocks and in vitro MNoV infections
MNoV CW3 (accession EF014462.1) and MNoV CR6 (accession JQ237823) were generated from plasmids44. In brief, plasmids encoding viral genomes were transfected into HEK 293T cells to generate P0 stock. Cells were frozen at 48 h after transfection. The P0 virus were expanded by two passages in BV2 cells at MOI of 0.05 to generate P2 stock. To generate viral stocks, infected BV2 cells were freeze-thawed, cell lysate and supernatant were pelleted at 1,200g for 5 min, super-natant was filtered through a 0.22-μM filter and concentrated with 100,000 MWCO Amicon Ultra filter. Virus stocks were aliquoted, frozen and titred by plaque assay. CW3ΔN, CR6ΔN, CW3ΔN20 and CR6ΔN20 were generated by PCR from parental pCR6 and pCW3 plasmids. The PCR products were gel purified and assembled using Gibson Assembly Master Mix (NEB). All plasmids were verified by DNA sequencing. Mutant viruses were propagated as for wild-type CW3 and CR6, except P0 virus were expanded by 2 passages in BV2 and NS3 inducible cell line (1:1). Doxycycline was added to medium after 12 h infection to induce cells death and release the virus. This was done for multiple rounds of infection to achieve high yield of virus particle. Primers: CW3ΔN20 forward, GAATGGCAGGCCGAAGGGCCCTTTGGCCTCAC CTCTGA; CW3ΔN20 reverse, TCATAGACCTTGTTCTGGAGGCCGAAAT CATCA; CW3ΔN forward, GAATGGCAGGCCGAAGGGCTTGATGAGGAG GAGCA; CW3ΔN reverse, TCATAGACCTTGTTCTGGAGGCCGAAAT CATCA; CW3 plasmid forward, AACAAGGTCTATGACTTTGATGCCG; CW3 plasmid reverse, CCCTTCGGCCTGCCAT; CR6ΔN20 forward, AGTGGCAGGCTGAGGGTTTTGGCCTGACATC; CR6ΔN20 reverse, GTCATAGGTCTTGCTTTGGAGGCCGAAGTC; CR6ΔN forward, AGTGGCAGGCTGAGGGTCTTGATGAAGAAGAG; CR6ΔN reverse, GTCATAGGTCTTGCTTTGGAGGCCGAAGTC; CW6 plasmid forward, AGCAAGACCTATGACTTTGAT; CW6 plasmid reverse, ACCCTCAGC CTGCCACTCTCCAA.
BV2 and BMDMs were infected with MNoV strains at indicated MOI for 1 h. Viral inoculum was then removed and cells were washed with PBS twice and medium was added to the cells45.
Virus quantification by plaque assay and quantitative PCR
BV2 cells were seeded at 2 × 10⁶ cells per well in 6-well plates. Plaque assay was performed by freeze/thawing infected samples followed by tenfold serial dilutions. Medium was removed from the BV2 cells and infected with serial dilutions samples and gently rocked for 1 h. After inoculum was removed and cells were overlaid with 2 ml overlay medium (MEM) containing 1% methylcellulose and 10% FBS). Plates were incubated for 48 h prior to plaque visualization with crystal violet solution (20% ethanol, 0.2% crystal violet).
MNoV genome copies in fecal pellets and tissues were quantified as previously described46,47. In brief, RNA was isolated from fecal pellets using the ZR Viral RNA Kits according to manufacturer’s protocol (Zymo Research). Tissue RNA extraction was performed using TRIzol (Sigma-Aldrich) and purified using RNeasy Mini Kit (Qiagen) according to manufacturer’s instructions. cDNA was generated with SuperScript VILO cDNA Synthesis Kit (Thermo Fisher Scientific). Then, TaqMan assays were performed for the samples and standard curves using MNoV specific oligonucleotides: probe, 5′-FAM-CGCTTTGGAACAATG-MGBNFQ-3′; forward primer, 5′-CACGCCACCGATCTGTTCTG-3′; reverse primer, 5′-GCGCTGCGCCATCACTC-3′. A standard generated using RNA from tenfold series dilution of parental virus stocks was used to quantify viral genome equivalents in genome copies from mutant virus stocks. For measure the titre of mutant virus stocks, viral RNA was extracted from the tenfold serial dilution of mutant virus stocks and parental virus stocks with known PFU. Tenfold serial dilutions ranging from 106 to 10 copies of standard plasmid was used for quantification of viral genome copy numbers. The PFU of mutant virus stocks was calculated based on the equivalent genome copy of parental virus stocks.
Lentivirus production and transduction
For lentivirus production, lentivirus harbouring the desired genes together with the packing plasmids psPAX2 and pMD2.G were transfected into HEK 293T cells by Lipofectamine 3000 (Invitrogen). The transfection medium was replaced with fresh culture medium (DMEM with 10% FBS) after 6 h transfection. Supernatants were collected at 48 h, cleared by centrifugation at 1,500 rpm for 5 min and filtered through 0.45 μM membrane (Millipore). For lentivirus transduction, 4 × 10⁵ BV2 cells were seeded into 6-well plates. Cells were transduced with the indicated lentivirus in transduction medium (DMEM with 10% FBS and 8 μg ml−1 polybrene) by spinning at 1,000g for 30 min at 37 °C. The transduction medium was replaced with culture medium after 6 h and selected with 2.5 μg ml−1 of puromycin (Sigma-Aldrich) and 50 μg ml−1 hygromycin (Invitrogen) after 48 h transduction. Lentivirus for the pLVX-EF1a-Tet3G and pLVX-TRE3G-NS3 were generated by transfecting HEK 293T cells using the Lipofectamine 3000 (Invitrogen). BV2 cells were cultured in tetracycline-free medium and co-infected with the pLVX-EF1a-Tet3G and pLVX-TRE3G-NS3 lentivirus and selected with G418 (400 μg ml−1) and puromycin (2.5 μg ml−1). For the induction of NS3 expression, doxycycline was added to the tetracycline-free medium at a concentration of 2 μg ml−1.
Generation knockout cell lines with CRISPR–Cas9
Guide RNAs were designed using CRISPR–Cas9 guide RNA design checker (Integrated DNA Technologies). Guide RNAs were cloned into lenti-CRISPR v2 puro and lenti-CRISPR v2 hygro vector (Addgene #98290 and #98291) according to the manufacturer’s protocol48. Lentivirus was produced as described above. In total, 4 × 10⁵ BV2 cells were transduced with the indicated lentivirus and incubated for 48 h. Transduced cells were then selected with 2.5 μg ml−1 puromycin (Sigma-Aldrich) and 50 μg ml−1 hygromycin (Invitrogen). Single cell colonies were screened and verified by western blot analysis for protein expression with the exception of Ninj1-knockout cell lines, which were determined by sequencing of the PCR fragments. Single guide RNA sequences for targeting the genes of interest were as follows: Casp3 (AATGTCATCTCGCTCTGGTA), Casp9 (CACACG CACGGGCTCCAACT), Ninj1 (TGCCAACAAGAAGAGCGCTG), Bak (ATCTTGGTGAAGAGTTCGT), Bax (CTGAACAGATCATGAAGAC), Mlkl (CTCATTCACTTCATGGAAG), Gsdmd (AGCATCCTGGCATTCCGAG) Ire1α (CTCACTGCCGGAAGACGACG) and Pls3 (GCGAAGTTCATACATATTAC).
Cytotoxicity and cell viability assays
Cell death was quantitated by assaying the activity of LDH released into cell culture supernatants after infection and transfections using the CytoTox 96 Non-Radioactive Cytotoxicity Assay kit (Promega) according to the manufacturer’s protocol. Cell viability was determined by measuring ATP levels using the CellTiter-Glo Luminescent Cell Viability Assay (Promega) according to the manufacturer’s instructions.
IncuCyte live-cell imaging
For IncuCyte analysis, 2 × 10⁵ doxycycline-induced cells expressing NS3-FL, NS3-N and NS3-C were seeded in 24-well plates. After overnight incubation, cells were treated with 2 μg ml−1 doxycycline and 25 nM SYTOX Green (Invitrogen) was then added. The plates were moved into an IncuCyte live-cell imaging system. Cells were imaged every 30 min and the SYTOX Green-labelled cells (counted as dead cells) were quantified by the IncuCyte Zoom software.
Flow cytometric analyses
To measure cell death after MNoV infection, cells were stained with FITC Annexin V Apoptosis Detection Kit (BioLegend) according to the manufacturer’s instructions. To assess mitochondrial membrane potential, cells were stained with the MitoTracker Green and MitoTracker Deep Red (50 nM each) or TMRM (50 nM) for 30 min at 37 °C. To assess mitochondrial ROS production, cells were stained with the mitochondria-specific superoxide indicator MitoSox Red for 30 min at 37 °C. Cells were then washed with phosphate buffered saline (PBS) and analysed using BD FACS Calibur.
Mitochondria isolation, cytochrome c release assay and cardiolipin externalization assay
Mitochondria were purified from doxycycline-induced stable cell lines using the mitochondrial isolation kit (Abcam, ab110168) according to the manufacturer’s instructions. The cytosolic fraction and mitochondrial fraction were collected for western blot. For cytochrome c release assay, BV2 cells were collected and washed in phosphate-buffered saline (PBS) and resuspended in 5× volume of isotonic buffer (10 mM Tris-Cl pH 7.5, 10 mM KCl, 250 mM sucrose, 1.5 mM MgCl2) and incubated on ice for 15 min. Cells were then passed through a 22-gauge needle 25 times and were centrifuged at 1,000g for 10 min at 4 °C to pellet nuclei. The supernatant was collected and centrifuged at 7,000g for 10 min at 4 °C to collect mitochondria. Isolated mitochondria were incubated with recombinant NS3 (5 μM) for 30 min at 37 °C. After treatment, mitochondria were pelleted by centrifugation (7,000g, 4 °C, 10 min) and supernatant was collected. The pelleted mitochondria were lysed in lysis buffer (50 mM Tris-Cl (pH 7.4), 150 mM NaCl) supplemented with 1 mM EDTA, 1% Triton X-100, 0.1% SDS, 0.5% deoxycholate and protease inhibitor cocktail (Roche), followed by centrifugation (15,000g, 4 °C, 10 min). Then, SDS loading buffer was added to each fraction and analysed by western blotting.
For assessment of externalized cardiolipin, mitochondria were analysed for the presence of externalized cardiolipin by flow cytometry as described previously29. In brief, cells were incubated with 250 nM Mitotracker Green FM (Invitrogen) for 45 min at 37 °C, then subjected to STS treatment or MNoV infection. Following isolation, mitochondria were incubated with annexin V–Alexa Fluor 647 (Invitrogen) for 30 min on ice. Mitochondria were then washed and analysed by flow cytometry using BD FACS Calibur and the data are presented as the percentage of the mitochondria that were annexin V-positive.
Purification of recombinant proteins
To obtain full-length, N-terminal and C-terminal NS3 proteins, E. coli BL21 cells harbouring the indicated plasmid (pMAL-c6T-His6-MBP vector) were grown in LB medium. Protein expression was induced overnight at 20 °C with 0.3 mM isopropyl β-d-1-thiogalactopyranoside after A600 reached 0.8. Cells were collected by centrifugation and lysed in buffer containing 20 mM Tris-HCl (pH 8.0), 300 mM NaCl and 10 mM β-mercaptoethanol followed by sonication. The recombinant protein was affinity-purified by amylose resin (NEB) and eluted with buffer containing 20 mM Tris-HCl (pH 8.0), 300 mM NaCl, 10 mM β-mercaptoethanol and 10 mM maltose and further purified by Superdex 200 gel-filtration column (GE Healthcare). For liposome leakage assay, the His6–MBP tag was removed by overnight TEV digestion at 16 °C and further purified and concentrated by Superdex 200 gel-filtration column (GE Healthcare).
Immunoblot and immunoprecipitation
Cells were lysed in lysis buffer (50 mM Tris-Cl (pH 7.4), 150 mM NaCl) supplemented with 1 mM EDTA, 1% Triton X-100, 0.1% SDS, 0.5% deoxycholate and protease inhibitor cocktail (Roche) and then spun down at 15,000g for 10 min. The supernatants were boiled in SDS loading buffer for 10 min before electrophoresis with 4–12% Bis-Tris plus gels (Thermo Fisher Scientific). The resolved proteins were then transferred to polyvinylidene difluoride membrane (Millipore), which was probed with the indicated antibodies. Protein bands were developed using Luminata Forte Western HRP substrate (Millipore) or Super Signal West Pico chemiluminescence ECL kit (Pierce). For immunoprecipitations, cell extracts were prepared using lysis buffer (50 mM Tris-HCl (pH 7.4), 150 mM NaCl, 1 mM EDTA, 1% Triton X-100, 0.5% deoxycholate) containing complete protease inhibitor cocktail (Roche). Lysates were incubated with Flag–M2 agarose beads (Sigma-Aldrich) for 4 h at 4 °C. After 5 washes with lysis buffer, proteins bound to Flag–M2 agarose beads were eluted using 3×Flag peptides (Sigma-Aldrich), followed by immunoblot analysis.
Immunostaining and confocal microscopy
Cells were grown on coverslips, fixed with 4% paraformaldehyde in PBS for 15 min, and permeabilized for 30 min in 0.1% Triton X-100 in PBS and blocked using 5% BSA for 1 h at room temperature. Then, the cells were stained with the indicated primary antibodies, followed by incubation with Alexa Fluor secondary antibodies (Life Technologies). Nuclei were stained with DAPI (Cell Signaling Technology). Images were captured using a confocal microscope (Zeiss LSM 700 confocal microscope) with a 63× oil immersion objective.
Protein–lipid binding assay
The protein–lipid binding assay was performed on Membrane Lipid Strips (Echelon Biosciences) according to the manufacturer’s instructions. Lipid strips were blocked with binding assay buffer (3% fatty acid-free BSA in PBS) for 1 h and incubated with protein (1 μg ml−1) diluted in binding assay buffer for 1 h and then washed 3 times with wash buffer (0.1% Tween-20 in PBS). Membrane-bound proteins were then detected by immunoblot with anti-MBP antibody.
Liposome preparation
Natural and synthetic lipids were dissolved in chloroform. Lipids with indicated compositions were mixed in a glass vial. The lipid films were obtained by evaporating under a stream of nitrogen and the dry lipid film was then hydrated at room temperature with constant mixing in 500 μl buffer A (20 mM HEPES (pH 7.5) and 150 mM NaCl). Liposomes were generated by extrusion of the hydrated lipids through 100 nm polycarbonate filter (Whatman) 20 times using a Mini-Extruder device (Avanti Polar Lipids). To prepare Tb3+-encapsulated liposomes, the lipid film was hydrated with 500 μl buffer B (20 mM HEPES (pH 7.5), 100 mM NaCl, 50 mM sodium citrate and 15 mM TbCl3). After the extrusion process, Tb3+ ions outside the liposome were removed by washing with buffer A on a centrifugal filter device (Amico Ultra-4, 100 K MWCO, Millipore). The liposomes were subjected to buffer A for use. To prepare FITC–dextran-encapsulated liposomes, the lipid film was hydrated in buffer A supplemented with 2 mg ml−1 FITC-dextran. After the extrusion process, the liposomes were repeatedly washed with buffer A to remove external dextran by centrifugal filter device (Amico Ultra-4, 100K MWCO, Millipore). All the liposomes were stored at 4 °C and used within 48 h.
Liposome binding and leakage assay
For liposome binding assay, the indicated proteins (0.2 μM) were incubated with liposomes at room temperature for 30 min in 100 μl of buffer A. The liposomes were pelleted by centrifugation in a Beckman Optima XE-90 Ultracentrifuge at 40,000 rpm for 20 min at 4 °C. The supernatants (S) were collected, and the pellets (P) were washed twice with buffer A and then resuspended in same volume as supernatants. Proteins in both supernatant and pellets were then analysed by SDS–PAGE and immunoblot. Anti-MBP antibody was used to detect the NS3 proteins. For liposome leakage assay, Tb3+-entrapped liposomes were suspended in 100 μl buffer A supplemented with 50 μM of DPA and 0.5 μM NS3 recombinant proteins were added. The emission fluorescence at 490 nm after excitation at 276 nm as Ft (the fluorescence reads recorded at individual time points) was continuously recorded for 10 min at 20 s intervals using a Tecan Infinite M200 Pro plate reader. At the end of the incubation, 10 μl of 1% Triton X-100 was added to measure complete release of Tb3+. For FITC-dextran leakage assay, dextran-encapsulated liposomes were suspended in 100 μl buffer A and 0.5 μM NS3 recombinant proteins were added at room temperature for 30 min. After centrifugation, the released FITC–dextran in the supernatants was collected and the emission fluorescence (521 nm) after excitation at 494 nm was measured. The percentage of liposome leakage is defined as: leakage (%) = 100 × ((Ft − F0)/(F100 − F0)), where F0 is the emission fluorescence of the Tb3+ liposomes or dextran-encapsulated liposomes for liposomes alone, Ft is the fluorescence reads recorded at individual time points for Tb3+ liposomes or fluorescence reads recorded from collected supernatants from dextran-encapsulated liposomes, and F100 is fluorescence signal after adding 0.1% Triton X-100.
Crosslinking assays of NS3 oligomerization
To assay NS3 oligomerization in vitro, NS3 proteins were incubated with indicated liposome for 10 min at room temperature. Crosslinking was performed by adding 2 mM the amine-reactive crosslinker BS3 to the NS3–liposome mixture for 30 min at room temperature. The liposome pellets were solubilized in SDS loading buffer. Samples with or without crosslinking were analysed by SDS–PAGE gel electrophoresis followed by Coomassie blue staining.
Thermal shift assay
For thermal stability shift assays using a Quant Studio 7 Real Time PCR machine from Life Technologies, purified proteins were diluted in buffer containing 150 mM NaCl, 20 mM Tris pH 7.4. 3 μM protein was used per well and assayed with 2 μl 50× SYPRO Orange (Thermo Fisher) in a total reaction volume of 20 μl. The temperature was increased with a step of 0.05 °C per second from 25 °C to 99 °C and fluorescence readings were taken at each interval.
Protein modelling and phylogenetic analysis
Sequences were retrieved from the NCBI database. Accession numbers and information related to the sequences are presented in Supplementary Tables 1–3. Representative sequences for caliciviruses were selected primarily based on exemplar isolates from International Committee on Taxonomy of Viruses (ICTV) for the individual genera. (https://talk.ictvonline.org/ictv-reports/ictv_online_report/positive-sense-rna-viruses/w/caliciviridae). Unclassified species from ICTV for individual calicivirus genera were included to increase phylogenetic sampling. Mouse MLKL domains are annotated based on the predicted structure from (PDB: 4BTF)26. Amino acid sequences were analysed and aligned using MUSCLE, and visualized with Geneious Prime. Presentation of sequences is based on known host and viral species relationships49. Expanded alignments with additional host and viral species are present in Supplementary Table 1. The model of NS3 in Fig. 2) was generated using Robetta (https://robetta.bakerlab.org/) and was visualized using Chimera (https://www.cgl.ucsf.edu/chimera/). The atomic models of the 4HB domain of NS3 and MLKL in the Extended Data figures were generated with AlphaFold with default parameters, and the structural figures were generated in ChimeraX50.
Extended Data
Extended Data Figure 1: Noroviruses infection triggers programmed cell death.
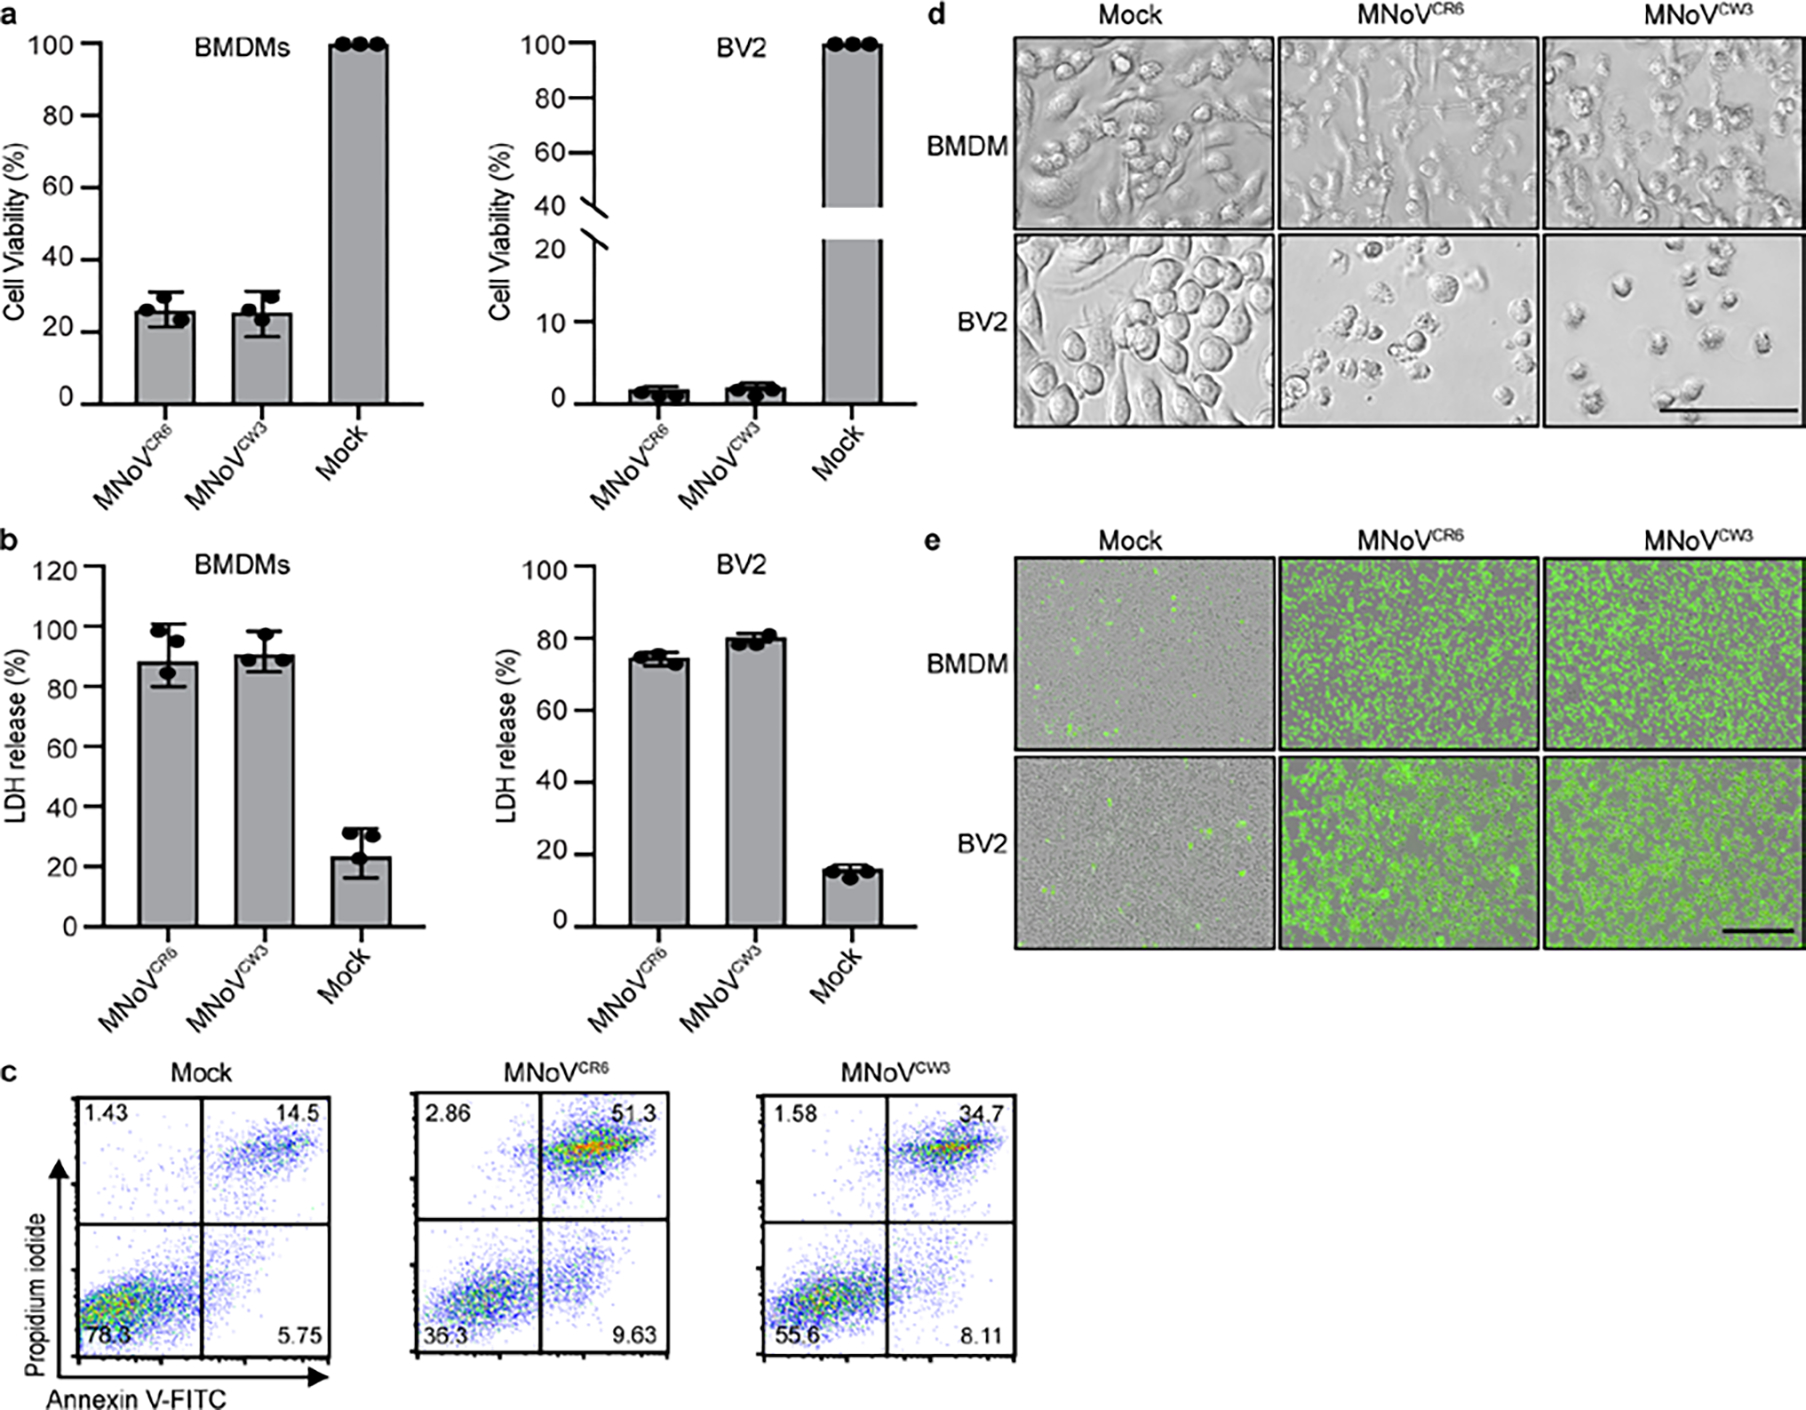
a, Viability of BMDMs and BV2 infected with MNoVCW3and MNoVCR6 at a MOI of 5 for 12 h. b, LDH released from BMDMs and BV2 infected with MNoVCW3and MNoVCR6 at a MOI of 5 for 12 h. c, Representative flow cytometry pseudocolor dot plots of propidium iodide (PI) and annexin V-stained BMDMs infected with MNoVCW3 and MNoVCR6 at a MOI of 5 for 12 h. d, Bright-field images of BMDMs and BV2 infected with MNoVCW3 and MNoVCR6 at a MOI of 5 for 12 h. Scale bar, 100μm. e, Representative IncuCyte images of SytoxGreen-stained BMDMs and BV2 infected with MNoVCW3 and MNoVCR6 at a MOI of 5 for 24 h. Scale bar, 400μm. Data in (a and b) are pooled from three independent experiments with three technical replicates in each experiment. Data are presented as mean of biological replicates ± s.d. Data in (c, d and e) are representative of three independent experiments.
Extended Data Figure 2: Blockade of apoptosis, pyroptosis, or necroptosis does not rescue MNV-induced cell death in in BMDMs and BV2 cells.
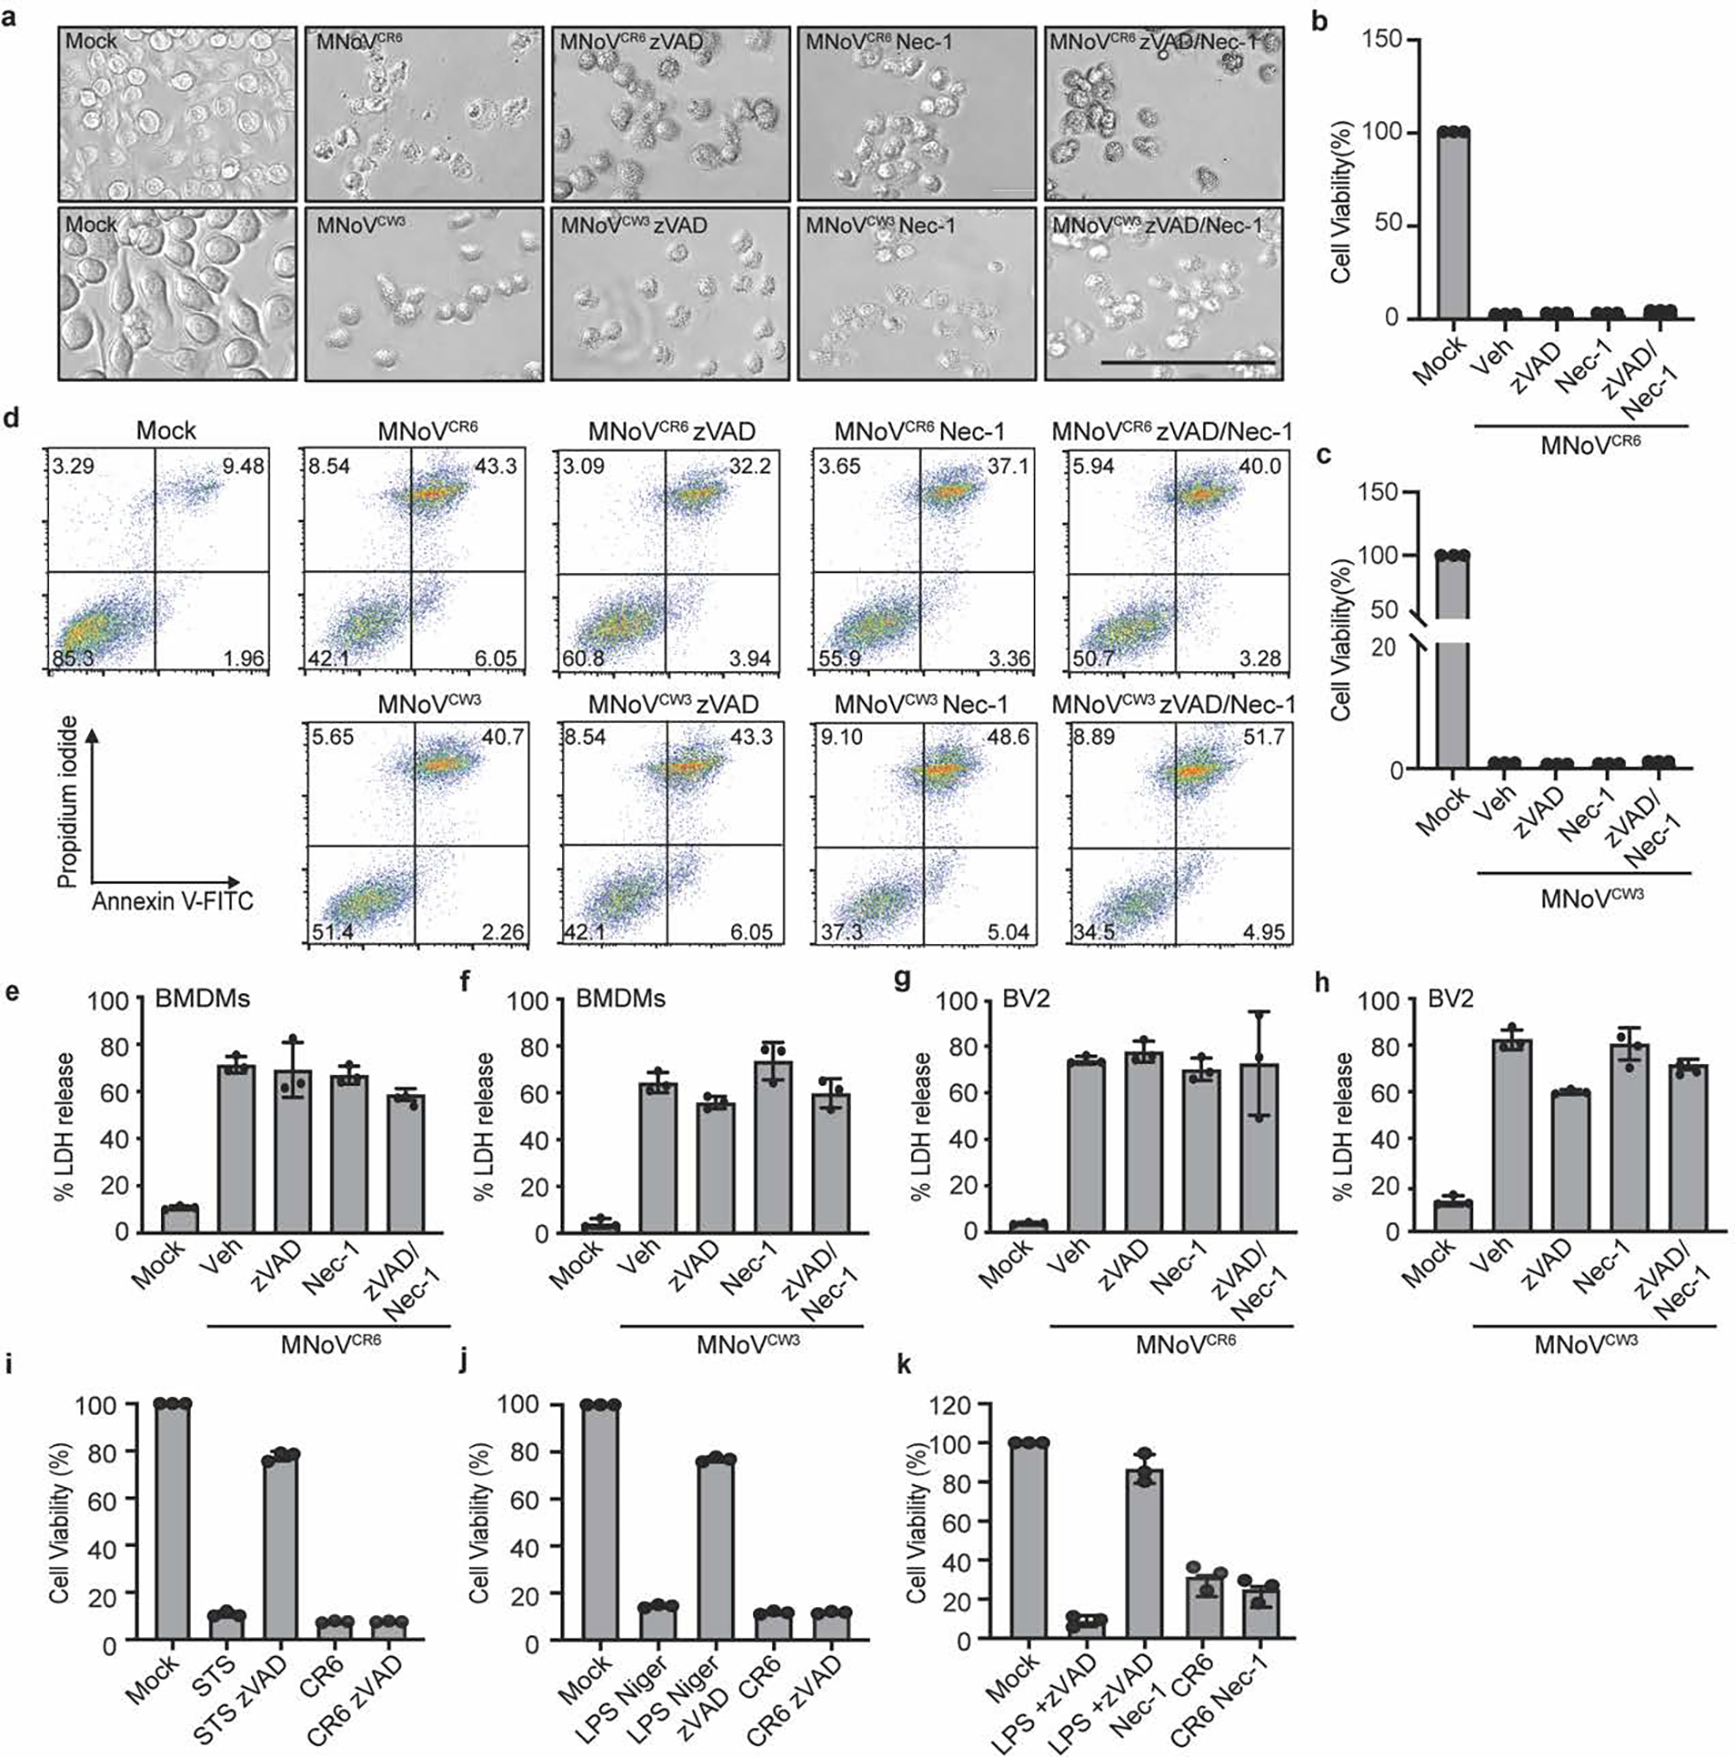
a, Representative bright-field images of BMDMs infected with MNoVCR6 or MNoVCW3 at a MOI of 5 with or without 10 μM zVAD and/or 10 μM necrostatin-1 (Nec-1) for 12 h. Scale bar, 100μm. (b to c) Cytotoxicity of BMDMs infected with MNoVCR6 (b) or MNoVCW3 (c) at a MOI of 5 with or without 10 μM zVAD and/or 10 μM Nec-1 for 24 h. d, Representative flow cytometry pseudocolor dot plots of propidium iodide (PI) and annexin V-stained BMDMs are shown. BMDMs infected with MNoVCW3 and MNoVCR6 at a MOI of 5 with or without 10 μM zVAD and/or 10 μM Nec-1 for 12 h. LDH released from BMDMs (e and f) and BV2 (g and h) infected with MNoVCW3 and MNoVCR6 (MOI=5) with or without 10 μM zVAD, 10 μM Nec-1, either individually or in combination for 24h. i, Cytotoxicity of BV2 cells infected with MNoVCR6 at a MOI of 1 with or without zVAD for 12 h. BV2 cells treated with 0.5 μM Staurosporine (STS) with or without 20 μM zVAD for 6 h as a positive control for apoptosis. j, BV2 cells were primed with 200 ng/mL LPS for 4 h, followed by 10 μM nigericin (Niger) to activate pyroptotic cell death, or they were infected with MNoVCR6, MOI=1, 12 h. zVAD (20 μM) was added 30 min before nigericin treatment. After 12h treatment or infection, cell viability measured by ATP levels using CellTiter-Glo kit. k, Cytotoxicity of BV2 cells infected with MNoVCR6 at a MOI of 1 with or without 10 μM Nec-1 for 12 h. BV2 cells treated with 20 μM LPS plus 20 μM zVAD to induce necroptosis and treated with or without 30 μM Nec-1 as a control. After 12h treatment or infection, cell viability measured by ATP levels using CellTiter-Glo kit. Data in (a and d) are representative of three independent experiments. Data in (b, c, e, f, g, h, i, j and k) are pooled from three independent experiments with three technical replicates each. Data are presented as mean of biological replicates ± s.d.
Extended Data Figure 3: Pyroptosis, necroptosis and apoptosis are not required for MNoV-induced cell death.
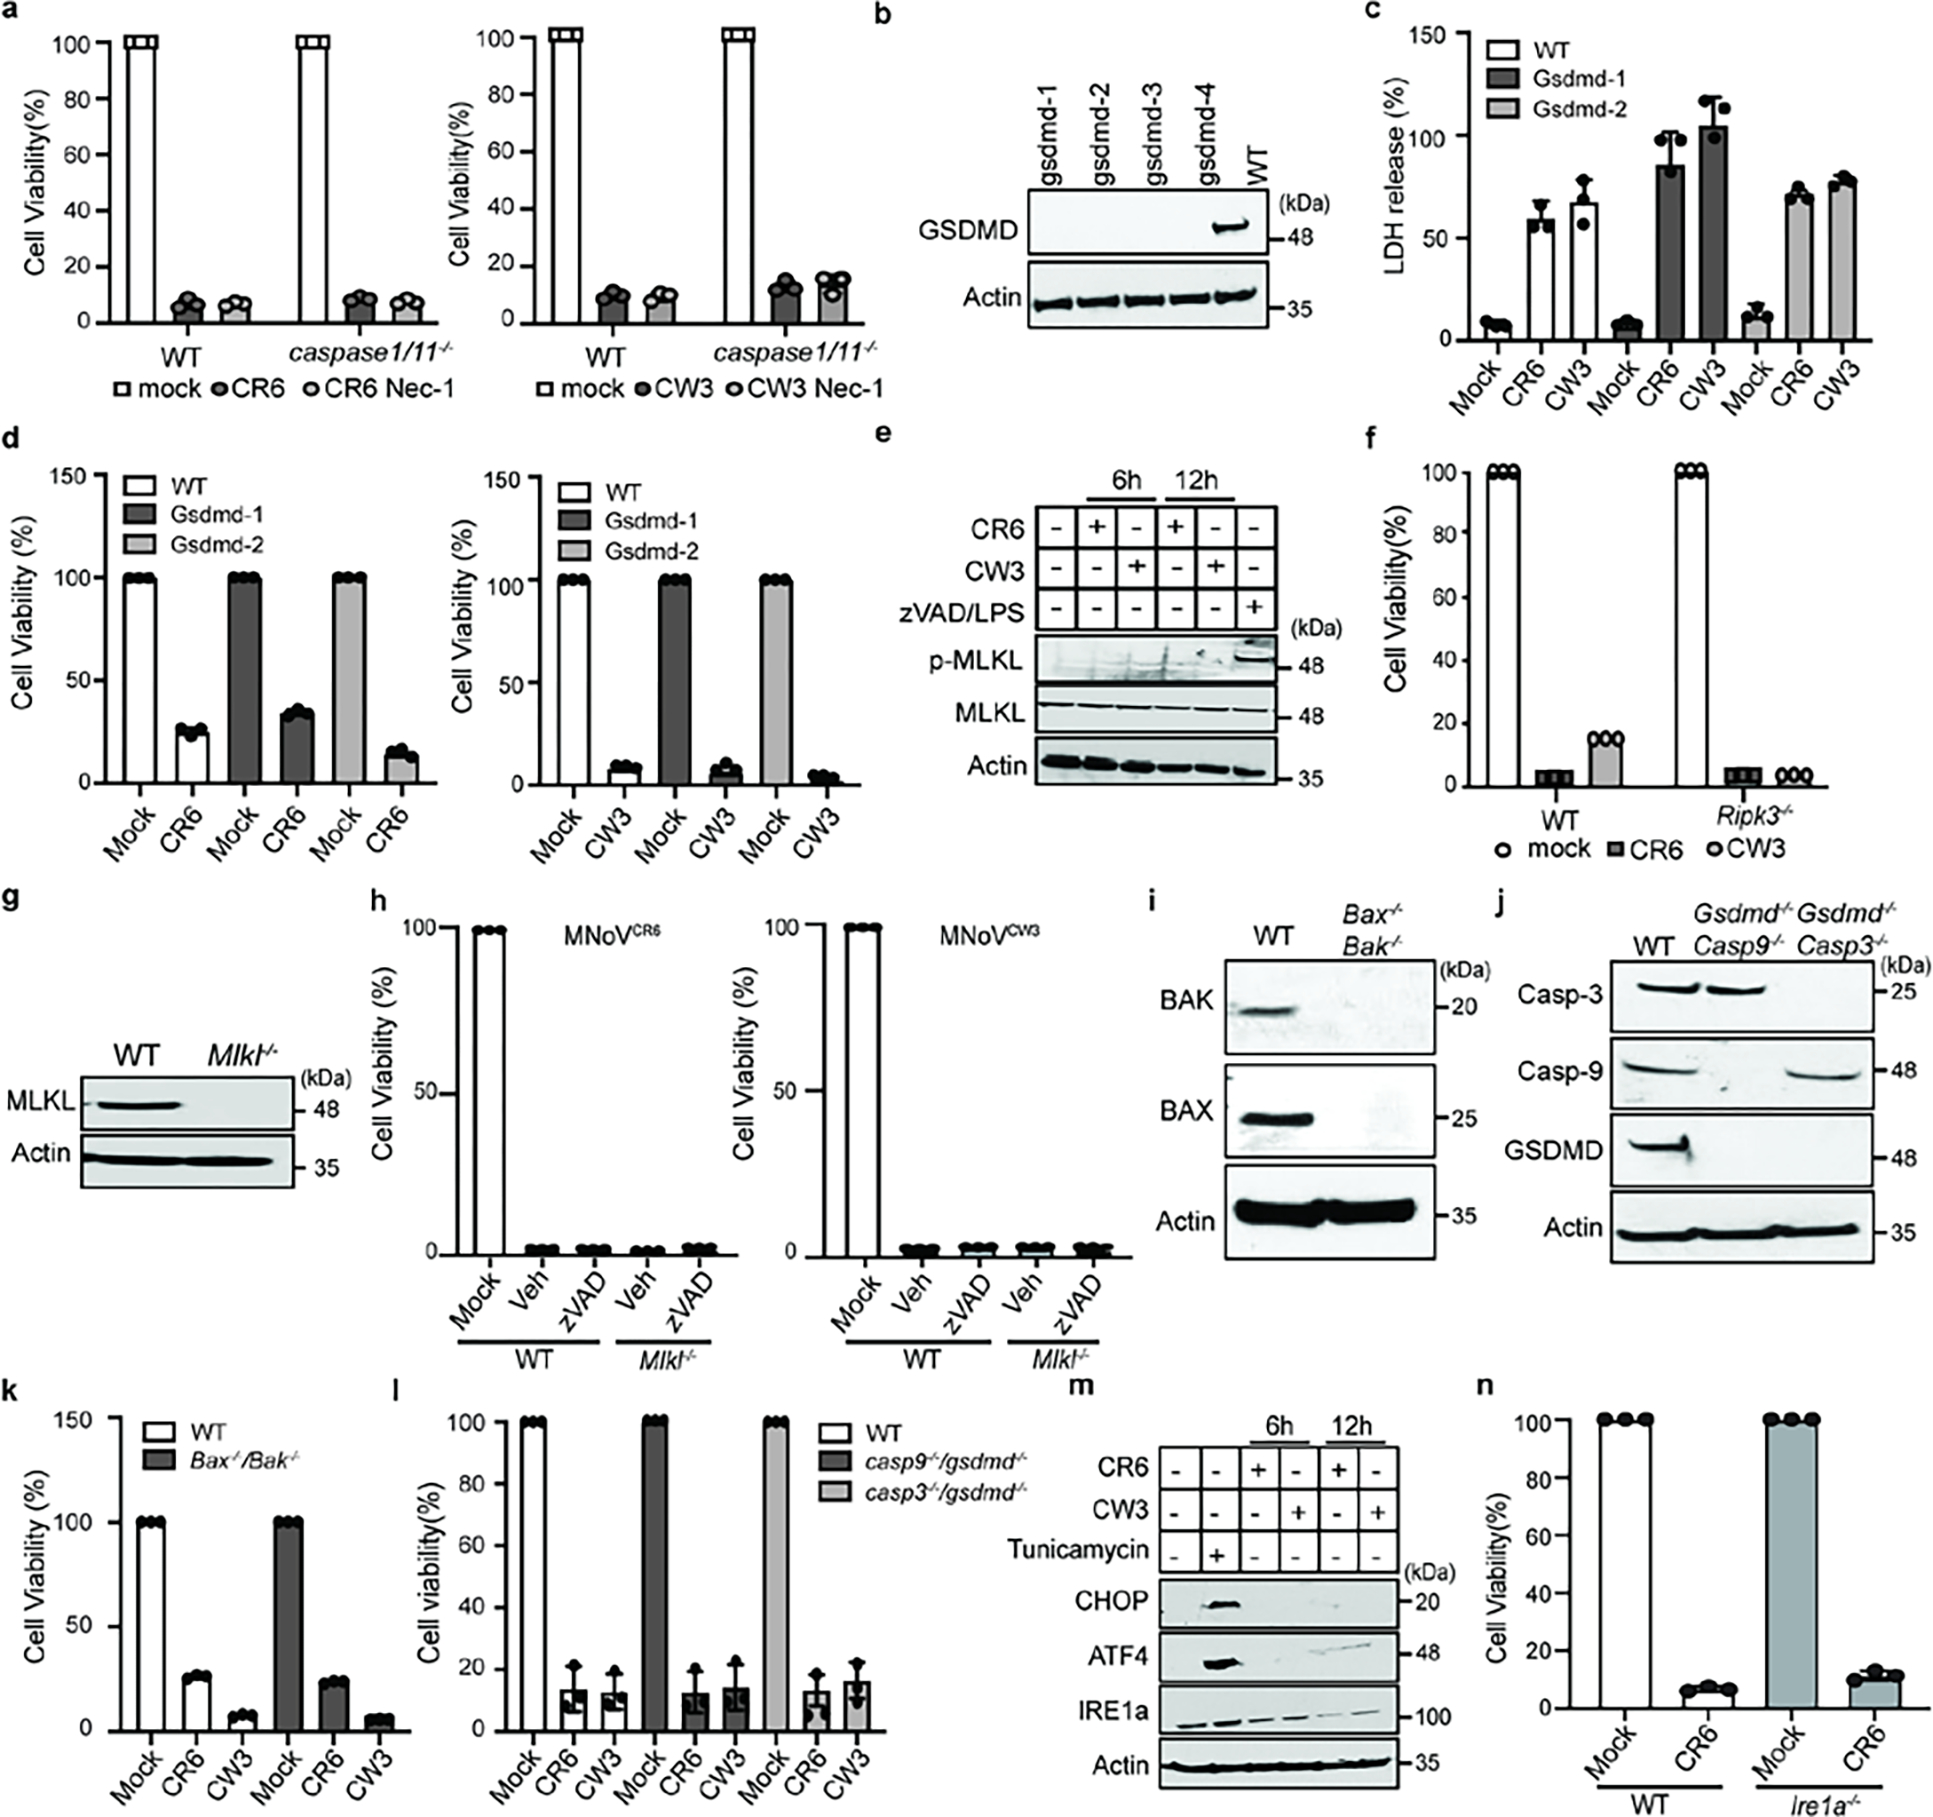
a, WT and Caspase1/11−/− BMDMs cells were treated with vehicle, 10 μM Nec-1 and infected with MNoVCW3 and MNoVCR6 at a MOI of 1 for 24 h. Cell viability measured by ATP levels. b, GSDMD was deleted from BV2 cells by CRISPR genome editing. GSDMD expression levels in WT and four different clones of knockout BV2 cells. Lysates of indicated cells were blotted with anti-GSDMD antibody and anti-actin antibodies. c, Comparison of LDH release in WT and Gsdmd−/− cells infected with MNoVCW3and MNoVCR6 (MOI=1) for 24 h. d, Cell viability as measured by ATP levels WT and Gsdmd−/− cells infected with MNoVCW3and MNoVCR6 (MOI=1) for 24 h. e, WT BMDMs cells infected with MNoVCW3 and MNoVCR6 at a MOI of 1 or treated with 10 μM zVAD plus 100 ng/ml LPS. Lysates of indicated cells were blotted with anti-MLKL antibody, anti-pMLKL antibody and anti-actin antibodies. f, Comparison of ATP levels in MNoVCW3and MNoVCR6 (MOI=1) infected WT and Ripk3−/− cells with or without 10 μM zVAD for 24 h. g, MLKL was deleted from BV2 cells by CRISPR genome editing. Lysates of wildtype of a knockout clone of MLKL were blotted with anti-MLKL antibody and anti-actin antibodies. h, Comparison of ATP levels in MNoVCW3and MNoVCR6 (MOI=1) infected WT and Mlkl−/− cells with or without 10 μM zVAD for 24 h. i, Bax and Bak were deleted from BV2 cells by CRISPR genome editing and single cell clones were selected. Lysates of WT or knockout cells were blotted with anti-Bak, anti-Bax and anti-actin antibodies. j, Gsdmd/Caspase-3 and Gsdmd/Caspase-9 double knockout BV2 cells were made by CRISPR genome editing and single cell clones were selected. Lysates of indicated cells were blotted with indicated antibodies. k, Comparison of ATP levels in MNoVCW3 and MNoVCR6 (MOI=1) infected WT and Bax−/− / Bak−/− cells for 12 h. l, Comparison of ATP levels in MNoVCW3 and MNoVCR6 (MOI=1) infected WT, Gsdmd−/− / Caspase-3−/− and Gsdmd−/− / Caspase-9−/− cells for 12 h. m, WT BMDMs cells infected with MNoVCW3 and MNoVCR6 at a MOI of 1 or treated with 10 μg/mL Tunicamycin for 4 h. Lysates of indicated cells were blotted with anti-CHOP antibody, anti-ATF4 antibody, anti-IRE1a antibody and anti-ACTIN antibodies. n, Cell viability as measured by ATP levels WT and Ire1a−/− BV2 cells infected with MNoVCW3and MNoVCR6 (MOI=1) for 24. Data in (a, c, d, f, h, k, l and n) are pooled from three independent experiments with three technical replicates each. Data are presented as mean ± s.d. Data in (b, e, g, i, j and m) are representative of two independent experiments.
Extended Data Figure 4: Norovirus NS3 directly triggers cell death.
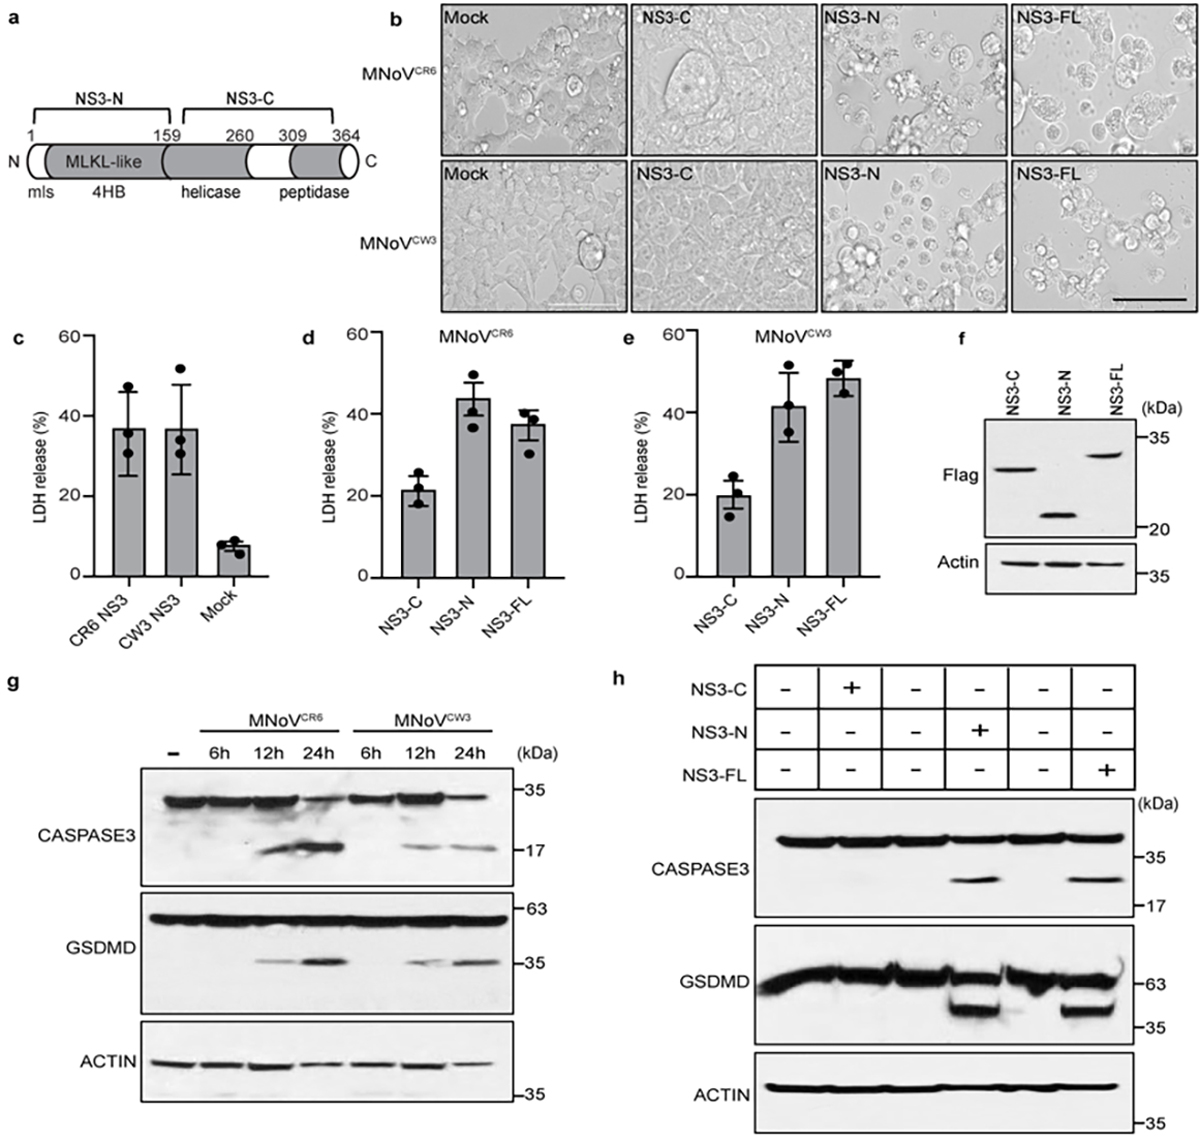
a, Schematic model of MNoV NS3. b, Representative bright-field images of HEK293T cells transfected with N-terminal Flag-tagged constructs encoding NS3-FL, NS3-N or NS3-C of MNoVCR6 or MNoVCW3. Scale bar, 100μm. c, LDH released from HEK293T cells transfected with Full-length Flag-NS3 of MNoVCR6 or MNoVCW3. d, LDH released from HEK293T cells transfected with Full-length, N- or C-terminal Flag-NS3 of MNoVCR6. e, LDH released from HEK293T cells transfected with Full-length, N- or C-terminal Flag-NS3 of MNoVCW3. f, The immunoblot shows expression of HEK293T cells transfected with Full-length, N- or C-terminal of Flag-NS3. g, Immunoblotting assays of norovirus infection-induced GSDMD and CASPASE-3 cleavage in BMDMs. BMDMs infected with MNoVCW3and MNoVCR6 (MOI=5) for 12h. h, Immunoblotting assays of GSDMD and CASPASE-3 cleavage in BV2 cells stably expressing inducible, C-terminal Flag-tagged constructs of NS3-FL, NS3-N or NS3-C of MNoVCR6 in the absence or presence doxycycline for 12h. Data in (b) are representative of three independent experiments. Data in (c, d and e) are pooled from three independent experiments with three technical replicates each. Data are presented as mean of biological replicates ± s.d. Data in (f, g and h) are representative of two independent experiments.
Extended Data Figure 5: MNoV and HNoV NS3 N-terminal domain directly triggers cell death in multiple cell types.
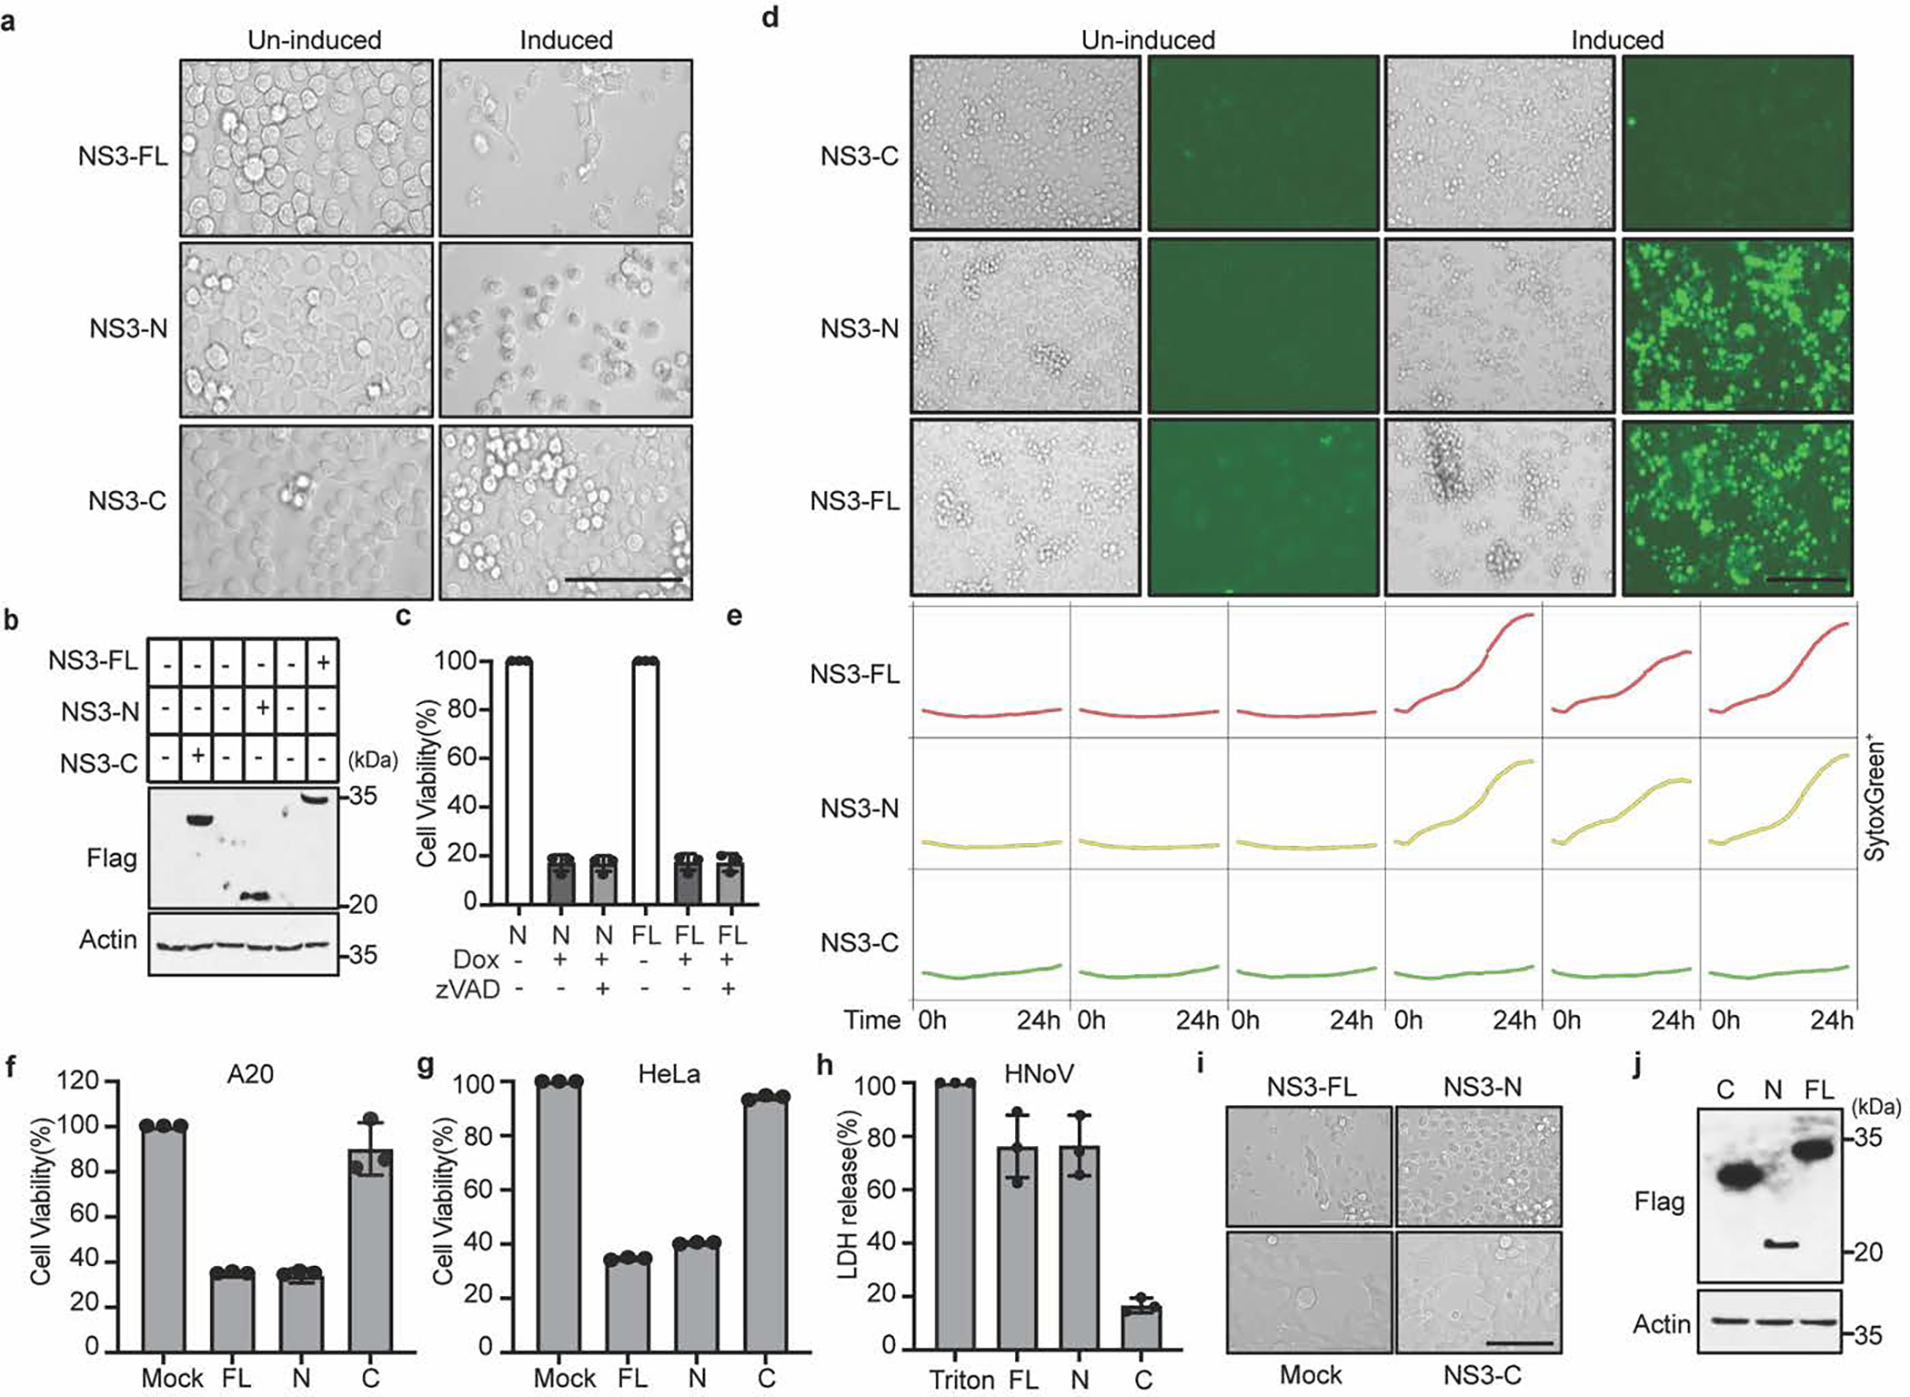
NS3-FL, NS3-N or NS3-C fused with C-terminal Flag tag were stably expressed in BV2 cells under a tetracycline-inducible promoter. Protein expression was induced with doxycycline treatment. a, Representative bright-field images of BV2 cells stably expressing inducible constructs in the absence or presence doxycycline for 12 h. Scale bar, 100μm. b, Immunoblot of NS3 with anti-Flag antibody in the absence or presence doxycycline for 12 h. c, Cytotoxicity of BV2 cells expressing inducible constructs after doxycycline addition with or without 20 μM zVAD for 12 h. d, Representative Incucyte images of SytoxGreen-stained stably BV2 cells after doxycycline addition for 24 h. Scale bar, 200μm. e, BV2 cells expressing inducible constructs of NS3-FL, NS3-N and NS3-C. The time-course Incucyte quantification of SytoxGreen-positive cells in the absence or presence doxycycline. f, g, N-terminal Flag-tagged constructs encoding NS3-FL, NS3-N or NS3-C from MNoVCR6 were transfected into A20 B cells (f) and HeLa cells (g). Cell death was determined by ATP-based cell viability assay 24 h after transfection. h, LDH released from HEK293T cells transfected with N-terminal Flag-tagged constructs encoding NS3-FL, NS3-N or NS3-C of HNoV MD145. i, Representative bright-field images of HEK293T cells transfected with N-terminal Flag-tagged constructs encoding NS3-FL, NS3-N or NS3-C of HNoV MD145. Scale bar, 100μm. j, The immunoblot shows expression of transfected FL-, N- or C-NS3 of MD145. Data in (a, b, d, e, i and j) are representative of three independent experiments. Data in (c, f, g and h) are pooled from three independent experiments with three technical replicates each. Data are presented as mean of biological replicates ± s.d.
Extended Data Figure 6: Subcellular localization prediction of NS3 and AlphaFold prediction of NS3 and mouse MLKL N-terminal domain.
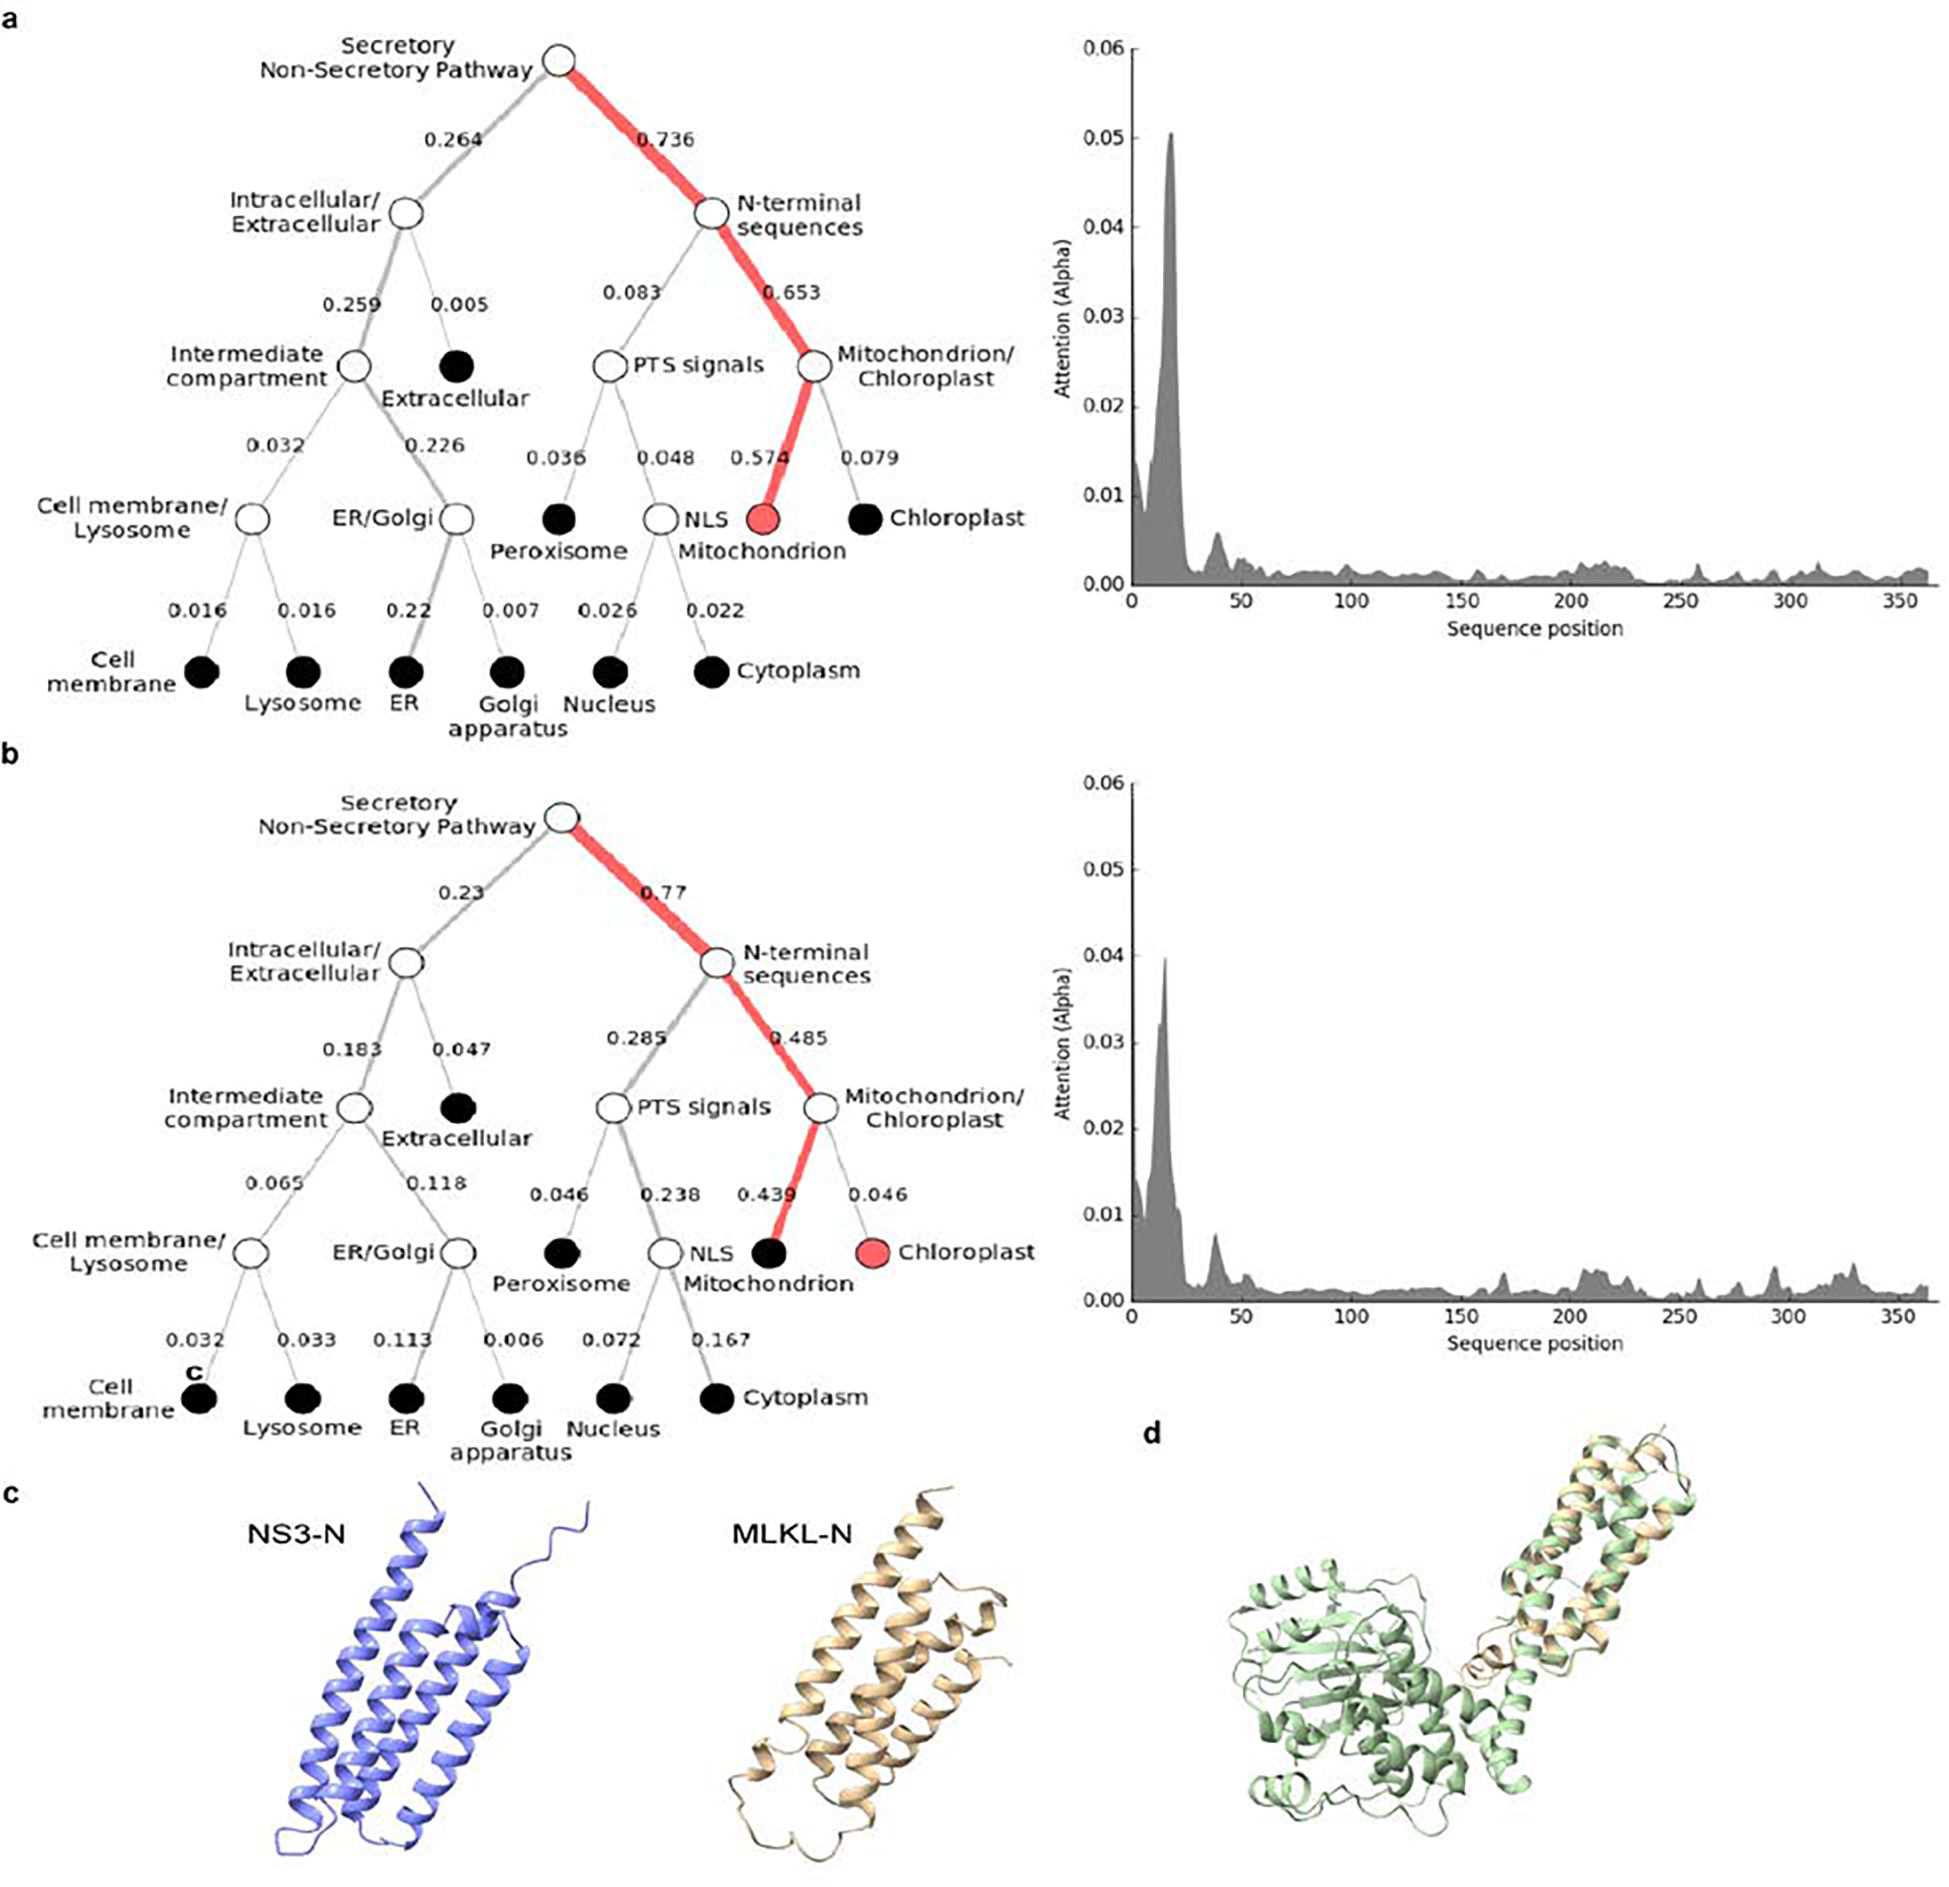
DeepLoc prediction server revealed that full-length NS3 of (a) HNoV and (b) MNoV have high probability for mitochondrial localization. c, 3D structures of 4HB domain of NS3 (25–158aa) and mouse MLKL (1–125aa) derived from AlphaFold. d, Side views of the structure of mouse MLKL (1–125aa), predicted by AlphaFold, was superimposed on mouse MLKL structure previously reported26.
Extended Data Figure 7: Expanded alignment of cellular and viral 4HB domain sequences.
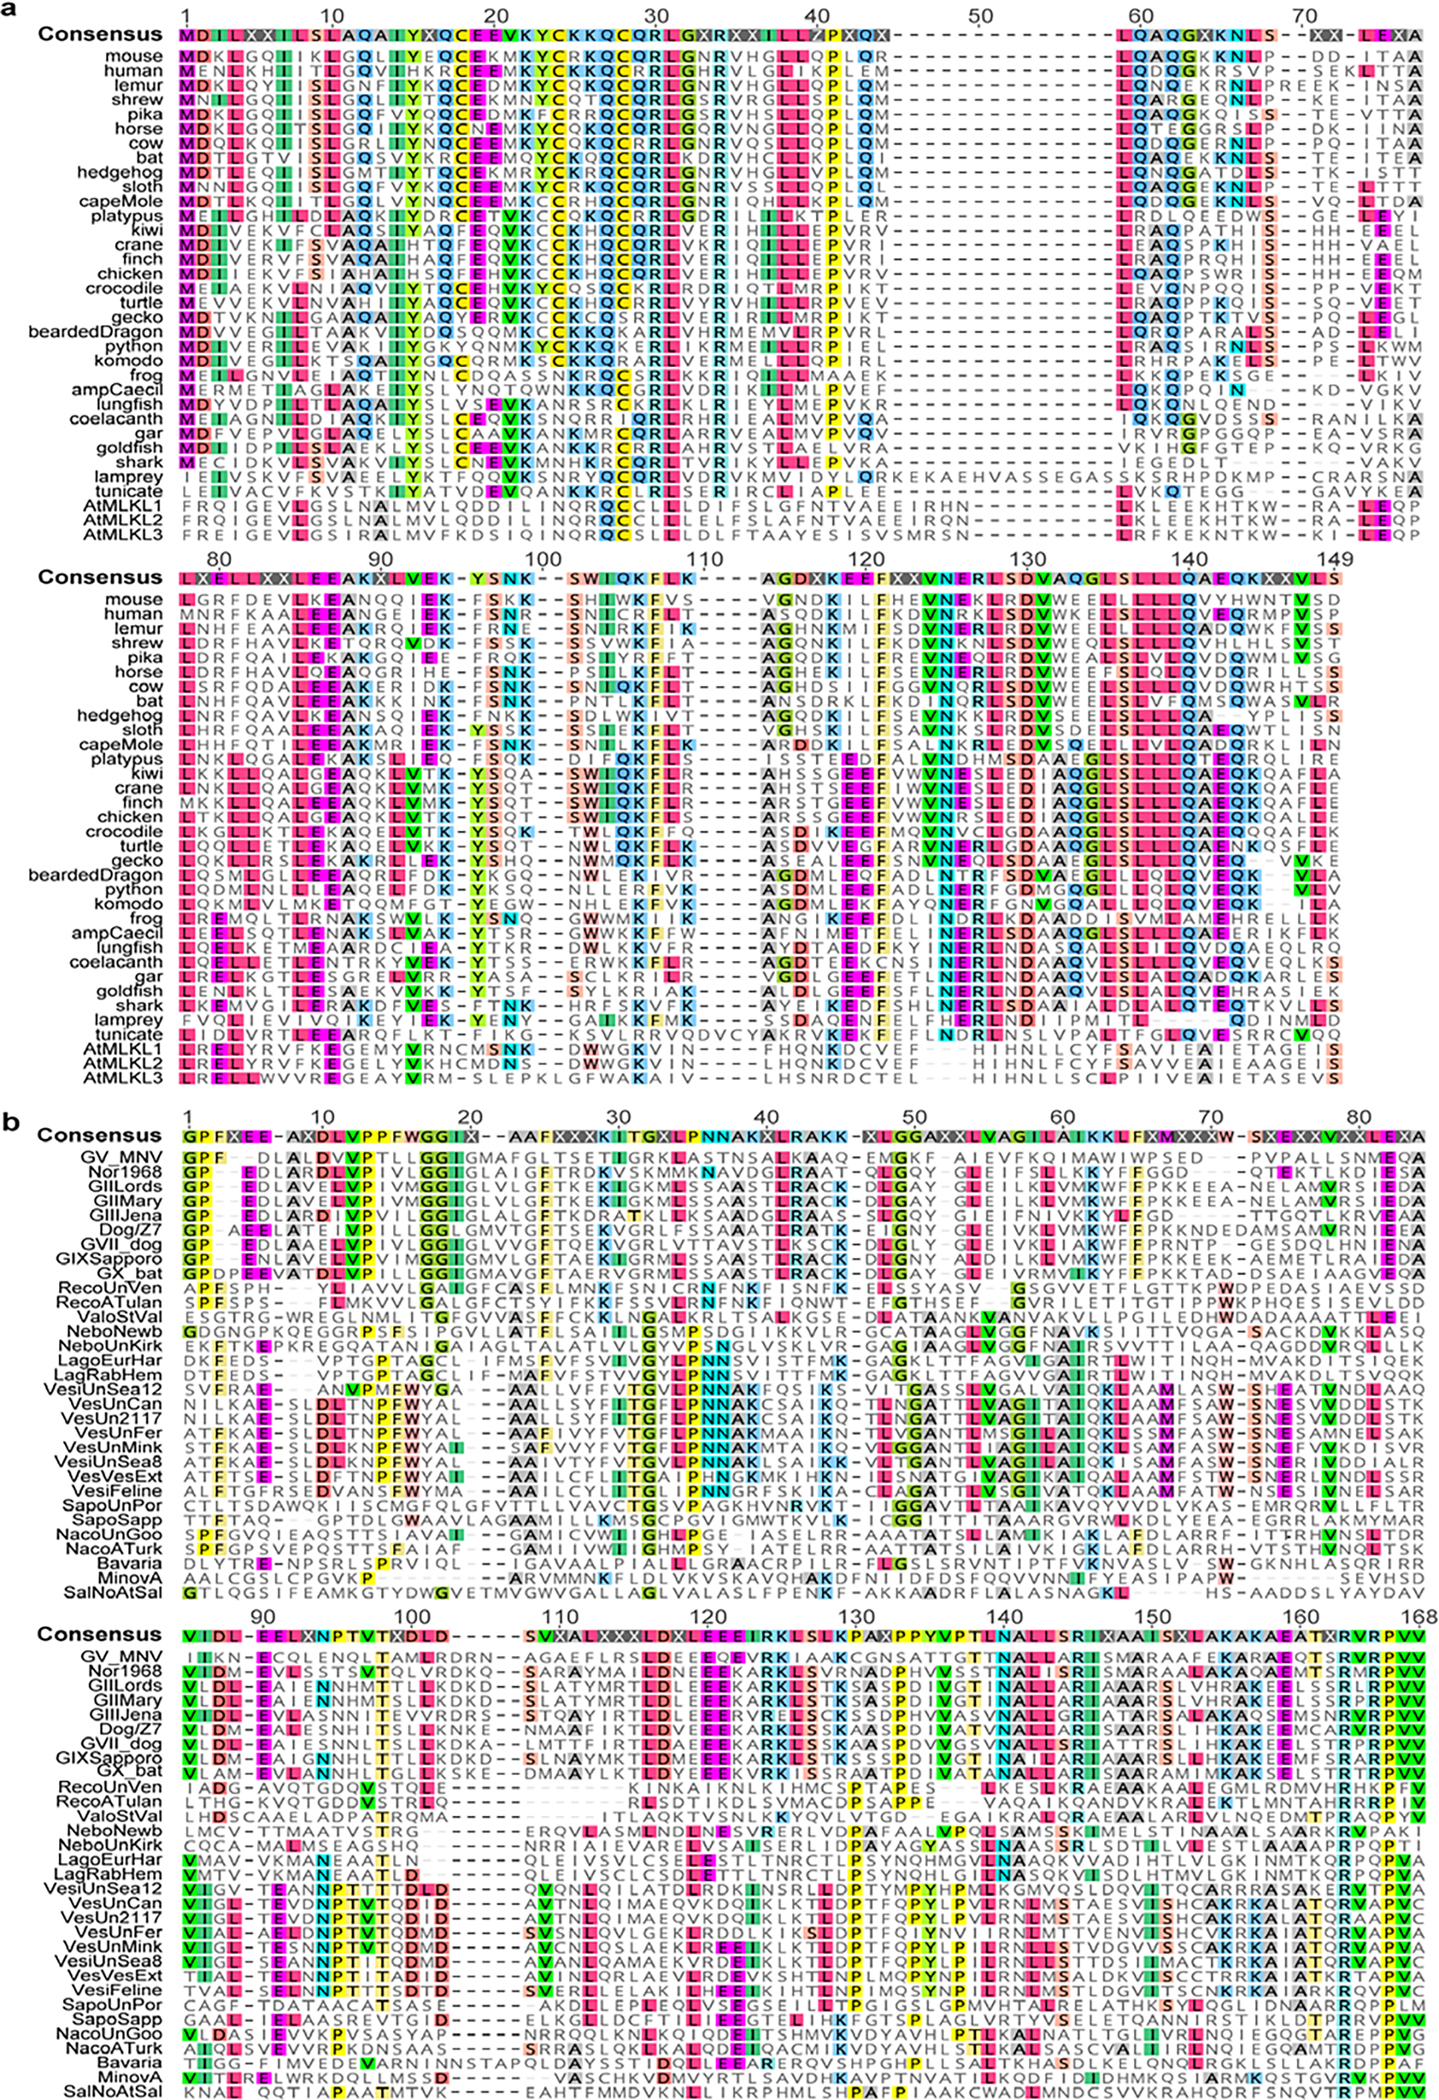
a, Sequences of cellular MLKL 4HB domains were retrieved from NCBI. Accession numbers are present in supplemental table. Sequences were aligned using MUSCLE in Geneious Prime. Residues matching consensus are colored. b, NS3 N-terminus amino acid multiple sequence alignment (residues 1–158 relative to MNoV) for thirty-one calicivirus species including representatives from norovirus genogroups. Sequences were retrieved from NCBI. Viral species and strains were selected based on ICTV. Accession numbers are present in supplemental table. Sequences were aligned using MUSCLE in Geneious Prime. Residues matching consensus are colored.
Extended Data Figure 8. Expanded alignment of cellular and calicivirus 4HB domain sequences.
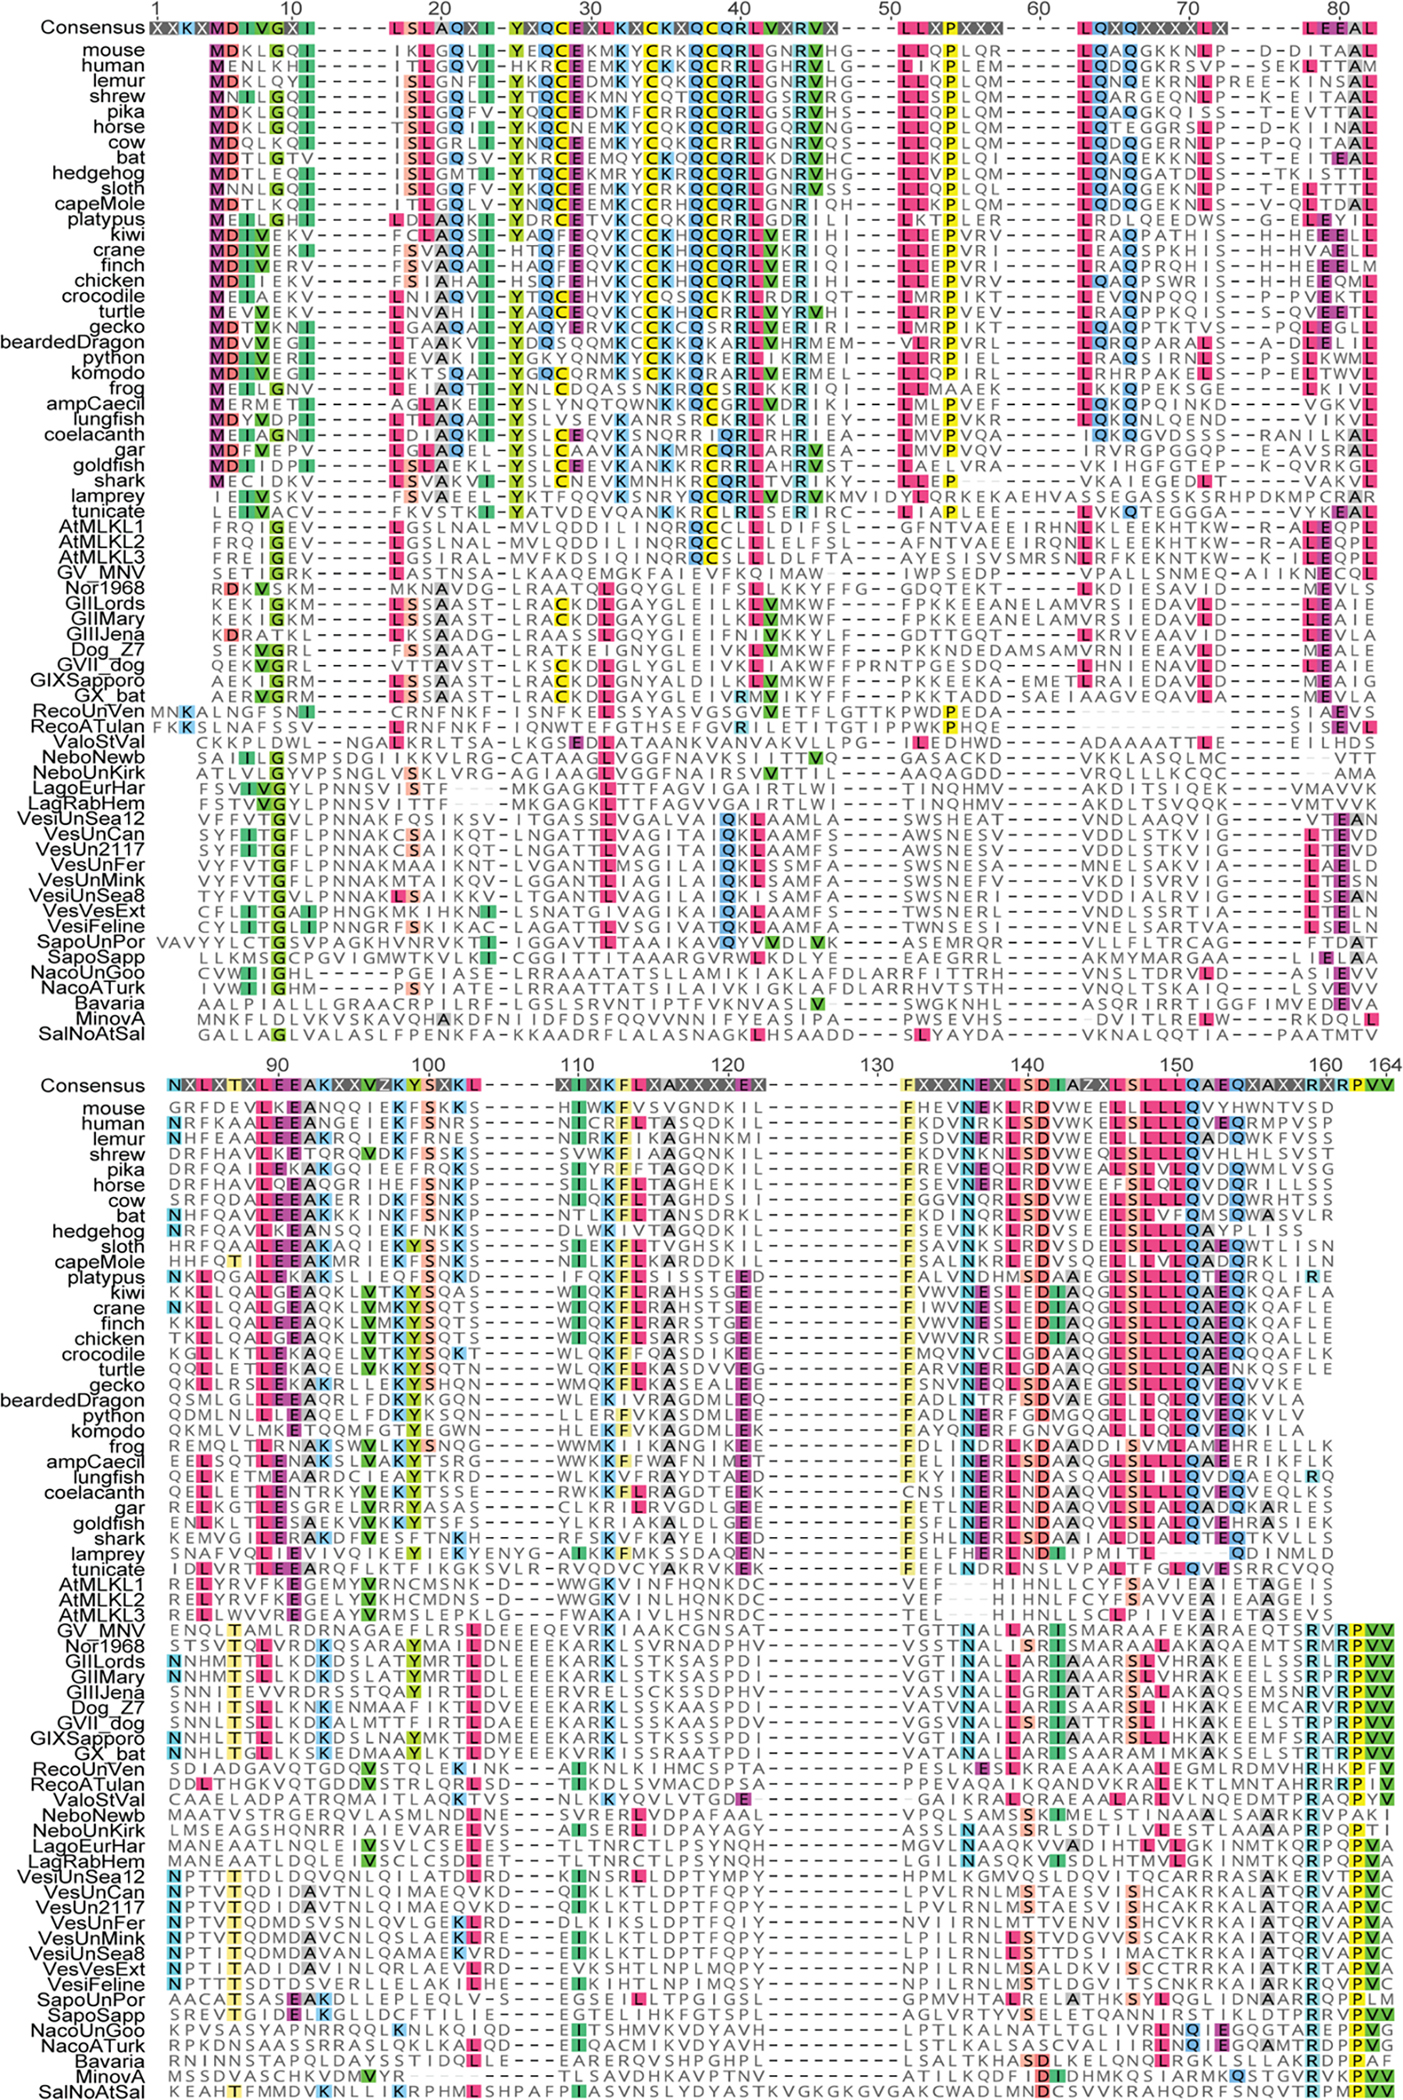
Sequences were retrieved from NCBI. Viral species and strains were selected based on ICTV. Accession numbers are present in supplemental table. Sequences were aligned using MUSCLE in Geneious Prime. Residues matching consensus are colored.
Extended Data Figure 9: MNoV infection and expression Full-length or N-terminal NS3 of MNoV altered mitochondria membrane potential and increased mitochondrial ROS abundance.
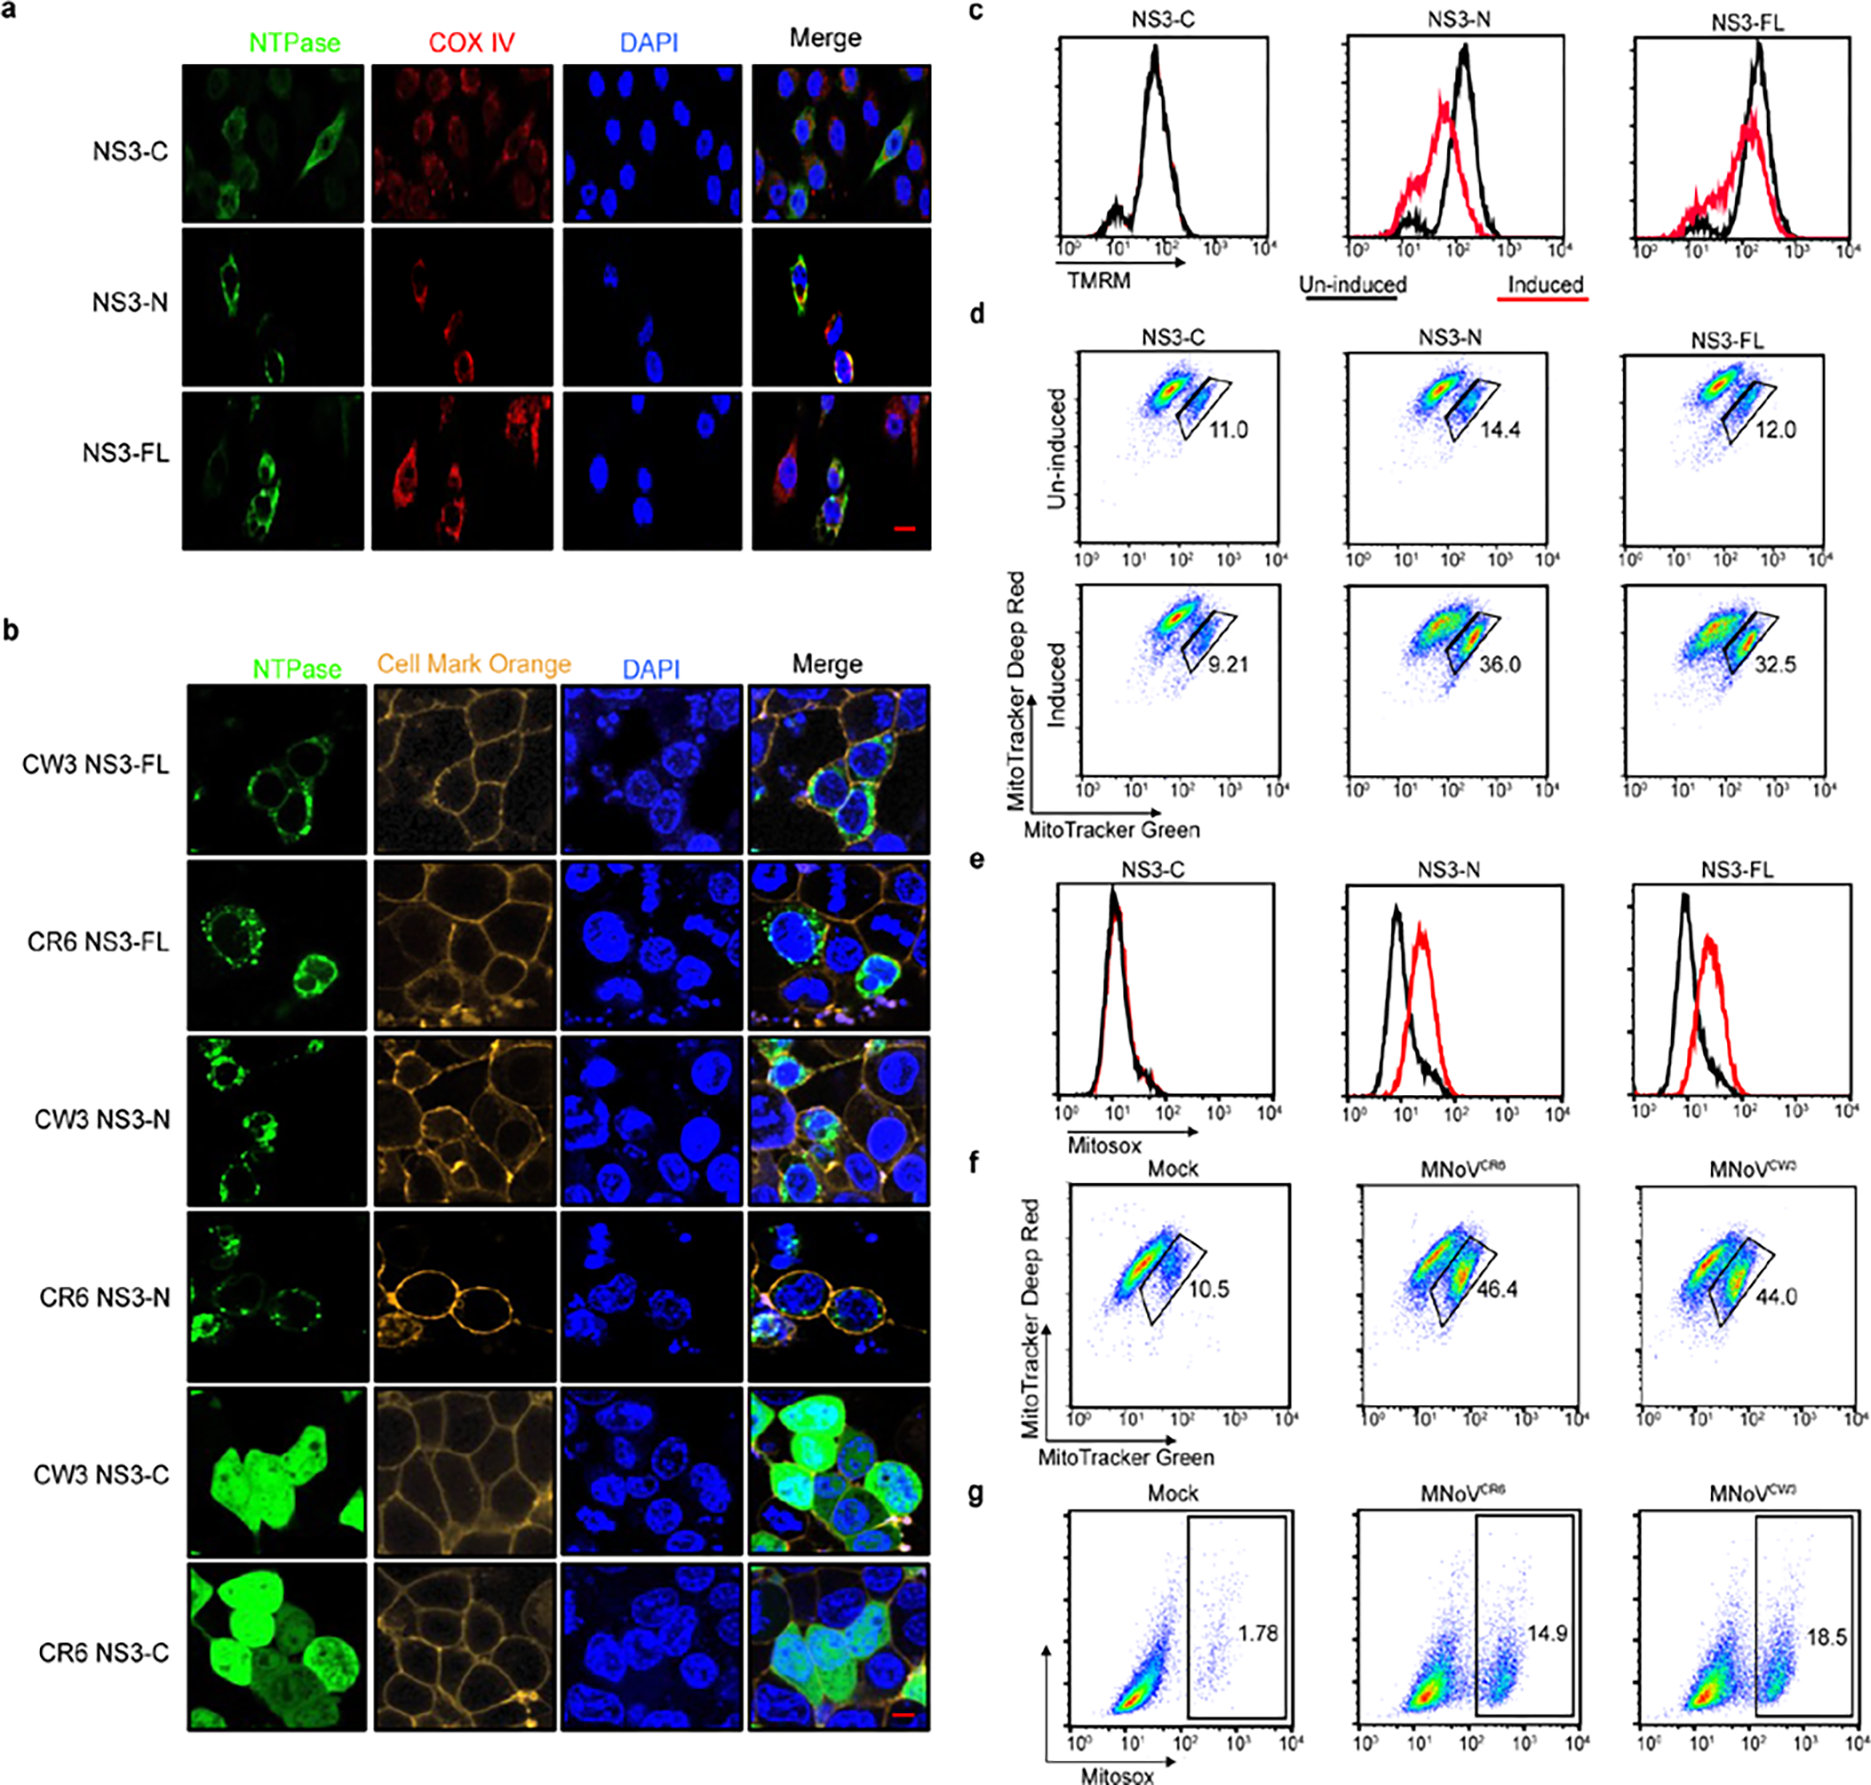
a, Representative confocal imaging of BV2 cells stably expressing inducible constructs of MNoVCR6 NS3-FL, NS3-N and NS3-C in the presence doxycycline for 10 h. Flag-tagged proteins (green) were detected by immunofluorescence with mitochondrial marker COX IV (red). Scale bar, 10μm. b, Representative microscopy imaging of NS3 subcellular localization in HEK293T cells. C-terminal Flag-tagged NS3-FL, NS3-N and NS3-C transfected HEK293T cells, the distribution of NS3 (green) was detected by immunofluorescence with cellular membrane marker (yellow). Scale bar, 5μm. (c-e) Full-length, N- or C-terminal of NS3 fused to a C-terminal Flag tag were stably expressed in BV2 cells under a tetracycline-inducible promoter. Doxycycline was used to induce NS3-FL, NS3-N and NS3-C expression. c, Flow cytometric analysis of mitochondrial membrane potential (Ψm) in the absence (black) or presence (red) of doxycycline measured by TMRM fluorescence. d, Flow cytometric analysis of mitochondrial status in the absence or presence doxycycline. Gates represent cells with damaged mitochondria. e, Flow cytometric analysis of mitochondrial ROS in the absence (black) or presence (red) of doxycycline. f, Flow cytometric analysis of mitochondrial status in macrophages infected with MNoVCW3and MNoVCR6 at a MOI of 5 for 12 h. Gates represent cells with damaged mitochondria. g, Flow cytometric analysis of mitochondrial ROS in macrophages infected with MNoVCW3 and MNoVCR6 at a MOI of 5 for 12 h. Data in (a, b) are representative of two independent experiments. Data in (c-g) are representative of two independent experiments with three technical replicates of each condition.
Extended Data Figure 10: Purification of recombinant MNoV NS3-FL and NS3-N, and evidence of self-association and formation of size-selective pores.
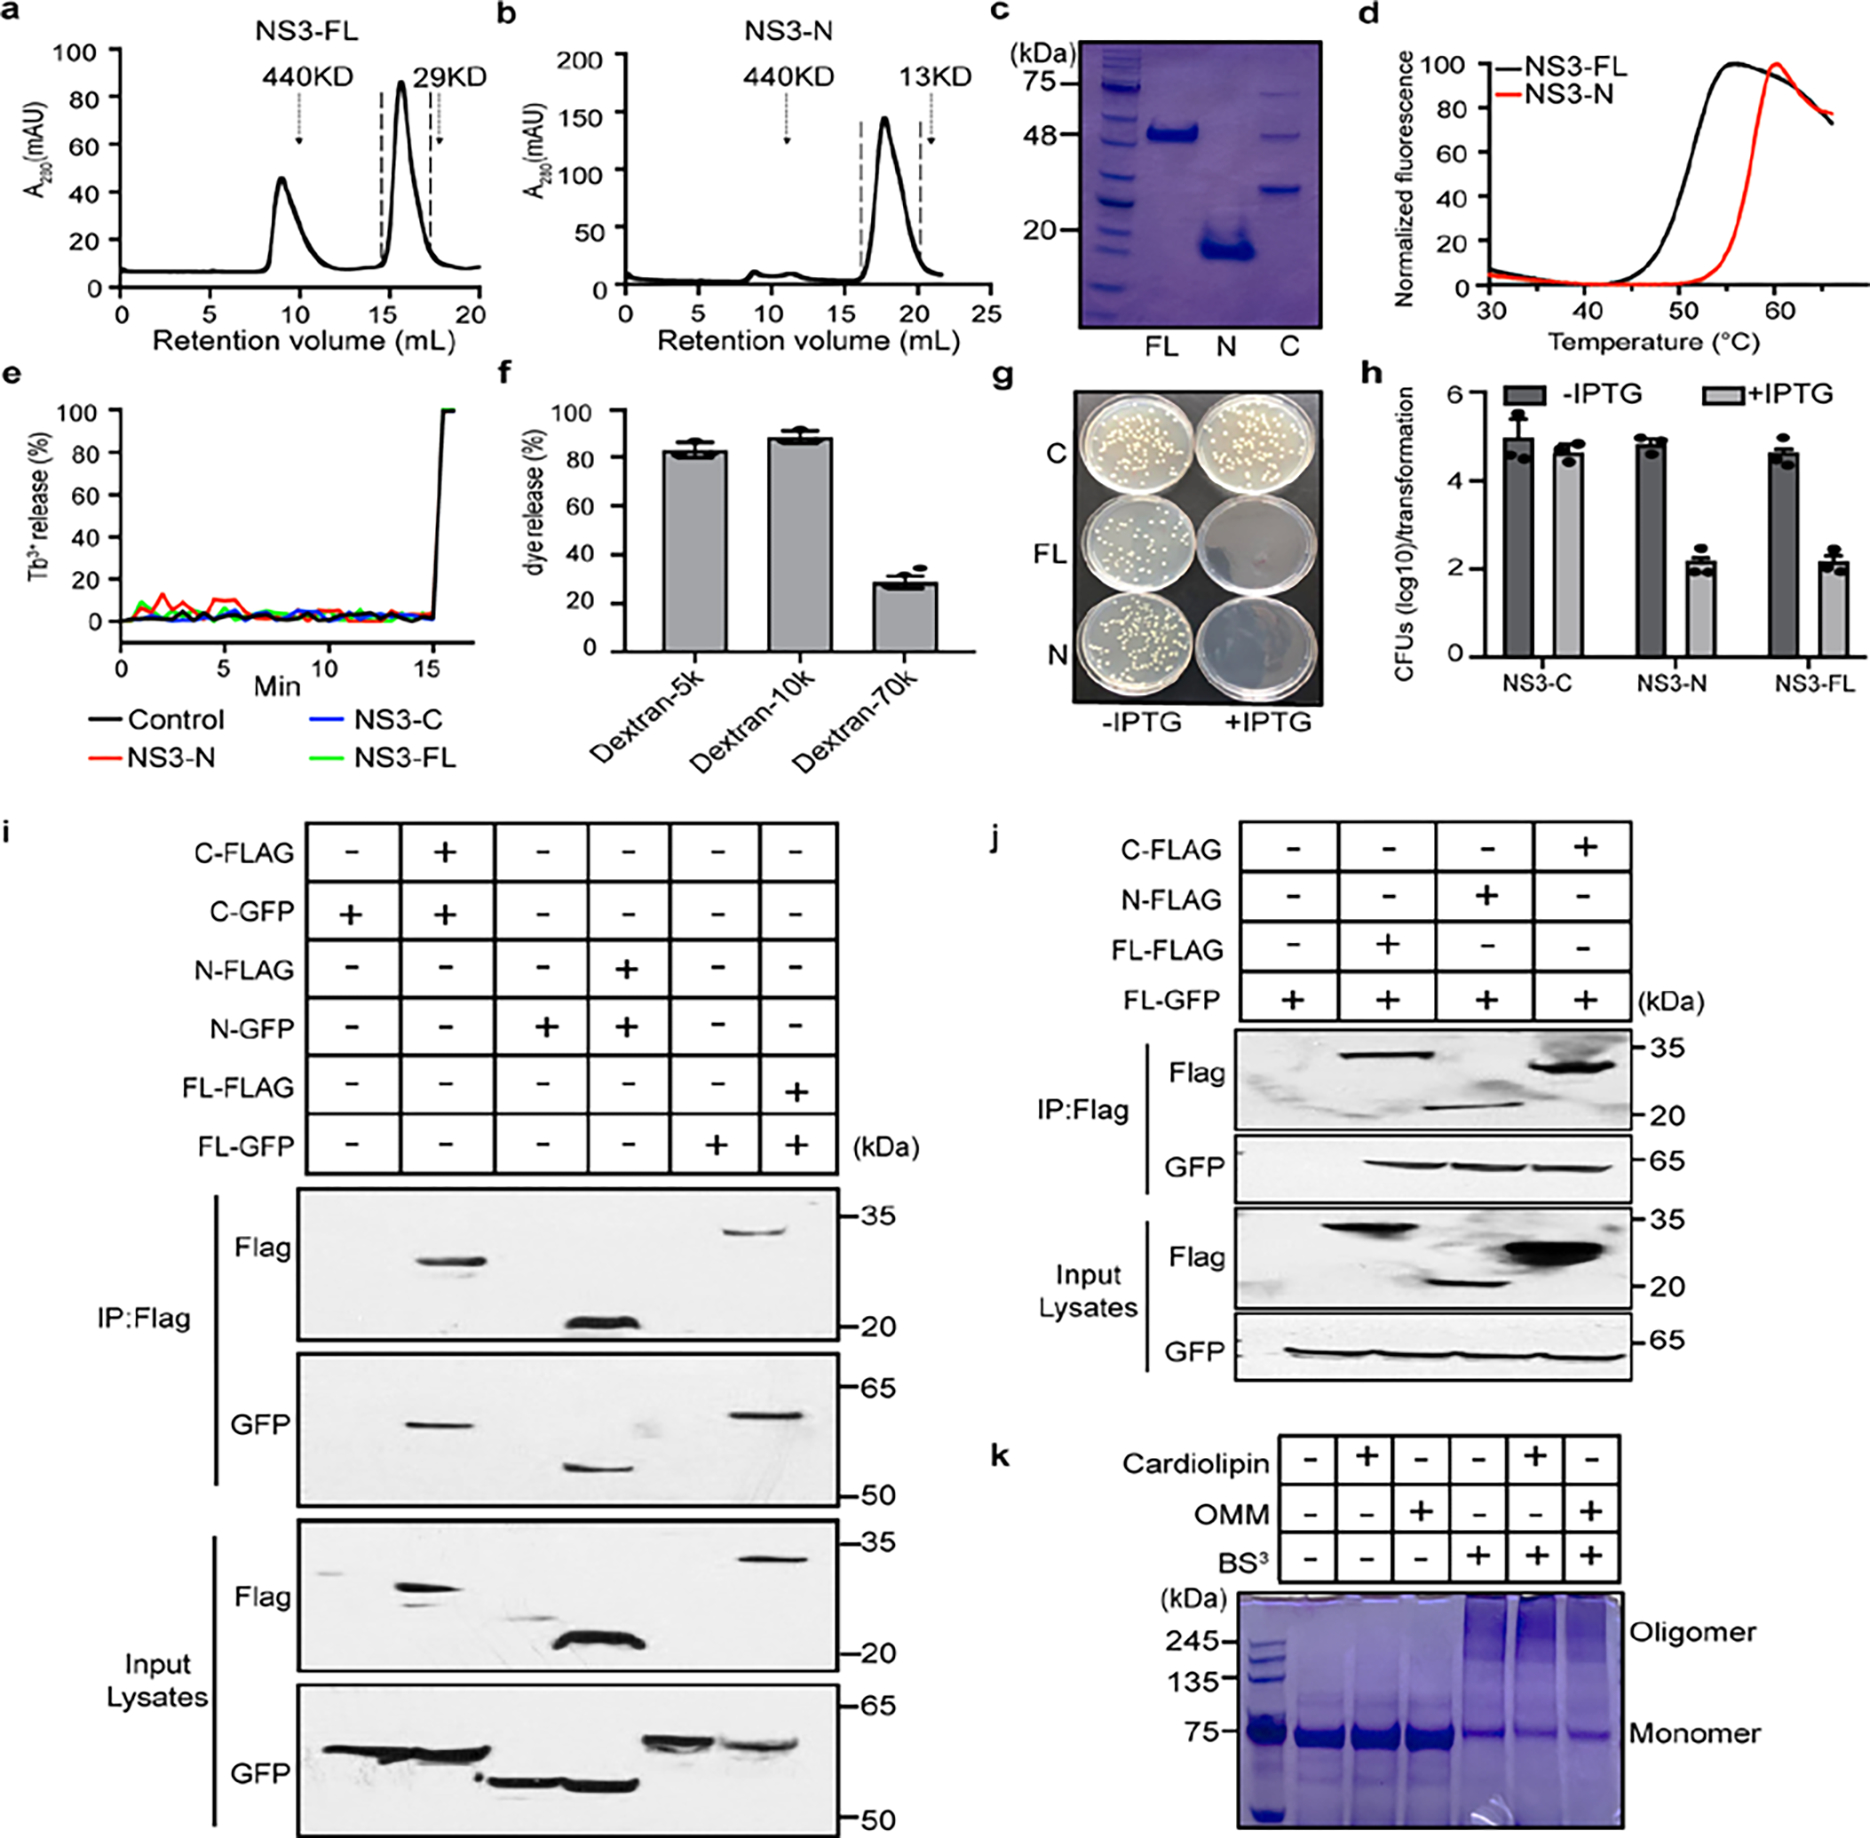
a-c, NS3-FL and NS3-N expressing His6-MBP tag were affinity purified by amylose resin. The His6-MBP tag was cleaved and the protein was further purified with Ni2+ resin, followed by size-exclusion chromatography of the purified NS3-FL (a) and NS3-N (b). The second peak of each was collected and Coomassie blue-stained gel (c) is shown. d, Thermal stability shifts measured NS3-FL and NS3-N after purification. Data is representative of two independent experiments. e, Purified FL, N- or C-terminal NS3 proteins were incubated with PC liposomes. Liposome leakage was monitored by measuring DPA chelating-induced fluorescence of released Tb3+ relative to that of Triton X-100 treatment. f, Purified NS3-FL protein was incubated with varying sizes of FITC-dextran that was encapsulated in cardiolipin liposomes. Liposome leakage was measured as described in methods. g, Representative agar plates showing transformed E. coli colonies for NS3-FL, NS3-N and NS3-C. h, Bacterial colony-forming units (CFU) per transformation for NS3-FL, NS3-N and NS3-C are shown in the logarithmic form (log10). i, Flag immunoprecipitation of lysates of HEK293T cells, transfected with GFP-NS3-FL, GFP-NS3-N, GFP-NS3-C and/or Flag-NS3-FL, Flag-NS3-N, Flag-NS3-C, were analyzed by immunoblot with indicated antibodies. j, Flag immunoprecipitation of lysates of HEK293T cells, transfected with GFP-NS3-FL and/or Flag-NS3-FL, Flag-NS3-N, Flag-NS3-C, were analyzed by immunoblot with indicated antibodies. k, Oligomerization of NS3 on the liposome membrane. Full length MBP-NS3 proteins were incubated with cardiolipin or OMM liposomes and were subjected to BS3-mediated crosslinking followed by SDS-PAGE gel electrophoresis and Coomassie blue staining. Data in (a-e and g) representative of three independent experiments and in (i-k) representative of two independent experiments. Data in (f and h) are pooled from three independent experiments. Data are presented as mean ± s.d.
Extended Data Figure 11: MNoV infection induces externalization of CL.
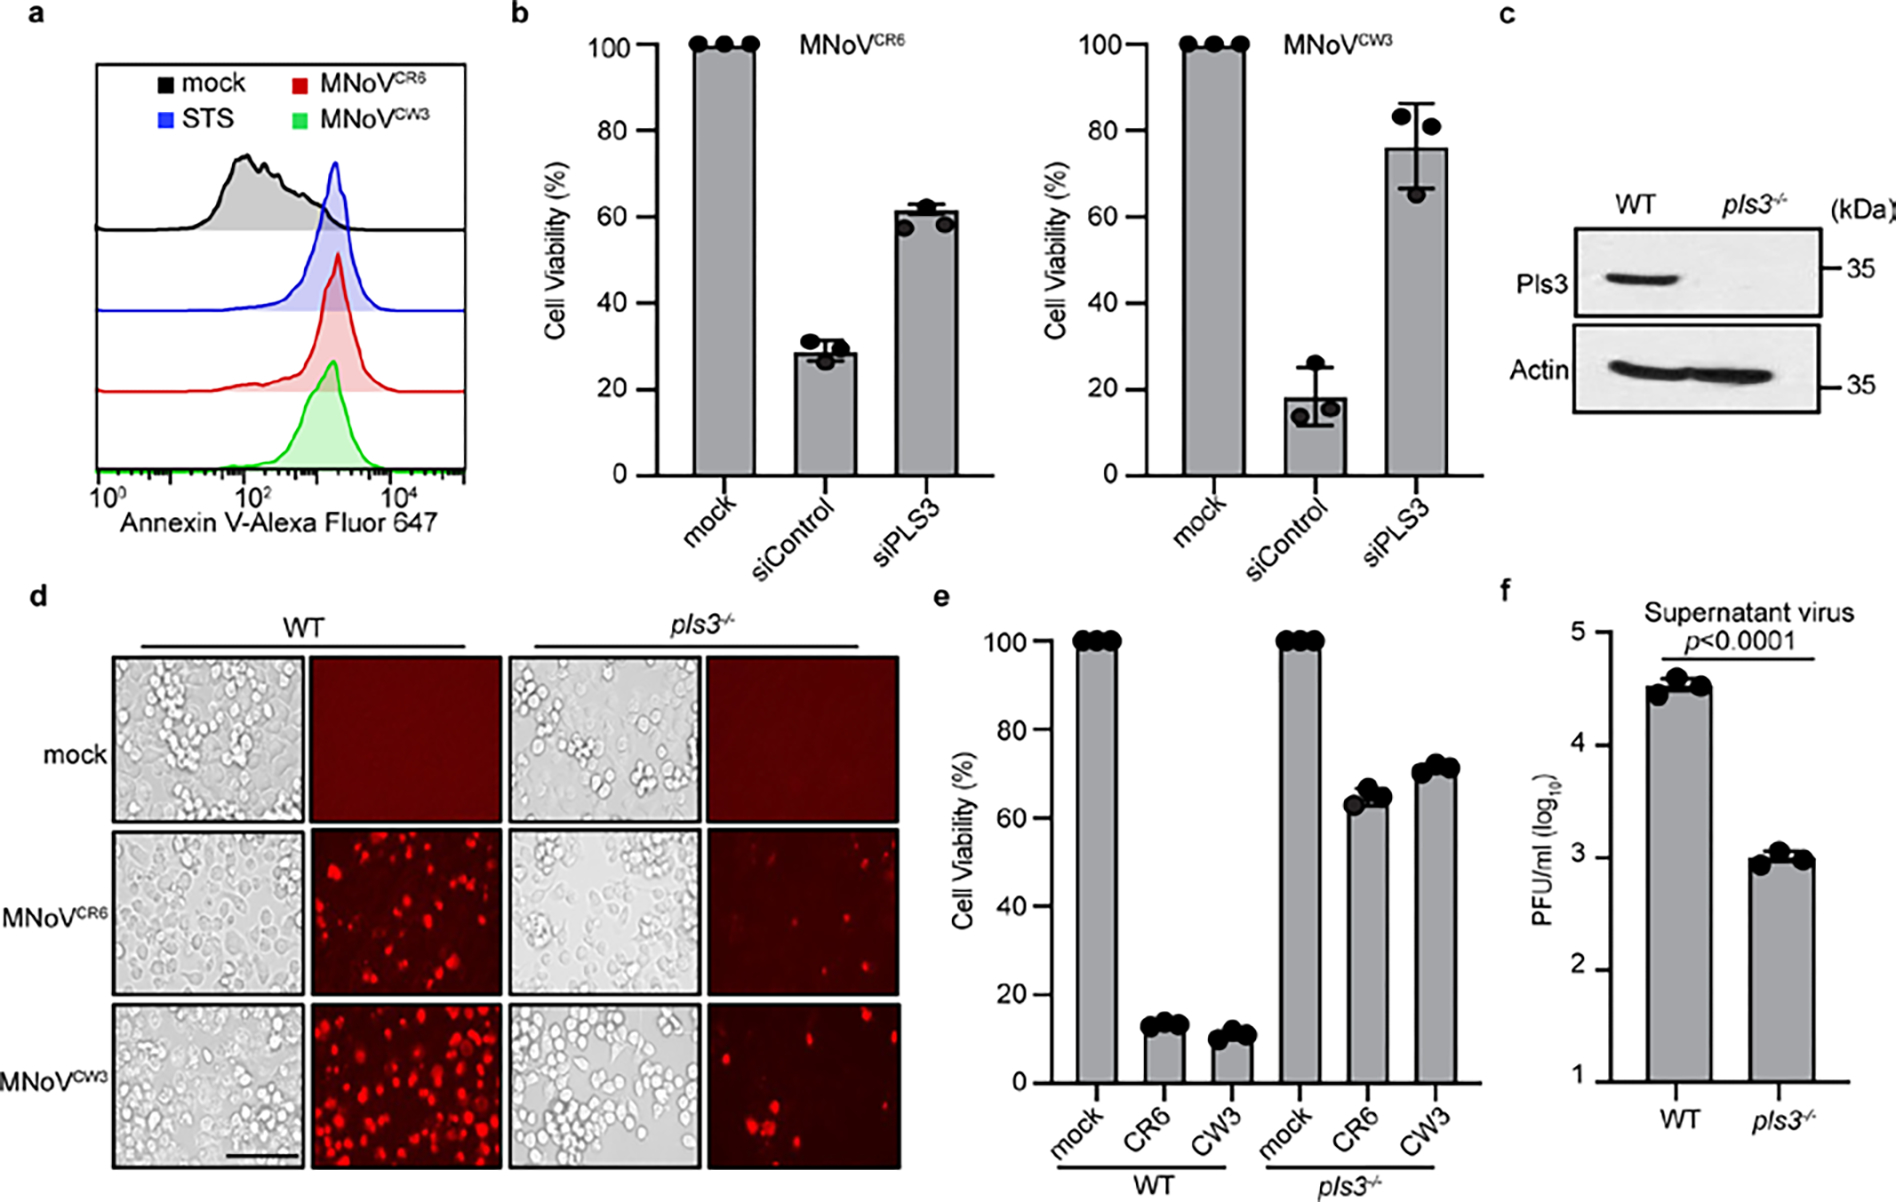
a, BV2 cells were left untreated, treated with 2μM staurosporine (STS) for 4h, or infected with MNoVCW3 and MNoVCR6 (MOI=1) for 6h. Mitochondria were isolated and stained with Annexin V-Alexa Fluor 647 and analyzed by flow cytometry. b, Comparison of ATP levels in MNoVCW3 and MNoVCR6 (MOI=0.1) infected WT and Pls3 siRNA knockdown BMDMs cells for 12h. c, Pls3 was deleted from BV2 cells by CRISPR genome editing. Lysates of WT or knockout cells were blotted with anti-PLSCR3 and anti-ACTIN antibodies. d, Representative images of MNoVCW3 and MNoVCR6 (MOI=0.1) infected WT and Pls3−/− cells for 12h. Propidium iodide (PI) was added to the cells 20 min before imaging. Scale bar, 100μm. e, Comparison of ATP levels in MNoVCW3 and MNoVCR6 (MOI=0.1) infected WT and Pls3−/− cells for 12h. f, WT and Pls3−/− BV2 cells infected with MNoVCR6 at a MOI = 0.1 for 12h and supernatant virus was measured by plaque assay. Data in (a, c and d) representative of two independent experiments. Data in (b, e and f) are pooled from three independent experiments with three technical replicates each. Data are presented as mean of biological replicates ± s.d. Data in (f) is analyzed by Mann-Whitney test.
Extended Data Figure 12: Mitochondrial localization of NS3 is essential for inducing cell death and norovirus infection.
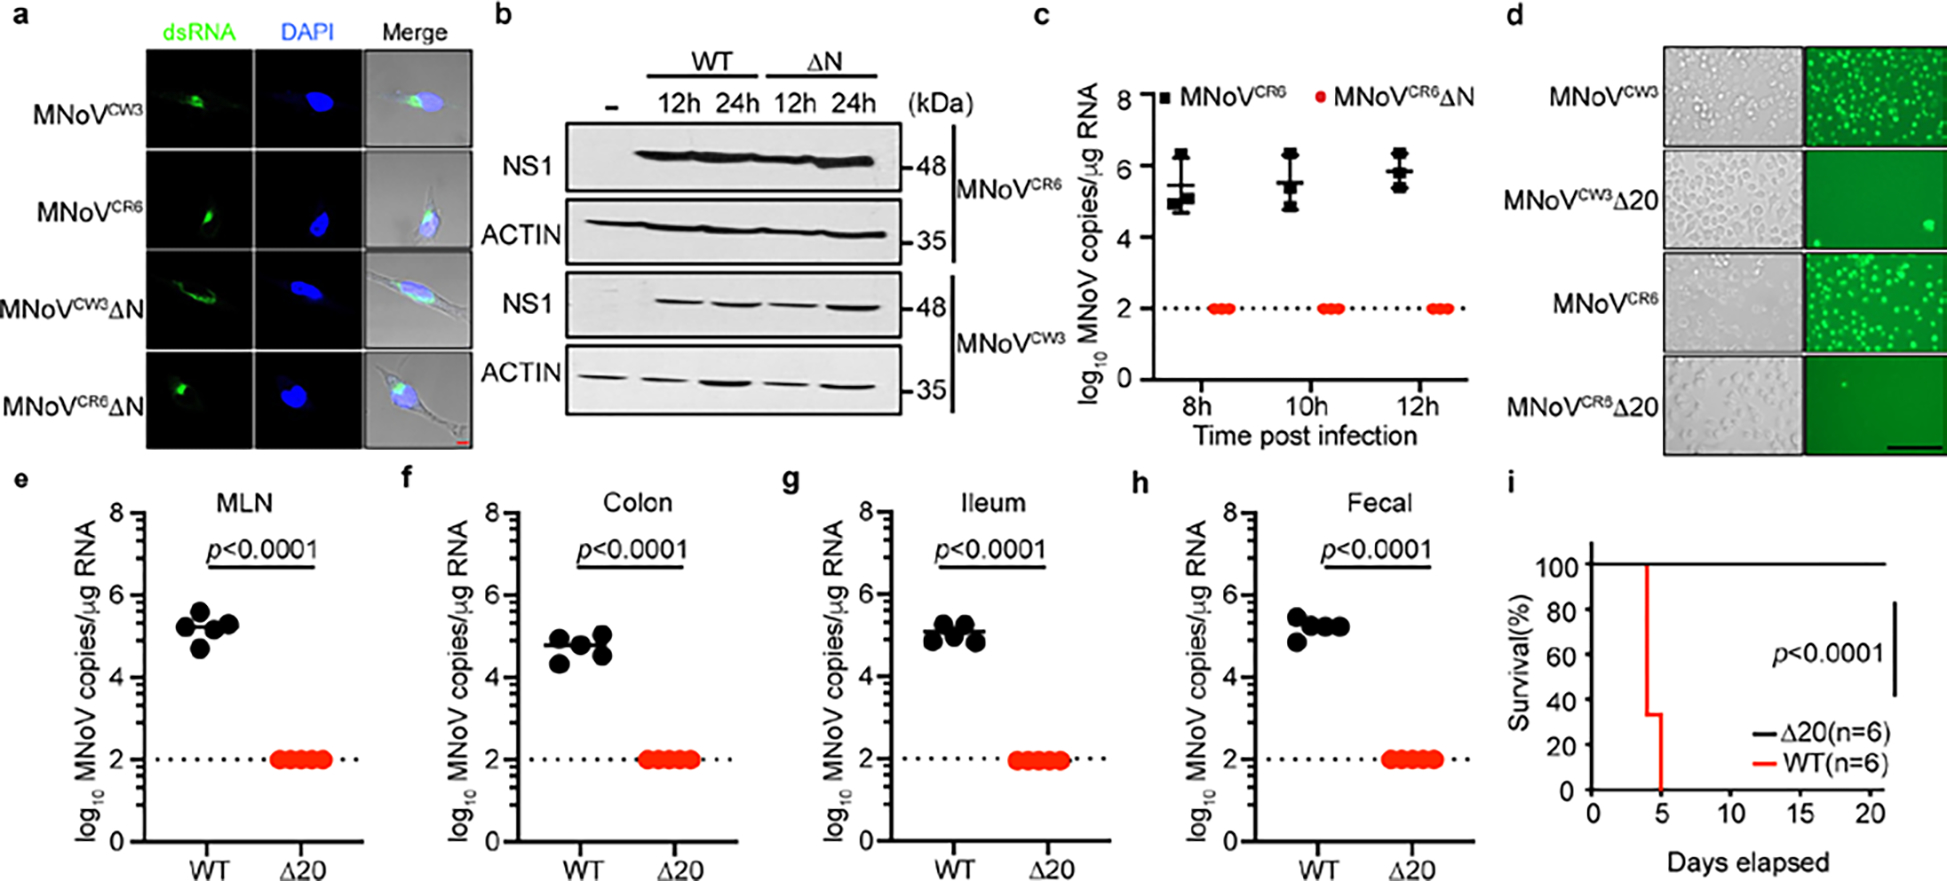
a, Representative confocal microscopy images of staining for dsRNA (green) and DAPI (blue) in BMDMs infected with WT (MNoVCW3and MNoVCR6) or mutant (MNoVCW3ΔN and MNoVCR6ΔN) virus at MOI of 5 for 12 h. Scale bar, 5μm. b, BMDMs derived from wild-type mice were infected with WT (MNoVCW3and MNoVCR6) or mutant (MNoVCW3ΔN and MNoVCR6ΔN) viruses. Cells collected at indicated time points and total cell lysates were subjected to anti-NS1 or anti-actin immunoblotting. c, BV2 cells infected with WT (MNoVCR6) and mutant (MNoVCR6ΔN) MNoV at MOI=1 and viral genomes that were in the supernatant were quantified by qPCR. N=8 for all groups. d, Representative images of Sytox-Green-stained BV2 cells infected with WT (MNoVCR6 and MNoVCW3) and mutant (MNoVCR6ΔN20 and MNoVCW3ΔN20). Scale bar, 100μm. (e-h) WT mice were challenged with 106 PFU of MNoVCR6 or MNoVCR6ΔN20 perorally. All mice survived infection. Viral genomes were quantified in the (e) MLN, (f) colon, (g) ileum, (h) feces at 7 days post infection. N=5 for both groups. Dashed line represents the limit of detection. (i) Survival of Stat1−/− mice after challenge with 106 PFU of MNoVCW3 (n=6) and MNoVCW3ΔN20 (n=6). Data in (a, b and d) are representative of two independent experiments. Data in (c) represents three independent experiments. Data are presented as mean ± s.d. Data in (e-h) pooled from two independent experiments. Statistical analysis was conducted using Mann-Whitney test. P-value for (i) was calculated with a log-rank (Mantel-Cox) test.
Supplementary Material
Acknowledgements
The authors thank Z. G. Wang for providing the pLVX-TRE3G vector; J. Rizo-Rey, Z. G. Wang and K. Yang for helpful discussions and technical assistance; and members of the Reese laboratory for technical assistance. T.A.R. is supported by grants from the NIH (R01AI130020-01A1, U19AI142784), CPRIT (RP200118), and the Pew Scholars Program. D.C.H. is funded by a 1R35GM142689-01 and a Recruitment of First-Time, Tenure-Track Faculty from Cancer Prevention & Research Institute of Texas Award (RR 170047).
Footnotes
Competing interests
The authors declare no competing interests.
Additional information
Supplementary information The online version contains supplementary material available at https://doi.org/10.1038/s41586-023-05851-w.
Reporting summary
Further information on research design is available in the Nature Portfolio Reporting Summary linked to this article.
Peer review information
Nature thanks the anonymous reviewer(s) for their contribution to the peer review of this work. Peer review reports are available.
Reprints and permissions information is available at http://www.nature.com/reprints.
Data availability
All data are available in the main paper, supplementary information and via figshare https://doi.org/10.6084/m9.figshare.21586098. All reagents are available from the authors under a material transfer agreement with University of Texas Southwestern Medical Center. Source data are provided with this paper.
References:
- 1.Karst SM, Wobus CE, Goodfellow IG, Green KY & Virgin HW Advances in norovirus biology. Cell Host Microbe 15, 668–680 (2014). [DOI] [PMC free article] [PubMed] [Google Scholar]
- 2.Glass RI, Parashar UD & Estes MK Norovirus gastroenteritis. New Engl J Medicine 361, 1776–1785 (2009). [DOI] [PMC free article] [PubMed] [Google Scholar]
- 3.Karst SM & Tibbetts SA Recent advances in understanding norovirus pathogenesis: norovirus pathogenesis. J Med Virol 88, 1837–1843 (2016). [DOI] [PMC free article] [PubMed] [Google Scholar]
- 4.Elde NC & Malik HS The evolutionary conundrum of pathogen mimicry. Nat Rev Microbiol 7, 787–797 (2009). [DOI] [PubMed] [Google Scholar]
- 5.Jorgensen I, Rayamajhi M & Miao EA Programmed cell death as a defence against infection. Nat Rev Immunol 17, 151–164 (2017). [DOI] [PMC free article] [PubMed] [Google Scholar]
- 6.Jorgensen I & Miao EA Pyroptotic cell death defends against intracellular pathogens. Immunol Rev 265, 130–142 (2015). [DOI] [PMC free article] [PubMed] [Google Scholar]
- 7.McFadden N et al. Norovirus Regulation of the Innate Immune Response and Apoptosis Occurs via the Product of the Alternative Open Reading Frame 4. Plos Pathog 7, e1002413 (2011). [DOI] [PMC free article] [PubMed] [Google Scholar]
- 8.Furman LM et al. Cysteine protease activation and apoptosis in Murine norovirus infection. Virol J 6, 139–139 (2009). [DOI] [PMC free article] [PubMed] [Google Scholar]
- 9.Bok K, Prikhodko VG, Green KY & Sosnovtsev SV Apoptosis in murine norovirus-infected RAW264.7 cells is associated with downregulation of survivin. J Virol 83, 3647–3656 (2009). [DOI] [PMC free article] [PubMed] [Google Scholar]
- 10.Dubois H et al. Nlrp3 inflammasome activation and Gasdermin D-driven pyroptosis are immunopathogenic upon gastrointestinal norovirus infection. Plos Pathog 15, e1007709 (2019). [DOI] [PMC free article] [PubMed] [Google Scholar]
- 11.Santiana M et al. Vesicle-cloaked virus clusters are optimal units for inter-organismal viral transmission. Cell Host Microbe 24, 208–220.e8 (2018). [DOI] [PMC free article] [PubMed] [Google Scholar]
- 12.Kayagaki N et al. NINJ1 mediates plasma membrane rupture during lytic cell death. Nature 591, 131–136 (2021). [DOI] [PubMed] [Google Scholar]
- 13.Wobus CE et al. Replication of norovirus in cell culture reveals a tropism for dendritic cells and macrophages. Plos Biol 2, e432 (2004). [DOI] [PMC free article] [PubMed] [Google Scholar]
- 14.Degterev A et al. Chemical inhibitor of nonapoptotic cell death with therapeutic potential for ischemic brain injury. Nat Chem Biol 1, 112–119 (2005). [DOI] [PubMed] [Google Scholar]
- 15.Hildebrand JM et al. Activation of the pseudokinase MLKL unleashes the four-helix bundle domain to induce membrane localization and necroptotic cell death. Proc National Acad Sci 111, 15072–15077 (2014). [DOI] [PMC free article] [PubMed] [Google Scholar]
- 16.Sun L et al. Mixed lineage kinase domain-like protein mediates necrosis signaling downstream of RIP3 kinase. Cell 148, 213–227 (2012). [DOI] [PubMed] [Google Scholar]
- 17.Yen J-B et al. Identification and Characterization of Human Norovirus NTPase Regions Required for Lipid Droplet Localization, Cellular Apoptosis, and Interaction with the Viral P22 Protein. Microbiol Spectr 9, e00422–21 (2021). [DOI] [PMC free article] [PubMed] [Google Scholar]
- 18.Yen J-B et al. Subcellular localization and functional characterization of GII.4 norovirus-encoded NTPase. J Virol 92, e01824–17 (2018). [DOI] [PMC free article] [PubMed] [Google Scholar]
- 19.Han KR et al. Nucleotide triphosphatase and RNA chaperone activities of murine norovirus NS3. J Gen Virol 99, 1482–1493 (2018). [DOI] [PMC free article] [PubMed] [Google Scholar]
- 20.Li T-F et al. Human norovirus NS3 has RNA helicase and chaperoning activities. J Virol 92, e01606–17 (2018). [DOI] [PMC free article] [PubMed] [Google Scholar]
- 21.Cotton BT et al. The norovirus NS3 protein is a dynamic lipid- and microtubule-associated protein involved in viral RNA replication. J Virol 91, e02138–16 (2017). [DOI] [PMC free article] [PubMed] [Google Scholar]
- 22.Thorne LG & Goodfellow IG Norovirus gene expression and replication. J Gen Virol 95, 278–291 (2014). [DOI] [PubMed] [Google Scholar]
- 23.Campillay-Véliz CP et al. Human norovirus proteins: implications in the replicative cycle, pathogenesis, and the host immune response. Front Immunol 11, 961 (2020). [DOI] [PMC free article] [PubMed] [Google Scholar]
- 24.Jones MK et al. Enteric bacteria promote human and mouse norovirus infection of B cells. Science 346, 755–759 (2014). [DOI] [PMC free article] [PubMed] [Google Scholar]
- 25.Wang H et al. Mixed lineage kinase domain-like protein MLKL causes necrotic membrane disruption upon phosphorylation by RIP3. Mol Cell 54, 133–146 (2014). [DOI] [PubMed] [Google Scholar]
- 26.Murphy JM et al. The Pseudokinase MLKL Mediates Necroptosis via a Molecular Switch Mechanism. Immunity 39, 443–453 (2013). [DOI] [PubMed] [Google Scholar]
- 27.Green KY et al. A predominant role for norwalk-like viruses as agents of epidemic gastroenteritis in maryland nursing homes for the elderly. J Infect Dis 185, 133–146 (2002). [DOI] [PMC free article] [PubMed] [Google Scholar]
- 28.Armenteros JJA, Sønderby CK, Sønderby SK, Nielsen H & Winther O DeepLoc: prediction of protein subcellular localization using deep learning. Bioinformatics 33, 3387–3395 (2017). [DOI] [PubMed] [Google Scholar]
- 29.Chu CT et al. Cardiolipin externalization to the outer mitochondrial membrane acts as an elimination signal for mitophagy in neuronal cells. Nat Cell Biol 15, 1197–1205 (2013). [DOI] [PMC free article] [PubMed] [Google Scholar]
- 30.Liu J et al. Role of Phospholipid Scramblase 3 in the Regulation of Tumor Necrosis Factor-α-Induced Apoptosis. Biochemistry-us 47, 4518–4529 (2008). [DOI] [PubMed] [Google Scholar]
- 31.Yunus MA, Chung LMW, Chaudhry Y, Bailey D & Goodfellow I Development of an optimized RNA-based murine norovirus reverse genetics system. J Virol Methods 169, 112–118 (2010). [DOI] [PMC free article] [PubMed] [Google Scholar]
- 32.Nice TJ, Strong DW, McCune BT, Pohl CS & Virgin HW A single-amino-acid change in murine norovirus NS1/2 is sufficient for colonic tropism and persistence. J Virol 87, 327–334 (2012). [DOI] [PMC free article] [PubMed] [Google Scholar]
- 33.Karst SM, Wobus CE, Lay M, Davidson J & IV HWV STAT1-dependent innate immunity to a Norwalk-like virus. Science 299, 1575–1578 (2003). [DOI] [PubMed] [Google Scholar]
- 34.Rogers C et al. Gasdermin pores permeabilize mitochondria to augment caspase-3 activation during apoptosis and inflammasome activation. Nat Commun 10, 1689 (2019). [DOI] [PMC free article] [PubMed] [Google Scholar]
- 35.Bock FJ & Tait SWG Mitochondria as multifaceted regulators of cell death. Nat Rev Mol Cell Bio 21, 85–100 (2020). [DOI] [PubMed] [Google Scholar]
- 36.Evavold CL et al. Control of gasdermin D oligomerization and pyroptosis by the Ragulator-Rag-mTORC1 pathway. Cell 184, 4495–4511.e19 (2021). [DOI] [PMC free article] [PubMed] [Google Scholar]
- 37.Petrie EJ et al. Viral MLKL homologs subvert necroptotic cell death by sequestering cellular RIPK3. Cell Reports 28, 3309–3319.e5 (2019). [DOI] [PubMed] [Google Scholar]
- 38.Palmer S, Chappidi S, Pinkham C & Hancks DC Evolutionary profile for (host and viral) MLKL indicates its activities as a battlefront for extensive counteradaptation. Mol Biol Evol 38, msab256- (2021). [DOI] [PMC free article] [PubMed] [Google Scholar]
- 39.Farag NS, Breitinger U, Breitinger HG & Azizi MAE Viroporins and inflammasomes: A key to understand virus-induced inflammation. Int J Biochem Cell Biology 122, 105738–105738 (2020). [DOI] [PMC free article] [PubMed] [Google Scholar]
- 40.Nieva JL, Madan V & Carrasco L Viroporins: structure and biological functions. Nat Rev Microbiol 10, 563–574 (2012). [DOI] [PMC free article] [PubMed] [Google Scholar]
- 41.Mahdi LK et al. Discovery of a Family of Mixed Lineage Kinase Domain-like Proteins in Plants and Their Role in Innate Immune Signaling. Cell Host Microbe 28, 813–824.e6 (2020). [DOI] [PubMed] [Google Scholar]
- 42.Durbin JE, Hackenmiller R, Simon MC & Levy DE Targeted disruption of the mouse stat1 gene results in compromised innate immunity to viral disease. Cell 84, 443–450 (1996). [DOI] [PubMed] [Google Scholar]
- 43.He S et al. Receptor Interacting Protein Kinase-3 Determines Cellular Necrotic Response to TNF-α. Cell 137, 1100–1111 (2009). [DOI] [PubMed] [Google Scholar]
- 44.Ward VK et al. Recovery of infectious murine norovirus using pol II-driven expression of full-length cDNA. Proc National Acad Sci 104, 11050–11055 (2007). [DOI] [PMC free article] [PubMed] [Google Scholar]
- 45.Orchard RC et al. Discovery of a proteinaceous cellular receptor for a norovirus. Science 353, 933–936 (2016). [DOI] [PMC free article] [PubMed] [Google Scholar]
- 46.Baert L et al. Detection of murine norovirus by using plaque assay, transfection assay, and real-time reverse transcription-pcr before and after heat exposure. Appl Environ Microb 74, 543–546 (2008). [DOI] [PMC free article] [PubMed] [Google Scholar]
- 47.Hwang S et al. Murine norovirus: propagation, quantification, and genetic manipulation. Curr Protoc Microbiol 33, 15K.2.1–15K.2.61 (2014). [DOI] [PMC free article] [PubMed] [Google Scholar]
- 48.Sanjana NE, Shalem O & Zhang F Improved vectors and genome-wide libraries for CRISPR screening. Nat Methods 11, 783–784 (2014). [DOI] [PMC free article] [PubMed] [Google Scholar]
- 49.Vinjé J et al. ICTV Virus Taxonomy Profile: Caliciviridae. J Gen Virology 100, 1469–1470 (2019). [DOI] [PMC free article] [PubMed] [Google Scholar]
- 50.Jumper J et al. Highly accurate protein structure prediction with AlphaFold. Nature 596, 583–589 (2021). [DOI] [PMC free article] [PubMed] [Google Scholar]
Associated Data
This section collects any data citations, data availability statements, or supplementary materials included in this article.
Supplementary Materials
Data Availability Statement
All data are available in the main paper, supplementary information and via figshare https://doi.org/10.6084/m9.figshare.21586098. All reagents are available from the authors under a material transfer agreement with University of Texas Southwestern Medical Center. Source data are provided with this paper.


