

Abstract
The blastoid (B) and pleomorphic (P) variants of mantle cell lymphoma (MCL) are associated with aggressive clinical behavior. In this study, we collected 102 cases of B-MCL and P-MCL from untreated patients. We reviewed clinical data, analyzed morphologic features using an image analysis tool (ImageJ) and we assessed mutational and gene expression profiles. The chromatin pattern of lymphoma cells was assessed quantitatively by the pixel value. Cases of B-MCL showed a greater median pixel value with lower variation compared with P-MCL, indicating a homogeneously euchromatin-rich pattern in B-MCL. In addition, the Feret diameter of the nuclei was significantly smaller (median 6.92 vs. 8.49 µm per nucleus, P<0.001) and had a lesser degree of variation in B-MCL compared with P-MCL, indicating that B-MCL cells have smaller cells with a more monomorphic appearance. B-MCL showed a significantly higher median Ki-67 proliferation rate (60% vs. 40%, P=0.003), and affected patients had poorer overall survival compared with those with P-MCL (median overall survival: 3.1 vs. 8.8 y, respectively, P=0.038). NOTCH1 mutation was significantly more frequent in B-MCL compared with P-MCL (33% and 0%, respectively, P=0.004). Gene expression profiling showed 14 genes overexpressed in B-MCL cases and gene set enrichment assay for the overexpressed genes showed significant enrichment in the cell cycle and mitotic transition pathways. We also report a subset of MCL cases that has blastoid chromatin but a higher degree of pleomorphism in nuclear size and shape, designated here as hybrid MCL. Hybrid MCL cases had a similar Ki-67 proliferation rate, mutation profile, and clinical outcome to B-MCL and distinct from P-MCL. In summary, these data suggest biological differences between B-MCL and P-MCL cases justifying their separate designation when possible.
Key Words: mantle cell lymphoma, blastoid, pleomorphic, hybrid, mutation, gene expression profile, gene set enrichment assay
Mantle cell lymphoma (MCL) is a well-established type of mature B-cell lymphoma characterized by a monomorphic proliferation of small lymphoid cells that carry t(11;14)(q13;q32) IGH::CCND1 resulting in cyclin D1 overexpression. MCL was originally recognized by Karl Lennert and colleagues in 19731 and was designated using a variety of terms including centrocytic lymphoma (Kiel), malignant lymphoma, intermediately or poorly differentiated (Berard and Dorfman)2 and mantle zone lymphoma (Weisenburger).3 Following the discovery of t(11;14)(q13;q32) and bcl-1 rearrangements in centrocytic lymphoma4 and intermediately differentiated lymphoma,5 the term “mantle cell lymphoma” was proposed as a unifying concept in 1992 by Banks et al.6 The term “MCL” was adopted in the Revised European-American Classification of Lymphoid Neoplasms7 in 1994 and solidified subsequently in the World Health Organization (WHO) classification in 2001.
Classic cases of MCL are composed of a monomorphic proliferation of small- to medium-size lymphoid cells with slightly to markedly irregular or cleaved nuclei, at least somewhat dispersed chromatin, inconspicuous nucleoli, and scant cytoplasm. Large cells are absent or rare. With the addition of cyclin D1 expression and detection of IGH::CCND1 as tools for diagnosis, the morphologic spectrum of MCL became broader. Some MCL cases composed of small- to-medium-size lymphoid cells with finely dispersed chromatin and scant indistinct cytoplasm, reminiscent of lymphoblasts, were designated as blastoid mantle cell lymphoma (B-MCL).8,9 Another variant of MCL composed of large cells or a mixture of medium size and large cells, some of which resemble large centrocytes or centroblasts came to be known as the pleomorphic variant of mantle cell lymphoma (P-MCL).10 Both B-MCL and P-MCL are aggressive variants since they have more mitotic figures and a higher Ki-67 proliferation index and these patients have a poorer clinical outcome compared with patients with classic MCL.9,11,12
Although distinguishing classic MCL from MCL with aggressive morphology (B-MCL and P-MCL) is relatively straightforward, distinguishing cases of B-MCL from P-MCL is not always straightforward and some pathologists do not routinely attempt to distinguish these 2 variants. Furthermore, there are no clinical or molecular data available that support distinguishing these variants. Nevertheless, it seems reasonable to hypothesize that the morphologic differences between B-MCL and P-MCL may shine a light on differences in pathogenesis.
In this study, we systematically assessed cases of B-MCL and P-MCL using an image analysis tool (ImageJ) and we assessed mutational and gene expression profiles to better understand potential differences between B-MCL and P-MCL. Our data suggest biological differences between B-MCL and P-MCL and we further recognized a third group of aggressive MCL cases with hybrid features.
MATERIALS AND METHODS
Patients
We searched the archives of the Department of Hematopathology at The University of Texas MD Anderson Cancer Center, Houston, TX from July 1, 1997, through December 31, 2018, for cases of newly diagnosed, untreated MCL with blastoid or pleomorphic morphology obtained by excisional lymph node biopsy or resection of an extranodal neoplasm. Cases with classic morphology and cases of aggressive MCL transformed from classic MCL were excluded. All cases fulfilled the diagnostic criteria for B-MCL or P-MCL based on the WHO classification system including IGH::CCND1 detected by fluorescence in situ hybridization or overexpression of cyclin D1. Clinical and laboratory data were collected by searching the electronic medical records. This study was conducted in accordance with the Declaration of Helsinki and was approved by the Institutional Review Board at The University of Texas MD Anderson Cancer Center, Houston, TX.13
Morphologic Review and Immunohistochemistry
Formalin-fixed, paraffin-embedded (FFPE) blocks were cut at 4 µm thickness and stained with hematoxylin and eosin (H&E) in each patient. In this study, B-MCL was annotated when a monotonous proliferation of small- to-medium-size lymphoma cells with finely dispersed chromatin and minimal variability in nuclear size and shape was present (Figs. 1A–C). The presence of a few small foci of heterochromatin was allowed in B-MCL. P-MCL was annotated when lymphoma cells were predominantly medium-sized and large and had a high degree of variation in nuclear shape or size. Cases with both components of classic MCL and P-MCL reported as “intermediate” cases by Tiemann or Kimura14,15 were not included in this study. P-MCL lymphoma cells show either predominantly heterochromatin or variegated heterochromatin and euchromatin (Figs. 1D–F). The presence of a distinct, cherry-red nucleolus was not regarded as a criterion to distinguish B-MCL from P-MCL. Some cases showed mixed features of B-MCL and P-MCL such that the lymphoma cells were large with a high degree of pleomorphism but with finely dispersed chromatin. These cases were separately annotated as hybrid MCL (Figs. 1G–I). In each case, mitotic figures were counted in 10 different high-power (×400) microscopic fields.
FIGURE 1.
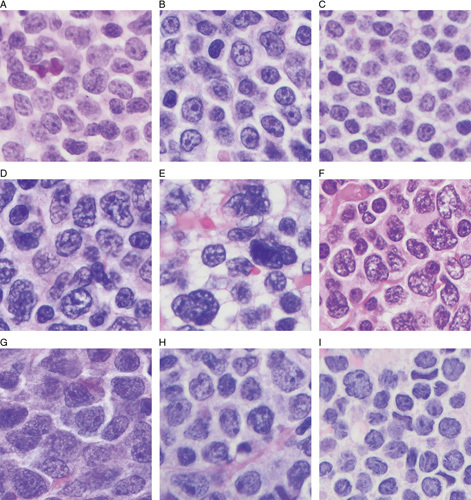
H&E-stained images of aggressive MCL. A–C, B-MCL, characterized by a monotonous proliferation of intermediate-sized lymphoma cells with finely dispersed chromatin was present. D–F, P-MCL, characterized by a predominantly intermediate-size and large and high degree of variation in nuclear shape or size with predominantly heterochromatin or variegated heterochromatin and euchromatin. G–I, Hybrid MCL, characterized by the chromatin met the criteria for B-MCL but the lymphoma cells were large with a high degree of pleomorphism.
Immunohistochemical analyses were performed on 4 µm sections using a streptavidin-biotin complex technique with antibodies reactive for the following antigens: CD5 (Thermo Fischer); CD10 (Leica Biosystems Inc.); CD20, BCL6, Ki-67, and p53 (Dako/Agilent); cyclin D1 (Lab Vision); EZH2 (Cell Signaling Technology); and SOX11 (Cell Marque).
Nuclear Morphometry
The most representative area selected from each H&E slide and brightfield image at ×1000 resolution was saved in TIFF format using the Olympus DP74 camera (Olympus Corporation). The nuclear morphometry of lymphoma cells was assessed with the ImageJ 1.53c (National Institutes of Health) after scale calibration in micrometers. Due to nuclear irregularities in lymphoma cells, shape-based (circular or oval selection) selection tools failed to provide accurate nuclear segmentation. Similarly, threshold-based methods for nuclear segmentation could not provide satisfactory results due to the variegated nature of the chromatin. Therefore, nuclear segmentation was performed manually by following nuclear membranes with the freehand selection tool (Figs. 2A–C). The parameters of nuclear morphometry include Feret diameter (the maximum length of the nucleus, µm), perimeter (µm), area (µm2), circularity, and aspect ratio of the nucleus. The circularity is calculated by 4 π×area/(perimeter),2 ranging from 0 (infinitely elongated polygon) to 1 (perfect circle). The aspect ratio is the maximum diameter of the nucleus divided by the minimum diameter of the nucleus, ranging from 1 (perfect circle) to positive infinity (ellipse).
FIGURE 2.

Manual nuclear segmentation of representative nuclei in each variant. A, Manual nuclear segmentation of representative nuclei in B-MCL. B, Manual nuclear segmentation of representative nuclei in P-MCL. C, Manual nuclear segmentation of representative nuclei in H-MCL. D, Box plots of various nuclear morphometric parameters in B-MCL, P-MCL, and H-MCL. The asterisk denotes that the P-value between 2 groups were statistically significant (P<0.05). H-MCL indicates hybrid mantle cell lymphoma.
To assess the nuclear chromatin pattern, we measured the integrated density (ID) from subregions of nonscaled, noncalibrated H&E-stained brightfield images. Since ID is the product of area and mean gray value, a fixed area (316 square pixels) covering at least 30% of the area of the nucleus was used. Within the unit area, ID value is generally high in an empty, bright area such as euchromatin and low in dark areas such as heterochromatin.
Gene Expression Profiling
Gene expression profiling was performed using RNA derived from FFPE tissue and by using the nCounter PanCancer Pathway Panel (NanoString Technologies) as described previously.16 The data quality control and normalization were performed on nSolver Analysis Software 4.0 (NanoString Technologies) with the default setting. Flagged specimens were removed from subsequent analysis. The normalized counts were log-transformed (base 10). For each gene, the expression levels between B-MCL and P-MCL were compared with a 2-tailed Student t test for independent groups on KNIME 4.3.0. Pathway enrichment analyses were performed on reactome.org with default settings. Gene sets were downloaded from the Kyoto Encyclopedia of Genes and Genomes (KEGG.org, accessed on 11/14/2021).
Next-generation Sequencing
DNA was extracted from FFPE tissue (n=40). Library preparation was performed using a customized 11-gene panel that included ATM, BIRC3, CCND1, KMT2C, KMT2D, NOTCH1, NOTCH2, RB1, TP53, TRAF2, and UBR5 and then subjected to the NovaSeq. 6000 (Illumina, San Diego, CA, USA). Data analysis and annotation of mutation were conducted using a vendor-provided tool.
Statistical Analysis
Continuous variables were evaluated using the Mann-Whitney test to evaluate differences between datasets. Categorical variables were analyzed by the χ2 test. Overall survival (OS) was calculated from the day of diagnosis to the day of the last follow-up. For patients who received a hematopoietic stem cell transplant, survival was censored on the day of the procedure. Distributions of OS were estimated by the Kaplan-Meier curves and survival differences were evaluated using the log-rank test. A P-value (2-sided) <0.05 was considered significant. Statistical analyses were performed using R, GraphPad Prism, v9.0.0; and IBM SPSS Statistics, Version 23.
RESULTS
Study Cohort
The cohort of MCL patients included 74 (73%) men and 28 (27%) women with a median age of 61 years (range, 42 to 87 y). Involved organs included lymph nodes (n=82, 80%), tonsils (n=8, 8%), spleen (n=1, 1%), and other extranodal sites (n=11, 11%). Five (5%) patients had limited (I/II) disease and 93 (95%) patients had advanced (III/IV) stage. Patients were treated with hyperfractionated cyclophosphamide, vincristine, doxorubicin, and dexamethasone (hyper-CVAD) with or without rituximab (n=65) or cyclophosphamide, doxorubicin, vincristine, and prednisone (CHOP) with or without rituximab (n=28). One patient was observed initially without treatment, and treatment information was not available for 8 patients. Treatment response was available for 87 patients: 68 patients had a complete remission (CR), 5 had partial remission (PR), and 14 had primary refractory disease. Among the patients with CR, 35 patients (51%) eventually relapsed. Following the criteria mentioned above, all cases were designated as B-MCL (n=32), P-MCL (n=53), or hybrid MCL (n=17) (Table 1).
TABLE 1.
Clinicopathologic Findings Among B-MCL, P-MCL, and Hybrid MCL
| Blastoid | Pleomorphic | Hybrid | P (blastoid vs. pleomorphic) | P (blastoid vs. hybrid) | P (pleomorphic vs. hybrid) | |
|---|---|---|---|---|---|---|
| Clinical features | ||||||
| Patients | 32 | 53 | 17 | NA | NA | |
| Sex | 0.435 | 0.217 | 0.463 | |||
| Male | 65.6 | 73.6 | 82.4 | |||
| Female | 34.4 | 26.4 | 17.6 | |||
| Age (median) (y) | 59.5 | 62 | 62 | 0.55 | 0.614 | 0.666 |
| Stage | 0.657 | 0.662 | 0.93 | |||
| Limited (I/II) | 3.5 | 5.7 | 6.3 | |||
| Advanced (III/IV) | 96.5 | 94.3 | 93.7 | |||
| Treatment response | 0.035 | 0.609 | 0.011 | |||
| CR/PR | 76 | 93.5 | 68.7 | |||
| Refractory | 24 | 6.5 | 31.3 | |||
| Relapse rate (%) | 45.8 | 40 | 50 | 0.64 | 0.796 | 0.487 |
| Pathologic features | ||||||
| Mitotic figures/10 HPF | 52.5 | 42 | 63 | 0.532 | 0.066 | 0.011 |
| Starry-sky appearance (%) | 50 | 32.7 | 52.9 | 0.115 | 0.845 | 0.135 |
| Nucleolus (%) | 17.2 | 13.3 | 20 | 0.645 | 0.845 | 0.589 |
| Ki-67 proliferation rate (%) | 60 | 40 | 70 | 0.003 | 0.922 | 0.013 |
| p53 overexpression (%) | 38.5 | 34.4 | 37.5 | 0.795 | 0.965 | 0.868 |
| SOX11 expression (%) | 100 | 100 | 90 | NA | 0.305 | 0.09 |
| CD5 expression (%) | 93.8 | 98.1 | 94.1 | 0.299 | 0.959 | 0.398 |
| CD10 expression (%) | 0 | 10.2 | 7.7 | 0.12 | 0.187 | 0.786 |
| BCL6 expression (%) | 25 | 14.3 | 60 | 0.495 | 0.207 | 0.029 |
| EZH2 high (%) | 56.3 | 61.5 | 88 | 0.735 | 0.126 | 0.17 |
| Complex karyotype (%) | 66.6 | 100 | NA | 0.212 | NA | NA |
Bold values are statistically significant p<0.05.
EZH2 high indicates ≥40% of lymphoma cells express EZH2; NA, not available.
Assessment of Nuclear Chromatin Features
Since the chromatin of B-MCL cells is relatively more homogenous compared with the cells of P-MCL, we hypothesized that the median ID would be higher and the variability of the ID would be lower in the B-MCL than in the P-MCL. As expected, the median ID of B-MCL was 51141 (range: 40,840 to 58,652) compared with 45,061 (range: 29,248 to 56,809) in P-MCL (P<0.001). The median SD of the ID was 3933 (range: 2036 to 4843) and 5431 (range: 3531 and 8948) in B-MCL and P-MCL, respectively (P<0.001). Similarly, the median coefficient of variation (CoV) of the ID was 8.138 (range: 3.947 to 9.576) in B-MCL and 11.38 (range: 8.450 to 22.34) in P-MCL (P<0.001) (Fig. 2D). These data indicate that the chromatin pattern is more homogeneous (lower SD and CoV in ID) and less likely to have heterochromatin (higher median value of ID) in B-MCL versus P-MCL.
Assessment of Nuclear Size and Shape
The median Feret diameter (FD) of the B-MCL cases was 6.92 µm (range: 5.364 to 8.785 µm), compared with 8.49 µm (range: 5.81 to 10.31 µm) for P-MCL (P<0.001) (Fig. 2D). In addition, B-MCL had a significantly lower median SD (0.7601 µm) and CoV (10.93) of FD compared with P-MCL which had a median SD: 1.517 µm and median CoV: 17.91 (P<0.001 for both). Furthermore, the median nuclear perimeter of B-MCL was smaller than P-MCL (22.60 vs. 25.88 µm, P<0.001) and the median nuclear area of B-MCL was smaller than P-MCL (33.18 vs. 41.02 µm2, P<0.001). The shapes of the nuclei were closer to a perfect circle in the B-MCL as compared with P-MCL, reflected by the median circularity (0.8308 vs. 0.804, respectively, P<0.001) and aspect ratio (1.248 vs. 1.319, respectively, P=0.004). These quantitative data show that B-MCL lymphoma cells have smaller nuclear size with a lesser degree of variation and exhibit circular shapes compared with P-MCL lymphoma cells.
Hybrid MCL Show Features of Both B-MCL and P-MCL
The median FD of hybrid MCL cases was 8.185 µm (range: 6.33 to 10.325 µm), significantly larger than B-MCL (median FD: 6.92 µm, P=0.003) and similar to the P-MCL (median FD: 8.49 µm, P=0.163) (Fig. 2D). The median SD and CoV of FD of hybrid MCL cases were 1.353 µm and 16.45, respectively, greater than the B-MCL (0.7601 µm and 10.93, respectively, P<0.001 for both) but similar to P-MCL (1.517 µm and 17.91, respectively, P>0.05 for both). The median perimeter of the nuclei (25.98 µm) and the median area of the nucleus (39.23 µm2) of the hybrid MCL were larger than B-MCL (22.6 µm and 33.18 µm2, respectively, P<0.05 for both) and similar to P-MCL (25.88 µm and 41.02 µm2, respectively, P>0.05 for both).
In contrast, the median ID (49918), SD of ID (3437), and CoV of ID (7.405) of hybrid MCL cases were similar to B-MCL (51141, 3933, and 8.318, respectively, P>0.05 for all) and significantly different from P-MCL (45061, 5431, and 11.38, respectively, P<0.05 for all). The circularity (0.7761) and the aspect ratio (1.362) of the nucleus of hybrid cases were different from both B-MCL (0.8308 and 1.248, respectively, P<0.001 for both) and P-MCL (0.804 and 1.319, respectively, P<0.05 for both). Our data indicate that hybrid cases have a similar chromatin pattern to B-MCL, but a similar degree of pleomorphism in nuclear shape and size to that of P-MCL.
Mutational Profiles of B-MCL and P-MCL
All B-MCL cases had at least 1 mutation (median number of mutations: 2, range: 1 to 4). ATM (50%) was the most common mutation followed by TP53 (42%), NOTCH1 (33%), KMT2D (17%), and UBR5 (17%) (Fig. 3A). In P-MCL, all but 3 had at least 1 mutation (median number of mutations: 1, range: 0 to 4). TP53 (45%) was the most common, followed by ATM (27%), CCND1 (18%), and UBR5 (14%). Interestingly, NOTCH1 mutation was more common in B-MCL (P=0.004) and was not identified in P-MCL. All NOTCH1 mutations were located in the PEST (polypeptide enriched in proline, glutamine, serine, and threonine) domain. Three patients had truncation of the C-terminus of NOTCH1 due to the mutations (p.P2514fs, p.L2482*, and p.Q2404*) and 1 patient had a missense mutation (p.S2521F).
FIGURE 3.

Mutation profile and gene expression profile. A, Mutation profile of B-MCL, P-MCL, and H-MCL. B, Gene expression profile between B-MCL and H-MCL combined and P-MCL. Blue dots: interrogated genes; red dots: housekeeping genes as control; yellow dots: positive controls (spiked in); green dots: negative controls (noise). Orange dash line: α=0.01; yellow dash line: α=0.05. H-MCL indicates hybrid mantle cell lymphoma.
There were no statistically significant differences with respect to the frequency of mutations in other genes (Table 2). The mutational profile of hybrid MCL was similar to B-MCL. Compared with P-MCL, NOTCH1 mutation was significantly more common (0% and 33%, respectively, P=0.005) in hybrid MCL, similar to the B-MCL. All NOTCH1 mutations in hybrid MCL were located in the PEST domain, causing truncation of the C-terminus of NOTCH1 (p.Q2398* and p.P2514fs).
TABLE 2.
Frequency of Mutations in B-MCL, P-MCL, and Hybrid MCL
| n (%) | |||||||
|---|---|---|---|---|---|---|---|
| Genes | Blastoid (N=12) | Pleomorphic (N=22) | Hybrid (N=6) | P (blastoid vs. pleomorphic) | P (blastoid vs. hybrid) | P (pleomorphic vs. hybrid) | P (blastoid+hybrid vs. pleomorphic) |
| ATM | 6 (50) | 6 (27) | 4 (67) | 0.185 | 0.502 | 0.074 | 0.069 |
| BIRC3 | 1 (8) | 1 (5) | 0 (0) | 0.654 | 0.467 | 0.595 | 0.884 |
| CCND1 | 1 (8) | 4 (18) | 0 (0) | 0.438 | 0.467 | 0.247 | 0.23 |
| KMT2C | 0 (0) | 1 (5) | 0 (0) | 0.454 | NA | 0.595 | 0.36 |
| KMT2D | 2 (17) | 2 (9) | 1 (17) | 0.512 | >0.999 | 0.595 | 0.471 |
| NOTCH1 | 4 (33) | 0 (0) | 2 (33) | 0.004 | >0.999 | 0.005 | 0.003 |
| NOTCH2 | 1 (8) | 2 (9) | 0 (0) | 0.941 | 0.467 | 0.443 | 0.673 |
| RB1 | 1 (8) | 0 (0) | 0 (0) | 0.169 | 0.467 | NA | 0.263 |
| TP53 | 5 (42) | 10 (45) | 1 (17) | 0.832 | 0.289 | 0.201 | 0.436 |
| TRAF2 | 0 (0) | 0 (0) | 1 (17) | NA | 0.146 | 0.051 | 0.263 |
| UBR5 | 2 (17) | 3 (14) | 2 (33) | 0.812 | 0.423 | 0.264 | 0.477 |
Bold values are statistically significant p<0.05.
NA indicates not available.
Chromosome Analysis and Gene Expression Profiling
Seven patients had available data for conventional chromosomal analysis. Two of 3 patients with B-MCL and all 4 patients with P-MCL had a complex karyotype along with t(11;14)(q13;q32). One patient with B-MCL had a noncomplex karyotype with trisomy 21. Patients with hybrid MCL did not have available chromosomal data.
In 20 patients, RNA was extracted from FFPE tissue for gene expression profiling. A total of 17 patients passed quality control. Due to their similarity in chromatin pattern, clinicopathologic findings, and mutational profiles between B-MCL and hybrid MCL, and the limited number of cases that passed quality control, B-MCL and hybrid MCL cases (n=6) were combined and compared with P-MCL (n=11).
With a false discovery rate cutoff of <0.1, 14 genes (MAD2L2, HMGA1, PCNA, PBX3, CDKN2C, POLD1, IL10, ENDOG, MFNG, CDC25A, CCNB1, U2AF1, RAC2, and CCNA2) were overexpressed and 2 genes (RRAS and MAP2K6) were underexpressed in B-MCL and hybrid MCL cases compared with P-MCL (Fig. 3B, Table 3). The pathway enrichment analysis for the overexpressed genes in B-MCL and hybrid cases demonstrated significant enrichment in the cell cycle and mitotic transition pathways.
TABLE 3.
Differentially Expressed Genes Between B-MCL and Hybrid MCL Combined and P-MCL
| P (2-tailed) | |
|---|---|
| Overexpressed genes | |
| MAD2L2 | <0.001 |
| HMGA1 | <0.001 |
| PCNA | <0.001 |
| PBX3 | <0.001 |
| CDKN2C | <0.001 |
| POLD1 | <0.001 |
| IL10 | <0.001 |
| ENDOG | 0.001 |
| MFNG | 0.001 |
| CDC25A | 0.002 |
| CCNB1 | 0.002 |
| U2AF1 | 0.002 |
| RAC2 | 0.002 |
| CCNA2 | 0.002 |
| Underexpressed genes | |
| RRAS2 | <0.001 |
| MAP2K6 | 0.001 |
Clinicopathologic Features of B-MCL and P-MCL
The median Ki-67 proliferation rate was significantly higher in the B-MCL than in the P-MCL (60% and 40%, respectively, P=0.003) (Table 1). There were no significant differences in the number of mitotic figures/10 HPFs; percentage of cases with a starry-sky appearance; the presence of prominent nucleoli; p53 overexpression (≥50%); and expression of SOX11, CD5, CD10, BCL6, or EZH2 between the 2 variants. Clinically, patients with B-MCL less frequently achieved CR or PR compared with patients with P-MCL (76% and 93.5%, respectively, P=0.035). There were no significant differences in sex, age, stage, and relapse rate between B-MCL versus P-MCL.
Patients with the B-MCL had significantly poorer OS compared with patients with the P-MCL (Fig. 4A). With a median follow-up of 3.2 years (range, 0.3 to 18.4 y), the median OS was 3.1 and 8.8 years for patients with the B-MCL and the P-MCL, respectively (P=0.035). The 5-year OS was 37.8% for patients with the B-MCL and 59.9% for patients with the P-MCL.
FIGURE 4.

Kaplan-Meier curves of B-MCL, P-MCL, and H-MCL. A, Comparison of OS between B-MCL and P-MCL. B, Comparison of OS among B-MCL, P-MCL, and H-MCL. The P-value with a single asterisk is a comparison between P-MCL and H-MCL. The P-value with double asterisks is a comparison between B-MCL and H-MCL. The P-value with 3 asterisks is a comparison among all 3 groups (B-MCL, P-MCL, and H-MCL). C, OS of patients treated with hyper-CVAD±R. D, OS of patients treated with CHOP±R. H-MCL indicates hybrid mantle cell lymphoma; R, rituximab.
Clinicopathologic Features of Hybrid MCL
Compared with the B-MCL, hybrid MCL cases were not significantly different in the number of mitotic figures/10 HPFs; percentage of cases with a starry-sky appearance; presence of prominent nucleoli, Ki-67 proliferation rate; p53 overexpression; and expression of SOX11, CD5, CD10, BCL6, and EZH2. Compared with P-MCL, hybrid MCL cases had more mitotic figures/10 HPFs, a higher Ki-67 proliferation rate, and more commonly expressed BCL6 (60%) (P<0.05 for all). The remaining parameters were not significantly different between hybrid MCL and P-MCL cases.
Clinically, patients with hybrid MCL had a lower CR/PR rate than patients with P-MCL (68.7% vs. 93.5%, P=0.011). Patients with hybrid MCL were not different from B-MCL patients with respect to age, sex, stage, treatment response, and relapse rate (P>0.05). Lumbar puncture to assess central nervous system involvement was performed in 7 patients (1 B-MCL, 3 P-MCL, and 3 hybrid MCL) and none of them were positive for lymphoma cells. The median OS of patients with hybrid MCL was 3.9 years, similar to patients with B-MCL (3.1 y, P=0.451), but shorter than that of patients with P-MCL (8.8 y, P=0.004) (Fig. 4B). The 5-year OS was 27.9% for patients with hybrid MCL.
Based on the almost identical clinicopathologic features of B-MCL and hybrid MCL, we merged these 2 groups and compared the OS of patients with P-MCL. In patients treated with hyper-CVAD with or without rituximab, the B-MCL and hybrid MCL groups showed significantly inferior OS compared with the P-MCL group (P=0.034) (Fig. 4C). In patients treated with CHOP with or without rituximab, there was a trend for the B-MCL and hybrid MCL groups to have a poorer OS compared with the P-MCL group (P=0.075) (Fig. 2D).
DISCUSSION
The aim of the current study was to evaluate cases of B-MCL and P-MCL by using quantitative morphometric parameters and gene expression and mutational profiling. These data suggest biological differences between B-MCL and P-MCL cases.
Compared with P-MCL cases, B-MCL cases had a homogenously euchromatin-rich chromatin pattern captured by a greater median ID value with less variability. The nuclei of B-MCL were smaller and relatively uniform in size, demonstrated by FD and its SD/CoV. The shapes of the nuclei of B-MCL were closer to a perfect circle, assessed by circularity and aspect ratio. In contrast, P-MCL cells had larger nuclei with more ellipse-like shape and a higher degree of variability in both size and shape.
Although image analysis can capture some of the morphometric characteristics of B-MCL and P-MCL, the process was far from perfect. Accurate nuclear segmentation and feature extraction are essential in this process, but usual techniques such as watershed segmentation, erosion, dilation, color-based thresholding, or even a machine learning-based tool (Trainable Weka Segmentation) failed to provide satisfactory results.17 For example, a subset of P-MCL cases had a notch in the nucleus with irregular grooves in their nuclear membrane, resembling the sulci of the brain. Such a feature is a specific finding for P-MCL, but could not be extracted like other simple features such as FD or chromatin pattern. Furthermore, overlapping nuclei were excluded from feature extraction, limiting the power of analysis. Heterogeneous levels of tissue in a single glass slide also affected image quality. It appears that numerous efforts have been invested to overcome such hurdles and it would be worthwhile trying new techniques in subsequent studies.18,19 To acquire quantitative data for the chromatin pattern, we selected a fixed area (316 pixels) in the nuclei and acquired the ID. Of note, the ID is proportional to the area of selection. Therefore, if one used settings different from those used in this study our ID value could not be used as a reference.
Other than nuclear features in both B-MCL and P-MCL showed comparable morphologic features, such as the number of mitotic figures and the presence of a starry-sky appearance or a prominent nucleolus in each cell. Immunophenotypic profiles were also similar. However, the Ki-67 proliferation rate was significantly higher in B-MCL. Our data are in line with a study by Hoster et al20 who showed a median Ki-67 index of 80% in B-MCL and 39% in P-MCL. The highly proliferative nature of B-MCL was also shown by gene expression profiling. Many of the overexpressed genes in B-MCL are associated with cell-cycle progression and have been shown to be associated with increased proliferation in variable types of cancer.21–27 Indeed, gene set enrichment assay corroborated significant enrichment in cell-cycle genes.
We showed that NOTCH1 mutation were significantly more common in B-MCL compared with P-MCL. NOTCH1 signaling is initiated by ligand-receptor interactions, followed by subsequent proteolytic cleavage of the receptor, resulting in the intracellular cleaved form of NOTCH1 (ICN1). Of note, all NOTCH1 mutations in B-MCL were located in the PEST domain and these mutations are known to negatively affect ubiquitinylation-mediated NOTCH1 degradation and enhance the half-life of ICN1.28 Uninhibited NOTCH1 signaling may contribute to excessive cellular proliferation in B-MCL. NOTCH1 mutation has been reported in 5% to 15% of MCL cases and is enriched in neoplasms with blastoid/pleomorphic morphology.29–34 However, previous studies analyzed data merging B-MCL and P-MCL together, so it is not possible to directly compare our data with the literature. Of note, inhibition of NOTCH signaling induced a decrease in cell proliferation and cell-cycle arrest, supporting an association between NOTCH1 signaling and the cell-cycle machinery.30
Based on the data we present, B-MCL has distinctive clinicopathologic and genetic characteristics as compared with P-MCL. We also report a subset of MCLs that show features of B-MCL (blastoid chromatin) and P-MCL (higher degree of pleomorphism compared with typical B-MCL) designated here as hybrid MCL. These cases have pathologic and genetic characteristics more in keeping with B-MCL. Most importantly, clinical outcomes were significantly worse (median OS: 3.9 y) for patients with hybrid MCL as compared with P-MCL (median OS: 8.8 y) and similar to B-MCL patients (median OS: 3.1 y). Therefore, it is reasonable to regard the hybrid cases as a variant of B-MCL.
One of the weakness of this study is that a small subset of cases (3 B-MCL and 4 P-MCL) was assessed by conventional cytogenetic analysis. Khoury and colleagues reported cytogenetic findings in B-MCL and P-MCL. Frequent abnormalities in chromosomes 13, 18, 8, and 9 were present in B-MCL versus abnormalities in chromosomes 13, 17, 3, and 9 in P-MCL.35 Chromosome 22 abnormalities were seen exclusively in P-MCL cases. In this study, we observed abnormalities in chromosomes 13 and 17 in 3 of 4 patients with P-MCL, and monosomy 22 was observed in only 1 P-MCL patient. Another weakness of this study is that we only assessed patients treated with hyper-CVAD with or without rituximab or CHOP with or without rituximab. Considering the new frontline therapies that are being investigated with promising results in MCL patients, additional studies are necessary to assess the clinical implications of the B-MCL and P-MCL variants in patients treated with different regimens.36,37
In summary, B-MCL cases show clinicopathologic and genetic features that are distinct from P-MCL. Instead of merging the 2 variants as a single aggressive variant of MCL, we suggest that these variants be designated separately. We also show that a subset of MCL cases show blastoid chromatin with a higher degree of pleomorphism in nuclear size and shape that we designated as hybrid MCL. Such cases can probably be regarded as part of the spectrum of blastoid MCL.
Footnotes
Present address: Mahsa Khanlari, MD, St. Jude Children’s Research Hospital, Memphis, TN; Huan Mo, MD, National Human Genome Research Institute, National Institutes of Health, Bethesda, MD and Ali Sakhdari, MD, MSc, The University of Toronto, Toronto, ON, Canada.
This study was performed using the Histopathology Core Lab (RHCL) supported by the MD Anderson Cancer Center Support Grant (Award Number 2P30CA016672-38) from the NIH National Cancer Institute.
The contents of the manuscript are solely the responsibility of the authors and do not necessarily represent the official views of the National Cancer Institute or the National Institutes of Health.
Conflicts of Interest and Source of Funding: The authors have disclosed that they have no significant relationships with, or financial interest in, any commercial companies pertaining to this article.
Contributor Information
Mahsa Khanlari, Email: Mahsa.Khanlari@STJUDE.ORG.
Huan Mo, Email: henryhmo@gmail.com.
Do Hwan Kim, Email: dr.do.kim@gmail.com.
Ali Sakhdari, Email: asakhdari@gmail.com.
Ken H. Young, Email: ken.young@duke.edu.
Preetesh Jain, Email: PJain@mdanderson.org.
Michael Wang, Email: miwang@mdanderson.org.
Shaoying Li, Email: SLi6@mdanderson.org.
Rashmi Kanagal-Shamanna, Email: RKanagal@mdanderson.org.
Roberto N. Miranda, Email: roberto.miranda@mdanderson.org.
Francisco Vega, Email: FVega@mdanderson.org.
L. Jeffrey Medeiros, Email: ljmedeiros@mdanderson.org.
Chi Young Ok, Email: cok@mdanderson.org.
REFERENCES
- 1.Gerard-Marchant R, Hamlin I, Lennert K, et al. Classification of non-Hodgkin’s lymphomas. Lancet. 1974;304:406–408. [Google Scholar]
- 2.Berard CW, Dorfman, RF. Histopathology of malignant lymphomas. Clin Haematol. 1974;3:39–76. [Google Scholar]
- 3.Weisenburger DD, Kim H, Rappaport H. Mantle-zone lymphoma: a follicular variant of intermediate lymphocytic lymphoma. Cancer. 1982;49:1429–1438. [DOI] [PubMed] [Google Scholar]
- 4.Williams ME, Westermann CD, Swerdlow SH. Genotypic characterization of centrocytic lymphoma: frequent rearrangement of the chromosome 11 bcl-1 locus. Blood. 1990;76:1387–1391. [PubMed] [Google Scholar]
- 5.Medeiros LJ, Van Krieken JH, Jaffe ES, et al. Association of bcl-1 rearrangements with lymphocytic lymphoma of intermediate differentiation. Blood. 1990;76:2086–2090. [PubMed] [Google Scholar]
- 6.Banks PM, Chan J, Cleary ML, et al. Mantle cell lymphoma. A proposal for unification of morphologic, immunologic, and molecular data. Am J Surg Pathol. 1992;16:637–640. [DOI] [PubMed] [Google Scholar]
- 7.Harris NL, Jaffe ES, Stein H, et al. A revised European-American Classification of Lymphoid Neoplasms: a proposal from the International Lymphoma Study Group. Blood. 1994;84:1361–1392. [PubMed] [Google Scholar]
- 8.Pittaluga S, Wlodarska I, Stul MS, et al. Mantle cell lymphoma: a clinicopathological study of 55 cases. Histopathology. 1995;26:17–24. [DOI] [PubMed] [Google Scholar]
- 9.Ott G, Kalla J, Ott MM, et al. Blastoid variants of mantle cell lymphoma: frequent bcl-1 rearrangements at the major translocation cluster region and tetraploid chromosome clones. Blood. 1997;89:1421–1429. [PubMed] [Google Scholar]
- 10.Ott MM, Ott G, Kuse R, et al. The anaplastic variant of centrocytic lymphoma is marked by frequent rearrangements of the bcl-1 gene and high proliferation indices. Histopathology. 1994;24:329–334. [DOI] [PubMed] [Google Scholar]
- 11.Argatoff LH, Connors JM, Klasa RJ, et al. Mantle cell lymphoma: a clinicopathologic study of 80 cases. Blood. 1997;89:2067–2078. [PubMed] [Google Scholar]
- 12.Dreyling M, Klapper W, Rule S. Blastoid and pleomorphic mantle cell lymphoma: still a diagnostic and therapeutic challenge! Blood. 2018;132:2722–2729. [DOI] [PubMed] [Google Scholar]
- 13.World Medical Association. World Medical Association Declaration of Helsinki: ethical principles for medical research involving human subjects. JAMA. 2013;310:2191–2194. [DOI] [PubMed] [Google Scholar]
- 14.Kimura Y, Sato K, Arakawa F, et al. Mantle cell lymphoma shows three morphological evolutions of classical, intermediate, and aggressive forms, which occur in parallel with increased labeling index of cyclin D1 and Ki-67. Cancer Sci. 2010;101:806–814. [DOI] [PMC free article] [PubMed] [Google Scholar]
- 15.Tiemann M, Schrader C, Klapper W, et al. Histopathology, cell proliferation indices and clinical outcome in 304 patients with mantle cell lymphoma (MCL): a clinicopathological study from the European MCL Network. Br J Haematol. 2005;131:29–38. [DOI] [PubMed] [Google Scholar]
- 16.Martinez-Baquero D, Sakhdari A, Mo H, et al. EZH2 expression is associated with inferior overall survival in mantle cell lymphoma. Mod Pathol. 2021;34:2183–2191. [DOI] [PMC free article] [PubMed] [Google Scholar]
- 17.Arganda-Carreras I, Kaynig V, Rueden C, et al. Trainable Weka Segmentation: a machine learning tool for microscopy pixel classification. Bioinformatics. 2017;33:2424–2426. [DOI] [PubMed] [Google Scholar]
- 18.Chanchal AK, Lal S, Kini J. High-resolution deep transferred ASPPU-Net for nuclei segmentation of histopathology images. Int J Comput Assist Radiol Surg. 2021;16:2159–2175. [DOI] [PubMed] [Google Scholar]
- 19.Kiran I, Raza B, Ijaz A, et al. DenseRes-Unet: Segmentation of overlapped/clustered nuclei from multi organ histopathology images. Comput Biol Med. 2022;143:105267. [DOI] [PubMed] [Google Scholar]
- 20.Hoster E, Rosenwald A, Berger F, et al. Prognostic value of Ki-67 index, cytology, and growth pattern in mantle-cell lymphoma: results from randomized trials of the European Mantle Cell Lymphoma Network. J Clin Oncol. 2016;34:1386–1394. [DOI] [PubMed] [Google Scholar]
- 21.Fang Y, Yu H, Liang X, et al. Chk1-induced CCNB1 overexpression promotes cell proliferation and tumor growth in human colorectal cancer. Cancer Biol Ther. 2014;15:1268–1279. [DOI] [PMC free article] [PubMed] [Google Scholar]
- 22.Fu F, Wang T, Wu Z, et al. HMGA1 exacerbates tumor growth through regulating the cell cycle and accelerates migration/invasion via targeting miR-221/222 in cervical cancer. Cell Death Dis. 2018;9:594. [DOI] [PMC free article] [PubMed] [Google Scholar]
- 23.Jurikova M, Danihel L, Polak S, et al. Ki67, PCNA, and MCM proteins: markers of proliferation in the diagnosis of breast cancer. Acta Histochem. 2016;118:544–552. [DOI] [PubMed] [Google Scholar]
- 24.Li H, Sun G, Liu C, et al. PBX3 is associated with proliferation and poor prognosis in patients with cervical cancer. Onco Targets Ther. 2017;10:5685–5694. [DOI] [PMC free article] [PubMed] [Google Scholar]
- 25.Rimkus C, Friederichs J, Rosenberg R, et al. Expression of the mitotic checkpoint gene MAD2L2 has prognostic significance in colon cancer. Int J Cancer. 2007;120:207–211. [DOI] [PubMed] [Google Scholar]
- 26.Shen T, Huang S. The role of Cdc25A in the regulation of cell proliferation and apoptosis. Anticancer Agents Med Chem. 2012;12:631–639. [DOI] [PMC free article] [PubMed] [Google Scholar]
- 27.Tumini E, Barroso S, Pérez-Calero C, et al. Roles of human POLD1 and POLD3 in genome stability. Sci Rep. 2016;6:38873. [DOI] [PMC free article] [PubMed] [Google Scholar]
- 28.Borggrefe T, Liefke R. Fine-tuning of the intracellular canonical Notch signaling pathway. Cell Cycle. 2012;11:264–276. [DOI] [PubMed] [Google Scholar]
- 29.Bea S, Valdes-Mas R, Navarro A, et al. Landscape of somatic mutations and clonal evolution in mantle cell lymphoma. Proc Natl Acad Sci USA. 2013;110:18250–18255. [DOI] [PMC free article] [PubMed] [Google Scholar]
- 30.Kridel R, Meissner B, Rogic S, et al. Whole transcriptome sequencing reveals recurrent NOTCH1 mutations in mantle cell lymphoma. Blood. 2012;119:1963–1971. [DOI] [PubMed] [Google Scholar]
- 31.Meissner B, Kridel R, Lim RS, et al. The E3 ubiquitin ligase UBR5 is recurrently mutated in mantle cell lymphoma. Blood. 2013;121:3161–3164. [DOI] [PubMed] [Google Scholar]
- 32.Zhang J, Jima D, Moffitt AB, et al. The genomic landscape of mantle cell lymphoma is related to the epigenetically determined chromatin state of normal B cells. Blood. 2014;123:2988–2996. [DOI] [PMC free article] [PubMed] [Google Scholar]
- 33.Sakhdari A, Ok CY, Patel KP, et al. TP53 mutations are common in mantle cell lymphoma, including the indolent leukemic non-nodal variant. Ann Diagn Pathol. 2019;41:38–42. [DOI] [PubMed] [Google Scholar]
- 34.Jain P, Zhang S, Kanagal-Shamanna R, et al. Genomic profiles and clinical outcomes of de novo blastoid/pleomorphic MCL are distinct from those of transformed MCL. Blood Adv. 2020;4:1038–1050. [DOI] [PMC free article] [PubMed] [Google Scholar]
- 35.Khoury JD, Sen F, Abruzzo LV, et al. Cytogenetic findings in blastoid mantle cell lymphoma. Hum Pathol. 2003;34:1022–1029. [DOI] [PubMed] [Google Scholar]
- 36.Jain P, Zhao S, Lee HJ, et al. Ibrutinib with rituximab in first-line treatment of older patients with mantle cell lymphoma. J Clin Oncol. 2022;40:202–212. [DOI] [PMC free article] [PubMed] [Google Scholar]
- 37.Wang ML, Jain P, Zhao S, et al. Ibrutinib-rituximab followed by R-HCVAD as frontline treatment for young patients (</=65 y) with mantle cell lymphoma (WINDOW-1): a single-arm, phase 2 trial. Lancet Oncol. 2022;23:406–415. [DOI] [PMC free article] [PubMed] [Google Scholar]