

Purpose
This study aimed to explore the predictive performance of diffusion-weighted imaging with apparent diffusion coefficient map in predicting the proliferation rate of hepatocellular carcinoma and to develop a radiomics-based nomogram.
Methods
This was a single-center retrospective study. A total of 110 patients were enrolled. The sample included 38 patients with low Ki67 expression (Ki67 ≤10%) and 72 with high Ki67 expression (Ki67 >10%) as demonstrated by surgical pathology. Patients were randomly divided into either a training (n = 77) or validation (n = 33) cohort. Diffusion-weighted imaging with apparent diffusion coefficient maps was used to extract radiomic features and the signal intensity values of tumor (SItumor), normal liver (SIliver), and background noise (SIbackground) from all samples. Subsequently, the clinical model, radiomic model, and fusion model (with clinical data and radiomic signature) were developed and validated.
Results
The area under the curve (AUC) of the clinical model for predicting the Ki67 expression including serum α-fetoprotein level (P = 0.010), age (P = 0.015), and signal noise ratio (P = 0.026) was 0.799 and 0.715 in training and validation cohorts, respectively. The AUC of the radiomic model constructed by 9 selected radiomic features was 0.833 and 0.772 in training and validation cohorts, respectively. The AUC of the fusion model containing serum α-fetoprotein level (P = 0.011), age (P = 0.019), and rad score (P < 0.001) was 0.901 and 0.781 in training and validation cohorts, respectively.
Conclusions
Diffusion-weighted imaging as a quantitative imaging biomarker can predict Ki67 expression level in hepatocellular carcinoma across various models.
Key Words: diffusion-weighted imaging, radiomics, hepatocellular carcinoma, Ki67
Hepatocellular carcinoma (HCC) was the sixth most common cancer and the third leading cause of cancer-related death in 2020.1 The 3-year and 5-year overall survival rates were 85.0% and 79.4%, respectively, in a liver transplantation group, 69.7% and 49.4% in a liver resection group, and 57.4% and 31.3% in a local ablation group.2 The prognostic risk factors of HCC include treatment approaches such as hepatic resection, liver transplantation, radiofrequency ablation, and tumor characteristic such as tumor size, histological differentiation, and proliferation rate, all of which have demonstrated effectiveness across several studies.3–6
The main characteristic of a tumor is abnormal cell proliferation.7 Ki67 is a well-known nuclear antigen, which reflects the proliferation status of malignant tumors.8 Ki67 expression is also significantly correlated with disease prognosis.9,10 It is regarded as an independent prognostic factor of disease-free and overall survival rates in HCC.11,12 One research study described that high Ki67 expression was related with poor prognosis,13 suggesting that Ki67 may be a valuable biomarker for invasive biological behavior and unsatisfied prognosis.14 Ki67 evaluation is commonly conducted on immunohistochemical examination after surgical resection, as it is considered an invasive detection method not suitable for HCC patients with surgical contraindications.15 Thus, the development of a noninvasive model to detect Ki67 expression preoperatively could provide broad clinical significance.
Diffusion-weighted imaging (DWI) with apparent diffusion coefficient (ADC) map, as a functional magnetic resonance imaging (MRI) technique, has been widely used in clinical practice.16,17 Several studies have investigated the correlation between MRI and Ki67 expression in HCC.18,19 Hu et al18 evaluated the value of whole-tumor histogram parameters derived from ADC map in predicting Ki67 labeling in HCC. However, the sample size of this study was relatively small and that the histogram was only partly radiomic. Radiomics, as a popular image processing technology, can extract extensive data from medical imaging, which may reveal the essence and characteristics of tumors.20,21 It has been widely applied in scientific research, including liver fibrosis, breast cancer, and Ki67 expression.21–24 To our knowledge, there is scarce work evaluating the combination of clinical features, conventional quantitative data (signal intensity [SI], signal-to-noise ratio [SNR], etc), and radiomic features as a tool for the prediction of Ki67 index.
Thus, this study proposed to evaluate the value of clinical features, conventional quantitative data (SI, SNR, etc), and radiomic features in predicting Ki67 in HCC tissues. In addition, we aimed to develop a clinical model, radiomic model, and fusion model based on the radiomic signature of DWI and ADC map for prediction of Ki67 expression in HCC.
MATERIALS AND METHODS
Patients
This retrospective study was approved by the institutional review board, which supported a waiver of informed consent. The study population was enrolled from March 2017 to March 2021. Inclusion criteria included patients with HCC confirmed by surgical biopsy who underwent a 3.0-T MRI within 1 month preoperatively and who had undergone immunohistochemical evaluation of Ki67. Exclusion criteria included tumors too small to visualize with DWI (n = 6), local treatment before MRI examination (n = 12), and poor MRI image quality (n = 4). In total, 110 patients (95 men, 15 women; median age, 58 years; range, 27–83 years) were retrospectively enrolled. The study sample was then randomly divided into a training cohort (n = 77) and an independent validation cohort (n = 33) at a ratio of 7:3. A flow diagram of the study is illustrated in Figure 1. The electronic medical record was used to search for relevant clinical laboratory data of participating patients, including serum α-fetoprotein (AFP) and liver function, among others (Table 1).
FIGURE 1.

Flowchart of the study selection process.
TABLE 1.
Comparisons of Patient Characteristics in Training and Validation Cohort
| Characteristics | Training Cohort (n = 77) | Validation Cohort (n = 33) | ||||
|---|---|---|---|---|---|---|
| Low Ki67 Group (n = 27) | High Ki67 Group (n = 50) | P | Low Ki67 Group (n = 11) | High Ki67 Group (n = 22) | P | |
| Age, median (IQR), y | 66.0 (55.0–68.0) | 52.0 (44.0–61.0) | <0.001 | 60.0 (55.0–64.0) | 60.5 (47.0–68.0) | 0.720 |
| Sex, n (%) | 0.524 | 0.252 | ||||
| Female | 3 (11.1) | 9 (18.0) | 2 (18.2) | 1 (4.5) | ||
| Male | 24 (88.9) | 41 (82.0) | 9 (81.8) | 21 (95.5) | ||
| Liver cirrhosis (%) | 1 | 0.703 | ||||
| Absent | 9 (33.3) | 18 (36.0) | 3 (27.3) | 9 (40.9) | ||
| Present | 18 (66.7) | 32 (64.0) | 8 (72.7) | 13 (59.1) | ||
| Hepatitis B infection (%) | 0.048 | 0.643 | ||||
| Absent | 5 (18.5) | 2 (4.0) | 3 (27.3) | 9 (40.9) | ||
| Present | 22 (81.5) | 48 (96.0) | 8 (72.7) | 13 (59.1) | ||
| Serum AFP (%) | 0.004 | 0.109 | ||||
| ≤20 ng/mL | 16 (59.3) | 12 (24.0) | 8 (72.7) | 8 (36.4) | ||
| >20 ng/mL | 11 (40.7) | 38 (76.0) | 3 (27.3) | 14 (63.6) | ||
| Prothrombin time (%) | 0.248 | 1 | ||||
| ≤13 s | 21 (77.8) | 31 (62.0) | 8 (72.7) | 8 (36.4) | ||
| >13 s | 6 (22.2) | 19 (38.0) | 3 (27.3) | 14 (63.6) | ||
| PT INR (%) | 0.176 | 0.681 | ||||
| ≤1.0 | 10 (37.0) | 10 (20.0) | 2 (18.2) | 7 (31.8) | ||
| >1.0 | 17 (63.0) | 40 (80.0) | 9 (81.8) | 15 (68.2) | ||
| Total bilirubin (%) | 1 | 0.542 | ||||
| ≤20.5 μmol/L | 22 (81.5) | 41 (82.0) | 2 (18.2) | 7 (31.8) | ||
| >20.5 μmol/L | 5 (18.5) | 9 (18.0) | 9 (81.8) | 15 (68.2) | ||
| Albumin (%) | 0.631 | 0.389 | ||||
| ≤40 g/L | 12 (44.4) | 18 (36.0) | 2 (18.2) | 7 (31.8) | ||
| >40 g/L | 15 (55.6) | 32 (64.0) | 9 (81.8) | 15 (68.2) | ||
| Alanine aminotransferase (%) | 0.318 | 0.681 | ||||
| ≤50 U/L | 22 (81.5) | 34 (68.0) | 9 (81.8) | 15 (68.2) | ||
| >50 U/L | 5 (18.5) | 16 (32.0) | 2 (18.2) | 7 (31.8) | ||
| Aspartate aminotransferase (%) | 0.847 | 0.430 | ||||
| ≤40 U/L | 17 (63.0) | 34 (68.0) | 9 (81.8) | 14 (63.6) | ||
| >40 U/L | 10 (37.0) | 16 (32.0) | 2 (18.2) | 8 (36.4) | ||
| γ-Glutamyltransferase (%) | 0.711 | 0.456 | ||||
| ≤60 U/L | 16 (59.3) | 26 (52.0) | 8 (72.7) | 12 (54.5) | ||
| >60 U/L | 11 (40.7) | 24 (48.0) | 3 (27.3) | 10 (45.5) | ||
| Platelets (%) | 0.345 | 1 | ||||
| ≤125 ×109/L | 10 (37.0) | 12 (24.0) | 8 (72.7) | 12 (54.5) | ||
| >125 ×109/L | 17 (63.0) | 38 (76.0) | 3 (27.3) | 10 (45.5) | ||
PT INR indicates prothrombin time international normalized ratio.
P-values are statistically significant in boldface format.
MRI Protocol
Magnetic resonance imaging examinations were performed in a 3.0-T MRI machine (MAGNETOM Skyra; Siemens, Healthcare, Erlangen, Germany) with a dedicated phased-array body coil. The routine abdominal MRI protocol included the following: half-Fourier acquisition single-shot turbo spin-echo, axial T2-weighted turbo-spin echo with fat suppression, DWI, in-phase and out-of-phase axial T1-weighted imaging, dynamic contrast-enhanced MRI, and a 3-dimensional (3D) gradient echo sequence with volumetric interpolated breath-hold examination. The DWI was performed before contrast administration with a free-breathing single-shot Spin Echo-Echo Planar Imaging: b = 50, 800 s/mm2, averages 2 and 5, respectively; fat suppression: Spectral Attenuated Inversion Recovery; repetition time/echo time: 6000 ms/51 ms; section thickness: 5 mm; intersection gap: 1 mm; field of view: 380 mm × 306 mm; matrix: 134×134; bandwidth: 2332 Hz/Px; parallel imaging: Generalized Autocalibration Partially Parallel Acquirsition 3; echo spacing: 0.51 ms; phase-encoding direction: anterior to posterior; and acquisition time: 2:35 min/s. Corresponding ADC maps were automatically calculated by the MRI system.
Qualitative and Quantitative Imaging Analysis
The qualitative imaging analysis was evaluated independently by Ye and Chen. If any discrepancy existed, the consensus was resolved by discussion. The observers, who were blinded to the clinical laboratory data and histopathologic information, evaluated the image features of HCC (if multiple lesions existed, the largest lesion was evaluated). The image features included the following: (1) maximum length, defined as the maximum diameter on transverse T1-weighted image; (2) tumor margin, classified as smooth margin and nonsmooth margin (round or oval tumors with smooth contour were identified as smooth margin, others were classified as nonsmooth margin); (3) peritumoral arterial enhancement, defined as a patchy enhancing area adjacent to the tumor margin in the arterial phase, subsequently showing isointensity in the delayed phase; (4) enhancement pattern, classified as typical dynamic enhancement demonstrating arterial hyperenhancement and portal washout, otherwise classified as a typical dynamic enhancement; (5) tumor hypointensity on hepatobiliary phase (HBP) images, presenting as lower SI than adjacent liver; (6) peritumoral hypointensity on HBP images, defined as irregular hypointense area outside of the tumor boundary on HBP images; and (7) radiologic capsule, defined as a hyper-enhanced structure enclosing the tumor in the portal venous phase or delayed phase.
The quantitative imaging analysis was measured independently by C.Y. and Z.H. The average was used for statistical analysis. The largest tumor cross-section was chosen to manually draw a 2-dimensional (2D) region of interest (ROI) on the brightest part of tumor in DWI (b = 800 s/mm2) and corresponding ADC maps, with the area ranging from 50 to 100 mm2. The SI of normal liver and background was also measured, according to the same ROI area (Figs. 2A, B). The relative SNR was defined as the ratio between SI of the tumor (SItumor) and SD of the background noise (σbackgroud). The contrast was defined as the ratio between the SI of the tumor (SItumor) and that of normal liver (SIliver).
FIGURE 2.

Hepatocellular carcinoma with Ki67 expression of 30% in a 66-year-old man, immunohistochemical staining was brown (H, arrows). The imaging features showed typical characteristics in T2-weighted imaging (C, arrow) and multiphases enhancement (D–G, arrow). The ROIs delineated in the largest slices of DWI (b = 800) (A) and ADC map (B) were used to extract radiomics signatures (black line). Another ROIs were drawn on the brightest part of DWI and the darkest part of ADC map in the same slice of lesion, with an area of 50 to 100 mm2 (A and B, black line). The SI of liver and background was obtained through the same operation in DWI (A, white line). This figure can be viewed in color online at www.jcat.org.
Radiomics Analysis and Model Construction
The procedure for radiomics analysis included image segmentation, feature extraction, feature selection, model building, and evaluation.
The 3D-Slicer software (https://www.slicer.org) was used for image segmentation and feature extraction.25 The irregular ROIs were manually drawn on the largest cross-section of DWI (b = 800 s/mm2) and ADC maps by C.Y., spanning the length of the tumor (Figs. 2A, B). After a bias field correction of N4ITK and spatial resampling used 3D-Slicer, the 186 radiomic features were extracted by a radiomics module. The radiomic features included 3 categories: shape-based, first-order statistics, and texture features (gray level co-occurrence matrix, gray level run length matrix, gray level size zone matrix, neighboring gray tone difference matrix [NGTDM], and gray level dependence matrix [GLDM]).26
The least absolute shrinkage and selection operator algorithm was used for feature selection in Python 3.7.6 (https://www.python.org). The logistic regression algorithm was used for model creation with the minimum Akaike information criterion value in R 4.1.0 (https://www.r-project.org). The receiver operating characteristics curves, calibration curves, and decision curves were plotted to evaluate the predictive performance of clinical, radiomic, and fusion nomogram models.
Histopathological Results
Histopathological evaluation was obtained postsurgically for HCC patients. At the participating institution, all tissues were fixed in 10% formaldehyde solution. Two pathologists, blind to the MRI information, cooperatively evaluated the surgical tissue. A monoclonal mouse anti-human Ki67 antibody was used for immunohistochemical observation of Ki67. The Ki67 expression was subsequently calculated based on the percentage of immune response cells observed under 10 high-power fields (×400). The mean value was calculated in the areas with high densities of positive nuclei (hot spots). According to the results, the enrolled cases were then stratified into “low Ki67 group (Ki67 ≤10%)” and “high Ki67 group (Ki67 >10%)” groups.27
Statistical Analysis
All statistical analyses were performed using R 4.1.0 (https://www.r-project.org). Continuous variables were compared by Student t test or the Mann-Whitney U test. Categorical variables were compared using Pearson χ2 test or Fisher exact test. The prediction performance was assessed by area under the curve (AUC), and the DeLong test was used to compare the AUC values of different models. The κ test and intraclass correlation coefficients were used to evaluate interobserver agreements (poor, 0–0.2; fair, 0.2–0.4; moderate, 0.4–0.6; good, 0.6–0.8; excellent, 0.8–1.0). Two-tailed P values of <0.05 were considered statistically significant.
RESULTS
Clinical Characteristics and Imaging Features
The clinical characteristics and imaging features of 110 patients in the training and validation cohorts are summarized in Tables 1 and 2. There were significant differences for age (odds ratio [OR] [95% confidence interval (CI)], 0.937 [0.895–0.981]; P = 0.006) and serum AFP level (OR [95% CI], 4.606 [1.686–12.587]; P = 0.003) between the low and high Ki67 expressing groups in the training cohort according to univariate analysis. The imaging features including tumor margin (OR [95% CI], 3.095 [1.112–8.619]; P = 0.031), SNR (OR [95% CI], 1.02 [1.004–1.037]; P = 0.014), and SItumor were also statistically different between the 2 groups. The κ value of imaging features was 0.731 to 0.936, and the intraclass correlation coefficient was 0.716 to 0.898. The interobserver agreements were good to excellent.
TABLE 2.
Comparisons of Imaging Features in Training and Validation Cohort
| Imaging Features | Training Cohort (n = 77) | Validation Cohort (n = 33) | ||||
|---|---|---|---|---|---|---|
| Low Ki67 Group (n = 27) | High Ki67 Group (n = 50) | P | Low Ki67 Group (n = 11) | High Ki67 Group (n = 22) | P | |
| Maximum length, median (IQR), cm | 3.5 (2.3–5.0) | 4.3 (2.3–7.2) | 0.337 | 2.5 (1.2–3.8) | 4.9 (3.6–8.4) | 0.009 |
| No. tumors (%) | 0.377 | 0.681 | ||||
| Solitary | 16 (59.3) | 36 (72.0) | 9 (81.8) | 15 (68.2) | ||
| Multiple | 11 (40.7) | 14 (28.0) | 2 (18.2) | 7 (31.8) | ||
| Tumor margin (%) | 0.049 | 0.036 | ||||
| Smooth | 20 (74.1) | 24 (48.0) | 9 (81.8) | 8 (36.4) | ||
| Nonsmooth | 7 (25.9) | 26 (52.0) | 2 (18.2) | 14 (63.6) | ||
| Peritumoral arterial enhancement (%) | 0.125 | 0.259 | ||||
| Absent | 23 (85.2) | 33 (66.0) | 9 (81.8) | 13 (59.1) | ||
| Present | 4 (14.8) | 17 (34.0) | 2 (18.2) | 9 (40.9) | ||
| Enhancement pattern (%) | 1 | 1 | ||||
| Typical | 26 (96.3) | 47 (94.0) | 10 (90.9) | 21 (95.5) | ||
| Atypical | 1 (3.7) | 3 (6.0) | 1 (9.1) | 1 (4.5) | ||
| Tumor hypointensity on HBP (%) | 1 | 1 | ||||
| Present | 25 (92.6) | 47 (94.0) | 10 (90.9) | 19 (86.4) | ||
| Absent | 2 (7.4) | 3 (6.0) | 1 (9.1) | 3 (13.6) | ||
| Peritumoral hypointensity on HBP (%) | 0.119 | 0.687 | ||||
| Absent | 25 (92.6) | 38 (76.0) | 10 (90.9) | 19 (86.4) | ||
| Present | 2 (7.4) | 12 (24.0) | 1 (9.1) | 3 (13.6) | ||
| Radiologic capsule (%) | 0.948 | 0.121 | ||||
| Present | 22 (81.5) | 39 (78.0) | 6 (54.5) | 18 (81.8) | ||
| Absent | 5 (18.5) | 11 (22.0) | 5 (45.5) | 4 (18.2) | ||
| SITumor (b = 800 s/mm2) | 124.8 (13.8) | 188.7 (16.2) | 0.014 | 122.8 (47.8) | 168.4 (95.6) | 0.148 |
| SIBackground (b = 800 s/mm2) | 6.1 (0.6) | 6.4 (0.4) | 0.439 | 7.0 (0.8) | 6.1 (0.7) | 0.259 |
| SILiver (b = 800 s/mm2) | 55.0 (6.6) | 67.7 (6.2) | 0.219 | 54.4 (21.0) | 54.7 (32.5) | 0.975 |
| ADCTumor (×10−3 mm2/s) | 1075.7 (55.1) | 1003.4 (35.1) | 0.127 | 1146.4 (78.4) | 1045.1 (51.3) | 0.237 |
| SNR | 44.9 (6.0) | 67.9 (5.8) | 0.014 | 44.2 (17.2) | 60.6 (34.4) | 0.148 |
| Contrast | 2.5 (0.2) | 3.1 (0.2) | 0.121 | 2.6 (0.4) | 3.5 (0.4) | 0.079 |
P-values are statistically significant in boldface format.
Radiomics Analysis
A total of 186 radiomic features were extracted from DWI and ADC maps. Nine features selected by the least absolute shrinkage and selection operator algorithm in the training cohort were used for calculating radiomic feature score (rad score) and constructing the radiomic model (Figs. 3A, B). The weighted coefficients of nonzero parameters are displayed (Fig. 3C). Among them, 6 features were derived from DWI including kurtosis (fall under histogram), total energy (first order statistics), Inverse Difference Moment Normalized (gray level co-occurrence matrix), large dependence emphasis (GLDM), busyness (NGTDM), strength (NGTDM), and 3 features derived from ADC images including large dependence emphasis (GLDM), large dependence low gray level emphasis (GLDM), and zone percentage (gray level size zone matrix). The high Ki67 expressing patients exhibited a higher rad score than the low Ki67 expressing patients in both cohorts (P < 0.05, both).
FIGURE 3.

Selection of radiomics features using the LASSO algorithm. These showed LASSO coefficient analysis of the 186 radiomics features (A, B), and 9 nonzero coefficients were finally selected (C). LASSO, least absolute shrinkage and selection operator. This figure can be viewed in color online at www.jcat.org.
Model Construction and Evaluation
Multivariate logistic regression analysis demonstrated serum AFP level, age, and SNR as independent risk factors of Ki67 level and were subsequently included in the building of a clinical model. Serum AFP level, age, and rad score were independent predictors of Ki67 level and were subsequently incorporated in the clinical radiomic fusion model (Table 3). The AUC of the clinical model was 0.799 (95% CI, 0.688–0.909) and 0.715 (95% CI, 0.532–0.897) in the training and validation cohorts, respectively. The radiomic model exhibited an AUC of 0.833 (95% CI, 0.741–0.926) and 0.772 (95% CI, 0.596–0.950) in the training and validation cohorts, respectively (Fig. 4). The clinical radiomic model yielded an AUC of 0.901 (95% CI, 0.827–0.975) in the training cohort with an accuracy, sensitivity, and specificity of 0.833, 0.960, and 0.740, respectively. The model yielded an AUC of 0.781 (95% CI, 0.606–0.956) in the validation cohort with an accuracy, sensitivity, and specificity of 0.697, 0.727, and 0.636, respectively (Table 4). Moreover, the nomogram of the clinical radiomic fusion model was developed to visualize the risk probability of Ki67 level (Fig. 5A).
TABLE 3.
Multivariate Logistic Regression Analysis of Ki67 Level Based on Clinical and Radiomic Data in the Training Cohort
| Different Models | Variable | β | Odds Ratio (95% CI) | P |
|---|---|---|---|---|
| Clinical model | Intercept | 3.556 | 0.022 | |
| Serum AFP | −1.464 | 0.231 (0.073–0.688) | 0.010* | |
| Age | −0.060 | 0.941 (0.892–0.986) | 0.015* | |
| SNR | 0.019 | 1.020 (1.003–1.039) | 0.026* | |
| Clinical radiomic model | Intercept | 0.261 | 0.881 | |
| Serum AFP | −1.789 | 0.167 (0.038–0.630) | 0.011* | |
| Age | −0.071 | 0.931 (0.873–0.985) | 0.019* | |
| Rad score | 8.179 | 3.566 (0.088–49.764) | <0.001* |
*P < 0.05.
FIGURE 4.

The receiver operating characteristics curves of different models for prediction of Ki67 level in the training and validation cohort. The clinical model (A), radiomic model (B), and the clinical radiomic model (C) that combines the clinic radiological factors and radiomic signatures. This figure can be viewed in color online at www.jcat.org.
TABLE 4.
Predictive Efficacy of the Clinical Model, Radiomics Model, and the Combined Model
| Different Models | Training Cohort (n = 77) | Validation Cohort (n = 33) | Cut-Off Value | |||||||
|---|---|---|---|---|---|---|---|---|---|---|
| AUC (95% CI) | Accuracy | Sensitivity | Specificity | AUC (95% CI) | Accuracy | Sensitivity | Specificity | |||
| Clinical model | 0.799 | 0.766 | 0.800 | 0.704 | 0.715 | 0.636 | 0.545 | 0.818 | 0.595 | |
| (0.688–0.909) | (0.532–0.897) | |||||||||
| Radiomic model | 0.833 | 0.740 | 0.680 | 0.852 | 0.772 | 0.667 | 0.636 | 0.727 | 0.667 | |
| (0.741–0.926) | (0.596–0.950) | |||||||||
| Clinical radiomic model | 0.901 | 0.833 | 0.960 | 0.740 | 0.781 | 0.697 | 0.727 | 0.636 | 0.467 | |
| (0.827–0.975) | (0.606–0.956) | |||||||||
FIGURE 5.
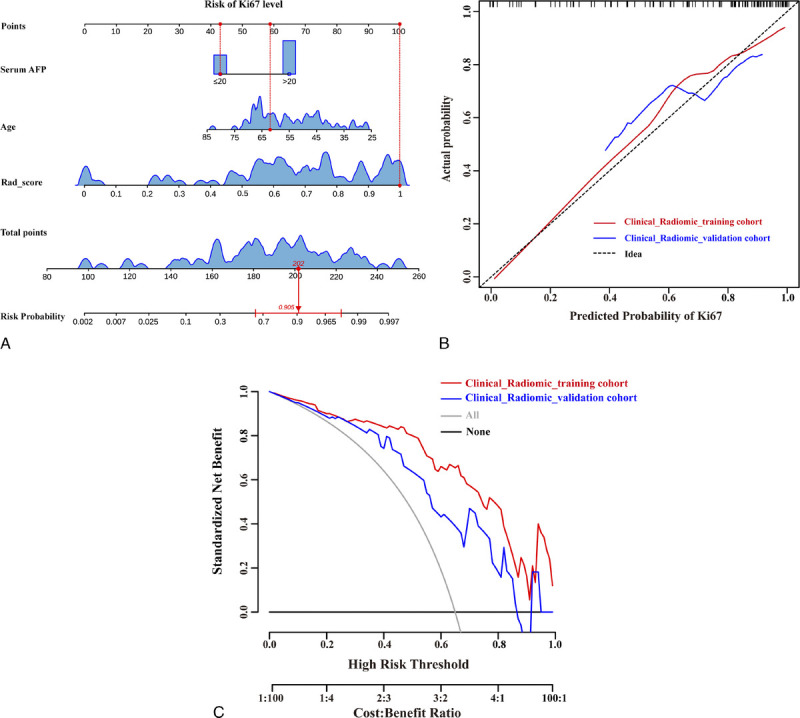
Nomogram construction of the clinical radiomic model, which incorporated serum AFP level, age and rad score (A). Calibration curves of clinical radiomic model in the training and validation cohorts (B). The decision curve analysis based on clinical radiomic model in the training and validation cohorts (C). This figure can be viewed in color online at www.jcat.org.
The performance of the fusion model was superior to the clinical model and radiomic models in the training cohort (AUCs, 0.901 vs 0.799; 0.901 vs 0.833; P<0.05); however, DeLong test demonstrated no difference in the validation cohort (AUCs, 0.781 vs 0.715; 0.781 vs 0.772; P>0.05). The calibration curves further revealed that the predicted probability of the fusion model was a good fit with the actual Ki67 levels observed in the training cohort (Fig. 5B). The decision curves showed that the net benefit of clinical usefulness of the fusion nomogram was greater than the assumption of all/none patients experiencing high Ki67 expression (Fig. 5C).
DISCUSSION
In this study, our research revealed that serum AFP, age, and SNR were independent risk factors for Ki67 expression in a clinical model. The predictive efficacies of the clinical model with the aforementioned factors and radiomic model based on DWI and ADC maps were satisfactory for discriminating between low and high Ki67 expression in training and validation cohorts. The AUC of the fusion model including serum AFP, age and rad score was excellent, reaching 0.901 in the training cohort. The AUC of the fusion model in the validation cohort was less satisfactory, at 0.781. This may be due to the relatively low sample size in validation cohort and overfitting in training cohort. Even though the nomogram integrated radiomic features of DWI and ADC, images exhibited potential predictive performance. A larger sample study remains necessary to validate these findings.
Currently, the sequence of DWI is most frequently applied in clinical research.28–30 It has improved the spatial resolution because of advances in technology.16,17 Several studies have revealed that ADC can be a noninvasive quantitative parameter to evaluate histological grade, proliferation rate, and molecular subtype of tumors.29,31 Huang et al27 revealed that the Ki67 expression level was negatively correlated with ADC values (r = −0.371, P = 0.01), although it is a conventional quantitative parameter. In this study, we used a popular image processing technology called radiomics to extract extensive data from DWI and ADC maps. Hu et al18 evaluated the value of whole-tumor histogram parameters derived from ADC map for the prediction of Ki67 labeling index. Areas under the receiver operator characteristics curve for identification of high Ki67 expression were 0.78, 0.77, 0.79, 0.82, and 0.76 for the mean, median, 5th, 25th, and 75th percentiles of ADC, respectively. In this study, we used only 2D ROIs. It is recommended in future study to expand the inclusion of 3D ROIs. Another limitation of this study involved a tendency for artifact and deformation of the edge layers of DWI and ADC images during the delineation of ROIs of the whole tumor. This may have affected radiomic feature extraction and analysis. In radiomic analysis, 9 features (6 and 3 features derived from DWI and ADC images, respectively) are typically selected to construct the radiomic model. Two of the features in the radiomic model included DWI large dependence emphasis and ADC large dependence emphasis. Although these have opposing weights in the model, because ADC maps are derived from DWI images, the calculation for ADC was ADC = ln (SIlow/SIhigh)/(bhigh − blow). There may be some feature differences between ADC maps and DWI images calculated by the aforementioned formula and processed by the ADC noise threshold; however, the biological significance of this remains to be prospectively verified. The AUC of the radiomic model was based on the largest section of DWI and ADC maps, reaching 0.833 and 0.772 in the training and validation cohorts, respectively.
Regarding the clinical factors of our study, serum AFP was significantly different between the low and high Ki67 expressing subgroups. This result was consistent with a previous study (P = 0.032).21 In contrast, some studies have concluded that serum AFP was not significantly altered between the low and high Ki67 expressing groups (P > 0.05).32,33 This discrepancy may be due to the cutoff value of Ki67 level selected between studies, in addition to deviations in sample size. In addition, in this study, age was an independent risk factor (OR [95% CI], 0.941 [0.892–0.986]; P = 0.015) of Ki67 expression. The younger the patient was, the higher probability of high Ki67 expression. Other researchers have not reported this result, and further research is needed to verify this finding. The tumor margin was significantly different between the 2 groups. The high Ki67 expressing groups was more frequently observed to have a nonsmooth tumor margin in HCC. A possible reason for this might be that the nuclear Ki67 protein is closely related with cell proliferative activity, causing different growth speeds in different growth phases (eg, G1 or G2/M phases).19,34 There were no other morphological characteristics that exhibited statistically significant differences between the low and high Ki67 expressing groups. Ultimately, the AUC of clinical model constructed by serum AFP, age, and SNR was 0.799 and 0.715 in training and validation cohorts, respectively. This demonstrated a consistent and acceptable predictive efficacy. Moreover, when clinical features were combined with conventional quantitative data (SI, SNR, etc) and radiomic features to develop a fusion model, the satisfactory prediction efficiency was further enhanced.
This study was a single-center retrospective design, which may have introduced some selection bias despite best efforts to follow strict inclusion and exclusion criteria. In addition, the small sample size of this study requires validation in larger, prospective, multicenter study. Second, we only used 2D ROIs of DWI for the evaluation of Ki67 expression. It should be noted that 3D ROIs may better reflect the ADC values in the whole tumor but may also increase susceptibility to artifacts and deformation, which can affect the stability of radiomic features and increase the labor cost of delineating ROIs. Third, free-breathing acquisition may inherently result in motion artifacts, as demonstrated by the elevated bilirubin in our validation cohort. This may translate to differences in underlying severity of liver disease, which may in turn affect model accuracy. Finally, the cases were categorized according to the cutoff value (10%) of Ki67 expression in our study, although other studies have opted to use different cutoff values.14
In conclusion, this study has constructed the clinical model, radiomic model, and fusion model based on DWI and ADC maps for noninvasively predicting the Ki67 expression. Although there was no significant difference in validation cohort of the clinical, radiomic, and fusion models, DWI and ADC map as quantitative imaging biomarker may contribute potential value for noninvasive evaluation of the proliferation rate of HCC.
Footnotes
Chuan Yan and Zewen Han contributed equally to this work and are co-first authors.
This study has received funding by Natural Science Foundation of Fujian Province (number 2022J02033).
The authors declare no conflict of interest.
Contributor Information
Chuan Yan, Email: fjyanc@163.com.
Zewen Han, Email: fjmuhzw@163.com.
Xiaojie Chen, Email: fjmucxj@163.com.
Lanmei Gao, Email: fjmuglm@163.com.
Rongping Ye, Email: rongpingye222@163.com.
REFERENCES
- 1.Sung H Ferlay J Siegel RL, et al. Global Cancer Statistics 2020: GLOBOCAN estimates of incidence and mortality worldwide for 36 cancers in 185 countries. CA Cancer J Clin. 2021;71:209–249. [DOI] [PubMed] [Google Scholar]
- 2.Zhang N Jiang W Zhang Y, et al. Individualised tailored assessment of therapeutic alternatives for HCC patients within the Milan criteria. Gut. 2020;69:1893–1895. [DOI] [PMC free article] [PubMed] [Google Scholar]
- 3.Lee JM Jang BK Lee YJ, et al. Survival outcomes of hepatic resection compared with transarterial chemoembolization or sorafenib for hepatocellular carcinoma with portal vein tumor thrombosis. Clin Mol Hepatol. 2016;22:160–167. [DOI] [PMC free article] [PubMed] [Google Scholar]
- 4.Xu XL Liu XD Liang M, et al. Radiofrequency ablation versus hepatic resection for small hepatocellular carcinoma: systematic review of randomized controlled trials with meta-analysis and trial sequential analysis. Radiology. 2018;287:461–472. [DOI] [PubMed] [Google Scholar]
- 5.Wakayama K Kamiyama T Yokoo H, et al. Huge hepatocellular carcinoma greater than 10 cm in diameter worsens prognosis by causing distant recurrence after curative resection. J Surg Oncol. 2017;115:324–329. [DOI] [PubMed] [Google Scholar]
- 6.An C Kim DW Park YN, et al. Single hepatocellular carcinoma: preoperative MR imaging to predict early recurrence after curative resection. Radiology. 2015;276:433–443. [DOI] [PubMed] [Google Scholar]
- 7.Sherr CJ. Cancer cell cycles. Science. 1996;274:1672–1677. [DOI] [PubMed] [Google Scholar]
- 8.Yerushalmi R Woods R Ravdin PM, et al. Ki67 in breast cancer: prognostic and predictive potential. Lancet Oncol. 2010;11:174–183. [DOI] [PubMed] [Google Scholar]
- 9.Cao Y Ke R Wang S, et al. DNA topoisomerase IIα and Ki67 are prognostic factors in patients with hepatocellular carcinoma. Oncol Lett. 2017;13:4109–4116. [DOI] [PMC free article] [PubMed] [Google Scholar]
- 10.Zhang X Wu Z Peng Y, et al. Correlationship between Ki67, VEGF, and p53 and hepatocellular carcinoma recurrence in liver transplant patients. Biomed Res Int. 2021;2021:6651397. [DOI] [PMC free article] [PubMed] [Google Scholar]
- 11.Nakanishi K Sakamoto M Yamasaki S, et al. Akt phosphorylation is a risk factor for early disease recurrence and poor prognosis in hepatocellular carcinoma. Cancer. 2005;103:307–312. [DOI] [PubMed] [Google Scholar]
- 12.Luo Y Ren F Liu Y, et al. Clinicopathological and prognostic significance of high Ki-67 labeling index in hepatocellular carcinoma patients: a meta-analysis. Int J Clin Exp Med. 2015;8:10235–10247. [PMC free article] [PubMed] [Google Scholar]
- 13.Wang YL Du JL Shi HY, et al. Expression of cyclin D1, p21~(WAF1), p53 and Ki-67 in hepatocellular carcinoma: a pathological study [J]. Medical Journal of Chinese People's Liberation Army. 2014;39:20–24. [Google Scholar]
- 14.Li HH Qi LN Ma L, et al. Effect of KI-67 positive cellular index on prognosis after hepatectomy in Barcelona Clinic Liver Cancer stage A and B hepatocellular carcinoma with microvascular invasion. Onco Targets Ther. 2018;11:4747–4754. [DOI] [PMC free article] [PubMed] [Google Scholar]
- 15.Yang JD, Heimbach JK. New advances in the diagnosis and management of hepatocellular carcinoma. BMJ. 2020;371:m3544. [DOI] [PubMed] [Google Scholar]
- 16.Bogner W Pinker-Domenig K Bickel H, et al. Readout-segmented echo-planar imaging improves the diagnostic performance of diffusion-weighted MR breast examinations at 3.0 T. Radiology. 2012;263:64–76. [DOI] [PubMed] [Google Scholar]
- 17.Li L Wang L Deng M, et al. Feasibility study of 3-T DWI of the prostate: readout-segmented versus single-shot echo-planar imaging. AJR Am J Roentgenol. 2015;205:70–76. [DOI] [PubMed] [Google Scholar]
- 18.Hu XX Yang ZX Liang HY, et al. Whole-tumor MRI histogram analyses of hepatocellular carcinoma: correlations with Ki-67 labeling index. J Magn Reson Imaging. 2017;46:383–392. [DOI] [PubMed] [Google Scholar]
- 19.Chen Y Qin X Long L, et al. Diagnostic value of Gd-EOB-DTPA-enhanced MRI for the expression of Ki67 and microvascular density in hepatocellular carcinoma. J Magn Reson Imaging. 2020;51:1755–1763. [DOI] [PubMed] [Google Scholar]
- 20.Incoronato M Aiello M Infante T, et al. Radiogenomic analysis of oncological data: a technical survey. Int J Mol Sci. 2017;18. [DOI] [PMC free article] [PubMed] [Google Scholar]
- 21.Li Y Yan C Weng S, et al. Texture analysis of multi-phase MRI images to detect expression of Ki67 in hepatocellular carcinoma. Clin Radiol. 2019;74:813.e819–813.e827. [DOI] [PubMed] [Google Scholar]
- 22.Bahl G Cruite I Wolfson T, et al. Noninvasive classification of hepatic fibrosis based on texture parameters from double contrast-enhanced magnetic resonance images. J Magn Reson Imaging. 2012;36:1154–1161. [DOI] [PMC free article] [PubMed] [Google Scholar]
- 23.Choi B Choi IY Cha SH, et al. Feasibility of computed tomography texture analysis of hepatic fibrosis using dual-energy spectral detector computed tomography. Jpn J Radiol. 2020;38:1179–1189. [DOI] [PubMed] [Google Scholar]
- 24.Chamming's F Ueno Y Ferré R, et al. Features from computerized texture analysis of breast cancers at pretreatment MR imaging are associated with response to neoadjuvant chemotherapy. Radiology. 2018;286:412–420. [DOI] [PubMed] [Google Scholar]
- 25.Fedorov A Beichel R Kalpathy-Cramer J, et al. 3D slicer as an image computing platform for the quantitative imaging network. Magn Reson Imaging. 2012;30:1323–1341. [DOI] [PMC free article] [PubMed] [Google Scholar]
- 26.van Griethuysen JJM Fedorov A Parmar C, et al. Computational radiomics system to decode the radiographic phenotype. Cancer Res. 2017;77:e104–e107. [DOI] [PMC free article] [PubMed] [Google Scholar]
- 27.Huang Z Xu X Meng X, et al. Correlations between ADC values and molecular markers of Ki-67 and HIF-1α in hepatocellular carcinoma. Eur J Radiol. 2015;84:2464–2469. [DOI] [PubMed] [Google Scholar]
- 28.Baltzer A Dietzel M Kaiser CG, et al. Combined reading of contrast enhanced and diffusion weighted magnetic resonance imaging by using a simple sum score. Eur Radiol. 2016;26:884–891. [DOI] [PubMed] [Google Scholar]
- 29.Zhang M Horvat JV Bernard-Davila B, et al. Multiparametric MRI model with dynamic contrast-enhanced and diffusion-weighted imaging enables breast cancer diagnosis with high accuracy. J Magn Reson Imaging. 2019;49:864–874. [DOI] [PMC free article] [PubMed] [Google Scholar]
- 30.Moon JY Kim SH Choi SY, et al. Differentiating malignant from benign hyperintense nodules on unenhanced T1-weighted images in patients with chronic liver disease: using gadoxetic acid-enhanced and diffusion-weighted MR imaging. Jpn J Radiol. 2018;36:489–499. [DOI] [PubMed] [Google Scholar]
- 31.Horvat JV Bernard-Davila B Helbich TH, et al. Diffusion-weighted imaging (DWI) with apparent diffusion coefficient (ADC) mapping as a quantitative imaging biomarker for prediction of immunohistochemical receptor status, proliferation rate, and molecular subtypes of breast cancer. J Magn Reson Imaging. 2019;50:836–846. [DOI] [PMC free article] [PubMed] [Google Scholar]
- 32.Zhao YF Xiong X Chen K, et al. Evaluation of the therapeutic effect of adjuvant transcatheter arterial chemoembolization based on Ki67 after hepatocellular carcinoma surgery. Front Oncol. 2021;11:605234. [DOI] [PMC free article] [PubMed] [Google Scholar]
- 33.Li Y Chen J Weng S, et al. Clin Radiol. 2019;74:653.e651–653.e659. [DOI] [PubMed] [Google Scholar]
- 34.Grigioni WF D'Errico A Bacci F, et al. Primary liver neoplasms: evaluation of proliferative index using MoAb Ki67. J Pathol. 1989;158:23–29. [DOI] [PubMed] [Google Scholar]