

Abstract
Phenylhydroxylamine (PhNHOH) and nitrosobenzene (PhNO) interact with human tetrameric hemoglobin (Hb) to form the nitrosobenzene adduct Hb(PhNO). These interactions also frequently lead to methemoglobin formation in red blood cells. We utilize UV-vis spectroscopy and X-ray crystallography to identify the primary and secondary products that form when PhNHOH and related alkylhydroxylamines (RNHOH; R = Me, t-Bu) react with human ferric Hb. We show that with MeNHOH, the primary product is Hb[α-FeIII(H2O)][β-FeII(MeNO)], in which nitrosomethane is bound to the β subunit but not the α subunit. Attempts to isolate a nitrosochloramphenicol (CAMNO) adduct resulted in our isolation of a Hb[α-FeII][β-FeII-cySOx]{CAMNO} product (cySOx = oxidized cysteine) in which CAMNO was located outside of the protein in the solvent region between the β2 and α2 subunits of the same tetramer. We also observed that the βcys93 residue had been oxidized. In the case of t-BuNHOH, we demonstrate that the isolated product is the β-hemichrome Hb[α-FeIII(H2O)][β-FeIII(His)2]{t-BuNHOH}, in which the β heme has slipped ~4.4 Å towards the solvent exterior to accommodate the bis-His heme coordination. When PhNHOH is used, a similar β-hemichrome Hb[α-FeIII(H2O)][β-FeIII(His)2-cySOx]{PhNHOH} was obtained. Our results reveal, for the first time, the X-ray structural determination of a β-hemichrome structure of a human Hb derivative. Our UV-vis and X-ray crystal structural result reveal that although Hb(PhNO) and Hb(RNO) complexes may form as primary products, attempted isolation of these products by crystallization may result in the structural determination of their secondary products which may contain β-hemichromes en route to further protein degradation.
Keywords: hemoglobin, nitrosoalkane, nitrosobenzene, hemichrome, crystallography, heme
Graphical Abstract

1. Introduction
It has long been known that phenylhydroxylamine (PhNHOH) and nitrosobenzene (PhNO) are potent inducers of methemoglobin (metHb) formation from the ferrous precursors in healthy red blood cells [1, 2], and in some cases, they cause ferrihemoglobinemia [3]. It has also been determined that PhNHOH is an active metabolite responsible for the onset of aniline-induced hemolytic anemia [4, 5]. PhNHOH and its substituted analogues have also been implicated in some cancers [3]. Interestingly, PhNHOH may also reduce ferric Hb to its ferrous form [6] and may subsequently react to form the nitrosobenzene adduct Hb(PhNO) [7].
In addition to studies with PhNHOH, we are interested in alkylhydroxylamines and their interactions with heme proteins. N-Methylhydroxylamine and other such hydroxylamines are employed in the chemical industry and are known to interact with Hb in blood to generate, in part, reactive radicals involved in several pathological processes [8, 9]. The nitroso derivative, namely nitrosomethane (MeNO), is generated from the metabolic activation of aziridine-based antitumor drugs and inhibits mitochondrial respiration [10]. N-t-BuNHOH is a mitochondrial antioxidant that protects mitochondrial function both in vitro and in vivo [11]. We also include a nitrososarene derivative of chloramphenicol (CAM). CAM is a broad-spectrum antibiotic for which toxicity concerns have diminished its popular use. The main contribution to CAM toxicity has been shown to involve disruption of blood cell production, an effect that is associated with aplastic anemia, as well as the nitroreduction of CAM leads to the generation of the toxic CAMNO/CAMNHOH intermediates responsible for the observed stem cell damage [12]. CAMNO diffuses readily across the membranes of red blood cells and is rapidly metabolized within minutes; contributing to this metabolism is its interaction with both the cysteine and heme groups of blood hemoglobin [13].
There are three main routes that lead to the formation of nitrosoalkane/-arene complexes of Hb. The first is the straightforward addition of nitrosoarene reagents (ArNO; Ar = aryl group) to ferrous Hb solutions (eq 1) [14–19]. This method is essentially limited to nitrosoarenes, as nitrosoalkanes with primary H-atoms (i.e., R2CHN=O) readily tautomerize in solution from their nitroso forms to their oxime derivatives (R2C=NOH). Consequently, the nitrosoalkanes are frequently generated in situ from either reduction of nitroalkane precursors (eq 2) [20–23] or oxidation of arylhydroxylamines (eq 3) [7, 21].
| (1) |
| (2) |
| (3) |
While the methodology in eq 3 is not uncommon for preparation of nitrosoarene complexes of Hb, and with the exception of our report on the preparation of Mb- and Hb-nitrosoamphetamine complexes [24, 25], we are not aware of this oxidative route employing alkylhydroxylamines for the preparation of other Hb(RNO) complexes.
In this article, we probe the reactions of PhNHOH and alkylhydroxylamines RNHOH (eq 3; R = Me, t-Bu) with Hb to examine the formation of the nitrosoarene/-alkane (RNO; Fig. 1) primary Hb(PhNO) and Hb(RNO) derivatives in solution by UV-vis spectroscopy. As this oxidative route, using PhNHOH, resulted in initial Hb(PhNO) formation and subsequent degradation to oxidized Hb products [1, 3–5, 21, 26], we utilized this route for the alkylhydroxylamines and for PhNHOH to prepare crystals suitable for single-crystal X-ray crystallography, to help identify the primary and/or secondary (degradation) products in these reactions. We also employed the methodology in eq 1 to probe the reaction of Hb with CAMNO (Fig. 1) in solution, and to identify a product resulting from attempted crystallization of the presumed Hb(CAMNO) adduct. We show that the Hb(PhNO) and Hb(RNO) (R = Me, CAM) products are formed in solution, generally consistent with literature expectations. We also determine the crystal structures of products obtained during attempted crystallization of these primary products, and reveal the formation and identities of new Hb hemichromes.
Fig. 1.

Sketches of the RNO (R = Me, t-Bu, CAM) and PhNO compounds being probed as ligands in this work
2. Results and Discussion
2.1. UV-vis spectral monitoring of the reactions
UV-vis spectroscopy was used to monitor the reaction between ferric HbIII(H2O) and the simplest alkylhydroxylamine MeNHOH. Over time, the Soret band at λ max 405 nm shifted to λmax 418 nm (Figs. 2A–B). In the Q band region, new bands at 540 nm and 572 nm appeared (inset of Fig. 2B). These shifts are indicative of the formation of a ferrous Fe–RNO derivative. The reaction reached its maximum extent of formation after ~1 h (inset of Fig. 2A). However, the reaction did not reach completion for Fe–RNO generation, as can be seen in the Soret band region, which retained a significant λ max 405 nm component (Fig. 2B). We were unable to distinguish, using the UV-vis results, between a scenario where only ~half of the Hb had reacted, and a scenario where MeNHOH was only reacting with either the α or β subunit but not both (see later; crystallography section).
Fig. 2.

Reactions of ferric HbIII(H2O) with MeNHOH. (A) Changes after addition of MeNHOH and a plot of ΔAbs(418–525) against time. (B) UV-vis spectra of the two forms observed during the reaction and a zoomed-in picture of the Q band region. Conditions: 100 mM sodium phosphate pH 7.4, [Hb] = 3 μM, [MeNHOH] = 1.6 mM.
The reaction of ferric HbIII(H2O) with the 1° but bulky amine chloramphenicol (CAM) was performed and monitored with UV-vis spectroscopy, however no changes in the UV-vis spectra were observed, indicating lack of reaction under our experimental conditions. Previous work by Eyer, Lierheimer and Schneller [13] had shown that Hb interacts with the nitroso derivative of CAM, namely nitrosochloramphenicol (CAMNO), under anaerobic conditions. Therefore, UV-vis spectroscopy was used to probe the anaerobic interaction between ferrous deoxyHbII and CAMNO.
After ~5 min, the Soret band of ferrous deoxyHbII at λ max 430 nm [27] shifted to 422 nm in the presence of CAMNO (Fig. 3), indicating the likely generation of a Fe–RNO derivative. The band at λ max 422 nm was stable for ~20 min, but slowly shifted over time to 406 nm (not shown), indicative of the formation of ferric HbIII and implying limited stability of the putative Hb(CAMNO) derivative.
Fig. 3.

UV-vis spectral changes during the reaction of ferrous deoxyHbII with CAMNO. Conditions: 0.1 M phosphate buffer at pH 7.4, [Hb] = 2.0 μM, final [CAMNO] = 600 μM.
In the case of the reaction between ferric HbIII(H2O) and t-BuNHOH, changes were observed in the Soret region during this reaction; the band at λ max 406 nm decreased and slightly shifted to 409 nm (Fig. 4). The largest differences were observed in the Q band region; new bands at 533 and 565 nm formed with a local minimum at 560 nm (inset of Fig. 4B). This pattern is consistent with the formation of a hemichrome containing a bis-histidyl coordinated ferric heme center [28].
Fig. 4.

UV-vis spectra of the reaction between ferric HbIII(H2O) and t-BuNHOH as well as a zoomed-in picture of the Q band region. Conditions: 100 mM sodium phosphate pH 7.4, [Hb] = 3 μM, [t-BuNHOH] = 1.6 mM.
When the arylhydroxylamine PhNHOH was employed in the reaction, the Soret band similarly shifted from λ max 406 nm to 422 nm (Figs. 5A–B), with two new bands at 540 nm and 560 nm appearing in the Q band region (inset of Fig. 5B). The reaction was essentially complete after ~25 min (inset of Fig. 5A). The changes in the spectra indicate that a ferrous Fe–RNO derivative likely formed. Interestingly, if the reaction was allowed to react for a longer period of time (~1 h), the solution within the cuvette became cloudy as a precipitate began to form, indicating degradation possibly through irreversible hemichrome (bis-his coordinated heme) formation (see later) [29].
Fig. 5.

Reactions of ferric HbIII(H2O) with PhNHOH. (A) Changes after addition of PhNHOH and a plot of ΔAbs(422–511) against time. (B) UV-vis spectra of the two forms observed during the reaction and a zoomed in picture of the Q band region. Conditions: 100 mM sodium phosphate pH 7.4, [Hb] = 3 μM, [PhNHOH] = 1.6 mM.
As the tentative nitrobenzene Hb(PhNO) product was unstable over time, we sought to compare its formation and stability with the monoheme Mb system. Upon mixing ferric wt swMbIII(H2O) with PhNHOH, the Soret region shifted from λ max 409 to 424 nm (Figs. 6A–B). Additionally, the Q bands at 543 and 561 nm formed (inset of Fig. 6B), indicative of the formation of a ferrous Fe–RNO derivative. The reaction was essentially complete after ~15 min (inset of Fig. 6A). To test the chemical reversibility of FeII–PhNO formation from its ferric FeIII precursor, the oxidant potassium ferricyanide was added to the ferrous product MbII(PhNO) in buffer (0.1 M sodium phosphate at pH 7.4). The original bands in the Soret band and in the Q band regions were regenerated (Fig. 6C), indicating a return to the ferric form of Mb.
Fig. 6.

Reactions of the ferric wt swMbIII(H2O) with PhNHOH. (A) Changes after addition of PhNHOH and a plot of ΔAbs(422–511) against time. (B) UV-vis spectra of ferric wt swMbIII(H2O) and ferrous wt swMbII(PhNO) observed during the reaction and a zoomed-in picture of the Q band region. (C) UV-vis spectra of the ferricyanide oxidation of ferrous wt swMbII(PhNO) to ferric wt swMbIII(H2O) and a zoomed-in picture of the Q band region. Conditions: 100 mM sodium phosphate pH 7.4, (A-B) [Mb] = 4.8 μM, [PhNHOH] = 800 μM; (C) [MbII(PhNO)] = 2.4 μM, [ferricyanide] = 200 μM.
2.2. Crystallography and analysis of the structures of the products
We previously reported the crystal structure of a MeNO derivative of Hb, namely that of the R-state Hb[α-FeII(MeNO)][β-FeII(MeNO)], in which both the α and β subunits had fully ligated Fe–MeNO moieties [23]. In this instance, the compound was prepared from the reaction of ferric Hb with MeNO2 in the presence of dithionite (eq 2 above).
Interestingly, the crystal structure of the product, solved to 1.93 Å resolution, from the hydroxylamine route (eq 3 above) revealed the formation of the Hb[α-FeIII(H2O)][β-FeII(MeNO)] derivative (Fig. 7). Data collection and refinement statistics for this and the other crystal structures obtained in this work are shown in Table S1. Differences were observed between the α and β active sites. In both α subunits, water was bound to the Fe at the active site and in both β subunits, MeNO was N-bound to the iron. The fact that the MeNO only reacted with one subunit is consistent with the UV-vis spectroscopy data obtained during the reaction to form this derivative (Fig. 2).
Fig. 7.

X-ray crystal structure of Hb[α-FeIII(H2O)][β-FeII(MeNO)]. (A) Overall tetrameric form. Final model of the active site and Fo–Fc omit maps (contoured at 2 σ) of (B) the α1 subunit, and (C) the β1 subunit.
We then probed whether X-ray irradiation of the crystal altered the Fe oxidation states of the crystal as it is not uncommon for Fe-containing protein crystals to undergo photoreduction during high-intensity X-ray diffraction data collection. After X-ray data collection, the crystal used for the diffraction data collection was recovered and dissolved in buffer (0.1 M sodium phosphate at pH 7.4), and a UV-vis spectrum was obtained (Fig. 8). Two bands were seen in the Soret region at λmax 406 (ferric) and 420 nm (Fe–MeNO) which is consistent with the overall half-occupancy of MeNO in the tetrameric Hb[α-FeIII(H2O)][β-FeII(MeNO)] complex (see also UV-spectrum in Fig. 2), and helps establish that under our experimental conditions, Fe–MeNO adduct formation occurs with only one subunit and not both (Fig. 2).
Fig. 8.

UV-vis spectroscopy of the dissolved crystal of Hb[α-FeIII(H2O)][β-FeII(MeNO)] after X-ray diffraction data collection.
A comparison of our new R-state Hb[α-FeIII(H2O)][β-FeII(MeNO)] structure with that of the previously reported R-state Hb[α-FeII(MeNO)][β-FeII(MeNO)] [23] (obtained through the reductive pathway from reaction of ferric HbIII(H2O) with dithionite and MeNO2) yields an overall RMSD of 0.204 Å, with the largest deviations occurring, not surprisingly, in the α subunits. The superposition of the heme sites is shown in Fig. S1 in the Supplementary Information. In the earlier structure, the αHis58 residue swings out of the pocket ~16° (∠Nε2–Cβ–Nε2) to accommodate MeNO, which is still held in place by a H-bond with αHis58 (O…Nε = 2.7 Å). The Fe–MeNO moieties in both Hb structures mentioned above are similar in general orientation to our recently reported sperm whale myoglobin–MeNO (sw MbII(MeNO)) structure that also displays a nitroso O-atom H-bonding interaction with the distal His residue, as well as a MeNO (or the CH2=NOH tautomer) ligand at 50% occupancy in the Xe1 binding pocket below the heme macrocycle [30].
We were interested in the observation that the large ligand nitrosochloramphenicol CAMNO appears to form, based on UV-vis, spectral monitoring, an adduct with the heme site of ferrous deoxy HbII in solution (Fig. 3; λmax 422 nm), although its persistence in solution was very limited. Unfortunately, we could not crystallize the product where CAMNO was present the Hb active site. The X-ray crystal structure of the product obtained, namely ferrous Hb[α-FeII][β-FeII-cySOx]{CAMNO} (cySOx = oxidized cysteine) was solved to 1.75 Å resolution. The final tetrameric model and the active sites of one α and one β subunit are shown in Fig. 9. The α active site contains a fixed water molecule; however, the water does not lie perfectly above the Fe in the pocket and it is not coordinated with the Fe as it is too far away to form a direct Fe–H2O bond (3.5 Å, Fig. 9B). This fixed water molecule is stabilized by hydrogen bonding with His58 (2.7 Å). On the other hand, the heme of the β subunit is not bound to a sixth ligand or fixed water molecule (Fig. 9C).
Fig. 9.

X-ray crystal structure of Hb[α-FeII][β-FeII-cySOx]{CAMNO}. (A) Overall tetrameric form. Final model of the active site of the α1 (B) and β1 subunit (C).
In both active sites, the heme plane is not flat and is slightly distorted with the Fe center below the heme plane, indicating that the protein structure is likely in the T-state conformation. To further evaluate this, we compared the β2 FG and α1 C interface, referred to as the signature “switch” region, of Hb[α-FeII][β-FeII-cySOx]{CAMNO} and of a known T-state Hb structure (PDB id: 1B86) [31]. The overall RMSD between the two structures is 0.381 Å and their switch regions align well, indicating that Hb[α-FeII][β-FeII-cySOx]{CAMNO} is in the T-state conformation (Fig. 10) and that the unbound CAMNO molecule (Fig. 11) had very little effect on the overall protein structure.
Fig. 10.

Comparison of the α1β2 interface of Hb[α-FeII][β-FeII-cySOx]{CAMNO} (green) and T-state deoxyHb (cyan; PDB id: 1B86). Analysis of the representative key residues show that the Hb[α-FeII][β-FeII-cySOx]{CAMNO} structure presented in this work is in the T-state conformation.
Fig. 11.

(A) Fo-Fc omit map of the CAMNO molecule (contoured at 2.5 σ). (B) The CAMNO hydrogen bonding network.
The unbound CAMNO molecule was outside of the protein in the solvent region between the β2 and α2 subunits of the same tetramer (top right of Fig. 9A). The terminal nitroso group was modeled in two conformations (Fig. 11A; 50% occupancy each), and the CAMNO molecule was held in place through a series of hydrogen bonding interactions with fixed water molecules and nearby sidechains (Fig. 11B).
We found that the βCys93 residue had been oxidized in both β subunits, and these modifications were best modeled as sulfinic acids (cySO2H). Formation of such oxidized cysteine side chains has been reported previously for Hb-NOx biochemistry and crystallography (e.g., PDB id: 1RQ4) [32, 33], and will not be commented on further.
UV-vis spectral data were collected on the Hb[α-FeII][β-FeII-cySOx]{CAMNO} crystal used for the diffraction data collection to determine if any oxidation state changes had occurred during data collection. After X-ray data collection, the crystal was dissolved in 0.1 M sodium phosphate at pH 7.4, and a UV-vis spectrum was obtained (Fig. 12). A band at 430 nm in the Soret region and a band at 555 nm in the Q band region were observed. These bands match the spectrum for ferrous deoxyHbII confirming that the Hb[α-FeII][β-FeII-cySOx]{CAMNO} complex was in the ferrous form.
Fig. 12.

UV-vis spectroscopy of the dissolved crystal of Hb[α-FeII][β-FeII-cySOx]{CAMNO} after X-ray diffraction data collection.
Having determined the crystal structures of products from the reactions of Hb with the two 1° alkanes (MeNO and CAMNO), where in one case we determined clear ligand binding to heme Fe (i.e., with MeNO) and in another what we determined was a secondary product after the ligand binding event (i.e., with CAMNO), we then sought to obtain the structure of the product when a bulky 3° RNO is used, namely t-BuNO.
Crystallization of the product from the reaction of Hb with t-BuNHOH resulted in the formation of Hb[α-FeIII(H2O)][β-FeIII(His)2]{t-BuNHOH} derivative, whose X-ray crystal structure was solved to 2.20 Å resolution. Water was bound to the Fe at the active site in both α subunits. The α1 active site is shown in Fig. 13A.
Fig. 13.

Final models and 2Fo–Fc omit maps (contoured at 0.3σ) of (A) water in the α1 subunit active site of Hb[α-FeIII(H2O)][β-FeIII(His)2]{t-BuNHOH}, and (B) the hemichrome formed in the β1 subunit.
In both β subunits, the heme is shifted towards the outside of the pocket towards the solvent region, allowing for the formation of a hemichrome (Fig. 13B). A comparison of the heme sites of Hb[α-FeIII(H2O)][β-FeIII(His)2]{t-BuNHOH} (this work) and that of ferric HbIII(H2O) yielded an overall RMSD of 0.229, indicating that the two structures have high similarity, with the major differences occurring in the β subunit, as expected for hemichrome formation. Hemichrome formation caused the F-helix (residues β85–100) to move as His92 was pulled further into the solvent channel to remain coordinated to heme Fe. Formation of the hemichrome also caused a large shift of the heme Fe (Fe1–Fe2 = ~4.4 Å; Fig. 14B) out of the active site pocket towards the solvent exterior. The movement of the heme out of the pocket left room behind the heme on the inside of the pocket and a single t-BuNHOH was modeled into the new electron density in this area (Fig. S2 in the SI).
Fig. 14.

Overlay of the β1 active site (A) and hemes (B) of a ferric HbIII–H2O (PDB id: 3P5Q; cyan) and [α-FeIII(H2O)][β-FeIII(His)2]{t-BuNHOH} (magenta, this work).
Within the α subunits, the heme propionate groups are stabilized through H-bonding interactions with fixed waters and the nearby His58 and His45 residues (top of Fig. S3 in the SI). In both β subunits, the propionate groups are fixed through H-bonding with the nearby Lys66 and Lys59 residues (bottom of Fig. S3 in the SI). In the β1 subunit, however, the H-bonding interactions appear to be much weaker than those in the β2 subunit. Similar stabilization of the propionate groups was seen for ferric R-state HbIII(H2O) [34].
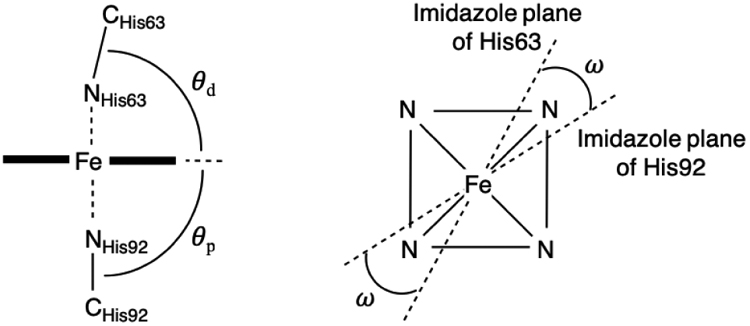
Table 1 summarizes the geometrical parameters of the β-hemichrome in the Hb[α-FeIII(H2O)][β-FeIII(His)2]{t-BuNHOH} complex. The parameters measured include the tilt angle between the heme plane and the proximal (θp) and the distal (θd) histidine imidazole planes and the dihedral angle between the two imidazole planes (ω) as well as the bond angle Nε2im–Fe–Nε2im, and selected distance measurements. These parameters are within the reported ranges for hemichromes in other X-ray crystal structures [35, 36].
Table 1.
Selected geometrical parameters for the hemichromes in the β subunits of the Hb[α-FeIII(H2O)][β-FeIII(His)2] derivatives from the reactions of ferric Hb with t-BuNHOH and PhNHOH
| from t-BuNHOHa | from PhNHOHb | |||
|---|---|---|---|---|
| β1 | β2 | β1 | β2 | |
| θp (°) | 79 | 87 | 90 | 90 |
| θd (°) | 84 | 80 | 80 | 79 |
| Nε2im-Fe-Nε2im (°) | 174 | 178 | 177 | 176 |
| ω (°) | 78 | 70 | 72 | 67 |
| Fe-Nε2im (Å) | ||||
| Dist. | 2.4 | 2.4 | 2.1 | 2.1 |
| Cαprox- Cαdist (Å) | 13.0 | 12.9 | 12.7 | 12.7 |
| βcys93 oxidized | no | no | no | yes |
Hemichrome β-subunit from the reaction with t-BuNHOH.
Hemichrome β-subunit from the reaction with PhNHOH.
We next turned our attention to crystallizing the products resulting from the reactions of Hb with an arylhydroxylamine, namely PhNHOH. We note that only one crystal structure has been published, in the early 1980s, of a heme in complex with PhNO, that of ferrous legHbII-PhNO [37, 38]. Another structure, that of hh MbII(PhNO) was deposited in the PDB (PDB id: 2NSS) [39]
Although UV-vis spectral monitoring of the reaction between ferric HbIII and PhNHOH revealed the formation of the ferrous HbII(PhNO) complex (Fig. 6), the product was not stable in solution under our experimental conditions, as evidenced by its degradation over time to a cloudy solution. We were, however, successful at crystallizing a degradation product from the reaction, with the structure revealing the formation of a ferric β-hemichrome (Fig. 15).
Fig. 15.

The heme models and 2Fo-Fc omit maps (contoured at 0.5σ) of (A) water in the α1 active site of Hb[α-FeIII(H2O)][β-FeIII(His)2-cySOx]{PhNO}, and (B) the hemichrome formed in the β1 subunit.
The X-ray crystal structure of the product Hb[α-FeIII(H2O)][β-FeIII(His)2-cySOx]{PhNO}was solved to 1.89 Å resolution [40] Differences were observed between the α and β active sites. The α1 active site is shown in Fig. 15A; water was bound to the Fe at the active site in both α subunits.
In both β subunits, and similar to the hemichrome product from the t-BuNHOH reaction (Fig. 13B), the heme is shifted towards the outside of the pocket allowing for the formation of a hemichrome (Fig. 15B). Formation of a hemichrome causes large movements in the F helix (residues β85–100) as the proximal His92 residue is drawn further out of the pocket to stay coordinated to the heme Fe (Fig. 16A). Additionally, there is a large shift (4.5 Å Fe1–Fe2) of the heme towards the outside of the pocket (Fig. 16B). The movement of the heme out of the pocket left room behind the heme on the inside of the pocket, and two PhNO molecules were observed to sit in this area (Fig. S4).
Fig. 16.

Overlay of the β1 active site (A) and hemes (B) of a ferric HbIII–H2O (PDB id: 3P5Q; cyan) and [α-FeIII(H2O)][β-FeIII(His)2-cySOx]{PhNO} (green, this work).
The propionate groups in both α subunits are stabilized through H-bonding interactions with fixed waters, Lys61 and His45 (top of Fig. 17). In both β subunits, one propionate group is fixed through H-bonding with nearby βLys66, but the orientation of the other propionate group differs between the two subunits (Fig. 17). In β1, the other propionate group is flexible, but in β2, the other propionate has only one orientation, stabilized by H-bonding with a fixed water molecule (bottom right of Fig. 17). Similar stabilization interactions were observed previously for ferric R-state HbIII–H2O [34]. Selected geometrical data for this β-hemichrome are listed in Table 1 above.
Fig. 17.

Hb[α-FeIII(H2O)][β-FeIII(His)2-cySOx]{PhNO} propionate interactions.
Additionally, and similar to what we observed for the t-BuNHOH reactions above, the βCys93 sidechains were found to be oxidized in both β subunits and were best modeled as sulfinic acid groups.
Although we were unable to crystallize a Hb(PhNO) complex, we were able to crystallize and solve the crystal structure of PhNO bound to the monoheme sw Mb at 1.75 Å resolution (Fig. 18).
Fig. 18.

The final model and (A) 2Fo–Fc omit map contoured at 1 σ, and (B) the Fo–Fc omit map contoured at 3 σ, of the heme active site of the ferrous wt swMbII(PhNO) derivative.
The resulting PhNO ligand was determined to be N-bound to the Fe (Fig. 18), which matches our UV-vis findings (with the hydrophobic portion of the ligand oriented towards the hydrophobic interior of the distal pocket in this protein. The structure is similar to that obtained for hh Mb (PDB id: 2NSS) [39], but different from what was reported for the legHbII(PhNO) compound where the aryl moiety was oriented towards the protein exterior [37, 38]. Superpositions of the heme sites of the sw MbII(PhNO) structure obtained here with those of hh MbII(PhNO) and legHbII(PhNO), respectively, are shown in Figs. S5 and S6 in the Supporting Information, and will not be commented on further.
Additional comments on hemichrome formation:
Typically in tetrameric Hb, hemichromes are only formed in either the α or the β chains, but not both [28]. In horse Hb, a hemichrome forms only in the α subunits [41], and in arctic fish Hb from Trematomus bernacchii, a hemichrome forms only in the β subunits [35]. Consistent with this notion of a single subunit (α or β) hemichrome formation, the reaction of ferric adult human HbIII–H2O with t-BuNHOH (Fig. 13) or PhNHOH (Fig. 15) produced hemichrome derivatives only in the β subunits. Observation of hemichromes only in the β chains of human tetrameric Hb is likely due to increased flexibility in the β chains. It has been reported that without the addition of an exogenous ligand, over a period of seven months, human Hb only half converts to a hemichrome [42]. This suggests that the hemichromes formed under our relatively short time periods are not an artifact of normal Hb degradation, but that the hemichrome formation is in fact caused by the addition of the PhNHOH and t-BuNHOH reagents.
There are only slight differences between the resulting overall structures generated from t-BuNHOH and PhNHOH addition to Hb (RMSD = 0.360 Å). As shown above in Figs. 14 and 16, the hemes in the β subunits of both structures are laterally displaced out of the heme pockets, in addition to that observation of large movements in the proximal F helix (residues β85–100) regions in order to accommodate hemichrome formation. The β-hemes in both structures have translated and rotated, ~4.4 – 4.5 Å (Fe1–Fe2) and 30°, respectively, out of the heme pocket resulting in bis-coordination of the Fe by both the distal and proximal His residues. A comparison of the β subunits of ferric HbIII–H2O, Hb[α-FeIII(H2O)][β-FeIII(His)2]{t-BuNHOH}, and Hb[α-FeIII(H2O)][β-FeIII(His)2-cySOx]{PhNO} is shown in Fig. 19.
Fig. 19.

Overlay of the β1 active sites (A) and hemes (B) of ferric HbIII–H2O (cyan, PDB ID: 3P5Q), Hb[α-FeIII(H2O)][β-FeIII(His)2-cySOx]{PhNO} (green, this work) and Hb[α-FeIII(H2O)][β-FeIII(His)2]{t-BuNHOH} (magenta, this work).
A comparison of the β2FG and α1C interface, referred to as the signature “switch” region [31], was made in order to determine the quaternary state of the full Hb tetramer. This comparison was made using representative X-ray crystal structures in the R state (PDB id: 1AJ9), RR3 state (PDB id: 3D17), R3 state (PDB id: 1YZI), RR2 state (PDB id: 1MKO) and R2 state (PDB id: 1BBB) conformations. The quaternary structures of both Hb[α-FeIII(H2O)][β-FeIII(His)2]{t-BuNHOH} and Hb[α-FeIII(H2O)][β-FeIII(His)2-cySOx]{PhNO} appear to be closest to the R state conformation. In the case of Hb[α-FeIII(H2O)][β-FeIII(His)2]{t-BuNHOH}, it has an RMSD of (i) 0.6 Å with the R conformation, (ii) 1.8 Å with the R2 conformation, (iii) 1.4 Å with the R3 conformation, (iv) 1.1 Å with the RR2 conformation, and (v) 0.8 Å with the RR3 conformation. For Hb[α-FeIII(H2O)][β-FeIII(His)2-cySOx]{PhNO}, it has an RMSD of (i) 0.7 Å with the R conformation, (ii) 1.0 Å with both the RR3 and R3 conformations, and (iii) 1.2 and 1.7 Å with the RR2 and R2 conformations, respectively. Although the quaternary structures of both Hb[α-FeIII(H2O)][β-FeIII(His)2]{t-BuNHOH} and Hb[α-FeIII(H2O)][β-FeIII(His)2-cySOx]{PhNO} are similar to the R conformation of Hb, there are significant localized structural differences, primarily in the β subunits as a result of the hemichrome formation. Due to movement of the respective F helices, the βHis97 residues in both Hb[α-FeIII(H2O)][β-FeIII(His)2]{t-BuNHOH} and Hb[α-FeIII(H2O)][β-FeIII(His)2-cySOx]{PhNO} have moved out of their characteristic classical R-state positions between αThr38 and αThr41 (Fig. 20).
Fig. 20.

Comparison of the signature switch regions of Hb[α-FeIII(H2O)][β-FeIII(His)2]{t-BuNHOH} (magenta, this work), Hb[α-FeIII(H2O)][β-FeIII(His)2-cySOx]{PhNO} (green, this work), and R-state Hb (grey, PDB id: 1AJ9).
The heme pocket is, in part, formed by the F-helix/FG-corner and C-helix/CD-corner/E-helix/EF-corner, and hemichrome formation caused large movements in these regions. Large backbone movements of the F-helix/FG-corner residues 85–100 occurred in both Hb[α-FeIII(H2O)][β-FeIII(His)2]{t-BuNHOH} (1.4 – 7.1 Å) and Hb[α-FeIII(H2O)][β-FeIII(His)2-cySOx]{PhNO} (1.5 – 6.8 Å), causing unwinding of residues 93–96 in the F helices as shown in Fig. 21. The surrounding heme environment comprised of residues 39–76 (C-helix/CD-corner/E-helix/EF-corner) also show significant positional differences between the structures (~1.0–1.5 Å; Fig. 22. Residues 41–43 and 46 of the CD-corner, and residues 59, 62, 63, 66, 74 and 75 of the E-helix moved the most in Hb[α-FeIII(H2O)][β-FeIII(His)2]{t-BuNHOH}, whereas residues 41–46 of the CD-corner, and residues 59, 62, 63, 66, 67, 73–75 of the E-helix moved the most in Hb[α-FeIII(H2O)][β-FeIII(His)2-cySOx]{PhNO}.
Fig. 21.

Comparison of the F-helix region (residues 85–100) of Hb[α-FeIII(H2O)][β-FeIII(His)2]{t-BuNHOH} (magenta, this work), Hb[α-FeIII(H2O)][β-FeIII(His)2-cySOx]{PhNO} (green, this work), and R-state Hb (grey, PDB id: 1AJ9).
Fig. 22.

Comparison of the C-helix/CD-corner/E-helix/EF-corner (residues 39–76) of Hb[α-FeIII(H2O)][β-FeIII(His)2]{t-BuNHOH} (magenta, this work), Hb[α-FeIII(H2O)][β-FeIII(His)2-cySOx]{PhNO} (green, this work), and R-state Hb (grey, PDB id: 1AJ9).
Importantly, this movement of the heme out of its natural position within the pocket appears to correlate with an early stage of heme loss, which eventually can lead to disease states such as anemia.
3. Conclusions
In this work, we set out to probe the reactions of ferric Hb with the hydroxylamines PhNHOH, MeNHOH, and t-BuNHOH. We show that for PhNHOH and MeNHOH, the nitrosoarene/-alkane products (Hb(RNO)) form in solution as determined by UV-vis spectroscopy. We show that, at least under our experimental conditions, t-BuNHOH does not react with ferric Hb to form a Hb(RNO) derivative, likely due to the steric bulk of the tertiary butyl group. Attempted crystallization of the products over longer periods (days/weeks) provided opportunities for us to obtain and identify secondary products from the degradation of these compounds. In the case of MeNHOH, we show that only the Hb β-subunit reacted to form the Fe–MeNO derivative, as determined by X-ray crystallography and consistent with the UV-vis spectral data in solution. We have also determined the crystal structures of two β-hemichromes resulting from the reactions of PhNHOH and t-BuNHOH with ferric Hb. To the best of our knowledge, these are the first human Hb β-hemichrome crystal structures to be reported. Our results thus provide new and important structural information regarding the nature of the degradation products when PhNHOH and alkylhydroxylamines react with oxidized human Hb.
4. Material and Methods
4.1. Purification of human metHb and swMb
Human blood was obtained from the Blood Bank at the University of Oklahoma Health Science Center in the form of packed cells, and the oxy hemoglobin was isolated as described previously [43], and converted to the oxidized ferric/met form using potassium ferricyanide and purified as reported previously [27, 34, 43]. The recombinant wt swMb plasmid containing a D122N mutation was gifted to our lab by Dr. Mario Rivera, and the protein was expressed as described previously [44, 45].
4.2. Reagents
N-Phenylhydroxylamine (PhNHOH), N-methylhydroxylamine hydrochloride (MeNHOH.HCl), N-t-butylhydroxylamine hydrochloride (tBuNHOH.HCl) and chloramphenicol (CAM) were purchased from Sigma-Aldrich and used as received. Nitrosochloramphenicol (CAMNO) was synthesized from CAM following a published protocol and the purity was verified by 1H NMR spectroscopy; the CAMNO product was dissolved in methanol prior to use.
4.3. UV-vis spectroscopy studies
UV-vis measurements were carried out using a Hewlett-Packard 8453 spectrophotometer. Quartz cuvettes (Starna Cells) equipped with screw caps were used for all experiments. All spectral measurements were carried out aerobically unless otherwise noted.
4.3.1. Ferric Hb with MeNHOH, t-BuNHOH, and PhNHOH.
These reactions were performed similarly. An initial reading was taken of the starting ferric HbIII(H2O) (15 μL of 30 mg/mL) in 0.1 M sodium phosphate buffer (2.5 mL, pH 7.4). The respective substrate (20 μL of a 200 mM solution in the same buffer) was then added to the cuvette. Spectral readings were taken at different time points during the course of the reaction to monitor its progress.
4.3.1. deoxyHb with CAMNO.
For this reaction, the buffer was degassed by bubbling nitrogen gas through it for ~30 min and transferred into an anaerobic MBraun chamber prior to use. Additionally, the cuvette was capped under nitrogen prior to their transfer from the anaerobic chamber to the spectrometer to prevent exposure to air. An initial reading was taken of the starting ferrous deoxyHbII (10 μL of 25 mg/mL; prepared by deoxygenating oxyHb using nitrogen gas in 0.1 M sodium phosphate buffer (2.5 mL at pH 7.4). The CAMNO substrate (10 μL; dissolved in methanol) was then added to the cuvette. Spectral readings were taken at different time points during the course of the reaction to monitor its progress.
4.3.2. swMb with PhNHOH.
An initial reading was taken of the starting ferric wt MbIII(H2O) (10 μL of 20 mg/mL) in 0.1 M sodium phosphate buffer (2.5 mL at pH 7.4). The PhNHOH substrate (10 μL of a 200 mM solution in the same buffer) was then added to the cuvette. Spectral readings were taken at different time points during the course of the reaction to monitor its progress. In order to monitor the consequence of oxidation of the product, wt MbIII(H2O) and solid PhNHOH were mixed for 10 min to generate ferrous wt MbII(PhNO). Then, an aliquot (5 μL) of this reaction solution was added to 0.1 M sodium phosphate buffer (2.5 mL at pH 7.4), followed by the addition of potassium ferricyanide (5 μL of a 100 mM solution).
4.4. Crystallization
4.4.1. Ferric Hb with MeNHOH, t-BuNHOH, and PhNHOH.
The co-crystallization method was utilized to obtain crystals of the products resulting from the reactions of ferric HbIII–H2O with MeNHOH, t-BuNHOH, and PhNHOH. The reactions were carried out in solution, and completion of the reaction was verified using UV-vis spectroscopy prior to attempts at crystallization. Crystals were grown using the batch method as described by Safo and Abraham [43]. Monoject blood collection tubes (10.25×64 mm, COVIDIEN) were used, and they contained 3.2 M Na/K phosphate buffer (pH 6.30, 6.47 or 6.81), 5 μL toluene, and varying ratios of buffer to protein reaction solutions.
Hb[α-FeIII(H2O)][β-FeII(MeNO)]:
Ferric HbIII(H2O) (7.5 mL of a 30 mg/mL solution in 50 mM sodium phosphate, pH 7.4) was mixed with a few grains of solid MeNHOH•HCl; crystallization using the batch method was set up at 2 h, 24 h, and 48 h. The diffraction data was obtained from crystals grown in 3.2 M Na/K phosphate pH 6.30 in trays set at 2 h.
[α-FeIII(H2O)][β-FeIII(His)2]{t-BuNHOH}:
Ferric HbIII-H2O (7.5 mL of a 30 mg/mL solution in 50 mM sodium phosphate, pH 7.4) was mixed with a few grains of solid t-BuNHOH•HCl for a total of 5 d; crystallization using the batch method was set up at 1d, 2d, and 5 d. The diffraction data was obtained from crystals grown in 3.2 M Na/K phosphate buffer at pH 6.30.
Hb[α-FeIII(H2O)][β-FeIII(His)2-cySOx]{PhNO}:
Ferric HbIII(H2O) (2.5 mL of a 30 mg/mL 50 mM solution sodium phosphate, pH 7.4) was mixed with 0.5 mL of PhNHOH•HCl (200 mM in water) for 15 min prior to setting up crystallization using the batch method. The diffraction data was obtained from crystals grown in 3.2 M Na/K phosphate buffer at pH 6.81.
4.4.2. DeoxyHb with CAMNO.
Anaerobic co-crystallization was utilized to crystallize [α-FeII][β-FeII-cySOx]{CAMNO}. In an MBraun anaerobic chamber, deoxyHbII (2.5 mL of a 30 mg/mL solution in 50 mM sodium phosphate, pH 7.4) was mixed with a few grains of solid CAMNO and allowed to react for 20 min. Completion of the reaction was confirmed using UV-vis spectroscopy. Crystals were grown using the batch method using Monoject blood collection tubes (10.25×64 mm, COVIDIEN); the tubes contained 20 μL of 0.5 M Fe citrate, 200 μL of the deoxyHbII/CAMNO mixture, and varying ratios of 3.6 M ammonium phosphate/sulfate. The diffraction data was obtained from crystals grown in final concentrations of 10.2 mM Fe citrate and 2.79 M ammonium phosphate/sulfate.
4.4.3. wt swMb with PhNHOH.
Pre-formed crystals of ferric wt swMbIII(H2O) (obtained as previously described) [45, 46] were looped into a 4 μL drop of well solution (2.52–3.2 M ammonium sulfate, 100 mM Tris-HCl, 1 mM EDTA, pH 7.4) containing 10% glycerol and the drop was covered with mineral oil. A small amount of solid PhNHOH•HCl was added into the drop and allowed to soak for up to 1 d. Crystals were harvested at different time points (30 min, 1 h, 2 h, 4 h, 6 h and 1 d). The diffraction data was obtained from crystals of ferric MbIII that were soaked with PhNHOH for 30 min.
4.5. X-ray Data Collection and Processing
The X-ray diffraction data for all the crystal structures except one were collected at the University of Oklahoma Macromolecular Crystallography Lab (MCL) using a home source Rigaku MicroMax 007HF microfocus X-ray generator coupled to a PILATUS 200K detector. The data were collected at 100 K using Cu Kα radiation (λ = 1.54178 Å) from the generator operated at 40 kV/30 mA. The diffraction data for [α-FeIII(H2O)][β-FeIII(His)2-SOx]{PhNO}were collected at the Stanford Synchrotron Radiation Lightsource (SSRL) on beamline 9–2 (λ = 0.98 Å) equipped with a PILATUS 6M PAD detector.
The diffraction data were processed using HKL3000 [47] and the resulting sca files were converted to mtz using Scalepack2mtz in the CCP4 program suite [48]. PHASER MR (CCP4) [49] was used to determine the initial phases. The model used for molecular replacement for all Hb structures was that of ferric R-state human aquomethemoglobin (ferric HbIII(H2O)) at 2.0 Å resolution (PDB ID: 3P5Q) with the heme, water molecules, toluene and ligands removed from the structure. The model used for molecular replacement for the Mb structure was that of ferric wt swMbIII(H2O) at 1.5 Å resolution (PDB ID: 2MBW) with the heme, water molecules and ligands removed from the structure. All refinements were performed using Refmac5 (CCP4) [50] and phenix.refine.[51] Models were rebuilt using COOT [52] and validated using MolProbity [53] to check for unusual residue conformations and contacts.
The figures were generated using Pymol [54]. 2Fo–Fc electron density maps were calculated by Fast Fourier Transform (FFT; CCP4) [55]. Fo–Fc electron density maps were generated by first deleting all ligands from the final pdb file of each structure. The resulting pdb file was used to create a new Fc mtz file using SFall (CCP4). The Fc mtz file was used to generate the Fo–Fc electron density map using FFT. The resulting FFT map files were converted to ccp4 files and displayed in Pymol.
4.5.1. Hb[α-FeIII(H2O)][β-FeII(MeNO)].
Ten initial cycles of restrained refinement were run with Refmac5, and the R factor decreased from 0.275 to 0.245. Ligands and water were added to the model based on the Fo–Fc electron density omit maps in the subsequent refinement cycles. Two MeNO ligands (ligand id: NSM), four glycerol, and two toluene molecules were added to the model. The C-terminal residues 140–141 in both α chains were omitted due to lack of electron density. Two conformations for the sidechains Thr38 in both α chains and Arg40 in both β chains were modeled with 50% occupancy each. The final R factor and Rfree were 0.196 and 0.252, respectively. The final structure was deposited in the PDB with accession number 8FDM.
4.5.2. Hb[α-FeII][β-FeII-cySOx]{CAMNO}.
Ten initial cycles of restrained refinement were run with Refmac5, and the R factor decreased from 0.451 to 0.331. Ligands and water were added to the model based on the Fo–Fc electron density omit maps in the subsequent refinement cycles. Four glycerol, eight sulfates and one CAMNO (ligand id: 5NF) were added to the model. The model for CAMNO was built in Phenix using REEL [56]. The coordinates in a new pdb file and the topologies in a monomer library cif file were produced using eLBOW [57]. CAMNO was modeled in with two different conformations of the terminal NO group at 50% occupancy each. Additional electron density was observed around the -SH groups of the βCys93 residues, and these residues were best modeled as S-cysteinesulfinic acid (ligand id: CSD) with two conformations at 50% occupancy each. The N-terminal residues Val1 and Lys2 in both β chains were omitted due to lack of electron density. Two conformations (50% occupancy each) were modeled for the sidechains Val96, Leu106 and Ser131 in α1, for Se14, Val96, Lys99 and Ser131 in α2, for Thr12, Leu32, Leu68, Leu78, Lys95, Asn108, and Asn139 in β1 and for Thr12, Glu26, Lys95, and Asn139 in β2. The final R factor and Rfree were 0.151 and 0.210, respectively. The final structure was deposited in the PDB with accession number 8FDL.
4.5.3. Hb[α-FeIII(H2O)][β-FeIII(His)2]{t-BuNHOH}.
Ten initial cycles of restrained refinement were run with Refmac5, and the R factor decreased from 0.314 to 0.264. Ligands and water were added to the model based on the Fo–Fc electron density omit maps in the subsequent refinement cycles. Four glycerol and four t-BuNHOH molecules (ligand id: S9V) were added to the model. The model for t-BuNHOH was built in Phenix using REEL [56]. The coordinates in a new pdb file and the topologies in a monomer library cif file were produced using eLBOW [57]. The C-terminal residues 143–146 in both β subunits were omitted due to lack of electron density. The final R factor and Rfree were 0.216 and 0.290, respectively. The final structure was deposited in the PDB with accession number 8FDN.
4.5.4. Hb[α-FeIII(H2O)][β-FeIII(His)2-cySOx]{PhNO}.
Ten initial cycles of restrained refinement were run with Refmac5, and the R factor decreased from 0.349 to 0.291. Ligands and water were added to the model based on the Fo–Fc electron density omit maps in the subsequent refinement cycles. Five PhNO (ligand id: NBE) and one glycerol were added to the model. Additional electron density was observed around the -SH groups of the βCys93 residues, and these residues were best modeled as S-cysteinesulfinic acid (ligand id: CSD) with two conformations at 50% occupancy each. Two conformations for each of the sidechains of β1-Glu26, β1-Asp94, β1-His117, β2-Glu26, β2-His117 were modeled with 50% occupancy each. The C-terminal residues 144–146 in both β chains were omitted due to lack of electron density. The final R factor and Rfree were 0.208 and 0.246, respectively. The final structure was deposited in the PDB with accession number 8FDK.
4.5.5. Ferrous wt swMbII(PhNO).
Ten initial cycles of restrained refinement were run with Refmac5, and the R factor decreased from 0.418 to 0.307. Ligands and water were added to the model based on the Fo–Fc electron density omit maps in the subsequent refinement cycles. One PhNO (ligand id: NBE) and one sulfate anion were added to the model. The N-terminal Met and the C-terminal residues Asn152 and Gly153 were omitted due to lack of electron density. The final R factor and Rfree were 0.229 and 0.276, respectively. The final structure was deposited in the PDB with accession number 8FDJ.
4.6. UV-vis spectroscopy of crystals used in data collection
In order to characterize the redox state of the crystals used to determine the crystal structures and to determine if X-ray exposure altered the redox state, UV-vis spectra of crystals were obtained after data collection. Specifically, after data collection, the crystal was removed from the goniometer and placed into a drop of 2–5 μL of 100 mM sodium phosphate buffer at pH 7.4. Once the crystal was fully dissolved, the UV-vis spectrum was obtained using a Synergy HTX (Biotek) instrument.
Supplementary Material
Synopsis:
A nitrosomethane (MeNO) adduct of human hemoglobin (Hb), namely Hb[α-FeIII(H2O)][β-FeII(MeNO)], in which MeNO is bound only to the β-heme has been characterized by X-ray crystallography. In contrast, β-hemichrome structures were obtained in attempts to crystallize the products from the reactions of Hb with t-BuNHOH and PhNHOH.
Acknowledgments
This material is based upon work supported by (while GBR-A was serving at) the U.S. National Science Foundation (NSF; CHE-2154603 and CHE-1900181). This paper reports data obtained in the University of Oklahoma Macromolecular Crystallography Laboratory which is supported, in part, by an Institutional Development Award (IDeA) from the National Institute of General Medical Sciences of the National Institutes of Health under grant number P20GM103640. Any opinions, findings, and conclusions, or recommendations expressed in this material are those of the authors and do not necessarily reflect the views of the NSF or the NIH.
Footnotes
Supporting Information
Crystallography, experimental details, tables, additional spectral, and crystal structure figures (PDF).
References
- [1].Jung F, Methemoglobin Formation. XVIII. The Phenylhydroxylamine-Nitrosobenzene Cycle, Arch. Exptl. Pathol. Pharmakol, 195 (1940) 208–217. Chem. Abs. 235:1865. [Google Scholar]
- [2].Hirota K, Itano HA, Vedvick TS, Oxidative Degradation of Haemoglobin by Nitrosobenzene in the Erythrocyte, Biochem. J, 174 (1978) 693–697. [DOI] [PMC free article] [PubMed] [Google Scholar]
- [3].Kiese M, The Biochemical Production of Ferrihemoglobin-Forming Derivatives from Aromatic Amines, and Mechanisms of Ferrihemoglobin Formation, Pharmacol. Rev, 18 (1966) 1091–1161. [PubMed] [Google Scholar]
- [4].Harrison JH, Jollow DJ, Role of Aniline Metabolites in Aniline-Induced Hemolytic Anemia, J. Pharmacol. Exp. Ther, 238 (1986) 1045–1054. [PubMed] [Google Scholar]
- [5].Harrison JH, Hollow DJ, Contribution of Aniline Metabolites to Aniline-Induced Methemoglobinemia, Mol. Pharmacol, 32 (1987) 423–431. [PubMed] [Google Scholar]
- [6].Kiese M, Reinwein I, The Reduction of Methemoglobin by Phenylhydroxylamine, Arch. Exp. Path. Pharmak, 211 (1950) 402–409. [PubMed] [Google Scholar]
- [7].Keilin D, Hartree EF, Reactions of Haemoglobin and its Derivatives with Phenyl Hydroxylamine and Nitrosobenzene, Nature, 151 (1943) 390–391. [Google Scholar]
- [8].Stolze K, Nohl H, Free Radical Intermediates in the Oxidation of N-Methylhydroxylamine and N,N-Dimethylhydroxylamine by Oxyhemoglobin, Free Rad. Res. Commun, 8 (1990) 123–131. [DOI] [PubMed] [Google Scholar]
- [9].Spooren AAMG, Evelo CTA, A Study on the Interaction between Hydroxylamine Analogues and Oxyhemoglobin in Intact Erythrocyctes, Blood Cel. Mol. Diseases, 26 (2000) 373–386. [DOI] [PubMed] [Google Scholar]
- [10].Hata Y, Watanabe M, Tonda K, Hirata M, Aziridine Biotransformation by Microsomes and Lethality to Hepatocytes Isolated from Rat, Chem.-Biol. Interact, 63 (1987) 171–184. [DOI] [PubMed] [Google Scholar]
- [11].Voloboueva LA, Killilea DW, Atamna H, Ames BN, N-tert-butyl Hydroxylamine, a Mitochondrial Antioxidant, Protects Retinal Pigment Epithelial Cells from Iron Overload: Relevance to Macular Degeneration, FASEB J, 21 (2007) 4077–4086. [DOI] [PMC free article] [PubMed] [Google Scholar]
- [12].Yunis AA, Miller AM, Salem Z, Corbett MD, Arimura GK, Nitroso-chloramphenicol: Possible Mediator in Chloramphenicol-induced Aplastic Anemia, J. Lab. Clin. Med, 96 (1980) 36–46. [PubMed] [Google Scholar]
- [13].Eyer P, Lierheimer E, Schneller M, Reactions of Nitrosochloramphenicol in Blood, Biochem. Pharmacol, 33 (1984) 2299–2308. [DOI] [PubMed] [Google Scholar]
- [14].Gibson QH, The Reactions of Some Aromatic C-Nitroso Compounds with Haemoglobin, Biochem. J, 77 (1960) 519–526. [DOI] [PMC free article] [PubMed] [Google Scholar]
- [15].Jung F, Nitrosobenzene-Hemoglobin, Naturwissenschaften, 28 (1940) 264–265. [Google Scholar]
- [16].Eyer P, Ascherl M, Reactions of Para-Substituted Nitrosobenzenes with Human Hemoglobin, Biol. Chem. Hoppe-Seyler, 368 (1987) 285–294. [DOI] [PubMed] [Google Scholar]
- [17].Scheler W, Formation of Nitrosobenzene Derivatives by Human Hemoglobin, Naturwissenschaften, 47 (1960) 399. [Google Scholar]
- [18].Hirota K, Itano HA, Influence of Ring Substituents on the Binding of Nitrosobenzene by Ferrohemoglobin, J. Biol. Chem, 253 (1978) 3477–3481. [PubMed] [Google Scholar]
- [19].Murayama M, The Combining Power of Normal Human Hemoglobin for Nitrosobenzene, J. Biol. Chem, 235 (1960) 1024–1028. [PubMed] [Google Scholar]
- [20].Mansuy D, Chottard JC, Chottard G, Nitrosoalkanes as Fe(II) Ligands in the Hemoglobin and Myoglobin Complexes Formed from Nitroalkanes in Reducing Conditions, Eur. J. Biochem, 76 (1977) 617–623. [DOI] [PubMed] [Google Scholar]
- [21].Jung F, Hemoglobin and Oxidation Products of Aniline (Nitrosobenzenehemoglobin), Biochem. Z, 305 (1940) 248–260. Chem. Abs. 235:472. [Google Scholar]
- [22].Loeb RF, Bock AV, Fitz R, Acute Nitrobenzene Poisoning, With Studies On The Blood in Two Cases, Am. J. Med. Sci, 161 (1921) 539–546. Chem. Abs. 515:1761 (1921). [Google Scholar]
- [23].Yi J, Ye G, Thomas LM, Richter-Addo GB, Degradation of Human Hemoglobin by Organic C-Nitroso Compounds, Chem. Commun, 49 (2013) 11179–11181. [DOI] [PubMed] [Google Scholar]
- [24].Wang B, Powell SM, Guan Y, Xu N, Thomas LM, Richter-Addo GB, Nitrosoamphetamine binding to Myoglobin and Hemoglobin: Crystal Structure of the H64A Myoglobin-Nitrosoamphetamine Adduct, Nitric Oxide, 67 (2017) 26–29. [DOI] [PMC free article] [PubMed] [Google Scholar]
- [25].Powell SM, Thomas LM, Richter-Addo GB, The Nitrosoamphetamine Metabolite is Accommodated in the Active Site of Human Hemoglobin: Spectroscopy and Crystal Structure, J. Inorg. Biochem, 213 (2020) 111262. [DOI] [PMC free article] [PubMed] [Google Scholar]
- [26].Kiese M, Schneider C, Waller HD, Kinetics of Methemoglobin Reductase. XIV. Methemoglobin Reductase, Arch. Exptl. Pathol. Pharmakol, 231 (1957) 158–169. [PubMed] [Google Scholar]
- [27].Antonini E, Brunori M, Hemoglobin and Myoglobin In Their Reactions With Ligands, North-Holland, Amsterdam, 1971. [Google Scholar]
- [28].Winterbourn CC, Oxidative Reactions of Hemoglobin, Methods Enzymol., 186 (1990) 265–272. [DOI] [PubMed] [Google Scholar]
- [29].Rifkind JM, Abugo O, Levy A, Heim J, Detection, Formation, and Relevance of Hemichromes and Hemochromes, Methods Enzymol, 231 (1994) 449–480. [DOI] [PubMed] [Google Scholar]
- [30].Herrera VE, Charles TP, Scott TG, Prather KY, Nguyen NT, Sohl CD, Thomas LM, Richter-Addo GB, Insights into Nitrosoalkane Binding to Myoglobin Provided by Crystallography of Wild-Type and Distal Pocket Mutant Derivatives, Biochemistry, 62 (2023) 1406–1419. [DOI] [PMC free article] [PubMed] [Google Scholar]
- [31].Baldwin J, Chothia C, Hemoglobin - Structural-Changes Related to Ligand-Binding and Its Allosteric Mechanism, J. Mol. Biol, 129 (1979) 175–220. [DOI] [PubMed] [Google Scholar]
- [32].Chan NL, Kavanaugh JS, Rogers PH, Arnone A, Crystallographic Analysis of the Interaction of Nitric Oxide with Quaternary-T Human Hemoglobin, Biochemistry, 43 (2004) 118–132. [DOI] [PubMed] [Google Scholar]
- [33].Di Girolamo F, Campanella L, Samperi R, Bachi A, Mass Spectrometric Identification of Hemoglobin Modifications Induced by Nitrosobenzene, Ecotoxicol. Environ. Safety, 72 (2009) 1601–1608. [DOI] [PubMed] [Google Scholar]
- [34].Yi J, Thomas LM, Richter-Addo GB, Crystal Structure of Human R-State Aquomethemoglobin at 2.0 Å Resolution, Acta Cryst. F, 67 (2011) 647–651. [DOI] [PMC free article] [PubMed] [Google Scholar]
- [35].Vergara A, Franzese M, Merlino A, Vitagliano L, Verde C, di Prisco G, Lee HC, Peisach J, Mazzarella L, Structural Characterization of Ferric Hemoglobins from Three Antarctic Fish Species of the Suborder Notothenioidei, Biophys. J, 93 (2007) 2822–2829. [DOI] [PMC free article] [PubMed] [Google Scholar]
- [36].Vergara A, Vitagliano L, Verde C, di Prisco G, Mazzarella L, Spectroscopic and Crystallographic Characterization of Bis-histidyl Adducts in Tetrameric Hemoglobins, Methods Enzymol, 436 (2008) 425–444. [DOI] [PubMed] [Google Scholar]
- [37].Arutyunyan EG, Kuranova IP, Vainshtein BK, Steigemann W, X-Ray Structural Investigation of Leghemoglobin. VI. Structure of Acetate-Ferrihemoglobin at a Resolution of 2.0 Angstroms, Kristallografiya, Vol 80 (25 pages); PDB 2LH7, 25 (1980) 43–58. [Google Scholar]
- [38].Kuranova IP, Teplyakov AV, Obmolova GV, Voronova AA, Popov AN, Kheiker DM, Harutyunyan EG, X-ray Diffraction Study of Leghemoglobin in Complexes with Nitrosobenzene (PDB 1LH7, 2LH7), Nicotinic Acid, and Acetate, Fluoride, and Cyanide Ions, Bioorg. Khim, 8 (1982) 1625–1636 (in Russian). Chem. Abstr. CA1698:48994. [Google Scholar]
- [39].Copeland DM Thesis, University of Oklahoma, 2006. [Google Scholar]
- [40].A related structure has been obtained independently and has been deposited with the Protein Data Bank. J. Yi, Personal communication. PDB 6NQ5. Deposited 1.19.2019, 2017. [Google Scholar]
- [41].Robinson VL, Smith BB, Arnone A, A pH-Dependent Aquomet-to-Hemichrome Transition in Crystalline Horse Methemoglobin, Biochemistry, 42 (2003) 10113–10125. [DOI] [PubMed] [Google Scholar]
- [42].Blumberg WE, Peisach J, Low-Spin Compounds of Heme Proteins, ACS Advances in Chemistry Series (Bioinorganic Chemistry II); Chapter 12, 100 (1971) 271–291. [Google Scholar]
- [43].Safo MK, Abraham DJ, X-ray Crystallography of Hemoglobins, Methods Mol. Med, 82 (2003) 1–19. [DOI] [PubMed] [Google Scholar]
- [44].Springer BA, Sligar SG, High-Level Expression of Sperm Whale Myoglobin in Escherichia coli, Proc. Natl. Acad. Sci. USA, 84 (1987) 8961–8965. [DOI] [PMC free article] [PubMed] [Google Scholar]
- [45].Wang B, Shi YL, Tejero J, Powell SM, Thomas LM, Gladwin MT, Shiva S, Zhang Y, Richter-Addo GB, Nitrosyl Myoglobins and Their Nitrite Precursors: Crystal Structural and Quantum Mechanics and Molecular Mechanics Theoretical Investigations of Preferred Fe-NO Ligand Orientations in Myoglobin Distal Pockets, Biochemistry, 57 (2018) 4788–4802. [DOI] [PMC free article] [PubMed] [Google Scholar]
- [46].Phillips GN, Arduini RM, Springer BA, Sligar SG, Crystal-Structure of Myoglobin from a Synthetic Gene, Proteins: Struc., Func., Genet., 7 (1990) 358–365. [DOI] [PubMed] [Google Scholar]
- [47].Otwinowski Z, Minor W, Processing of X-Ray Diffraction Data Collected in Oscillation Mode, Methods Enzymol, 276 (1997) 307–326. [DOI] [PubMed] [Google Scholar]
- [48].Winn MD, Ballard CC, Cowtan KD, Dodson EJ, Emsley P, Evans PR, Keegan RM, Krissinel EB, Leslie AGW, McCoy A, McNicholas SJ, Murshudov GN, Pannu NS, Potterton EA, Powell HR, Read RJ, Vagin A, Wilson KS, Overview of the CCP4 Suite and Current Developments, Acta Crystallogr, D67 (2011) 235–242. [DOI] [PMC free article] [PubMed] [Google Scholar]
- [49].McCoy AJ, Grosse-Kunstleve RW, Adams PD, Winn MD, Storoni LC, Read RJ, PHASER Crystallographic Software, J. Appl. Cryst, 40 (2007) 658–674. [DOI] [PMC free article] [PubMed] [Google Scholar]
- [50].Murshudov GN, Vagin AA, Dodson EJ, Refinement of Macromolecular Structures by the Maximum-Likelihood Method, Acta Cryst, D53 (1997) 240–255. [DOI] [PubMed] [Google Scholar]
- [51].Afonine PV, Grosse-Kunstleve RW, Echols N, Headd JJ, Moriarty NW, Mustyakimov M, Terwilliger TC, Urzhumtsev A, Zwart PH, Adams PD, Towards Automated Crystallographic Structure Refinement with Phenix.refine, Acta Cryst, D68 (2012) 352–367. [DOI] [PMC free article] [PubMed] [Google Scholar]
- [52].Emsley P, Cowtan K, COOT: Model-Building Tools for Molecular Graphics, Acta Cryst, D60 (2004) 2126–2132. [DOI] [PubMed] [Google Scholar]
- [53].Chen VB, Arendall WB, Headd JJ, Keedy DA, Immormino RM, Kapral GJ, Murray LW, Richardson JS, Richardson DC, MolProbity: All-atom Structure Validation for Macromolecular Crystallography, Acta Cryst, D66 (2010) 12–21. [DOI] [PMC free article] [PubMed] [Google Scholar]
- [54].Schrödinger-LLC, The PYMOL Molecular Graphics System, New York, NY, 2018. [Google Scholar]
- [55].Read RJ, Schierbeek AJ, A Phased Translation Function, J. Appl. Crystallogr, 21 (1988) 490–495. [Google Scholar]
- [56].Moriaty NW, Draizen EJ, Adams PD, An Editor for the Generation and Customization of Geometry Restraints, Acta Cryst, D73 (2017) 123–130. [DOI] [PMC free article] [PubMed] [Google Scholar]
- [57].Moriaty NW, Grosse-Kunstleve RW, Adams PD, Electronic Ligand Builder and Optimization Workbench (eLBOW): A Tool for Ligand Coordinate and Restraint Generation, Acta Cryst, D65 (2009) 1074–1080. [DOI] [PMC free article] [PubMed] [Google Scholar]
Associated Data
This section collects any data citations, data availability statements, or supplementary materials included in this article.