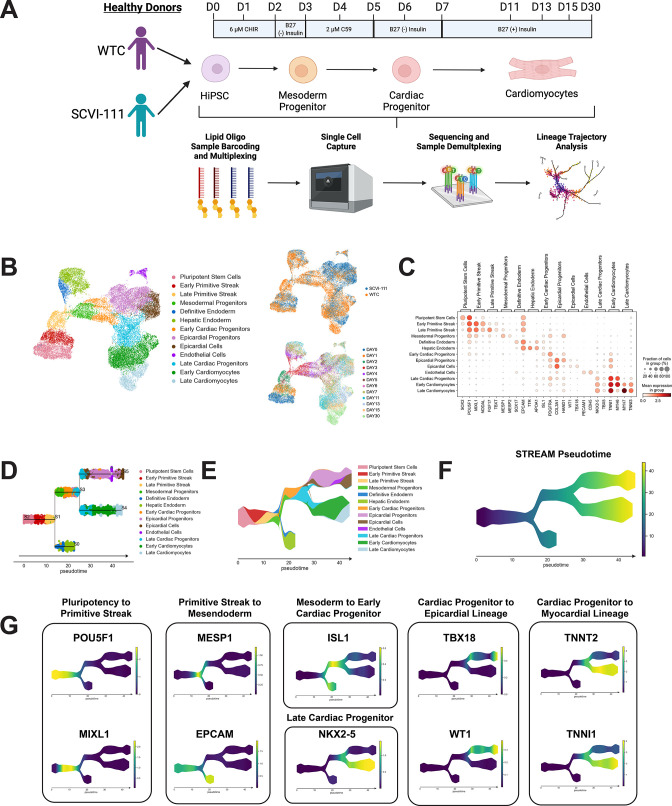
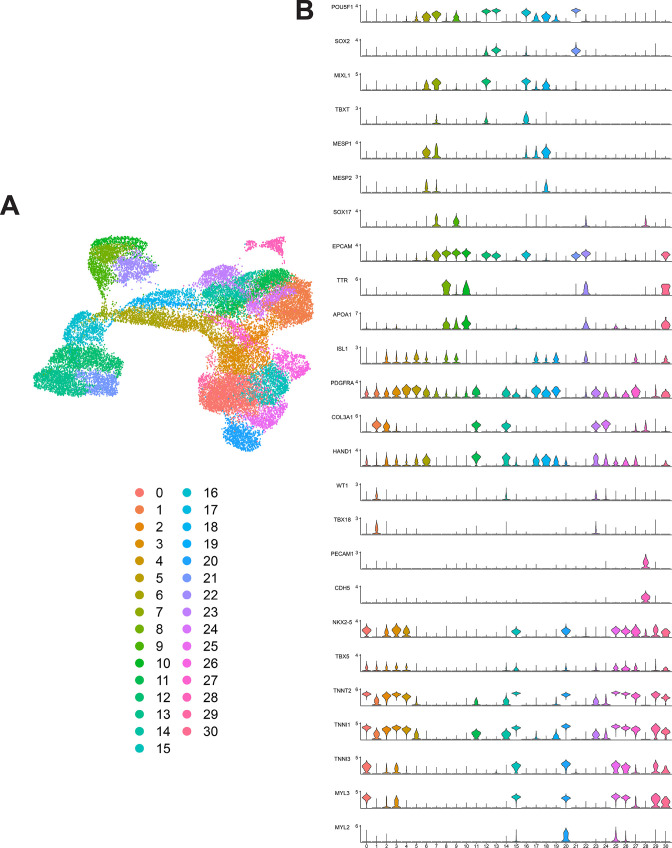
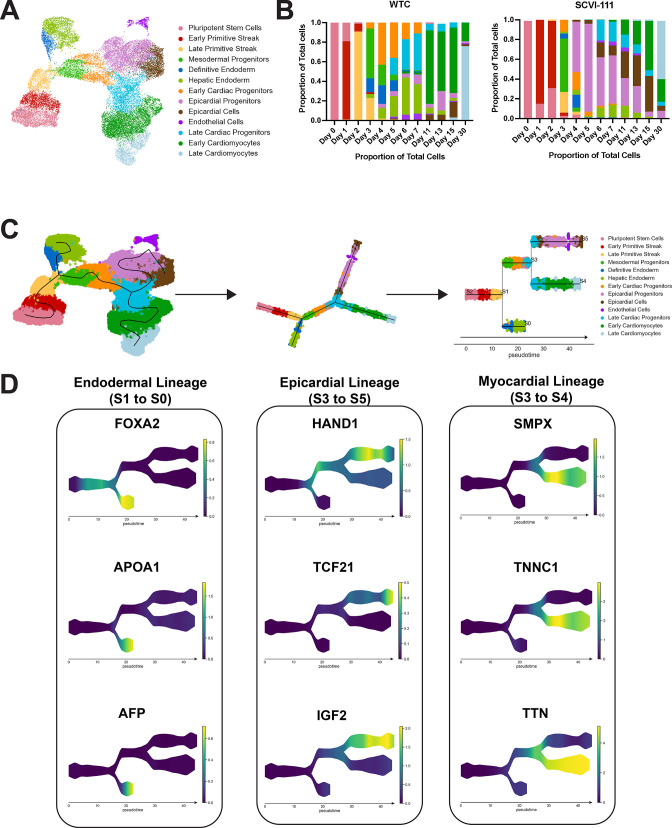
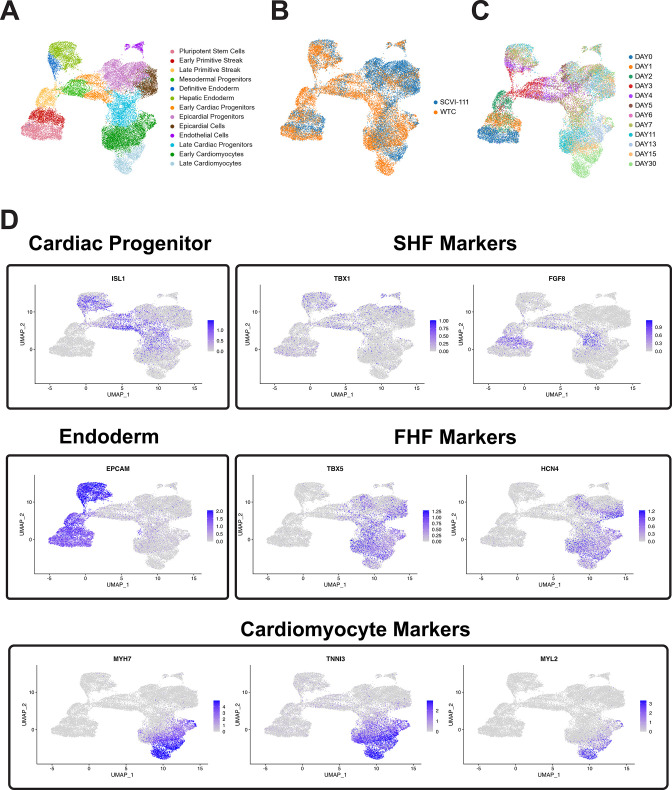
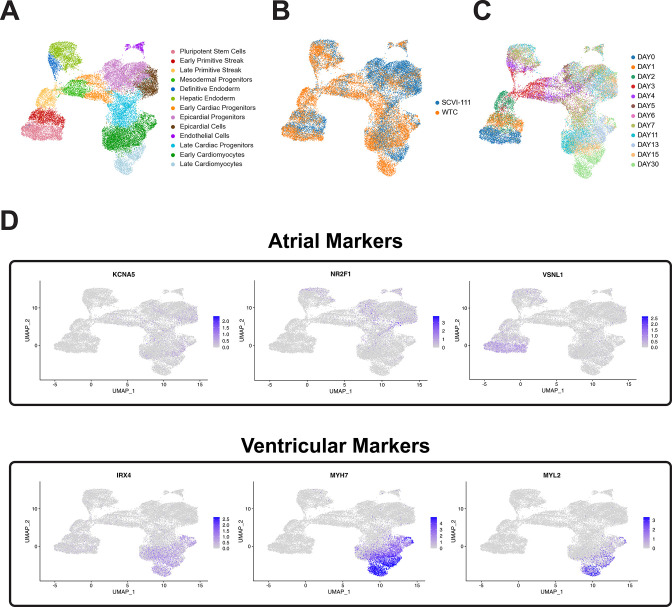
Figure 4. single-cell RNA sequencing (scRNA-seq) profiling and trajectory inference reveals emergence of myocardial and epicardial lineages during human-induced pluripotent stem cell (hiPSC) cardiac differentiation.
(A) Diagram of scRNA-seq multiplexing for profiling of 12 timepoints across two lines during hiPSC cardiac differentiation. (B) Left, UMAP plot with identification of 13 cell populations over the course of cardiac differentiation. Right-Top, Plot indicating labeling of cells captured from WTC and SCVI-111 line. Right-Bottom, Plot indicating timepoints of differentiation at which cells were captured for scRNA-seq. N=27,595 single cells. (C) Dotplot presenting the expression of top markers for major cell populations identified during hiPSC cardiac differentiation. (D) Subway map plot showing the projection of cells along cell lineages detected using STREAM analysis. (E) Stream plot indicating the relative cell type composition along each branch of differentiation identified by STREAM. (F) Graph indicating pseudotime values calculated by STREAM for ordering cells along a continuous developmental projection axis. (G) Feature plots for top gene markers identified during each major developmental phase of hiPSC cardiac differentiation.

