

Abstract
Background
This article presents a critical literature review and meta-analysis of diagnostic performance of Quidel Sofia SARS antigen Fluorescent Immunoassay (FIA), a rapid diagnostic antigen test (RDT-Ag) adapted for automatic reading with portable instruments, thus potentially combining the advantages of point-of-care testing with those of a laboratory-based immunoassay.
Methods
We conducted an electronic search in PubMed and Scopus with the keywords “Quidel” OR “SOFIA” AND “Antigen” AND “SARS-CoV-2” OR “COVID-19” up to March 24, 2023, for identifying articles containing data on accuracy of Quidel Sofia SARS antigen FIA for diagnosing acute SARS-CoV-2 infections. We selected those where test accuracy was compared to that of a reference SARS-CoV-2 molecular assay, and with sufficient information for constructing a 2×2 table.
Results
A total number of 18 articles (48165 samples; 9.8% positive at molecular testing) were included in this meta-analysis, averaging 24 sample cohorts. The diagnostic accuracy (summary area under the curve), sensitivity and specificity were 0.980, 0.76 and 1.00 in all samples, 0.981, 0.81 and 0.99 in samples collected from symptomatic patients, 0.931, 0.55 and 1.00 in those taken from asymptomatic patients, and 0.960, 0.77 and 0.99 in samples from mixed cohorts of patients, respectively. Minor and clinically negligible differences of accuracy could be found by comparing test results in nasal and nasopharyngeal swabs.
Conclusion
Quidel Sofia SARS Ag FIA meets the minimum performance criteria of accuracy for SARS-CoV-2 antigenic testing, thus combining satisfactory diagnostic performance with the advantages of being potentially used as a portable device.
Key words: SARS-CoV-2, COVID-19, immunoassay, diagnosis, antigen
INTRODUCTION
Three years after the World Health Organization (WHO) declared the outbreak of severe acute respiratory syndrome coronavirus 2 (SARS-CoV-2) a pandemic, coronavirus disease 2019 (COVID-19) is still considered a public health emergency of international concern [1]. This is mostly due to the fact that the number of infections continues to grow irrespective of immunity and environmental conditions, thus no longer following the typical seasonal pattern that has characterized the early phase of the pandemic [2]. Along with a constant number of daily infections comes the still relevant impact that COVID-19 has on the most vulnerable parts of the population, especially comprising older people, immunocompromised patients, and those with underlying health conditions such as cancer, cardiovascular and pulmonary diseases, diabetes, obesity, and other chronic illness [3].
According to the WHO [4], a confirmed case of SARS-CoV-2 infection could be an individual with (i) a positive test result of a nucleic acid amplification test (NAAT) irrespective of other clinical or epidemiological criteria, or (ii) a positive test result of a professional used or self-test SARS-CoV-2 antigen (Ag) assay, meeting specific clinical (i.e., being symptomatic) or epidemiological (i.e., being a contact of a COVID-19 case or directly linked to a cluster) criteria. The International Federation of Clinical Chemistry and Laboratory Medicine (IFCC) has recently endorsed similar recommendations, stating that the diagnosis of an acute SARS-CoV-2 infection can be made by either molecular or Ag testing, reserving the use of the second approach to specific clinical settings (i.e., especially in those at lower risk of having an acute SARS-CoV-2 infection or for specific epidemiological purposes) [5]. Two recent economic analyses revealed that an approach based on sequential testing (SARS-CoV-2 Ag testing first, followed by NAAT in those testing negative) is not only clinically safe, but also is more cost-effective than molecular testing alone [6,7]. As concerns the specific diagnostic performance of SARS-CoV-2 Ag testing, both the WHO [8] and the IFCC [5,9] mandate that minimum performance criteria shall be met by SARS-CoV-2 Ag immunoassays, either rapid diagnostic tests (RDT-Ag) or laboratory based, in that they should display ≥0.80 sensitivity and ≥0.97 specificity, respectively, when used in suspected COVID-19 cases (i.e., symptomatic subjects). Recent literature review revealed that although most laboratory-based tests seem to fulfil these performance limits [10], the diagnostic accuracy of RDT-Ag varies broadly, with average sensitivity of 0.73 (95%CI, 0.69-0.76) in symptomatic subjects, decreasing to 0.55 (95%CI, 0.48-0.62) in those without symptoms [11]. Importantly, according to the Cochrane COVID-19 Diagnostic Test Accuracy Group, the vast majority of tests failed to meet the WHO and IFCC minimum sensitivity criterion of ≥0.80, thus raising serious doubts about their reliability and safety [11].
The diagnostic sensitivity of all SARS-CoV-2 Ag tests is influenced by a widely heterogeneous analytical sensitivity (i.e., the limit of detection; LoD) [12], as well as by a kaleidoscope of pre-analytical and post-analytical variables [13], among which accuracy of test reading and interpretation play the lion’s share [14]. Thus, the possibility to standardize and/or automate this last but highly relevant step of RDT-Ag performance now allowed by some commercial tests may help eliminate a very important source of variability in test performance.
For this purpose, the aim of this investigation is to provide a critical literature review and meta-analysis of the diagnostic performance of Quidel Sofia SARS antigen Fluorescent Immunoassay (FIA), a widely used RDT-Ag immunoassays adapted for being automatically read by a portable instrument, thus potentially combining the advantages of point-of-care (POC) testing with those of a laboratory-based immunoassay.
MATERIALS AND METHODS
Assay description
The Quidel Sofia SARS antigen Fluorescent Immunoassay has been specifically developed for qualitative detection of SARS-CoV-1 and SARS-CoV-2 nucleocapsid (n) protein. The test, included within the category of lateral flow immunofluorescent sandwich assays, has been specifically adapted for use with the portable Sofia, Sofia 2 and Sofia Q analyzers, thus enabling to achieve objective and automated test results within 15 min. According to manufacturer’s indications, the assay should be specifically used for SARS-CoV-2 testing using direct nasal swabs collected from symptomatic patients within the first 5 days of symptoms onset, or for serial testing of asymptomatic patients (in such cases within 24-36 hours between repeated tests). The test has been cleared for being used as a POC, under a CLIA Certificate of Waiver, Certificate of Compliance, or Certificate of Accreditation.
The test sample is initially placed in a reagent tube (i.e., the swab is rotated for at least 3 times, pressing the head against the bottom and side of the tube for enabling optimal mixing with the buffer) for disrupting viral particles (thus enabling nucleoproteins exposition). A fixed sample volume (i.e., 120 uL) is then pipetted into a test cassette sample well, from where the sample migrates throughout the test strip. In the “WALK AWAY Mode” the cassette is immediately inserted into the portable analyzer, where test results could be displayed after 15 min, whilst in the “READ NOW Mode” the cassette in maintained outside of the analyzer for 15 min, then inserted and immediately read (i.e., within 1 min). When either SARS-CoV-1 or SARS-CoV-2 viral N antigens are present (the test does not differentiate between the two coronaviruses), they are sequestered within a specific site. The analyzer then scans the test strip and measures the fluorescent signal, transforming the fluorescent measure in antigen concentration by means of a method-specific algorithm.
Search strategy
We planned an electronic search in Medline (PubMed interface) and Scopus, using the keywords “Quidel” OR “SOFIA” AND “Antigen” AND “SARS-CoV-2” OR “COVID-19” in all search fields, without language or time constrains (i.e., up to March 24, 2023), for identifying published articles that contained data on accuracy of Quidel Sofia SARS antigen FIA for diagnosing COVID-19. Two authors (G.L. and B.M.H.) screened all articles originally detected based on the predefined search criteria, selecting those with the following inclusion criteria: (i) Quidel Sofia SARS antigen FIA diagnostic performance was compared versus a reference molecular technique; (ii) data on true positive (TP), true negative (TN), false positive (FP) and false negative (FN) rates could be extracted from the text of the article, or could be otherwise provided by the authors after direct request (i.e., by emailing the corresponding authors).
After extraction, data were used for constructing a 2×2 table, which enabled the estimation of pooled accuracy (based on a Summary Receiver Operating Characteristic Curve; SROC), sensitivity and specificity with their respective 95% confidence interval (95%CI). Separate analyses were conducted according to the respiratory sample type (i.e., nasal or nasopharyngeal swab) and the population enrolled (asymptomatic, symptomatic, mixed). The Mantel-Haenszel test and random effects model were used for finally pooling the data, while the heterogeneity was calculated with χ2 test and I2 statistics. The statistical analysis was performed with Meta-DiSc 1.4 (Unit of Clinical Biostatistics team of the Ramón y Cajal Hospital, Madrid, Spain) [15].
This analysis was performed in accordance with the Preferred Reporting Items for Systematic Reviews and Meta-Analyses (PRISMA Checklist, available as Supplementary File 1), conducted in agreement with the Declaration of Helsinki and within the terms of local legislation. No ethical committee approval was required for performing this critical literature review and meta-analysis.
Supplementary File 1.
Preferred Reporting Items for Systematic Reviews and Meta-Analyses (PRISMA) checklist
| Section and Topic | Item # | Checklist item | Location where item is reported |
|---|---|---|---|
| TITLE | |||
| Title | 1 | Identify the report as a systematic review. | Page 1 |
| ABSTRACT | |||
| Abstract | 2 | See the PRISMA 2020 for Abstracts checklist. | Page 2 |
| INTRODUCTION | |||
| Rationale | 3 | Describe the rationale for the review in the context of existing knowledge. | Page 3-4 |
| Objectives | 4 | Provide an explicit statement of the objective(s) or question(s) the review addresses. | Page 4 |
| METHODS | |||
| Eligibility criteria | 5 | Specify the inclusion and exclusion criteria for the review and how studies were grouped for the syntheses. | Page 5-6 |
| Information sources | 6 | Specify all databases, registers, websites, organisations, reference lists and other sources searched or consulted to identify studies. Specify the date when each source was last searched or consulted. | Page 5-6 |
| Search strategy | 7 | Present the full search strategies for all databases, registers and websites, including any filters and limits used. | Page 5-6 |
| Selection process | 8 | Specify the methods used to decide whether a study met the inclusion criteria of the review, including how many reviewers screened each record and each report retrieved, whether they worked independently, and if applicable, details of automation tools used in the process. | Page 5-6 |
| Data collection process | 9 | Specify the methods used to collect data from reports, including how many reviewers collected data from each report, whether they worked independently, any processes for obtaining or confirming data from study investigators, and if applicable, details of automation tools used in the process. | Page 5-6 |
| Data items | 10a | List and define all outcomes for which data were sought. Specify whether all results that were compatible with each outcome domain in each study were sought (e.g. for all measures, time points, analyses), and if not, the methods used to decide which results to collect. | Page 5-6 |
| 10b | List and define all other variables for which data were sought (e.g. participant and intervention characteristics, funding sources). Describe any assumptions made about any missing or unclear information. | Page 5-6 | |
| Study risk of bias assessment | 11 | Specify the methods used to assess risk of bias in the included studies, including details of the tool(s) used, how many reviewers assessed each study and whether they worked independently, and if applicable, details of automation tools used in the process. | N/A |
| Effect measures | 12 | Specify for each outcome the effect measure(s) (e.g. risk ratio, mean difference) used in the synthesis or presentation of results. | Page 6 |
| Synthesis methods | 13a | Describe the processes used to decide which studies were eligible for each synthesis (e.g. tabulating the study intervention characteristics and comparing against the planned groups for each synthesis (item #5)). | Page 5-6 |
| 13b | Describe any methods required to prepare the data for presentation or synthesis, such as handling of missing summary statistics, or data conversions. | Page 5-6 | |
| 13c | Describe any methods used to tabulate or visually display results of individual studies and syntheses. | Page 6 | |
| Synthesis methods | 13d | Describe any methods used to synthesize results and provide a rationale for the choice(s). If meta-analysis was performed, describe the model(s), method(s) to identify the presence and extent of statistical heterogeneity, and software package(s) used. | Page 6 |
| 13e | Describe any methods used to explore possible causes of heterogeneity among study results (e.g. subgroup analysis, meta-regression). | Page 6 | |
| 13f | Describe any sensitivity analyses conducted to assess robustness of the synthesized results. | N/A | |
| Reporting bias assessment | 14 | Describe any methods used to assess risk of bias due to missing results in a synthesis (arising from reporting biases). | N/A |
| Certainty assessment | 15 | Describe any methods used to assess certainty (or confidence) in the body of evidence for an outcome. | N/A |
| RESULTS | |||
| Study selection | 16a | Describe the results of the search and selection process, from the number of records identified in the search to the number of studies included in the review, ideally using a flow diagram. | Page 7 |
| 16b | Cite studies that might appear to meet the inclusion criteria, but which were excluded, and explain why they were excluded. | Page 7 | |
| Study characteristics | 17 | Cite each included study and present its characteristics. | Page 7 – Tables 1 |
| Risk of bias in studies | 18 | Present assessments of risk of bias for each included study. | N/A |
| Results of individual studies | 19 | For all outcomes, present, for each study: (a) summary statistics for each group (where appropriate) and (b) an effect estimate and its precision (e.g. confidence/credible interval), ideally using structured tables or plots. | Page 7,8 – Tables 1 & 2 |
| Results of syntheses | 20a | For each synthesis, briefly summarise the characteristics and risk of bias among contributing studies. | N/A |
| 20b | Present results of all statistical syntheses conducted. If meta-analysis was done, present for each the summary estimate and its precision (e.g. confidence/credible interval) and measures of statistical heterogeneity. If comparing groups, describe the direction of the effect. | Page 7,8 – Tables 1 & 2 – Figures 1-4 | |
| 20c | Present results of all investigations of possible causes of heterogeneity among study results. | Page 7,8 | |
| 20d | Present results of all sensitivity analyses conducted to assess the robustness of the synthesized results. | N/A | |
| Reporting biases | 21 | Present assessments of risk of bias due to missing results (arising from reporting biases) for each synthesis assessed. | N/A |
| Certainty of evidence | 22 | Present assessments of certainty (or confidence) in the body of evidence for each outcome assessed. | Page 7,8 |
| DISCUSSION | |||
| Discussion | 23a | Provide a general interpretation of the results in the context of other evidence. | Page 9,10 |
| 23b | Discuss any limitations of the evidence included in the review. | Page 10,11 | |
| 23c | Discuss any limitations of the review processes used. | Page 9-11 | |
| 23d | Discuss implications of the results for practice, policy, and future research. | Page 10-11 | |
| OTHER INFORMATION | |||
| Registration and protocol | 24a | Provide registration information for the review, including register name and registration number, or state that the review was not registered. | N/A |
| Registration and protocol | 24b | Indicate where the review protocol can be accessed, or state that a protocol was not prepared. | N/A |
| 24c | Describe and explain any amendments to information provided at registration or in the protocol. | N/A | |
| Support | 25 | Describe sources of financial or non-financial support for the review, and the role of the funders or sponsors in the review. | Page 12 |
| Competing interests | 26 | Declare any competing interests of review authors. | Page 12 |
| Availability of data, code and other materials | 27 | Report which of the following are publicly available and where they can be found: template data collection forms; data extracted from included studies; data used for all analyses; analytic code; any other materials used in the review. | Upon request to corr. author |
From: Page MJ, McKenzie IF, Bossuyt PM, Boutron I, Hoffmann TC, Mulrow CD, et al. The PRISMA 2020 statement: an updated guideline for reporting systematic reviews. BMJ 2021;372:n71. doi: 10.1136/bmj.n71..
For more information, visit: http://www.prisma-statement.ora/.
RESULTS
Our digital search in PubMed and Scopus based on the aforementioned criteria allowed to initially identify 70 articles after eliminating redundancy between the two scientific databases. We then excluded 52 articles, for the following reasons: 36 studies which did not report any data on diagnostic testing, 5 were unsuitable for constructing the 2×2 table (including no response after delivering a specific request to the authors for the data), 6 were literature reviews, 2 did not contain specific data on Quidel Sofia SARS antigen FIA, 2 were focused on performance of SARS-CoV-2 antigen manual assay, and 1 that reported data on a duplicate cohort included in a large subsequent investigation. Thus, a total of 18 articles (totalling 48165 samples; range, 43-23462; 9.8% NAAT positive) meeting our inclusion criteria were finally included in this meta-analysis, equating to 24 sample cohorts (Table 1) [16-33]. Specifically, 4 studies included mixed cohorts of asymptomatic and symptomatic subjects, 5 included two separate cohorts of asymptomatic or symptomatic patients, 7 included only symptomatic patients, and 2 studies included only asymptomatic subjects. As concerns the type of the sample, one study included a single cohort of patients with double sample collection (i.e., nasal and nasopharyngeal), in 16 cohorts only a nasal swab was collected and in 6 cohorts a single nasopharyngeal swab was taken.
Table 1.
Summary of the characteristics of the studies which explored the performance of Quidel Sofia SARS antigen Fluorescent Immunoassay (FIA) for diagnosing acute SARS-CoV-2 infections
| Study | Country | Sample matrix | Sample size | Population | Reference test |
|---|---|---|---|---|---|
| Alonaizan et al., 2022 [16] | Saudi Arabia | Nasal swab | 76 | Asymptomatic | RT-PCR (Cepheid GeneXpert GX-XVI SARS-CoV-2) |
| Alonaizan et al., 2022 [16] | Saudi Arabia | Nasopharyngeal swab | 76 | Asymptomatic | RT-PCR (Cepheid GeneXpert GX-XVI SARS-CoV-2) |
| Bachman et al., 2021 [17] | USA | Nasal swab | 170 | Symptomatic | RT-PCR (CDC 2019-nCoV RT-PCR Diagnostic Panel) |
| Beck et al., 2021 [18] | USA | Nasal swab | 346 | Symptomatic | RT-PCR (Hologic Aptima Panther SARS-CoV-2 TMA test) |
| Bornemann et al., 2022 [19] | Germany | Nasopharyngeal swab | 7859 | Asymptomatic + symptomatic | RT-PCR (Multiple assays) |
| Černila et al., 2023 [20] | Slovenia | Nasopharyngeal swab | 804 | Asymptomatic + symptomatic | RT-PCR (unspecified) |
| Černila et al., 2023 [20] | Slovenia | Nasopharyngeal swab | 132 | Symptomatic | RT-PCR (unspecified) |
| Epling et al., 2022 [21] | USA | Nasal swab | 117 | Symptomatic | RT-PCR (unspecified) |
| Ford et al., 2021 [22] | USA | Nasal swab | 865 | Asymptomatic | RT-PCR (CDC 2019-nCoV RT-PCR Diagnostic Panel) |
| Ford et al., 2021 [22] | USA | Nasal swab | 266 | Symptomatic | RT-PCR (CDC 2019-nCoV RT-PCR Diagnostic Panel) |
| Freeman et al., 2022 [23] | USA | Nasal swab | 138 | Asymptomatic | RT-PCR (Cepheid Xpert Xpress SARS-CoV-2) |
| Freeman et al., 2022 [23] | USA | Nasal swab | 249 | Symptomatic | RT-PCR (Cepheid Xpert Xpress SARS-CoV-2) |
| Hahn et al., 2021 [24] | USA | Nasopharyngeal swab | 60 | Asymptomatic + symptomatic | RT-PCR (New York SARS-CoV-2 RT-PCR) |
| Harmon et al., 2021 [25] | USA | Nasal swab | 23462 | Asymptomatic | RT-PCR (Multiple assays) |
| Harris et al., 2021 [26] | USA | Nasal swab | 885 | Symptomatic | RT-PCR (CDC 2019-nCoV RT-PCR Diagnostic Panel) |
| Jääskeläinen et al., 2021 [27] | Finland | Nasal swab | 148 | Symptomatic | RT-PCR (In-house) |
| Mack et al., 2021 [28] | USA | Nasopharyngeal swab | 10982 | Asymptomatic + symptomatic | RT-PCR (Multiple assays) |
| Mitchell et al., 2021 [29] | USA | Nasal swab | 144 | Asymptomatic | RT-PCR (Cepheid Xpert Xpress SARS-CoV-2) |
| Mitchell et al., 2021 [29] | USA | Nasal swab | 104 | Symptomatic | RT-PCR (Cepheid Xpert Xpress SARS-CoV-2) |
| Porte et al., 2021 [30] | Chile | Nasopharyngeal swab | 64 | Symptomatic | RT-PCR (Primerdesign COVID-19 Genesig) |
| Pray et al., 2021 [31] | USA | Nasal swab | 871 | Asymptomatic | RT-PCR (CDC 2019-nCoV RT-PCR Diagnostic Panel) |
| Pray et al., 2021 [31] | USA | Nasal swab | 53 | Symptomatic | RT-PCR (CDC 2019-nCoV RT-PCR Diagnostic Panel) |
| Smith et al., 2021 [32] | USA | Nasal swab | 43 | Asymptomatic + symptomatic | RT-PCR (Abbott Alinity) |
| Young et al., 2020 [33] | USA | Nasal swab | 251 | Symptomatic | RT-PCR (BD MAX realtime SARS-CoV-2 PCR assay) |
The overall diagnostic performance of Quidel Sofia SARS antigen FIA in all samples (i.e., nasal and/or nasopharyngeal) is summarized in figure 1 and table 2, displaying 0.980 (with 0.01 SE) area under the curve (AUC), 0.76 (95%CI, 0.74-0.78; I2, 95%) sensitivity and 1.00 (95%CI, 1.00-1.00; I2, 86%) specificity. The corresponding values of AUC, sensitivity and specificity in the reference nasal swab were 0.987 (with 0.01 SE), 0.72 (95%CI, 0.69-0.75; I2, 89%) and 1.00 (95%CI, 1.00-1.00; I2, 81%). In samples taken from symptomatic cohorts (Figure 2), the cumulative AUC (0.981 with 0.02 SE) and sensitivity (0.81; 95%CI, 0.77-0.83; I2, 22%) were predictably higher, whilst the specificity remained almost unvaried (0.99; 95%CI, 0.99-0.99; I2, 0%). Nearly identical results were found when limiting the analysis to the reference nasal swab, displaying 0.963 (with 0.05 SE) AUC, 0.80 (95%CI, 0.77-0.83; I2, 0%) sensitivity and 0.99 (95%CI, 0.99-1.00; I2, 0%) specificity. These performances obviously decreased in samples taken from asymptomatic subjects (Figure 3), AUC being 0.931 (with 0.01 SE), 0.55 (95%CI, 0.48-0.61; I2, 93%) the sensitivity and 1.00 (95%CI, 1.00-1.00; I2, 89%) the specificity. Using the nasal reference sample collected from asymptomatic subjects the AUC was 0.888 (with 0.07 SE), the sensitivity 0.45 (95%CI, 0.37-0.52; I2, 93%) and the specificity 1.00 (95%CI, 1.00-1.00; I2, 91%). Finally, in the four studies which included mixed cohorts of asymptomatic and symptomatic patients (all except one using nasopharyngeal samples; and study excluded due to lack of negative controls) (Figure 4), the AUC was 0.960 (with 0.03 SE), the sensitivity 0.77 (95%CI, 0.75-0.80; I2, 99%) and the specificity 0.99 (95%CI, 0.99-1.00; I2, 93%). Table 3 synthesizes the diagnostic performance of four other studies [34-37] which reported quantitative data on the diagnostic accuracy of Quidel Sofia SARS antigen FIA, but were excluded due to unavailability of sufficient information for constructing a 2 × 2 table.
Figure 1.
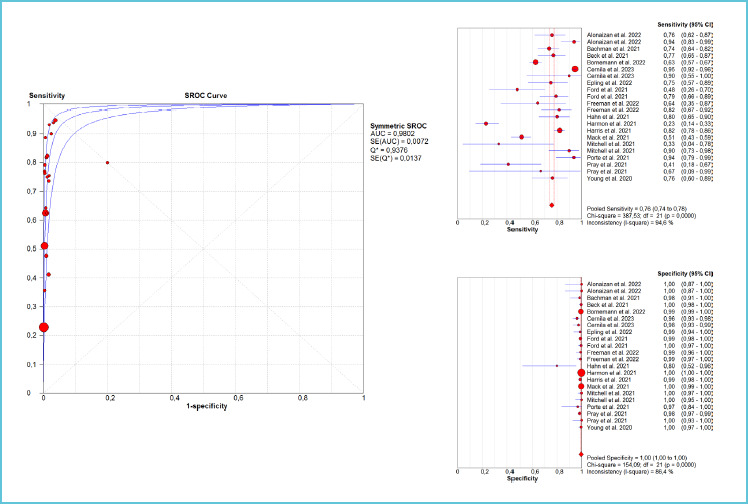
Summary of the diagnostic performance (area under the curve [AUC], sensitivity and specificity) of the studies which cumulatively explored the performance of Quidel Sofia SARS antigen Fluorescent Immunoassay (FIA) for diagnosing acute SARS-CoV-2 infections
Table 2.
Summary of the diagnostic performance of the studies which explored the performance of Quidel Sofia SARS antigen Fluorescent Immunoassay (FIA) for diagnosing acute SARS-CoV-2 infections
| Cohort | AUC (SE) | Sensitivity (95%CI) | Specificity (95%CI) |
|---|---|---|---|
| All samples | 0.980 (0.01) | 0.76 (0.74-0.78) | 1.00 (1.00-1.00) |
| All samples (nasal swab) | 0.987 (0.01) | 0.72 (0.69-0.75) | 1.00 (1.00-1.00) |
| Symptomatic patients | 0.981 (0.02) | 0.81 (0.77-0.83) | 0.99 (0.99-0.99) |
| Symptomatic patients (nasal swab) | 0.963 (0.05) | 0.80 (0.77-0.93) | 0.99 (0.99-1.00) |
| Asymptomatic patients | 0.931 (0.01) | 0.55 (0.46-0.61) | 1.00 (1.00-1.00) |
| Asymptomatic patients (nasal swab) | 0.888 (0.07) | 0.45 (0.37-0.52) | 1.00 (1.00-1.00) |
| Mixed cohorts | 0.960 (0.03) | 0.77 (0.75-0.80) | 0.99 (0.99-1.00) |
Figure 2.

Summary of the diagnostic performance (area under the curve [AUC], sensitivity and specificity) of the studies which explored the performance of Quidel Sofia SARS antigen Fluorescent Immunoassay (FIA) for diagnosing acute SARS-CoV-2 infections in samples taken from symptomatic subjects
Figure 3.

Summary of the diagnostic performance (area under the curve [AUC], sensitivity and specificity) of the studies which explored the performance of Quidel Sofia SARS antigen Fluorescent Immunoassay (FIA) for diagnosing acute SARS-CoV-2 infections in samples taken from asymptomatic subjects
Figure 4.

Summary of the diagnostic performance (area under the curve [AUC], sensitivity and specificity) of the studies which explored the performance of Quidel Sofia SARS antigen Fluorescent Immunoassay (FIA) for diagnosing acute SARS-CoV-2 infections in samples taken from mixed cohort of asymptomatic and symptomatic subjects
Table 3.
Synthesis of the diagnostic performance of studies which explored the performance of Quidel Sofia SARS antigen Fluorescent Immunoassay (FIA) for diagnosing acute SARS-CoV-2 infections and ought to be excluded from the meta-analysis due to unavailability of data for constructing a 2x2 table
| Authors | Cohort | Sensitivity (95% CI) | Specificity (95% CI) |
|---|---|---|---|
| Agard et al., 2022 [34] | Low-risk | 0.26 (-) | 1.00 (-) |
| Agard et al., 2022 [34] | High-risk | 0.37 (-) | 1.00 (-) |
| Al-Alawi et al., 2021 [35] | Symptomatic patients | 0.64 (0.50-0.77) | 0.97 (0.95-0.98) |
| Brihn et al., 2021 [36] | Asymptomatic patients | 0.60 (0.50-0.71) | 1.00 (0.99-1.00) |
| Brihn et al., 2021 [36] | Symptomatic patients | 0.72 (0.61-0.83) | 0.99 (0.97-1.00) |
| Schroeder et al., 2022 [37] | Asymptomatic patients | 0.60 (0.45-0.71) | - |
| Schroeder et al., 2022 [37] | Symptomatic patients | 0.77 (0.56.-0.85) | - |
DISCUSSION
Due to the ongoing surge of infections and the predictable transformation of COVID-19 into an endemic disease, SARS-CoV-2 testing remains of paramount importance for a variety of reasons beyond diagnosing an acute viral infection, thus including the anticipation of local outbreaks [38], predicting future pressure on healthcare systems [39], and timely detection of changes in viral biology and its interaction with the host (i.e., emergence of new variants) [40]. In this problematic scenario, the availability of easy, rapid, affordable, and reliable tests is central to the paradigm for the future management of COVID-19.
Despite recent endorsements by both the WHO and IFCC, which paved the way to diffuse usage of SARS-CoV-2 Ag testing at the population level, concerns have grown as to whether most of these rapid tests would display sufficient accuracy for being used for screening, especially in symptomatic subjects. The recent meta-analysis of the Cochrane COVID-19 Diagnostic Test Accuracy Group revealed that even in high-risk (i.e., symptomatic) populations, the accuracy of such tests is extremely heterogeneous, exhibiting a pooled diagnostic accuracy of 0.76 (95%CI, 0.70-0.81), that only approximates the minimum performance criterion of >0.80 set by the WHO even at the upper limit of the 95%CI [11], and decreasing further to 0.72 (95%CI, 0.69-0.75) when data from “sensitivity-only” investigations were included. Not surprisingly, the diagnostic sensitivity fell well below the WHO sensitivity limit when the analysis included asymptomatic cohorts (i.e., 0.57; 95%CI, 0.48-0.65), becoming the lowest when these tests are used for purposes of large population screening (i.e., 0.45; 95%CI; 0.36-0.54) [11]. Many reasons have been highlighted for justifying the lower diagnostic performance of SARS-CoV-2 RDT-Ag compared to NAATs and even to laboratory-based immunoassay, including the fact that the visual reading of test results, often performed by the patients themselves, may lead to inaccurate interpretation [41], an issue which could be theoretically overcome using analyzer-read SARS-CoV-2 RDT-Ag [42].
The results of our meta-analysis of studies which explored the performance of Quidel Sofia SARS Ag FIA for diagnosing acute SARS-CoV-2 infections reveal that the overall performance of this instrument-read test satisfactory met the WHO threshold of ≥0.80 and ≥0.97 diagnostic sensitivity and specificity in symptomatic individuals (i.e., being 0.81 and 1.00), thus achieving satisfactory accuracy for being used for the WHO and IFCC intended purposes, irrespectively of the type of sample being tested (i.e., nasal or nasopharyngeal swab; table 2). Notably, the diagnostic performance was also found to be nearly optimal in the mixed cohorts of patients (i.e., 0.77 sensitivity and 0.99 specificity), whilst the diagnostic sensitivity remained definitively low in cohorts of asymptomatic subjects (i.e., 0.55, decreasing to 0.45 when using nasal swabs). Similar results were reported in the four studies whose results could not be pooled in our analysis, with values of diagnostic sensitivity in samples taken from symptomatic individuals comprised between 0.64-0.77 and specificity always ≥0.97. Expectedly, even in these investigations the diagnostic sensitivity of Quidel Sofia SARS Ag FIA was found to be remarkably decreased in samples taken from asymptomatic or mixed cohorts of subjects (i.e., between 0.26-0.60). These results are hence aligned to those earlier published by the Cochrane COVID-19 Diagnostic Test Accuracy Group, which pooled the results of only 4 studies (with 1064 samples) and calculated an overall diagnostic sensitivity of 0.80 (95%CI, 0.72-0.86) and an overall diagnostic specificity of 0.99 (95%CI, 0.99-1.00) for Quidel Sofia SARS Ag FIA. Importantly, the article by Ford et al. provided additional information on the use of such test, showing that the diagnostic sensitivity parallels the likelihood of obtaining a positive viral culture, thus enabling a very accurate identification of contagious subjects [22]. Two additional studies, excluded from our pooled analysis because they lacked clinical performance data deserve to be briefly mentioned. Deil et al. carried out a preliminary analysis by constructing a mathematical model for estimating the economical burden of sample-and-stay strategy in German healthcare workers based on the use of Quidel Sofia SARS Ag FIA, and concluded that sequential testing was effective to significantly lower the cumulative hospital expenditure due to shortage of quarantined hospital staff [43]. In a subsequent investigation, the same authors explored the economic impact of using the Quidel Sofia SARS Ag FIA compared to that based on clinical judgement and NAAT for diagnosing COVID-19 in a cohort of German adult patients presenting to the emergency department, concluding that the RDT-AG test enabled to substantially reduce hospital costs by over 200 € for each patient tested [44].
In conclusion, the results of this critical literature review and meta-analysis suggest that the modest but significant improvement shown by the instrument-read Quidel Sofia SARS Ag FIA over more traditional “optically only”-read RDT-Ag would straightforwardly align its diagnostic accuracy to that exhibited cumulatively by laboratory-based SARS-CoV-2 immunoassays, (i.e., 0.76 vs. 0.73 sensitivity and 1.00 vs. 0.98 specificity) [10]. This test may hence combine satisfactory diagnostic performance with the advantages of being potentially used as a POC. On the other hand, the still insufficient diagnostic sensitivity emerged from our analysis in samples taken from asymptomatic patients would suggest to discourage its usage – as with most other SARS-CoV-2 Ag immunoassays - for diagnosis of acute SARS-CoV-2 infection in low-probability subjects. However, in such settings, it could be theoretically used to identify those with higher viral load, who may be responsible for a substantially higher burden of transmission.
Footnotes
Conflicts of interest
The authors declare no conflict of interest.
REFERENCES
- 1.McVernon J, Liberman J. WHO keeps covid-19 a public health emergency of international concern. BMJ 2023; 380:p504. [DOI] [PubMed] [Google Scholar]
- 2.Mattiuzzi C, Henry BM, Lippi G. Regional Association between Mean Air Temperature and Case Numbers of Multiple SARS-CoV-2 Lineages throughout the Pandemic. Viruses 2022;14:1913. [DOI] [PMC free article] [PubMed] [Google Scholar]
- 3.Lippi G, Sanchis-Gomar F, Henry BM. Coronavirus disease 2019 (COVID-19): the portrait of a perfect storm. Ann Transl Med 2020;8:497. [DOI] [PMC free article] [PubMed] [Google Scholar]
- 4.World Health Organization. Public health surveillance for COVID-19: interim guidance - Interim guidance. Available at: https://www.who.int/publications/i/item/WHO-2019-nCoV-SurveillanceGuidance-2022.2. Last accessed, March 23, 2023.
- 5.Lippi G, Favresse J, Gromiha MM, SoRelle JA, Plebani M, Henry BM. Ad interim recommendations for diagnosing SARS-CoV-2 infection by the IFCC SARS-CoV-2 variants working group. Clin Chem Lab Med 2022;60:975-981. [DOI] [PubMed] [Google Scholar]
- 6.Pighi L, Henry BM, Mattiuzzi C, De Nitto S, Salvagno GL, Lippi G. Cost-effectiveness analysis of different COVID-19 screening strategies based on rapid or laboratory-based SARS-CoV-2 antigen testing. Clin Chem Lab Med. 2023. Feb 28. doi: 10.1515/cclm-2023-0164. Epub ahead of print. [DOI] [PubMed] [Google Scholar]
- 7.Bernasconi L, Neyer P, Oberle M, Schmid B, Martin E, Fankhauser H, et al. Efficiency evaluation of a SARS-CoV-2 diagnostic strategy combining high throughput quantitative antigen immunoassay and real time PCR. Clin Chem Lab Med. 2023. Mar 22. doi: 10.1515/cclm-2023-0087. Epub ahead of print. [DOI] [PubMed] [Google Scholar]
- 8.World Health Organization. Antigen-detection in the diagnosis of SARS-CoV-2 infection. Available at: https://www.who.int/publications/i/item/antigen-detection-in-the-diagnosis-of-sars-cov-2infection-using-rapid-immu-noassays. Last accessed: March 23, 2023.
- 9.Favresse J, Douxfils J, Henry B, Lippi G, Plebani M. Clinical Chemistry and Laboratory Medicine celebrates 60 years - narrative review devoted to the contribution of the journal to the diagnosis of SARS-CoV-2. Clin Chem Lab Med. 2022. Nov 24. doi: 10.1515/cclm-2022-1166. Epub ahead of print. [DOI] [PubMed] [Google Scholar]
- 10.Lippi G, Henry BM, Plebani M. Pooled analysis of laboratory-based SARS-CoV-2 antigen immunoassays. Clin Chem Lab Med. 2023. Jan 12. doi: 10.1515/cclm-2022-1321. Epub ahead of print. [DOI] [PubMed] [Google Scholar]
- 11.Dinnes J, Sharma P, Berhane S, van Wyk SS, Nyaaba N, Domen J, et al. Rapid, point-of-care antigen tests for diagnosis of SARS-CoV-2 infection. Cochrane Database Syst Rev 2022;7:CD013705. [DOI] [PMC free article] [PubMed] [Google Scholar]
- 12.Cubas-Atienzar Al, Kontogianni K, Edwards T, Wooding D, Buist K, Thompson CR, et al. Limit of detection in different matrices of 19 commercially available rapid antigen tests for the detection of SARS-CoV-2. Sci Rep 2021;11:18313. [DOI] [PMC free article] [PubMed] [Google Scholar]
- 13.Lippi G, Henry BM, Plebani M. An overview of the most important preanalytical factors influencing the clinical performance of SARS-CoV-2 antigen rapid diagnostic tests (Ag-RDTs). Clin Chem Lab Med 2022;61:196-204. [DOI] [PubMed] [Google Scholar]
- 14.Ang GY, Chan KG, Yean CY, Yu CY. Lateral Flow Immunoassays for SARS-CoV-2. Diagnostics (Basel) 2022;12:2854. [DOI] [PMC free article] [PubMed] [Google Scholar]
- 15.Zamora J, Abraira V, Muriel A, Khan KS, Coomarasamy A. Meta-DiSc: a software for meta-analysis of test accuracy data. BMC Med Res Methodol 2006;6:31. [DOI] [PMC free article] [PubMed] [Google Scholar]
- 16.Alonaizan F, AlHumaid J, AlJindan R, Bedi S, Dardas H, Abdulfattah D, et al. Sensitivity and Specificity of Rapid SARS-CoV-2 Antigen Detection Using Different Sampling Methods: A Clinical Unicentral Study. Int J Environ Res Public Health 2022;19:6836. [DOI] [PMC free article] [PubMed] [Google Scholar]
- 17.Bachman CM, Grant BD, Anderson CE, Alonzo LF, Garing S, Byrnes SA, et al. Clinical validation of an open-access SARS-COV-2 antigen detection lateral flow assay, compared to commercially available assays. PLoS One 2021;16:e0256352. [DOI] [PMC free article] [PubMed] [Google Scholar]
- 18.Beck ET, Paar W, Fojut L, Serwe J, Jahnke RR. Comparison of the Quidel Sofia SARS FIA Test to the Hologic Aptima SARS-CoV-2 TMA Test for Diagnosis of COVID-19 in Symptomatic Outpatients. J Clin Microbiol 2021;59: e02727-20. [DOI] [PMC free article] [PubMed] [Google Scholar]
- 19.Bornemann L, Dähne T, Fomenko A, Kaup O, Kleideiter J, Kulis-Horn R, et al. Performance of the Sofia SARS-CoV-2 rapid antigen test as frontline test in a university hospital, Germany. Diagn Microbiol Infect Dis 2022;103: 115663. [DOI] [PMC free article] [PubMed] [Google Scholar]
- 20.Černila M, Logar M, Možina H, Osredkar J. Comparison between the Sofia SARS Antigen FIA Test and the PCR Test in Detection of SARS-CoV-2 Infection. Lab Med 2023;54:e44-e48. [DOI] [PMC free article] [PubMed] [Google Scholar]
- 21.Epling J, Lowery M, Mahoney A, Baffoe-Bonnie A, Locklear T, Tenzer M, et al. Diagnostic accuracy of a new COVID-19 antigen test obtained by mid-turbinate swab. Ann Fam Med. 2022. Apr 1;(20 Suppl 1). doi: 10.1370/afm.20.s1.2920. [DOI] [PMC free article] [PubMed] [Google Scholar]
- 22.Ford L, Lee C, Pray IW, Cole D, Bigouette JP, Abedi GR, et al. Epidemiologic Characteristics Associated With Severe Acute Respiratory Syndrome Coronavirus 2 (SARS-CoV-2) Antigen-Based Test Results, Real-Time Reverse Transcription Polymerase Chain Reaction (rRT-PCR) Cycle Threshold Values, Subgenomic RNA, and Viral Culture Results From University Testing. Clin Infect Dis 2021;73:el348-el355. [DOI] [PMC free article] [PubMed] [Google Scholar]
- 23.Freeman MC, Freeman TJ, lagnemma J, Rasmussen J, Heidenreich K, Wells A, et al. Performance of the Sofia SARS-CoV-2 Rapid Antigen Test in Symptomatic and Asymptomatic Pediatric Patients. J Pediatric Infect Dis Soc 2022;11:417-421. [DOI] [PMC free article] [PubMed] [Google Scholar]
- 24.Hahn M, Olsen A, Stokes K, Fowler RC, Gu R, Semple-Lytch S, et al. Use, Safety Assessment, and Implementation of Two Point-of-Care Tests for COVID-19 Testing. Am J Clin Pathol 2021;156:370-380. [DOI] [PMC free article] [PubMed] [Google Scholar]
- 25.Harmon K, de St Maurice AM, Brady AC, Swaminathan S, Aukerman DF, Rueda MA, et al. Surveillance testing for SARS-COV-2 infection in an asymptomatic athlete population: a prospective cohort study with 123 362 tests and 23 463 paired RT-PCR/antigen samples. BMJ Open Sport Exerc Med 2021;7:e001137. [DOI] [PMC free article] [PubMed] [Google Scholar]
- 26.Harris DT, Badowski M, Jernigan B, Sprissler R, Edwards T, Cohen R, et al. SARS-CoV-2 Rapid Antigen Testing of Symptomatic and Asymptomatic Individuals on the University of Arizona Campus. Biomedicines 2021;9: 539. [DOI] [PMC free article] [PubMed] [Google Scholar]
- 27.Jääskeläinen AE, Ahava MJ, Jokela P, Szirovicza L, Pohjala S, Vapalahti O, et al. Evaluation of three rapid lateral flow antigen detection tests for the diagnosis of SARS-CoV-2 infection. J Clin Virol 2021;137:104785. [DOI] [PMC free article] [PubMed] [Google Scholar]
- 28.Mack CD, Osterholm M, Wasserman EB, Petruski-lvleva N, Anderson DJ, Myers E, et al. Optimizing SARS-CoV-2 Surveillance in the United States: Insights From the National Football League Occupational Health Program. Ann Intern Med 2021;174:1081-1089. [DOI] [PMC free article] [PubMed] [Google Scholar]
- 29.Mitchell SL, Orris S, Freeman T, Freeman MC, Adam M, Axe M, et al. Performance of SARS-CoV-2 antigen testing in symptomatic and asymptomatic adults: a single-center evaluation. BMC Infect Dis 2021;21:1071. [DOI] [PMC free article] [PubMed] [Google Scholar]
- 30.Porte L, Legarraga P, Iruretagoyena M, Vollrath V, Pizarro G, Munita J, et al. Evaluation of two fluorescence immunoassays for the rapid detection of SARS-CoV-2 antigen-new tool to detect infective COVID-19 patients. PeerJ 2021;9:el0801. [DOI] [PMC free article] [PubMed] [Google Scholar]
- 31.Pray IW, Ford L, Cole D, Lee C, Bigouette JP, Abedi GR, et al. Performance of an Antigen-Based Test for Asymptomatic and Symptomatic SARS-CoV-2 Testing at Two University Campuses - Wisconsin, September-October 2020. MMWR Morb Mortal Wkly Rep 2021;69:1642-1647. [DOI] [PMC free article] [PubMed] [Google Scholar]
- 32.Smith RL, Gibson LL, Martinez PP, Ke R, Mirza A, Conte M, et al. Longitudinal Assessment of Diagnostic Test Performance Over the Course of Acute SARS-CoV-2 Infection. J Infect Dis;224:976-982. [DOI] [PMC free article] [PubMed] [Google Scholar]
- 33.Young S, Taylor SN, Cammarata CL, Varnado KG, Roger-Dalbert C, Montano A, et al. Clinical Evaluation of BD Veritor SARS-CoV-2 Point-of-Care Test Performance Compared to PCR-Based Testing and versus the Sofia 2 SARS Antigen Point-of-Care Test. J Clin Microbiol 2020; 59:e02338-20. [DOI] [PMC free article] [PubMed] [Google Scholar]
- 34.Agard A, Elsheikh O, Bell D, Relich RF, Schmitt BH, Sadowski J, et al. Clinical comparison and agreement of PCR, antigen, and viral culture for the diagnosis of COVID-19: Clinical Agreement Between Diagnostics for COVID19. J Clin Virol Plus 2022;2:100099. [DOI] [PMC free article] [PubMed] [Google Scholar]
- 35.Al-Alawi S, Al-Hinai H, Al-Kindi N, Al-Rashidi M, Al-Kindi H, Al-Shukri I, et al. Evaluation of Four Rapid Antigen Tests for Detection of SARS-CoV-2 virus. Oman Med J 2021;36:e297. [DOI] [PMC free article] [PubMed] [Google Scholar]
- 36.Brihn A, Chang J, OYong K, Balter S, Terashita D, Rubin Z, et al. Diagnostic Performance of an Antigen Test with RT-PCR for the Detection of SARS-CoV-2 in a Hospital Setting - Los Angeles County, California, June-August 2020. MMWR Morb Mortal Wkly Rep 2021;70:702-706. [DOI] [PMC free article] [PubMed] [Google Scholar]
- 37.Schroeder LF, Bachman MA, Idoni A, Gegenheimer-Holmes J, Kronick SL, Valdez R, et al. Predicting Direct-Specimen SARS-CoV-2 Assay Performance Using Residual Patient Samples. J Appl Lab Med 2022;7:661-673. [DOI] [PMC free article] [PubMed] [Google Scholar]
- 38.Dehesh P, Baradaran HR, Eshrati B, Motevalian SA, Salehi M, Donyavi T. The Relationship Between Population-Level SARS-CoV-2 Cycle Threshold Values and Trend of COVID-19 Infection: Longitudinal Study. JMIR Public Health Surveill 2022;8:e36424. [DOI] [PMC free article] [PubMed] [Google Scholar]
- 39.COVID-19 APHP-Universities-INRIA-INSERM Group. Early indicators of intensive care unit bed requirement during the COVID-19 epidemic: A retrospective study in Ile-de-France region, France. PLoS One 2020;15:e0241406. [DOI] [PMC free article] [PubMed] [Google Scholar]
- 40.Han AX, Toporowski A, Sacks JA, Perkins MD, Briand S, van Kerkhove M, et al. SARS-CoV-2 diagnostic testing rates determine the sensitivity of genomic surveillance programs. Nat Genet 2023;55:26-33. [DOI] [PMC free article] [PubMed] [Google Scholar]
- 41.Karlafti E, Tsavdaris D, Kotzakioulafi E, Kaiafa G, Savopoulos C, Netta S, et al. The Diagnostic Accuracy of SARS-CoV-2 Nasal Rapid Antigen Self-Test: A Systematic Review and Meta-Analysis. Life (Basel) 2023;13:281. [DOI] [PMC free article] [PubMed] [Google Scholar]
- 42.Keskin AU, Ciragil P, Topkaya AE. Clinical Accuracy of Instrument-Read SARS-CoV-2 Antigen Rapid Diagnostic Tests (Ag-IRRDTs). Int J Microbiol 2022;2022: 9489067. [DOI] [PMC free article] [PubMed] [Google Scholar]
- 43.Diel R, Hittel N, Nienhaus A. Point-of-Care COVID-19 Antigen Testing in Exposed German Healthcare Workers-A Cost Model. Int J Environ Res Public Health 2021; 18:10767. [DOI] [PMC free article] [PubMed] [Google Scholar]
- 44.Diel R, Nienhaus A. Point-of-care COVID-19 antigen testing in German emergency rooms - a cost-benefit analysis. Pulmonology 2022;28:164-172. [DOI] [PMC free article] [PubMed] [Google Scholar]