

Abstract
Alcohol use can be measured in many ways, including objectively through transdermal alcohol biosensors (e.g., transdermal alcohol concentration; TAC) or blood biomarkers (e.g., phosphatidylethanol; PEth), or subjectively through self-report (e.g., with the timeline followback; TLFB). However, it is unclear which measures best indicate changes in alcohol use within individuals following intervention, and if they have concurrent validity. In the context of contingency management (CM) with a goal of 30-day abstinence (n = 45, 60% male, 80% Black; Mage = 56.7; 58% with HIV), we examined relationships among changes in TAC-AUC (area under the curve, reflecting volume consumed), PEth, and self-reported number of drinks. The Secure Continuous Remote Alcohol Monitor Continuous Alcohol Monitoring (SCRAM-CAM) biosensor was used to collect TAC-AUC during a pre-CM period (~7 days) and over a 30-day CM period. PEth was collected at baseline and 30-day follow-up. Number of drinks was self-reported through a 30-day TLFB at baseline and follow-up. Daily TAC-AUC and number of self-reported drinks were calculated for the pre-CM period and for the last 7 days of the CM period. Linear regression models controlling for baseline values revealed that change in TAC-AUC was significantly associated with change in PEth (β = 0.33, p < .0001) and with change in number of self-reported drinks (β = 0.34, p < .0001). Change in PEth was significantly associated with change in number of self-reported drinks (β = 0.85, p < .0001). We conclude that all three measures may be appropriate for measuring within-person change in alcohol use, while controlling for baseline values, in the context of a study testing an intervention such as CM.
Keywords: phosphatidylethanol, transdermal alcohol concentration, biosensor, biomarker, alcohol consumption
Objective measures of alcohol use can provide researchers and clinicians with the ability to identify potential alcohol misuse and monitor an individual’s progress during treatment (Litten et al., 2010), reflected in their change in alcohol use. Objective measures provide a useful compliment to self-reported alcohol use, which is often underreported or misreported due to social desirability or recall biases (Davis et al., 2010; Greenfield & Kerr, 2008).
There are several objective tools to measure alcohol use, including biomarkers and transdermal alcohol biosensors. Phosphatidylethanol (PEth) is a direct alcohol biomarker that forms in the blood only in the presence of alcohol (Hahn et al., 2016). In the absence of alcohol, the average half-life of PEth is approximately 4–11 days and may be detectable for 2–4 weeks (Hahn et al., 2016; Helander, Böttcher, et al., 2019). However, depending on “baseline” PEth level, the amount of time it takes for an individual to have undetectable PEth levels varies (i.e., higher PEth at baseline takes longer to reduce to undetectable; Hahn et al., 2016). PEth has been demonstrated to outperform other alcohol biomarkers in detecting alcohol misuse (Aradottir et al., 2006; Harris et al., 2021; Viel et al., 2012; Walther et al., 2015). Several studies have reported on the relationship between PEth and self-reported alcohol use at one point in time, with most indicating moderate-to-strong correlations from 0.53 to 0.80, although a few studies reviewed in a meta-analysis found weaker correlations from 0.21 to 0.44 (Hahn et al., 2021). A few studies have examined the relationship between change in PEth and change in self-reported alcohol use, with correlations ranging from 0.14 to 0.46 (Helander, Hermansson, et al., 2019; McGinnis et al., 2022; Richards, Sajdeya, et al., 2021).
Unlike PEth, which provides one value to represent alcohol use at a specific period of time, transdermal alcohol biosensors measure alcohol use continuously and in near real-time (Davis-Martin et al., 2021). The SCRAM-CAM (Secure Continuous Remote Alcohol Monitor Continuous Alcohol Monitoring; Alcohol Monitoring Systems, Inc., Littleton, CO) anklet is the most commonly used and well-validated alcohol biosensor available (Greenfield et al., 2014; Litten et al., 2010; Wang et al., 2019). The SCRAM-CAM works by measuring the approximately 1% of ethanol that is eliminated through the skin, providing observers with a transdermal alcohol concentration (TAC) reading every 30 min (Swift, 2003). Common indices derived from TAC include peak TAC, which represents the highest level of TAC reached during a drinking episode (Dougherty et al., 2012), and area under the curve (TAC-AUC), which represents an individual’s total exposure to alcohol during a drinking episode (Dougherty, Hill-Kapturczak, et al., 2015). TAC has been found to be significantly associated with self-reported drinking (i.e., number of drinks or drinking levels) with reported correlations from 0.30 to 0.74 (Barnett et al., 2014; Dougherty et al., 2014; Richards, Liu, et al., 2021; Russell et al., 2022). Several studies support the use of transdermal alcohol biosensors in alcohol reduction interventions, for example, contingency management (CM; Barnett et al., 2011, 2017; Davis-Martin et al., 2021; Dougherty, Karns, et al., 2015), but to our knowledge, no study has compared longitudinal changes in TAC to another alcohol measure.
Alcohol biomarkers and transdermal alcohol biosensors have advantages and disadvantages. PEth involves a single sample (blood draw or finger prick) to obtain information on recent alcohol use (or less recent, depending on how heavily the person drank; Wurst et al., 2010), but a positive PEth value does not reveal when or how much alcohol was used (Harris et al., 2021). Although single timepoint, single target assays by their nature reflect recency and intensity of use and it is possible that PEth taken at multiple time points could work around this limitation. The continuous, near real-time data collection of the SCRAM-CAM provides fine-grained data about alcohol use patterns in a person’s natural environment, reflecting both relative timing (although there is a 1–2 hr lag time, Fairbairn & Kang, 2019) and intensity of drinking. Depending on the criteria used to detect drinking episodes, though, sometimes only heavier drinking episodes may be identified (Barnett et al., 2011).
As previously mentioned, both PEth and TAC have been compared to self-reported alcohol use. To date, only one published study has analyzed the relationship between PEth and TAC. Marcus and colleagues reported good agreement (rs = 0.56) between PEth and TAC-AUC cross-sectionally (Marcus et al., 2021). However, it is unclear how well changes in either of these measures correlates with changes in drinking within an individual. In the context of CM with a goal of abstinence, changes in PEth, TAC-AUC and self-report can be compared. Given the limitations to all three of these measures (including that in a CM study, participants have perceived financial motivation to underestimate their alcohol use) and the lack of a gold standard for measuring alcohol use, determining whether these three measures are sensitive to change and are concurrently valid (i.e., they positively and significantly correlate within one another) could help determine their utility as measures of change in alcohol use within individuals. The present study uses data from a prospective study in which CM was tested among persons with and without HIV (Richards, Liu, et al., 2021).
Method
We analyzed data from “the 30-Day Challenge” (NCT03353701), a CM trial for alcohol cessation among middle-to-older age adults with and without confirmed HIV over a 30-day period. All study procedures were approved by participating institutional review boards (Study Title: Effects of experimentally induced reductions in alcohol consumption on brain cognitive, and clinical outcomes and motivation for changing drinking in older persons with HIV infection; University of Miami IRB No. 20170396, Florida International University IRB No. 20170396-IAA, University of Florida IRB No. CED00000011), and all participants provided informed consent prior to participation.
Participants
Participants were recruited in the Miami, Florida area from HIV clinics, community outreach, and a contact registry. To be eligible, participants had to be 45–75 years old; drink heavily (≥14 drinks/week for women, ≥21 drinks/week for men); speak English; be willing to participate in CM to reduce their alcohol use; and be willing to wear the SCRAM-CAM for at least 30 days. Forty-seven participants completed the baseline visit and 30-day follow-up. After removing one person with missing PEth data and one person with no biosensor-confirmed drinking days, our final sample size was 45 participants.
Procedure
The overall study flow is depicted in Figure 1. Detailed procedures of the 30-Day Challenge have been described previously (Richards, Liu, et al., 2021). Briefly, participants entered a pre-CM period which lasted approximately 7 days. During this period, participants wore the SCRAM-CAM and were instructed to drink as usual with the exception of having at least 1 day of abstinence and at least one drinking day to check the correspondence between self-reported drinking and nondrinking days at baseline and to ensure that they could complete the intervention. Participants completed a baseline visit, during which blood was collected for PEth and past 7-day alcohol use was self-reported. After baseline, participants began the CM period which lasted approximately 30 days. CM financial compensation was based on biosensor data. If alcohol was detected by the SCRAM-CAM (see procedure below), the participant was alerted immediately; if they denied alcohol use, they had the opportunity to come into the lab and provide a urine ethyl glucuronide (EtG) sample within 48 hr. In cases where EtG was negative, TAC data were recoded to indicate no drinking (i.e., TAC-AUC = 0). After the CM period, participants completed a 30-day follow-up visit, during which the SCRAM-CAM was removed, blood was collected for PEth, and 30-day alcohol use was self-reported. Participants also completed 90-day and 1-year follow-up visits (data not included in the present study).
Figure 1.

30-Day Challenge Study Flow
Note. SCRAM = Secure Continuous Remote Alcohol Monitor; CM = contingency management. The 30-Day Challenge study included a 7-day pre-CM period, baseline visit, 30-day, 90-day, and 1-year follow-ups. Data for the present study come from the pre-CM period, baseline visit, and 30-day follow-ups. Data include average transdermal alcohol concentration area under the curve (TAC-AUC, collected by the SCRAM biosensor), phosphatidylethanol (PEth), and average number of drinks per day (from 30-day timeline followback, TLFB).
Average Daily TAC-AUC
TAC data were collected by the SCRAM-CAM and transmitted to the Alcohol Monitoring Systems, Inc. server using the company’s DirectConnect device. Data were downloaded from the server through a password-protected portal. The Transdermal Alcohol Sensor Data Macro (TASMAC Software; Barnett et al., 2015) read and interpreted data from the SCRAM, producing summary TAC data including TAC-AUC for each detected drinking episode. The TASMAC uses more sensitive criteria to detect drinking episodes than criteria developed by Alcohol Monitoring Systems, Inc. (Barnett et al., 2011). Average daily TAC-AUC was calculated for the pre-CM period and for the last 7 days of the CM period. By comparing 7 days of pre-CM data with the last 7 days of the CM period data for each individual, a large amount of the within-participant variability (physiological, environmental, behavioral) is held stable.
PEth
Dried blood spots collected at baseline and the 30-day follow-up visit were prepared using venous blood and sent to the United States Drug Laboratory (USDTL, Des Plaines, IL) to be analyzed using mass spectrometry. The most common PEth homologue, 16:0/18:1, was detected using a lower limit of quantification of 8 ng/ml (subsequently converted to a value of 0) (Hahn et al., 2016).
Average Daily Number of Drinks
Daily drinking data were collected using the 30-day timeline followback (TLFB) at each timepoint. Average number of drinks per day was calculated for the pre-CM period and for the last 7 days of the CM period; this calculation included nondrinking days (i.e., zero drinks for nondrinking days).
Participant Characteristics
Participants self-reported their sex, age, and race/ethnicity by survey at the baseline visit. Height and weight were collected at baseline to calculate body mass index (BMI). HIV status was confirmed by medical records, copies of laboratory test results, HIV medications (for persons living with HIV), or confirmatory blood tests (for persons without HIV).
Data Analysis
Average daily TAC-AUC, PEth values, and average number of drinks per day were standardized using z scores. Change scores were calculated for each variable by subtracting pre-CM period (Time 1) values from the last 7 days of CM (Time 2) values. Intercorrelations (Pearson correlations) between all key standardized variables (pre-CM values and change values of average daily TAC-AUC, PEth, and average drinks per day) were calculated. The following linear regression models were conducted: (a) Change in average daily TAC-AUC (outcome) regressed on change in PEth, controlling for pre-CM period daily TAC-AUC and baseline PEth; (b) Change in average daily TAC-AUC (outcome) regressed on change in average number of self-reported drinks per day, controlling for the pre-CM period daily TAC-AUC and pre-CM period daily number of self-reported drinks; and (c) Change in PEth (outcome) regressed on change in average number of self-reported drinks per day, controlling for baseline PEth and pre-CM period daily number of self-reported drinks (Castro-Schilo & Grimm, 2018). Sex, BMI, and HIV status were also included separately in additional models due to reported associations with TAC-AUC and/or PEth (Hahn et al., 2021; Richards, Liu, et al., 2021).
Post Hoc Sensitivity Analysis
Since PEth may detect alcohol for at least 2 weeks, a sensitivity analysis using past 14-days of self-reported drinks per day was conducted. The correlation between change in PEth and change in average drinks per day over 14 days was evaluated. Further, a linear regression model where change in PEth was regressed on change in average number of self-reported drinks per day over 14 days while controlling for pre-CM period values was conducted.
Results
The 45 participants were majority male (60.0%) with a mean age of 56.7 (SD = 4.6). Participants identified as non-Hispanic Black (80.0%), non-Hispanic White (8.9%), and Hispanic (11.1%). Participants had a mean BMI of 27.2 (SD = 6.2), and the majority were living with HIV (57.8%).
The median average daily TAC-AUC during the pre-CM period was20.0 h·g/dl (interquartile range; IQR: 7.3–49.3) and during the last 7 days of CM was 0.5 h·g/dl (IQR: 0.0–3.9). The median change in daily TAC-AUC was −15.5 h·g/dl (IQR: −46.1–−4.5). The median PEth at baseline was 76.0 ng/L (IQR: 21.0–191.0), and at follow-up was 29.0 ng/L (IQR: 0.0–84.0). The median change in PEth was −33.0 ng/L (IQR: −91.0–0.0). The median average drinks per day during the pre-CM period was 4.9 drinks/day (IQR: 3.4–6.0) and during the last 7 days of CM was 0.0 drinks/day (IQR: 0.0–0.1). The median change in average drinks per day was −3.9 drinks/day (IQR: −5.4–−2.9). Scatterplots of change variable data are presented in Figure 2.
Figure 2.
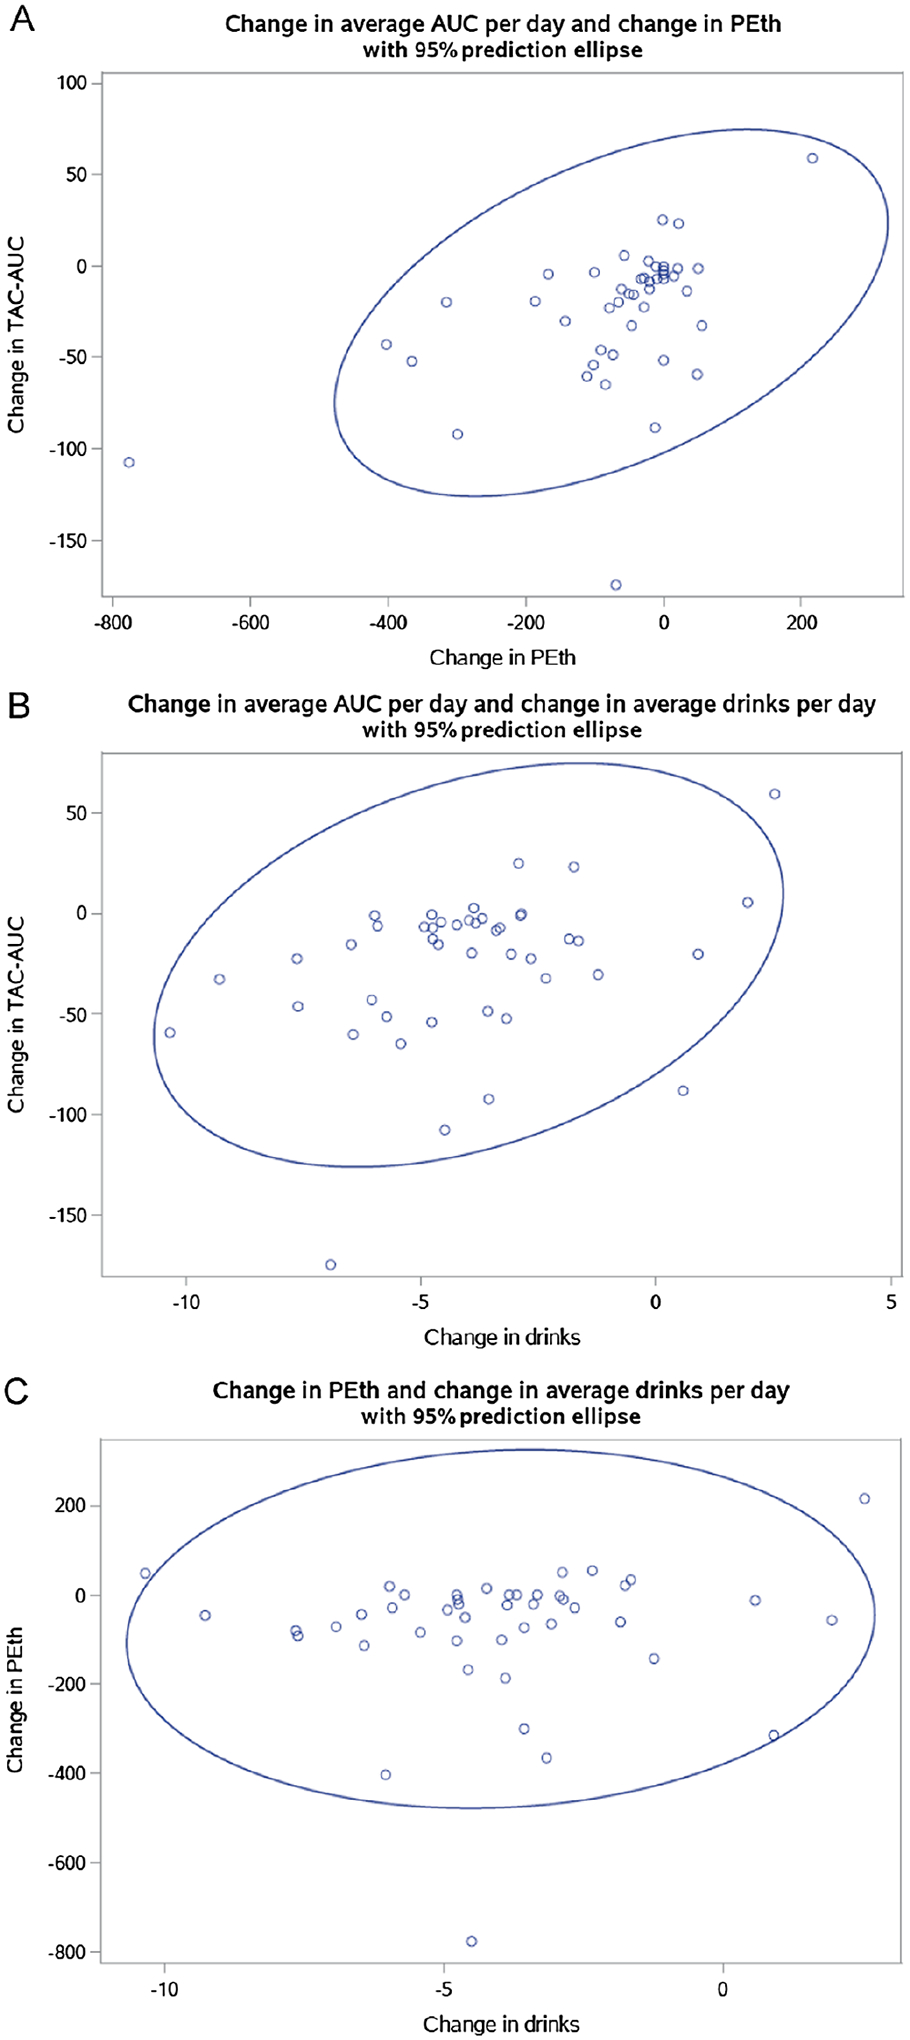
Scatterplots of Change Variables
Note. Change was calculated by subtracting Time 1 values from Time 2 values. A) Change in average daily transdermal alcohol concentration area under the curve (TAC-AUC) and change in phosphatidylethanol (PEth). B) Change in average daily TAC-AUC and change in average drinks per day. C) Change in PEth and change in average drinks per day.
Pre-CM daily TAC-AUC was significantly correlated with change in average TAC-AUC per day (r = −0.91), pre-CM PEth was significantly correlated with change in PEth (r = −0.59), and pre-CM average drinks per day was significantly correlated with change in average drinks per day (r = −0.65; Table 1). Change in average daily TAC-AUC was significantly correlated with change in PEth (r = 0.49) and change in average drinks per day (r = 0.35). Change in PEth was not significantly correlated with change in average drinks per day (r = 0.08), but the sensitivity analysis examining change in average drinks per day over 14 days (rather than 7 days) indicated that change in PEth and change in average drinks per day were significantly correlated (r = 0.29).
Table 1.
Intercorrelations Between TAC-AUC, PEth, and Daily Drinks (N = 45)
| Variable | 1 | 2 | 3 | 4 | 5 | 6 |
|---|---|---|---|---|---|---|
| 1. Average TAC-AUC at Time 1 | — | |||||
| 2. PEth at Time 1 | 0.41* | — | ||||
| 3. Average drinks per day at Time 1 | 0.32* | 0.004 | — | |||
| 4. Change in average TAC-AUC per day | −0.91* | −0.20 | −0.29* | — | ||
| 5. Change in PEth | −0.41* | −0.59* | 0.04 | 0.49* | — | |
| 6. Change in average drinks per day | −0.17 | 0.41* | −0.65* | 0.35* | 0.08 | — |
Note. TAC-AUC = transdermal alcohol concentration area under the curve; PEth = phosphatidylethanol. Change was calculated by subtracting Time 1 values (precontingency management [CM] period) from Time 2 values (the last 7 days of the CM period). Correlations that are negative indicate Time 1 values are correlated with reductions in corresponding variable; based on these values—persons with higher Time 1 values had on average, greater reductions between Time 1 and Time 2.
Represents correlations with p < .05.
The following results refer to adjusted standardized values (Table 2). Change in PEth was significantly associated with change in average daily TAC-AUC while controlling for pre-CM period values (β = 0.33, p < .0001). Change in average self-reported number of drinks per day was significantly associated with change in average daily TAC-AUC while controlling for pre-CM period values (β = 0.34, p < .0001). Change in average daily self-reported number of drinks per day was significantly associated with change in PEth while controlling for pre-CM period values (β = 0.85, p < .0001). The sensitivity analysis using the last 14 days of self-reported number of drinks per day resulted in similar findings (β = 0.86, p < .0001). Sex, BMI, and HIV status were not significantly associated with any outcome while controlling for baseline values.
Table 2.
Associations Between Changes in TAC-AUC, PEth, and Daily Drinks (N = 45)
| Variable | Standardized β (SE) | p value |
|---|---|---|
| Change in average daily TAC-AUCa regressed on change in PEth | ||
| Change in PEth | 0.33 (0.05) | <.0001 |
| Average daily TAC-AUC at Time 1 | −0.93 (0.04) | <.0001 |
| PEth at time 1 | 0.36 (0.05) | <.0001 |
| Change in average daily TAC-AUCa regressed on change in average drinks per day | ||
| Change in average drinks per day | 0.34 (0.07) | <.0001 |
| Average daily TAC-AUC at Time 1 | −0.92 (0.05) | <.0001 |
| Average drinks per day at Time 1 | 0.11 (0.03) | .0027 |
| Change in petha regressed on change in average drinks per day | ||
| Change in average drinks per day | 0.85 (0.15) | <.0001 |
| PEth at Time 1 | −0.94 (0.11) | <.0001 |
| Average drinks per day at Time 1 | 0.29 (0.07) | <.0001 |
Note. TAC-AUC = transdermal alcohol concentration area under the curve; PEth = phosphatidylethanol. SE = standard error. Change was calculated by subtracting Time 1 values (precontingency management [CM] period) from Time 2 values (the last 7 days of the CM period).
Primary outcome variable.
Discussion
We examined the association between changes in average daily TAC-AUC, PEth, and average daily self-reported number of drinks among a sample of older adults with and without HIV participating in an alcohol use intervention study. We found that changes in TAC-AUC, PEth, and self-reported number of drinks were all significantly associated with each other while controlling for pre-CM values, indicating that there is concurrent validity among all three measures.
Our results suggest that average daily TAC-AUC is able to capture changes in drinking within individuals as reflected by its association with self-report and PEth values. With no gold standard measure, identifying a measure that is associated with both self-report and an objective biomarker of alcohol use (i.e., PEth) is important. While data collection through the SCRAM-CAM is expensive and time consuming, it appears that the resulting data are indicative of reduction in alcohol use. TAC-AUC may be an appropriate complement to self-reported data, but not a replacement as there is currently no method other than self-report to obtain quantities of alcohol use (i.e., number of drinks).
Our findings are in agreement with the previous literature that showed only weak correlations between change in PEth and change in self-reported number of drinks per day over 7 days (Helander, Hermansson, et al., 2019; McGinnis et al., 2022; Richards, Sajdeya, et al., 2021). It is important to note, that there was a significant correlation between change in PEth and change in drinks per day over 14 days. Given the average detection period of 2–4 weeks for PEth (Hahn et al., 2016; Helander, Böttcher, et al., 2019), the different results are to be expected, and we can conclude that if using PEth to detect change in alcohol use, PEth should be used as a marker of prior two (or more) weeks alcohol use, not 1 week. Thus, PEth appears to be a useful biomarker for detecting changes in alcohol use, supporting conclusions from a small pilot study, suggesting that a PEth-based CM intervention may be feasible (McDonell et al., 2017).
Though change in PEth and change in self-reported number of drinks had the strongest association while controlling for baseline values among the variables, use of TAC-AUC still provides valuable information. TAC-AUC allows us to understand relative timing of drinking events and allows for a day-by-day approach to CM, whereas relying only on PEth for biological verification of abstinence would be limited to longer periods of time. However, in a setting where it is not feasible to rely on biosensors (e.g., due to cost or participant burden), PEth may be an appropriate supplement to self-report.
Our study was limited by sample size. Because of this, we may have been underpowered to detect group differences. This study was also limited by the lack of a gold standard measure of alcohol use; thus, it is difficult to say whether one measure is more accurate than another. While self-report was associated with TAC-AUC and PEth (depending on the time period), two objective markers, that is not always the case, as self-report in some settings may be more vulnerable to biases such as recall and social desirability bias. Though self-reported alcohol use is often the measure against which objective tools are compared, ground truth is still unknown. It is possible that self-reported alcohol use was underreported in our study due to financial motivations; however, compensation during the CM period was based on biosensor data, rather than self-reported data, which may alleviate such motives. There was also a lack of variability and relatively narrow range in average number of drinks per day during the last 7 days of the CM period, which differed from the average number of drinks during the entire 30-day CM period, as participants tended to drink less toward the end of the period. A sensitivity analysis including average number of drinks during the last 14 days of CM showed different results for the correlation analysis (there was a significant correlation) but similar results for the linear regression model.
Evaluating TAC-AUC collected through a new-generation, wrist-worn biosensor (e.g., BACtrack Skyn) is warranted, as these devices are more user-friendly, less stigmatizing, and may be less expensive than the SCRAM-CAM (Wang et al., 2021). In conjunction with PEth, which allows for longer intervals between visits than other biomarkers, increasingly user-friendly interventions can be developed.
In conclusion, change in average daily TAC-AUC was significantly associated with change in PEth and change in average daily number of self-reported drinks. Change in PEth was also significantly associated with change in average daily number of self-reported drinks. As all measures were significantly associated with one another, they appear to be concurrently valid and may be appropriate for measuring changes in alcohol use in a CM intervention.
Public Health Significance.
Objective measures of change in alcohol consumption could be important to complement information collected from self-report. Change in alcohol concentration measured through the skin (biosensor-measured transdermal alcohol concentration; TAC), change in phosphatidylethanol (PEth; a blood biomarker of alcohol), and change in number of self-reported drinks were significantly associated with one another while controlling for baseline values. TAC and PEth may be appropriate compliments to self-reported data, but not a replacement as there is currently no method other than self-report to obtain quantities of alcohol use (i.e., number of drinks).
Acknowledgments
Robert L. Cook received funding from Grants U01 AA020797 and P01 AA029543 from the National Institute on Alcohol Abuse and Alcoholism. Robert F. Leeman received funding from Grant UH3 AA02614 from the National Institute on Alcohol Abuse and Alcoholism. Veronica L. Richards received funding from Grant T32 DA017629 from the National Institute on Drug Abuse. The funding source had no other role other than financial support. The authors have no conflicts of interest to report.
Footnotes
All authors contributed in a significant way to the article and all authors have read and approved the final article.
Data, study materials, and analysis code can be made available by contacting the corresponding author. This study was not preregistered.
References
- Aradottir S, Asanovska G, Gjerss S, Hansson P, & Alling C (2006). Phosphatidylethanol (PEth) concentrations in blood are correlated to reported alcohol intake in alcohol-dependent patients. Alcohol and Alcoholism, 41(4), 431–437. 10.1093/alcalc/agl027 [DOI] [PubMed] [Google Scholar]
- Barnett NP, Celio MA, Tidey JW, Murphy JG, Colby SM, & Swift RM (2017). A preliminary randomized controlled trial of contingency management for alcohol use reduction using a transdermal alcohol sensor. Addiction, 112(6), 1025–1035. 10.1111/add.13767 [DOI] [PMC free article] [PubMed] [Google Scholar]
- Barnett NP, Meade EB, & Glynn TR (2014). Predictors of detection of alcohol use episodes using a transdermal alcohol sensor. Experimental and Clinical Psychopharmacology, 22(1), 86–96. 10.1037/a0034821 [DOI] [PMC free article] [PubMed] [Google Scholar]
- Barnett NP, Souza T, Glynn T, Luczak S, Swift R, & Rosen I (2015). The transdermal alcohol sensor macro (TASMAC): A rapid data processing tool for use with the SCRAMx alcohol sensor: 726. Alcoholism: Clinical and Experimental Research, 39, 12A–249A. 10.1111/acer.12741 [DOI] [Google Scholar]
- Barnett NP, Tidey J, Murphy JG, Swift R, & Colby SM (2011). Contingency management for alcohol use reduction: A pilot study using a transdermal alcohol sensor. Drug and Alcohol Dependence, 118(2–3), 391–399. 10.1016/j.drugalcdep.2011.04.023 [DOI] [PMC free article] [PubMed] [Google Scholar]
- Castro-Schilo L, & Grimm KJ (2018). Using residualized change versus difference scores for longitudinal research. Journal of Social and Personal Relationships, 35(1), 32–58. 10.1177/0265407517718387 [DOI] [Google Scholar]
- Davis CG, Thake J, & Vilhena N (2010). Social desirability biases in self-reported alcohol consumption and harms. Addictive Behaviors, 35(4), 302–311. 10.1016/j.addbeh.2009.11.001 [DOI] [PubMed] [Google Scholar]
- Davis-Martin RE, Alessi SM, & Boudreaux ED (2021). Alcohol use disorder in the age of technology: A review of wearable biosensors in alcohol use disorder treatment. Frontiers in Psychiatry, 12, Article 642813. 10.3389/fpsyt.2021.642813 [DOI] [PMC free article] [PubMed] [Google Scholar]
- Dougherty DM, Charles NE, Acheson A, John S, Furr RM, & Hill-Kapturczak N (2012). Comparing the detection of transdermal and breath alcohol concentrations during periods of alcohol consumption ranging from moderate drinking to binge drinking. Experimental and Clinical Psychopharmacology, 20(5), 373–381. 10.1037/a0029021 [DOI] [PMC free article] [PubMed] [Google Scholar]
- Dougherty DM, Hill-Kapturczak N, Liang Y, Karns TE, Cates SE, Lake SL, Mullen J, & Roache JD (2014). Use of continuous transdermal alcohol monitoring during a contingency management procedure to reduce excessive alcohol use. Drug and Alcohol Dependence, 142, 301–306. 10.1016/j.drugalcdep.2014.06.039 [DOI] [PMC free article] [PubMed] [Google Scholar]
- Dougherty DM, Hill-Kapturczak N, Liang Y, Karns TE, Lake SL, Cates SE, & Roache JD (2015). The potential clinical utility of transdermal alcohol monitoring data to estimate the number of alcoholic drinks consumed. Addictive Disorders & Their Treatment, 14(3), 124–130. 10.1097/ADT.0000000000000060 [DOI] [PMC free article] [PubMed] [Google Scholar]
- Dougherty DM, Karns TE, Mullen J, Liang Y, Lake SL, Roache JD, & Hill-Kapturczak N (2015). Transdermal alcohol concentration data collected during a contingency management program to reduce at-risk drinking. Drug and Alcohol Dependence, 148, 77–84. 10.1016/j.drugalcdep.2014.12.021 [DOI] [PMC free article] [PubMed] [Google Scholar]
- Fairbairn CE, & Kang D (2019). Temporal dynamics of transdermal alcohol concentration measured via new-generation wrist-worn biosensor. Alcoholism: Clinical and Experimental Research, 43(10), 2060–2069. 10.1111/acer.14172 [DOI] [PMC free article] [PubMed] [Google Scholar]
- Greenfield TK, Bond J, & Kerr WC (2014). Biomonitoring for improving alcohol consumption surveys: The new gold standard? Alcohol Research : Current Reviews, 36(1), 39–45. [PMC free article] [PubMed] [Google Scholar]
- Greenfield TK, & Kerr WC (2008). Alcohol measurement methodology in epidemiology: Recent advances and opportunities. Addiction, 103(7), 1082–1099. 10.1111/j.1360-0443.2008.02197.x [DOI] [PMC free article] [PubMed] [Google Scholar]
- Hahn JA, Anton RF, & Javors MA (2016). The formation, elimination, interpretation, and future research needs of phosphatidylethanol for research studies and clinical practice. Alcoholism: Clinical and Experimental Research, 40(11), 2292–2295. 10.1111/acer.13213 [DOI] [PMC free article] [PubMed] [Google Scholar]
- Hahn JA, Murnane PM, Vittinghoff E, Muyindike WR, Emenyonu NI, Fatch R, Chamie G, Haberer JE, Francis JM, Kapiga S, Jacobson K, Myers B, Couture MC, DiClemente RJ, Brown JL, So-Armah K, Sulkowski M, Marcus GM, Woolf-King S, … Saitz R (2021). Factors associated with phosphatidylethanol (PEth) sensitivity for detecting unhealthy alcohol use: An individual patient data meta-analysis. Alcoholism: Clinical and Experimental Research, 45(6), 1166–1187. 10.1111/acer.14611 [DOI] [PMC free article] [PubMed] [Google Scholar]
- Harris JC, Leggio L, & Farokhnia M (2021). Blood biomarkers of alcohol use: A scoping review. Current Addiction Reports, 8(4), 500–508. 10.1007/s40429-021-00402-7 [DOI] [PMC free article] [PubMed] [Google Scholar]
- Helander A, Böttcher M, Dahmen N, & Beck O (2019). Elimination characteristics of the alcohol biomarker phosphatidylethanol (PEth) in blood during alcohol detoxification. Alcohol and Alcoholism, 54(3), 251–257. 10.1093/alcalc/agz027 [DOI] [PMC free article] [PubMed] [Google Scholar]
- Helander A, Hermansson U, & Beck O (2019). Dose-response characteristics of the alcohol biomarker phosphatidylethanol (PEth)-a study of outpatients in treatment for reduced drinking. Alcohol and Alcoholism, 54(6), 567–573. 10.1093/alcalc/agz064 [DOI] [PubMed] [Google Scholar]
- Litten RZ, Bradley AM, & Moss HB (2010). Alcohol biomarkers in applied settings: Recent advances and future research opportunities. Alcoholism: Clinical and Experimental Research, 34(6), 955–967. 10.1111/j.1530-0277.2010.01170.x [DOI] [PubMed] [Google Scholar]
- Marcus GM, Vittinghoff E, Whitman IR, Joyce S, Yang V, Nah G, Gerstenfeld EP, Moss JD, Lee RJ, Lee BK, Tseng ZH, Vedantham V, Olgin JE, Scheinman MM, Hsia H, Gladstone R, Fan S, Lee E, Fang C, … Hahn JA (2021). Acute consumption of alcohol and discrete atrial fibrillation events. Annals of Internal Medicine, 174(11), 1503–1509. 10.7326/M21-0228 [DOI] [PubMed] [Google Scholar]
- McDonell MG, Skalisky J, Leickly E, Orr MF, McPherson S, Roll J, Hill-Kapturczak N, & Javors M (2017). Pilot investigation of a phosphatidylethanol-based contingency management intervention targeting alcohol use. Psychology of Addictive Behaviors, 31(5), 608–613. 10.1037/adb0000293 [DOI] [PMC free article] [PubMed] [Google Scholar]
- McGinnis KA, Tate JP, Bryant KJ, Justice AC, O’Connor PG, Rodriguez-Barradas MC, Crystal S, Cutter CJ, Hansen NB, Maisto SA, Marconi VC, Williams EC, Cook RL, Gordon AJ, Gordon KS, Eyawo O, Edelman EJ, & Fiellin DA (2022). Change in alcohol use based on self-report and a quantitative biomarker, phosphatidylethanol, in people with HIV. AIDS and Behavior, 26(3), 786–794. 10.1007/s10461-021-03438-y [DOI] [PubMed] [Google Scholar]
- Richards VL, Liu Y, Orr J, Leeman RF, Barnett NP, Bryant K, Cook RL, & Wang Y (2021). Sociodemographic and clinical factors associated with transdermal alcohol concentration from the SCRAM biosensor among persons living with and without HIV. Alcoholism: Clinical and Experimental Research, 45(9), 1804–1811. 10.1111/acer.14665 [DOI] [PMC free article] [PubMed] [Google Scholar]
- Richards VL, Sajdeya R, Villalba K, Wang Y, Bryant V, Brumback B, Bryant K, Hahn JA, & Cook RL (2021). Secondary aanalysis of a randomized clinical trial of naltrexone among women living with HIV: Correlations between reductions in self-reported alcohol use and changes in phosphatidylethanol (PEth). Alcoholism: Clinical and Experimental Research, 45(1), 174–180. 10.1111/acer.14515 [DOI] [PMC free article] [PubMed] [Google Scholar]
- Russell MA, Turrisi RJ, & Smyth JM (2022). Transdermal sensor features correlate with ecological momentary assessment drinking reports and predict alcohol-related consequences in young adults’ natural settings. Alcoholism: Clinical and Experimental Research, 46(1), 100–113. 10.1111/acer.14739 [DOI] [PMC free article] [PubMed] [Google Scholar]
- Swift R (2003). Direct measurement of alcohol and its metabolites. Addiction, 98(Suppl. 2), 73–80. 10.1046/j.1359-6357.2003.00605.x [DOI] [PubMed] [Google Scholar]
- Viel G, Boscolo-Berto R, Cecchetto G, Fais P, Nalesso A, & Ferrara SD (2012). Phosphatidylethanol in blood as a marker of chronic alcohol use: A systematic review and meta-analysis. International Journal of Molecular Sciences, 13(11), 14788–14812. 10.3390/ijms131114788 [DOI] [PMC free article] [PubMed] [Google Scholar]
- Walther L, de Bejczy A, Löf E, Hansson T, Andersson A, Guterstam J, Hammarberg A, Asanovska G, Franck J, Söderpalm B, & Isaksson A (2015). Phosphatidylethanol is superior to carbohydrate-deficient transferrin and γ-glutamyltransferase as an alcohol marker and is a reliable estimate of alcohol consumption level. Alcoholism: Clinical and Experimental Research, 39(11), 2200–2208. 10.1111/acer.12883 [DOI] [PubMed] [Google Scholar]
- Wang Y, Fridberg DJ, Leeman RF, Cook RL, & Porges EC (2019). Wrist-worn alcohol biosensors: Strengths, limitations, and future directions. Alcohol, 81, 83–92. 10.1016/j.alcohol.2018.08.013 [DOI] [PMC free article] [PubMed] [Google Scholar]
- Wang Y, Fridberg DJ, Shortell DD, Leeman RF, Barnett NP, Cook RL, & Porges EC (2021). Wrist-worn alcohol biosensors: Applications and usability in behavioral research. Alcohol, 92, 25–34. 10.1016/j.alcohol.2021.01.007 [DOI] [PMC free article] [PubMed] [Google Scholar]
- Wurst FM, Thon N, Aradottir S, Hartmann S, Wiesbeck GA, Lesch O, Skala K, Wolfersdorf M, Weinmann W, & Alling C (2010). Phosphatidylethanol: Normalization during detoxification, gender aspects and correlation with other biomarkers and self-reports. Addiction Biology, 15(1), 88–95. 10.1111/j.1369-1600.2009.00185.x [DOI] [PubMed] [Google Scholar]