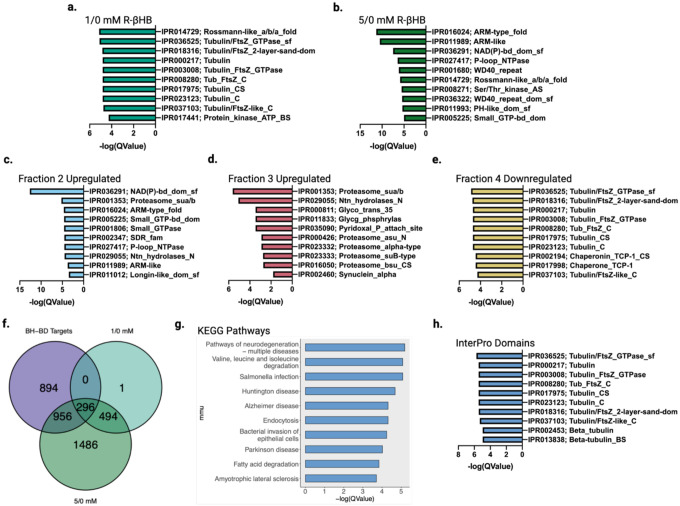
Fig. 6 |. β-hydroxybutyrate targets display common structural features and are cleared through protein degradation pathways.
a-e, Top 10 significantly enriched protein domains ranked by Q-value from (a) 1/0 mM R-βHB ex vivo upregulated proteins, (b) 5/0 mM R-βHB ex vivo upregulated proteins, (c) BH-BD/control fraction 2 upregulated proteins, (d) BH-BD/control fraction 3 upregulated proteins, and (e) BH-BD/control fraction 4 downregulated proteins. f, Venn diagram of BH-BD/control significantly upregulated proteins from all fractions crossed with upregulated proteins from 1/0 mM R-βHB and 5/0 mM R-βHB ex vivo proteomics groups, the 296 primary protein targets of R-βHB were calculated to have a p-value of 0.000001. g, Dotplot from clusterProfiler KEGG overrepresentation analysis on 296 primary protein targets of R-βHB from Fig. 6f. h, Top 10 significantly enriched protein domains ranked by Q-value from 296 primary protein targets of R-βHB from Fig. 6f.
f, p-value calculated using one-tailed probability test giving a z score = −54.4.

