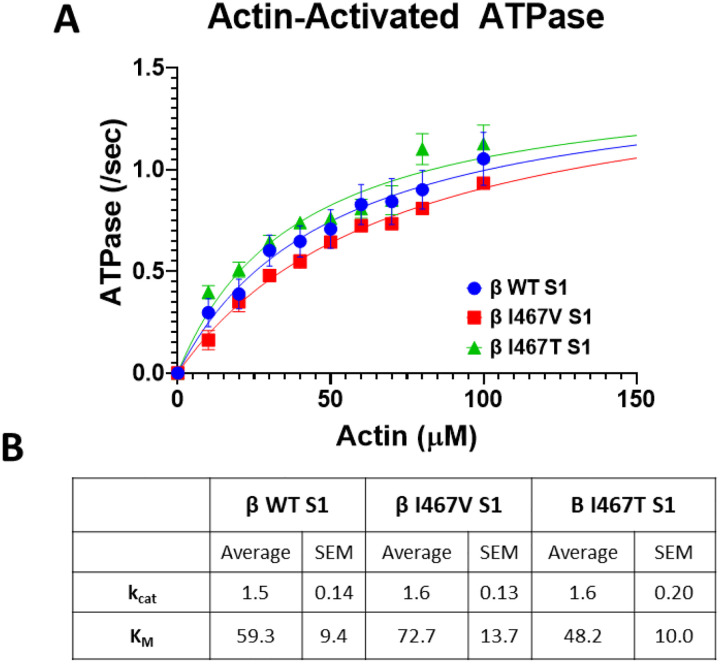
Figure 1. Actin-activated ATPase Activity of myosin constructs.
(A) ATPase activity of myosin S1 constructs was measured over time with increasing actin concentrations. Data points were fitted using Michaelis Menten kinetics to obtain maximum ATPase activity (kcat) and actin affinity (KM). (B) Measured values of kcat and KM for HCM-linked β-MHC I467V and LVNC-linked β-MHC I467T S1 mutations. Neither mutation significantly altered maximal ATPase activity nor actin affinity. Data are represented as mean ± SEM. A one-way ANOVA was used to assess statistical significance (p<0.05) compared to β-MHC WT S1. N=6–11 curves per myosin S1 construct.

