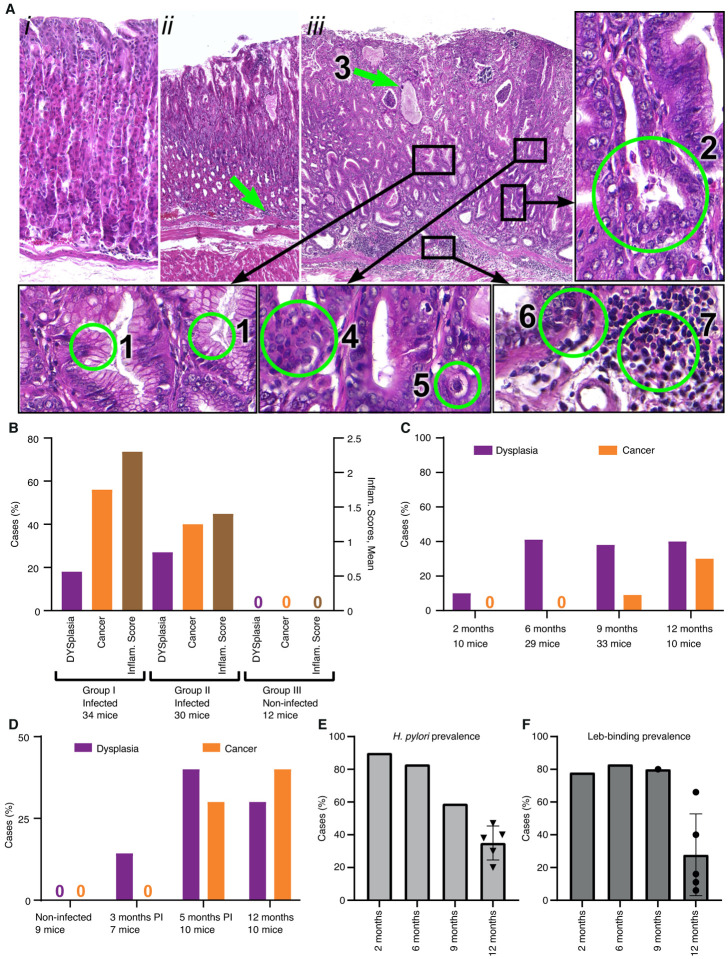
Figure 3. The Leb-mouse gastric cancer animal model.
(A) The histopathology of the gastric cancer Leb-mouse model was evaluated by H&E-stained sections and blind scoring at the 12-month endpoint according to established criteria43. The mucosal inflammatory infiltration scoring is described in Figure S3. (i) A non-infected mouse (Group III, no. 2–2, Table S3C) with no metaplastic or dysplastic changes and no inflammatory infiltration (scored 0). (ii) An infected mouse (Group 1; no. 1–17, Table S3A) with no metaplastic or dysplastic changes but with a score of 2 for inflammatory infiltration (green arrow). (iii) An infected mouse (Group II; no. 1–5, Table S3B) with intestinal metaplasia and numerous goblet cells (1), deformed and branched gastric glands (2), glands with mucus-filled cysts (green arrow, 3), dysplastic glands thickened with layers of nuclei, i.e., cell piling (4), low-grade cellular atypia (5), cancer with growth and penetration through the submucosal layer (6), and cancerous tissue characterized by massive inflammatory cell infiltration (7). Cancer with growth and penetration through the submucosal layer with invasion into the muscular layer is also illustrated in Figure S3iii.
(B) The Leb-mice were infected with the onco-strain USU101 in two subsequent 12-month periods. Group I included 34 infected mice, Group II included 30 infected mice, and Group III included 12 non-infected control mice. The left Y-axis shows the percentage of mice with dysplasia (lilac) or gastric cancer (orange). The right Y-axis shows the inflammatory infiltration score (brown) (Tables S3A–C).
(C) The incidence of dysplasia and gastric cancer in the Leb-mouse model after 2, 6, 9, and 12 months of H. pylori infection (Table S3D).
(D) The gastric cancer incidence at 12 months in response to antibiotic treatment and eradication of H. pylori infection. None of the non-infected mice or antibiotic-treated mice developed cancer at 3 months, and only 1 out of 7 of the treated mice developed dysplasia. In contrast, the mice eradicated of H. pylori infection developed similar levels of dysplasia and cancer at 5 months (22 weeks) as the mice that were not treated with antibiotics during the 40-week period (Table S3E).
(E) The H. pylori infection was found to be sTable in the mice during the first 6 months of chronic H. pylori infection, where the vast majority of Leb-mice were positive for H. pylori culture at 2 months (90%) and 6 months (83%) post-infection, with a ~40–50% reduction at 9 months and 12 months (from (C) and Table S3D). The 12-month median CFU prevalence of 38% refers to the 12-month infection tests (the non-vaccinated mice) in Figure 3B, 3C, 5B, and 5D (a total of 120 mice, Table S3F).
(F) The BabA-mediated Leb-binding of the H. pylori infection was found to be stable in the mice during the first 9 months of chronic H. pylori infection, where the vast majority, ~80%, of the cultured H. pylori from (E) exhibited preserved Leb-binding capacity (Table S3D). The 12-month median and mean Leb-binding prevalence, 16% and 28%, respectively, refers to the series of infection tests of the 120 mice described in (E) and Table S3F.

