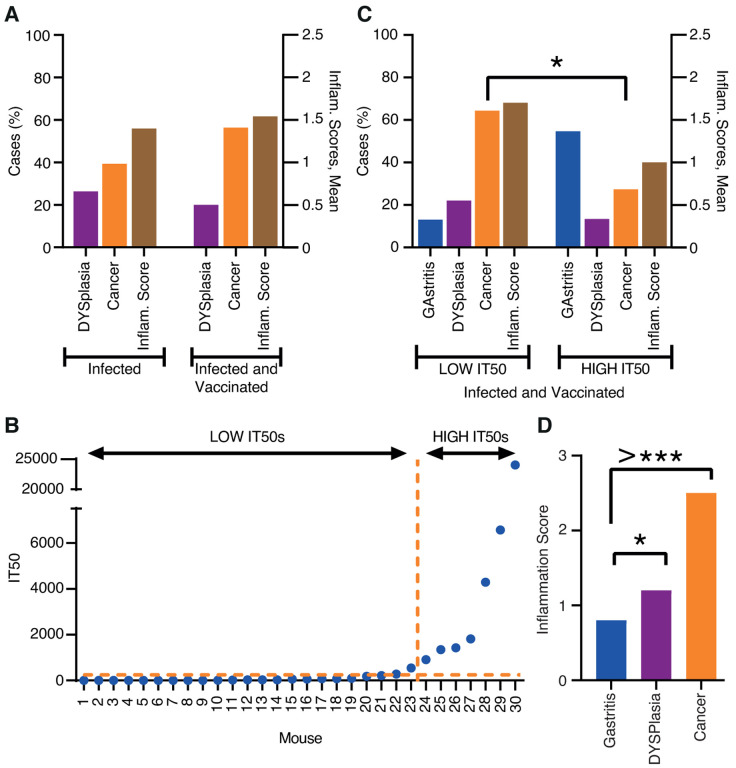
Figure 4. The first vaccination experiment induced protection against inflammation and cancer.
(A) Two groups, each with 30 Leb-mice, were infected with the onco-strain USU101. One group was therapeutically vaccinated one month later, and all mice were evaluated at the 12-month endpoint. The left Y-axis shows the percentage of mice with dysplasia (lilac) or gastric cancer (orange). The right Y-axis shows the inflammatory infiltration (brown).
(B) The 30 immunized mice presented in increasing order of IT50, which made a natural divider of the two groups at IT50 = ~1000 i.e., LOW IT50 vs. HIGH IT50 mice (Table S4A). The horizontal hashed line indicates the mean background IT50 = <10 derived from the Group II USU101-infected but non-immunized animals (Table S3B).
(C) Incidence of gastric disease in the mice with LOW IT50 vs. HIGH IT50. The left Y-axis shows the percentage of mice with gastritis (blue) or dysplasia (lilac) or gastric cancer (orange). The right Y-axis shows the inflammatory infiltration (brown) (Table S4A).
(D) The inflammation infiltration score was only 0.8 for gastritis, but increased to 1.2 for dysplasia (p = 0.05*) and almost doubled to 2.5 for the mice with gastric cancer (p = 0.00000000005) (Table S4C).

