Abstract
Obesity is a global epidemic leading to increased mortality and susceptibility to comorbidities, with few viable therapeutic interventions. A hallmark of disease progression is the ectopic deposition of lipids in the form of lipid droplets in vital organs such as the liver. However, the mechanisms underlying the dynamic storage and processing of lipids in peripheral organs remain an outstanding question. Here, we show an unexpected function for the major cap-binding protein, eIF4E, in high-fat-diet-induced obesity. In response to lipid overload, select networks of proteins involved in fat deposition are altered in eIF4E-deficient mice. Specifically, distinct messenger RNAs involved in lipid metabolic processing and storage pathways are enhanced at the translation level by eIF4E. Failure to translationally upregulate these mRNAs results in increased fatty acid oxidation, which enhances energy expenditure. We further show that inhibition of eIF4E phosphorylation genetically—and by a potent clinical compound—restrains weight gain following intake of a high-fat diet. Together, our study uncovers translational control of lipid processing as a driver of high-fat-diet-induced weight gain and provides a pharmacological target to treat obesity.
Diet-induced obesity has become an epidemic worldwide, as nearly 40% of all adults globally are overweight or obese1,2. Obesity is defined as a state of excess fat deposition as a consequence of an increase in calories over energy expended over time. After feeding, lipids and carbohydrates are converted to neutral lipids as the rate of fatty acid synthesis is increased. It has been shown that an abundance of dietary fats, over carbohydrates or protein, plays the leading role in regulation of diet-induced obesity3. Thus, lipids are the main fuel source for energy supply and are synthesized for packaging when in excess. An imbalance between lipid storage, as triglyceride in lipid droplets, and fatty acid breakdown, mainly via fatty acid β-oxidation, can result in an increase in aberrant fat deposition leading to metabolic syndromes. It is therefore imperative to understand the molecular mechanisms that govern these lipid homeostasis pathways and to find therapeutic approaches to treat obesity-related diseases.
One of the main features associated with obesity is an excess of neutral fats within cytoplasmic lipid droplets (LDs), which contain mainly triglycerides and sterol esters as well as several lipid-droplet-binding proteins4,5. The growth and catabolism of LDs in the cell are tightly coupled to energy metabolism and cell signalling, and can therefore be critical to disease states. Indeed, dysfunctional lipid handling and excess LDs are associated with metabolic diseases including obesity, type 2 diabetes, non-alcoholic fatty liver and various obesity-induced cancers5–10. Conversely, a decrease in lipid synthesis and storage leads to an increase in the concentration of free fatty acids. This can create an increased rate of cellular fatty acid uptake and oxidation for utilization as a main energy source. Enhanced fatty acid β-oxidation is thus promoted to maintain physical fitness and has been shown to improve endurance training for athletes11. Therefore, understanding the cross-regulation between lipid processing and metabolism can create a unique therapeutic window to treat obesity-related diseases for improved lipid metabolism. Here,we pinpoint a surprising function for gene regulation at the step of translational control in obesity-associated lipid processing, breakdown, storage and LD growth.
Results
eIF4E+/− mice are resistant to diet-induced obesity.
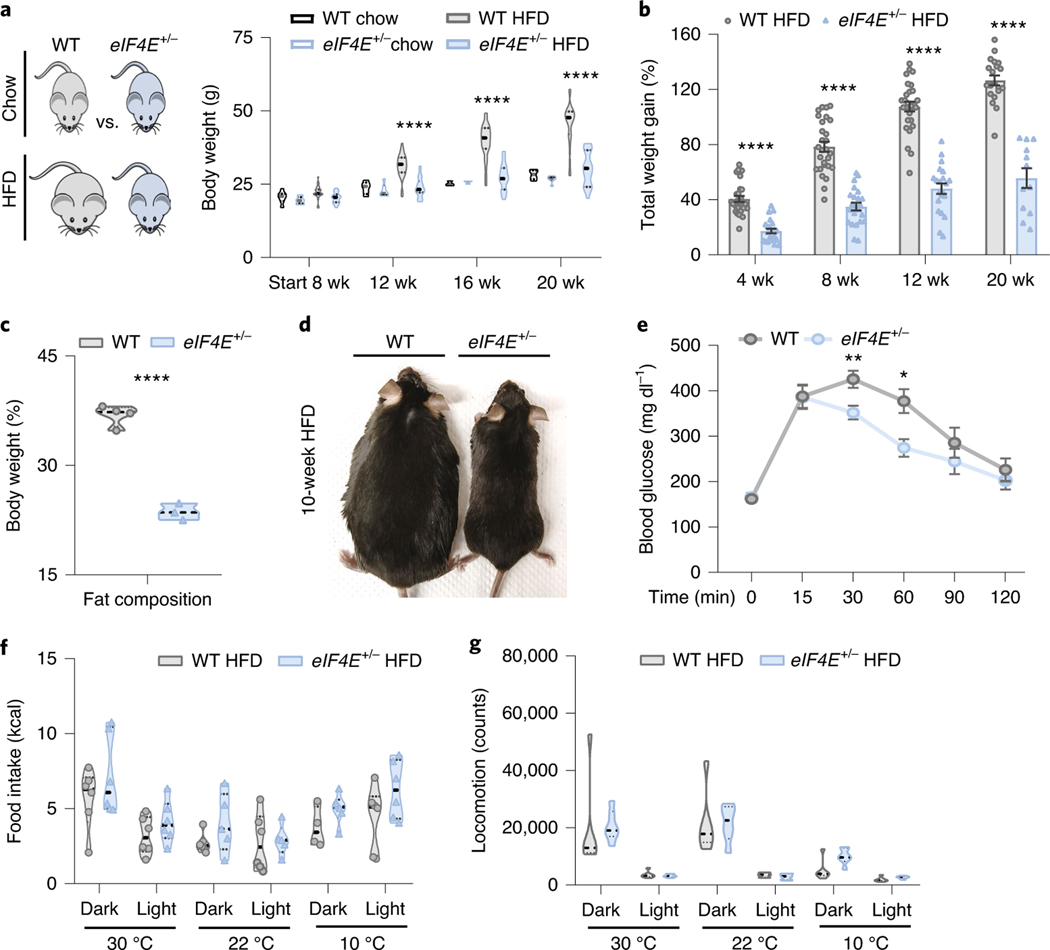
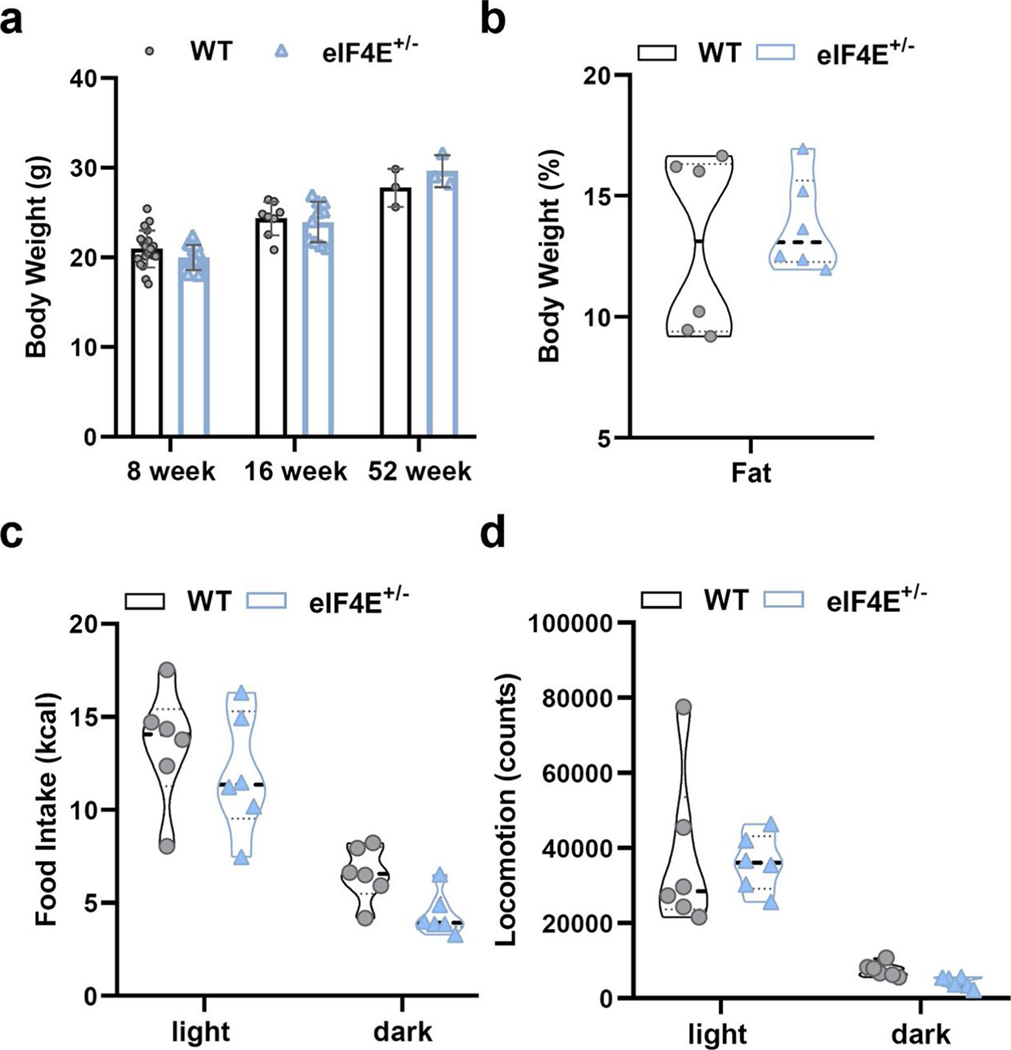
eIF4E is the major cap-binding protein that binds to the 5′ cap of all eukaryotic messenger RNAs to promote protein synthesis. However, it is believed that particular features of select mRNAs such as 5′ untranslated region (UTR) length, structure or sequence render such transcripts sensitive to eIF4E dose. We previously showed that, surprisingly, reduction of the dose of eIF4E in vivo does not affect global protein synthesis and cellular homeostasis12. On the contrary, eIF4E dose becomes rate limiting and critical for the translation of unique networks of mRNAs following selective stress conditions such as those downstream of oncogenic signalling12. On a regular chow diet, mice heterozygous for Eif4e (eIF4E+/− mice) do not display any overt phenotype during their lifespan12 and maintain the same overall body weight, with fat composition comparable to that of wild-type (WT) mice (Fig. 1a and Extended Data Fig. 1a,b). In asking what benefit an abundance of eIF4E may normally provide at the organismal level, we examined the role of eIF4E and cap-dependent translational control in response to metabolic stress.
Fig. 1 |. eIF4E is required for HFD-induced obesity.
a, Body weight of WT and eIF4E+/− C57BL/6 J male mice on normal chow diet or HFD for the times indicated; HFD started at 8 weeks (wk) as noted (n = 14, 14, respectively (for 8-week chow cohorts), n = 6, 6 (for 12-, 16- and 20-week chow cohorts). n = 28 (WT HFD), n = 22 (eIF4E+/− HFD); ****P < 0.0001, two-way ANOVA). b, Body weight gain, relative to starting weight, for WT and eIF4E+/− C57BL/6 J male mice on HFD for the times indicated (n = 19–28, 12–22; ****P < 0.0001, multiple t-tests). c, Contribution of fat to body weight (%) from echoMRI based on mouse total body weight for individual mice on HFD for 10 weeks (n = 4, 3; ****P < 0.00005, unpaired two-sided Student’s t-test). d, Representative WT and eIF4E+/− male mice after 10 weeks on HFD, e, Blood glucose tolerance test in WT and eIF4E+/− mice on HFD for 20 weeks (n = 7, 6; **P = 0.007, *P = 0.013, unpaired two-sided Student’s t-test). f, Monitored food intake of HFD in mice over 3 days at the indicated temperatures (n = 6, 6). g, Monitored movement of mice on HFD over 24 h (n = 6, 6). For violin plots, all data are shown with median dashed black line indicating independent biological replicates. For line and bar graphs, all values represent mean ± s.e.m. of independent biological replicates.
Initially we challenged eIF4E+/− mice with a high-fat diet (HFD, 60% of total calories from fat), which leads to obesity and metabolic syndrome in WT mice3,13. Unexpectedly, eIF4E+/− mice gained significantly less weight than their WT littermates after only 4 weeks on HFD (Fig. 1b). By 20 weeks on HFD, WT mice had more than doubled their body weight while eIF4E+/− mice continued to resist HFD-induced obesity and showed weight gain similar to that of age-matched controls on normal chow diet (Fig. 1a,b). Consistent with these findings, eIF4E+/− mice showed a lower fat composition than WT mice (Fig. 1c,d) and exhibited improved glucose tolerance (Fig. 1e). These findings were quite striking and independent of calorie intake and expenditure, because eIF4E+/− mice showed no alteration in food intake or locomotion (Fig. 1f,g and Extended Data Fig. 1c,d).
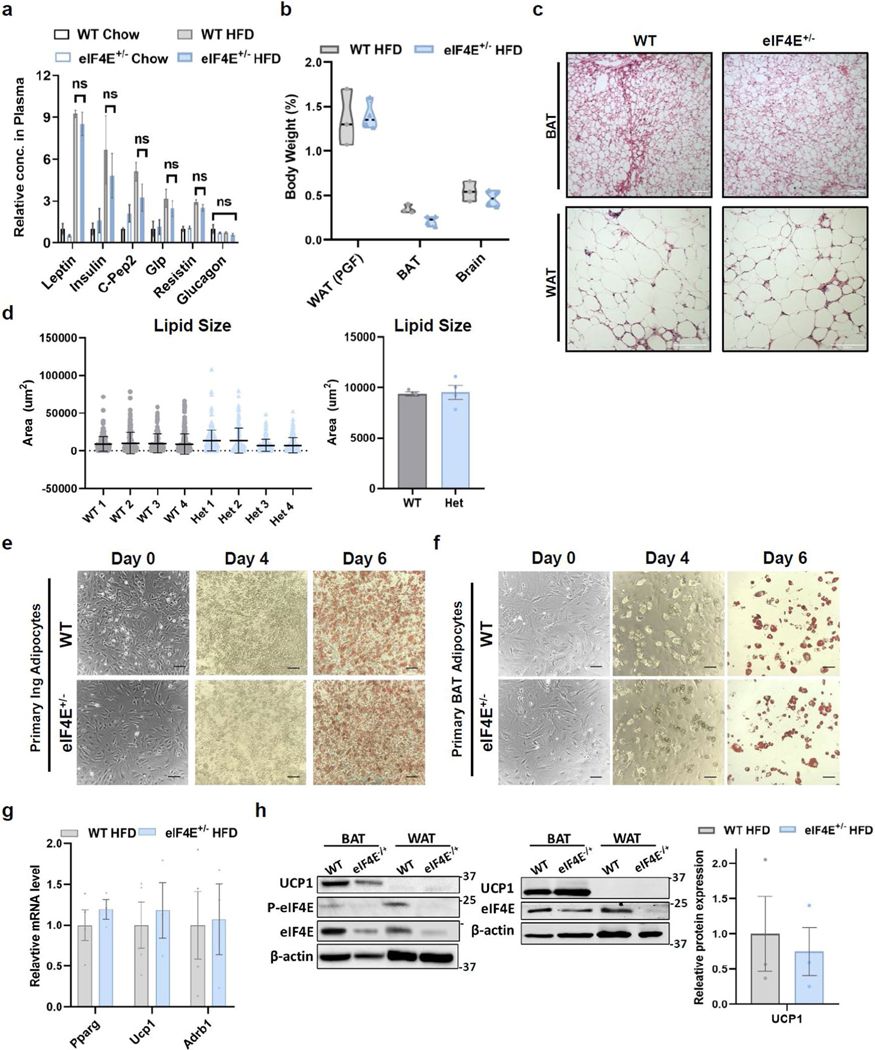
Interestingly, mice mutant for eIF4E inhibitor proteins—eIF4E-binding proteins 1 and 2 (4EBP1/2) downstream of mammalian target of rapamycin (mTOR) signalling—have been shown to regulate adipogenesis and circulating leptin levels, resulting in increased feeding and obesity phenotypes14–16. Having observed no alterations in food intake (Fig. 1f), we examined metabolic circulatory hormones that might augment feeding or response to diet. Leptin was significantly increased following induction of HFD, but there was no change in eIF4E+/− mice (Extended Data Fig. 2a). Furthermore, additional metabolic hormones known for their roles in insulin production or resistance remained unaltered (insulin, c-pep2, glp, glucagon and resistin) (Extended Data Fig. 2a). Therefore, we next directly evaluated the role of eIF4E expression on fat tissue and for potential roles in adipogenesis. Although both gonadal white adipose tissue (WAT) and brown adipose tissue (BAT) in eIF4E+/− mice on HFD were indeed of lower mass than in their WT littermates, relative tissue weights per animal size remained comparable (Extended Data Fig. 2b). In regard to LD, accumulation and size within both tissues also remained comparable (Extended Data Fig. 2c,d). We then isolated primary WAT or BAT tissue to culture and stimulate for lipid differentiation, and found that adipogenesis also remained unperturbed in eIF4E+/− mice (Extended Data Fig. 2e,f). Furthermore, genes regulating lipid biogenesis, as well as those important for ‘browning’ of WAT, an effect that increases the metabolic rate of WAT, were also examined and we observed no changes based on eIF4E dose (Extended Data Fig. 2g,h). Altogether, our data suggest that a distinct underlying mechanism outside of adipose tissue is important for HFD-induced obesity through eIF4E.
eIF4E dose alters lipid processing in the liver during HFD-induced obesity.
Prominent features of diet-induced obesity include increased fat deposits, as well as improper lipid deposition in other tissues17. As a central regulator of metabolic homeostasis, the liver orchestrates lipoprotein formation and transportation, as well as for lipid oxidation to produce energetic metabolites for other tissues17,18. Notably, eIF4E+/− mice exhibited a significantly smaller liver than WT mice on HFD (Fig. 2a). This correlates with lower lipid accumulation within the liver of eIF4E+/− mice, also evident by Oil red O staining (Fig. 2b,c). Morphometric analysis revealed that LD size within the liver of eIF4E+/− mice was markedly smaller than that in WT mice, and the former likewise had a lower steatosis grade—a scoring for abnormal lipid retention leading to fatty liver (Fig. 2d). The progression of fat accumulation to liver disease is termed non-alcoholic fatty liver disease (NAFLD), and is increasing with an estimated prevalence of 25% worldwide6. NAFLD covers a spectrum of conditions, ranging from excess of stored triglycerides in hepatic LD to more serious progression to non-alcoholic steatohepatitis, cirrhosis and hepatocellular carcinoma6,17,18. To assess liver disease, histological examination was performed on sections from mice on prolonged HFD (up to 40 weeks). NAFLD activity score (NAS) was significantly enhanced in WT versus eIF4E+/− mice on HFD (Fig. 2e). Together, these findings suggest that reduction in eIF4E protects mice from diet-induced obesity, including optimal lipid processing in the liver to prevent disease progression.
Fig. 2 |. Fatty liver development and pathway analysis through eIF4E during HFD.
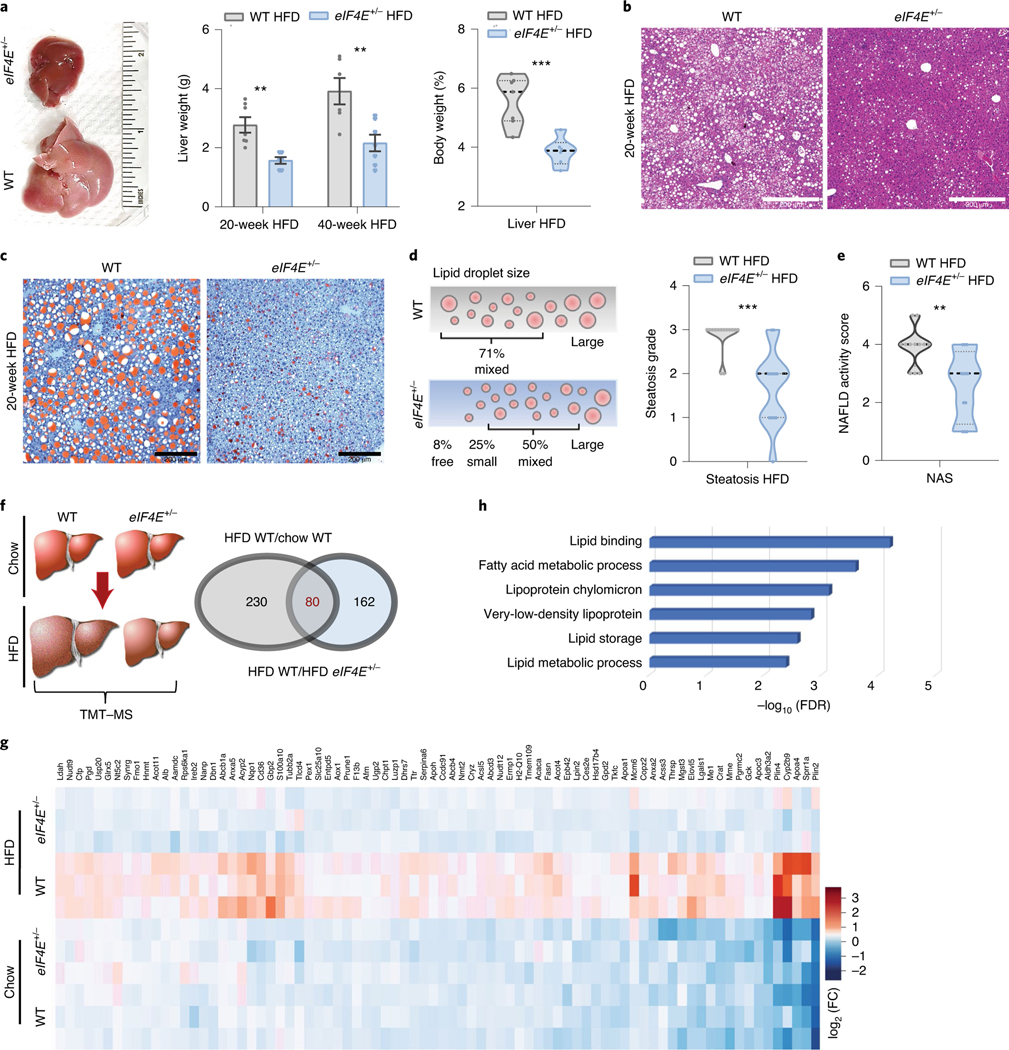
a, Left: representative WT and eIF4E+/− dissected livers after 10 weeks on HFD. Middle: liver weight (g) from mice after 20 weeks or an extended 40 weeks on HFD (n = 6, 6, respectively; **P < 0.006). Right, liver weight as percentage of body weight from mice on HFD (n = 12 of each; ***P < 0.001, unpaired two-sided Student’s t-test). b,c, H&e (b) and Oil red O (c) staining of liver tissue sections from mice on 20-week HFD, reviewed in six mice per genotype; scale bars, 200 μm. d,e, Lipid droplet size (as percentage, d) based on pathologist scoring with steatosis grading and NAFLD activity score (e); n = 12 of each; ***P = 0.0001, **P = 0.0023, unpaired two-sided Student’s t-test). f, Left: schematic depicting four conditions in liver samples submitted for TMT–MS. Right: Venn diagram highlighting significantly upregulated proteins (230 + 80) in WT livers on HFD (FDR < 0.05) compared to those on chow (HFD WT/chow WT), and significantly upregulated proteins (162 + 80) in WT livers on HFD compared with eIF4E+/− livers on HFD (HFD WT/HFD eIF4E+/−), with an overlap of 80 proteins. g, Heat map depicting relative expression of 80 proteins significantly upregulated in WT HFD livers, denoted by colour-coded log2(fold change) (log2(FC)) across biological triplicates of WT and eIF4E+/− livers on regular chow or HFD (n = 3 per group of independent biological replicates). h, Top significantly enriched GO term processes from gene enrichment analysis on proteins within g, graphed by P value. For violin plots, all data are shown with median dashed black line and upper/lower quartiles as light grey lines on independent biological replicates. For bar graphs, values represent the mean ± s.e.m. of independent biological samples.
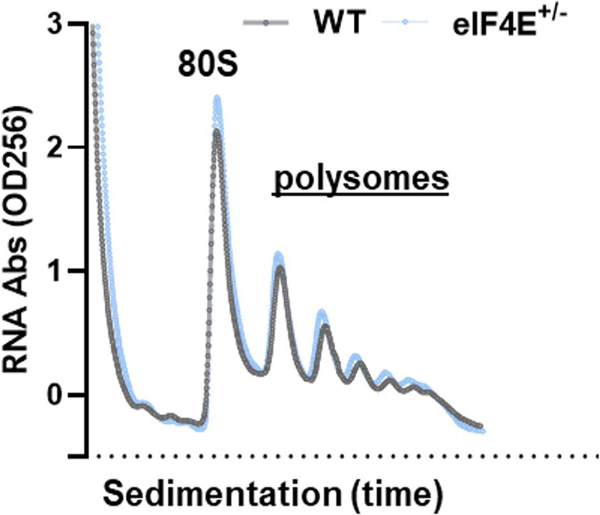
To understand the role of eIF4E in obesity and lipid metabolism, we first focused on assessment of overall protein synthesis in the liver under HFD. eIF4E+/− mice do not display global alterations in protein synthesis during HFD, as observed by a comparable global polysome/monosome ratio using sucrose gradient fractionation (Extended Data Fig. 3). To gain insight into downstream targets of eIF4E, we compared WT and eIF4E+/− livers under regular chow or HFD with unbiased quantitative proteomics analysis using tandem mass tag labelling–mass spectrometry (TMT–MS) (Fig. 2f). Out of nearly 5,680 proteins identified, 310 were significantly increased in WT mice following HFD in comparison to regular chow (Fig. 2f and Supplementary Table 1). Among these 310 proteins, 80 failed to be upregulated in the liver of eIF4E+/− mice and were significantly lower than in WT mice on HFD (Fig. 2f and Supplementary Table 2) (false discovery rate (FDR) < 0.05). Notably, these changes in eIF4E-dependent regulation of protein expression occurred mainly during diet-induced obesity and not under normal chow (Fig. 2g). Functional annotation analysis identified that these 80 proteins are mainly enriched in lipid metabolic pathways involved in fatty acid processing and storage pathways (Fig. 2h and Supplementary Table 3). These proteins influence numerous aspects of lipid transport and storage, including fatty acid uptake (CD36), lipid elongation (ELOVL5), triglyceride synthesis (LPIN2), lipoprotein formation and transportation (APOC3 and APOH) and perilipin 2 (PLIN2), which facilitates the final step of lipid storage into LD growth19. Together our proteomic data indicate that a multitude of proteins involved in lipid processing and storage may contribute to the resistance of eIF4E+/− mice to diet-induced obesity.
eIF4E enhances translational regulation of select lipid-processing/storage proteins.
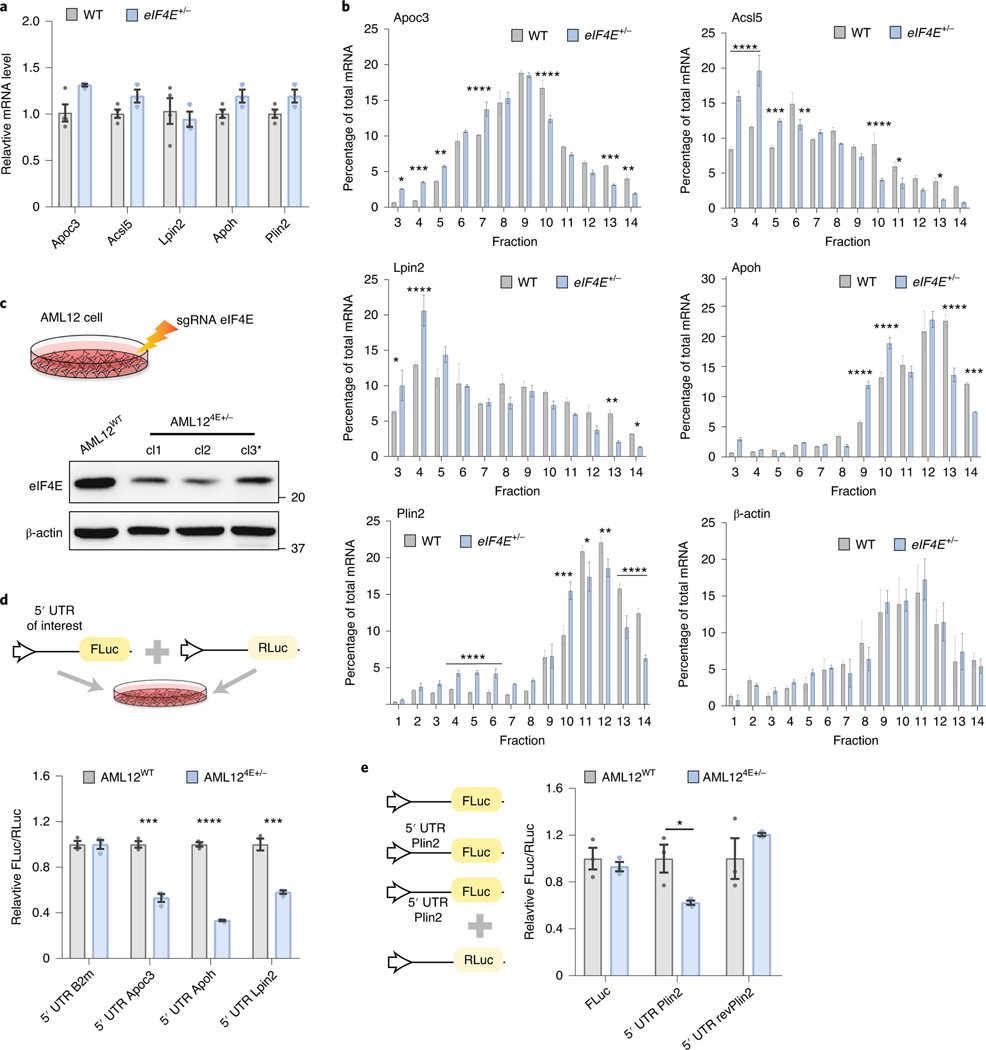
Lipid-processing proteins are notably enhanced by transcription factors such as peroxisome proliferator-activated receptor (PPAR) family members, yet it remains largely unknown whether their protein abundance is dynamically regulated post-transcriptionally following nutrient uptake. Although eIF4E probably alters many aspects of nutrient processing in vivo, from our mass spectrometry analysis it appears that proteins affecting lipid processes—including fatty acid metabolism and lipid storage during fat deposition—are enriched (Fig. 2h). We therefore examined translational regulation of genes enriched by eIF4E dose that were involved in functional lipid process/storage (Fig. 3a,b), and identified translational changes in relation to the eIF4E dose of genes, including fatty acid and lipid metabolic processing (Acsl5 and Lpin2), lipoprotein formation (Apoc3 and Apoh) and lipid storage (Plin2). Notably, the total transcript levels of these targets remained unchanged by eIF4E dose (Fig. 3a). To evaluate translation regulation of these mass spectrometry targets, we processed WT and eIF4E+/− livers from HFD-fed mice and performed sucrose gradient polysome profiling assays to separate mRNAs by the number of bound ribosomes, to measure the translation efficiency of specific transcripts. Specifically, for each gene we compared differences in the ratio of mRNA levels in heavy translationally active polysome fractions relative to total mRNA expression levels. We observed a significant shift in mRNAs in the eIF4E+/− HFD liver from heavy polysome fractions to lighter polysome fractions where transcripts are bound by fewer ribosomes, or to ribonucleoprotein fractions where mRNAs are not actively translated (Fig. 3b). Notably, this was specific to eIF4E-regulated mRNAs because control mRNAs such as β-actin showed comparable levels of translation in liver lysates (Fig. 3b). These results highlight that the increase of specific mRNAs involved in lipid metabolism pathways following HFD challenge is translationally regulated in an eIF4E-dependent manner.
Fig. 3 |. Translational control through eIF4E regulates lipid-processing/storage proteins.
a, qPCR analysis of relative mRNA levels of labelled transcripts in WT or eIF4E+/− livers on HFD for 20 weeks; β-actin was used as internal control (n = 4, 3 independent biological replicates). b, Representative qPCR analysis of labelled genes isolated from sucrose gradient fractions of WT or eIF4E+/− livers on HFD. Values correspond to the percentage of total mRNA across fractions where free ribosomal subunits correspond to lower fractions (<5), 80 S monosome or low polysome fractions 6–10, and high polysomes within fractions 11–14 (n = 3, 3 technical replicates; mean ± s.e.m., *P < 0.05, **P < 0.01, ***P < 0.05, ****P < 0.0001, by unpaired, two-tailed Student’s t-test). c, Schematic depicting AML12 cell lines that were electroporated with CRISPR/Cas9 and sgRNA targeting Eif4e. Three independent clones are depicted below, with representative immunoblots. *Clone 3 (cl3) was used for subsequent experiments. d, Schematic depicting dual-luciferase assay, with target 5′ UTR of interest upstream of FLuc and RLuc included as reference control. Top: relative dual-luciferase expression in relation to 5′ UTR of interest within AML12 cell lines; bottom: n = 3, 3 independent replicates; mean ± s.e.m., ***P < 0.002, ****P < 0.00001 versus control by unpaired, two-tailed Student’s t-test. e, Relative dual-luciferase expression in relation to reporter depicted within AML12 cell lines (n = 3, 3 independent replicates; mean ± s.e.m., *P = 0.035 versus control by unpaired, two-tailed Student’s t-test).
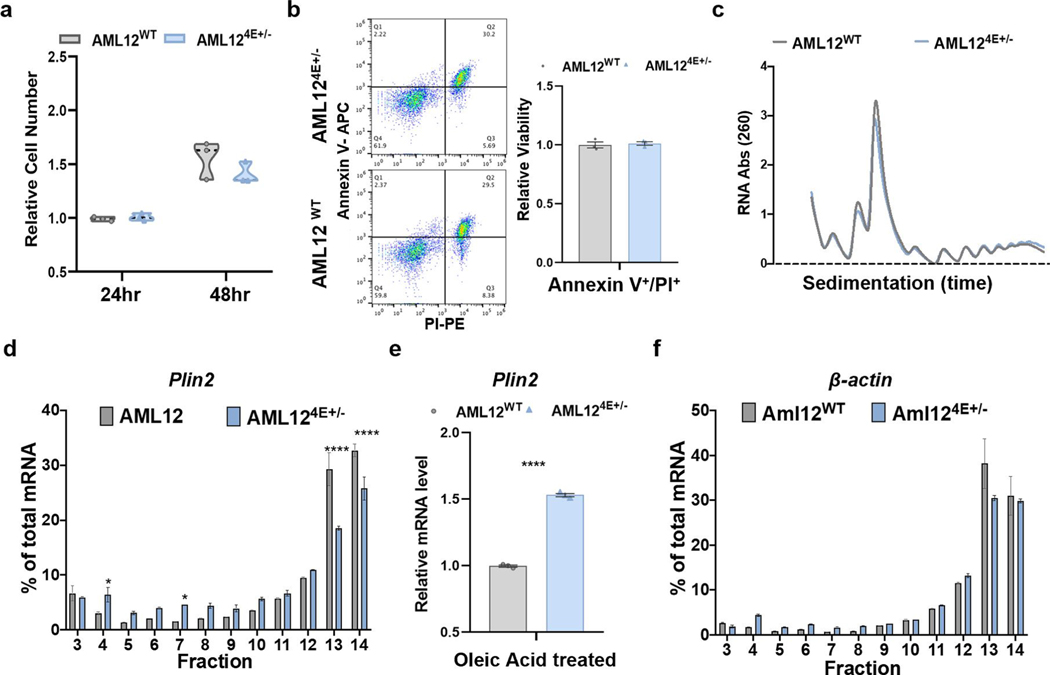
To further explore the functional role of eIF4E in regulation of proteins for lipid processing and storage, we genetically deleted one copy of eIF4E by clustered regularly interspaced short palindromic repeat (CRISPR)/Cas9 in AML12 cells, a well-established murine liver cell line widely used for studies on lipid metabolism20 (Fig. 3c). Similarly to our in vivo results, a 50% loss of eIF4E in AML12 hepatic cell lines resulted in no augmentation of cell growth, viability or global protein synthesis (Extended Data Fig. 4a–c). We further analysed the association of eIF4E-regulatory mRNAs with polysome fractions in cells following oleic acid treatment as a lipid stimulus, to assess potential translational differences between AML12WT and AML124E+/− cells. While control cells showed an accumulation of target mRNA Plin2 in heavy polysomes, this was shifted to low polysome and monosome fractions in AML124E+/− cells while an unregulated mRNA (β-actin) showed no alterations (Extended Data Fig. 4d–f). Notably, transcript levels remained unaltered.
We next examined the potential translational regulation of these lipid-processing and lipid-storage targets identified. The 5′ UTR sequence of individual mRNAs was cloned into a luciferase reporter (Fig. 3d). Importantly, the luciferase reporter assay demonstrated that the 5′ UTR of eIF4E target mRNAs, such as Apoh, Apoc3, Lpin2 and Plin2, is sufficient to confer translational sensitivity to eIF4E expression levels (Fig. 3d,e). Untargeted control 5′ UTRs from B2m and an inversion of the 5′ UTR of the eIF4E target Plin2 further restored translational differences conferred by eIF4E dose, highlighting the specificity of this regulation (Fig. 3d,e). Collectively these data demonstrate translational reprogramming, at least in part, through the 5′ UTR of genes involved in lipid metabolism that are reliant on the dose of eIF4E for their expression following lipid stimuli.
HFD dynamically enhances lipid processing for storage by eIF4E activity.
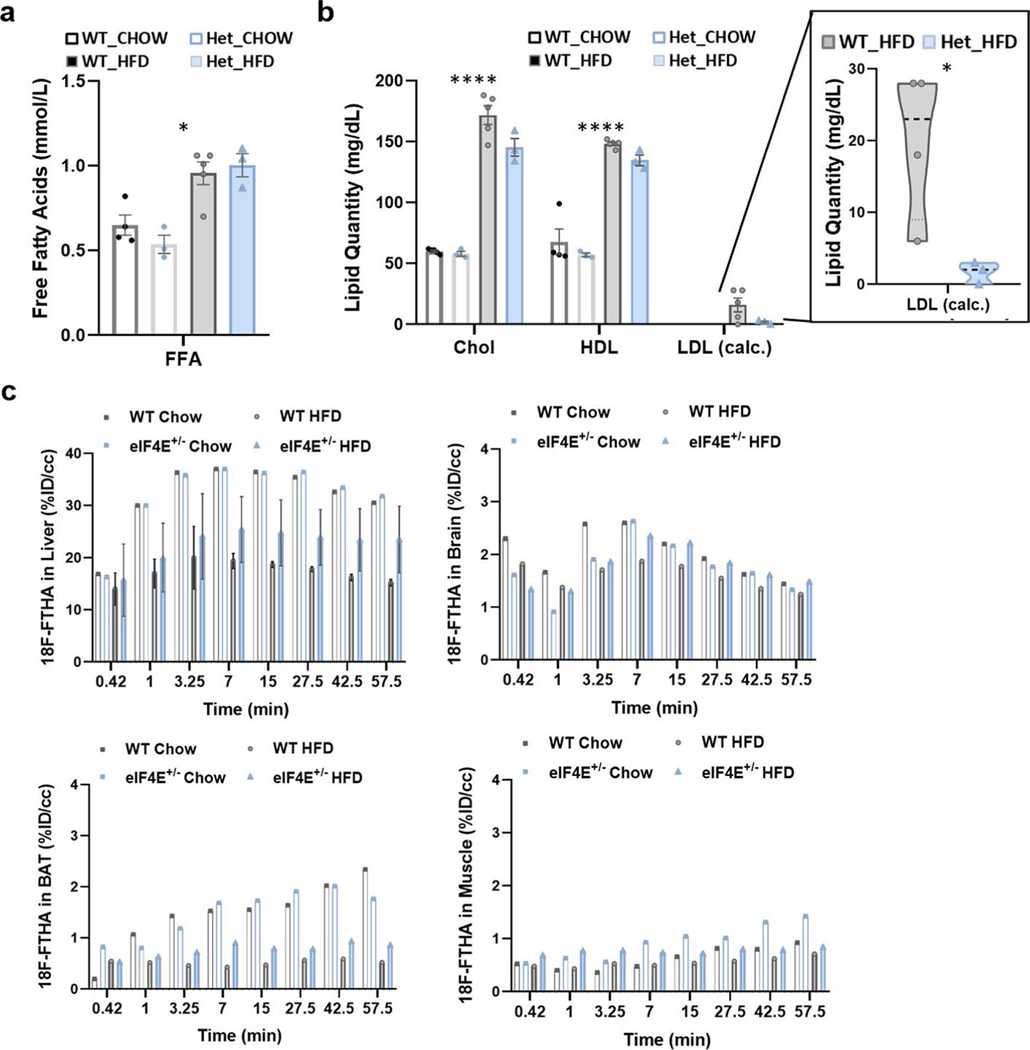
Following dietary intake, macromolecules such as lipids are broken into smaller components for absorption. We examined the levels of circulatory lipids in both WT and eIF4E+/− mice following 20 weeks on HFD, and observed that both free fatty acids and cholesterol were equivalently increased on HFD compared to normal chow diet (Extended Data Fig. 5a,b). Notably, circulatory high- and low-density lipoproteins were also increased by HFD although slightly decreased in eIF4E+/− mice (Extended Data Fig. 5b). These lipoproteins are synthesized in the liver by multiple proteins, including those already identified as translationally regulated through eIF4E (APOH, APOC3 and LPIN2). Together, these data show that circulatory lipids remain relatively unaffected by eIF4E dose, although lipid transport and export from the liver may be altered.
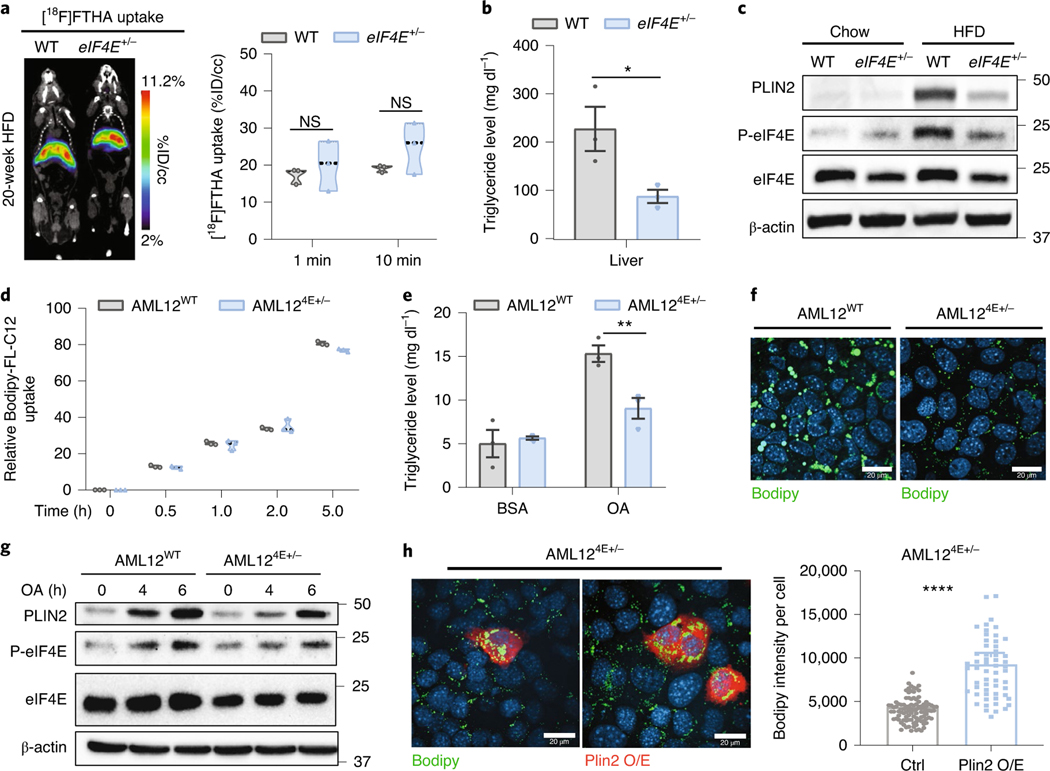
We next investigated the biodistribution of lipid uptake to major metabolic tissues in vivo using a radiolabelled fatty acid, [18F]FTHA. After entering the bloodstream, the majority of traced lipids accumulated in the liver within 10 min (Fig. 4a and Extended Data Fig. 5c) with minimal traces observed in other metabolic tissues, including femoral muscle, brown adipose and brain (Extended Data Fig. 5c). Accumulation of lipids in the liver was unaltered by eIF4E dose, despite the fact that we observed decreased fat deposition within eIF4E+/− liver tissue (Fig. 2b–d). We therefore directly measured neutral lipids that are stored (triglycerides) and observed a significant decrease in relation to eIF4E dose, which matched the lowered steatosis grade (Figs. 4b and 2d). This begged the important question: how are lipids utilized in eIF4E+/− mice fed HFD since they are imported but not stored?
Fig. 4 |. Dynamic lipid storage in liver cells in relation to eIF4E activity.
a, Representative [18F]FTHA in mice after 20 weeks on HFD, by PeT scan. Left: images were acquired by dynamic progression over 1 h; images taken over the first 1–10 min were overlayed after administration (percent injected dose per cubic centimeter (%ID/cc)). Right: average uptake is quantified based on dose per mouse (n = 3, 3 independent biological replicates, P > 0.05, unpaired, two-tailed Student’s t-test). NS, not significant. b, Liver triglyceride levels after 20 weeks on HFD (n = 3, 3 independent biological replicates; *P = 0.043, unpaired, two-tailed Student’s t-test). c, Immunoblots depicting PLIN2, eIF4e and S209 phosphorylated eIF4e levels between chow- and HFD-fed WT and eIF4E+/− livers. d, Relative cellular Bodipy-FL-C12 intensity in AML12WT and AML124e+/− cells after incubation with Bodipy-FL-C12 for 0, 0.5, 1, 2 and 5 h. The intensity of Bodipy-FL-C12 was normalized by protein concentration (n = 3, 3 independent replicates). e, Cellular triglyceride levels in AML12 cell lines under BSA- or BSA-oleic acid-treated (OA) conditions (n = 3, 3 independent replicates; **P = 0.01, unpaired, two-tailed Student’s t-test). f, Representative images of AML12WT and AML124e+/− cells stained with bodipy (green) to monitor lipid storage after overnight treatment, repeated in at least three independent replicates. g, Immunoblots in AML12WT and AML124e+/− cells following oleic acid (OA) treatment for 0, 4 and 6 h. h, Two representative images of AML124e+/− cells transfected with Flag-tagged Plin2 cDNA and co-stained with bodipy (green; left) or Flag (Plin2 overexpression (O/e), red; right). Quantification of bodipy intensity per cell in AML124e+/− cells without (ctrl) and with Plin2 cDNA overexpression (Plin2 O/e) (n = 98, 57 individual cells counted; ****P < 0.0001, unpaired, two-tailed Student’s t-test). For violin plots all data are shown with median dashed black line and upper/lower quartiles as light grey line on independent replicates. For bar graphs, values represent mean ± s.e.m.
Of the genes confirmed to be translationally regulated downstream of eIF4E, PLIN2 was among the most highly enriched in livers of WT mice on HFD, and highly decreased translationally by eIF4E dose (Figs. 3b and 4c). PLIN2 plays a pivotal role in LD lipid storage by coating their cytosolic surfaces to stabilize growth and enlargement while restricting access by cytosolic lipases, consequentially controlling both lipid accumulation and lipolysis for homeostasis19,21–23. Importantly, PLIN2 loss of function has been associated with protection against diet-induced obesity and fatty liver24. LDs are dynamic organelles that store neutral lipids for energy metabolism. Following excessive lipid availability or defects in LD metabolism, lipid deposits accumulate in non-adipose tissue including the liver21,23,24. In agreement with this notion, LD enlargement and total triglyceride levels are significantly downregulated in the eIF4E+/− liver (Figs. 2d and 4b). To corroborate these in vivo results, fat accumulation was monitored in our AML12 cell lines. AML124E+/− cells exhibited lipid uptake similar to that of AML12WT, but with lower triglyceride levels accumulating in the cells during lipid stimulation (Fig. 4d,e). Strikingly, AML124E+/− cells also recapitulated the liver phenotype as shown by reduced LD growth after overnight treatment with lipid-enriched medium (Fig. 4f).
To further assess the dynamic and cell autonomous response to fatty acid stimuli, we treated cells with fatty acid for short periods (4–6 h). Interestingly, with oleic acid stimulus we saw augmented eIF4E activity through increased phosphorylation of eIF4E at serine 209 (S209), and this correlates with increased PLIN2 levels (Fig. 4g). PLIN2 was also highly increased in AML12WT control cells, but this effect was blunted with decreased eIF4E activity (Fig. 4g). Furthermore, to confirm the role of PLIN2 levels in eIF4E-related LD formation and fat storage, we overexpressed Plin2 in AML124E+/− cells. We observed a significant rescue of LD size following oleic acid treatment (Fig. 4h). These results suggest that liver cells establish a rapid response to lipid overload through eIF4E-dependent translation, to facilitate lipid storage and LD growth—at least in part—through control of Plin2 translation.
Reduced eIF4E expression enhances lipid oxidation and energy expenditure.
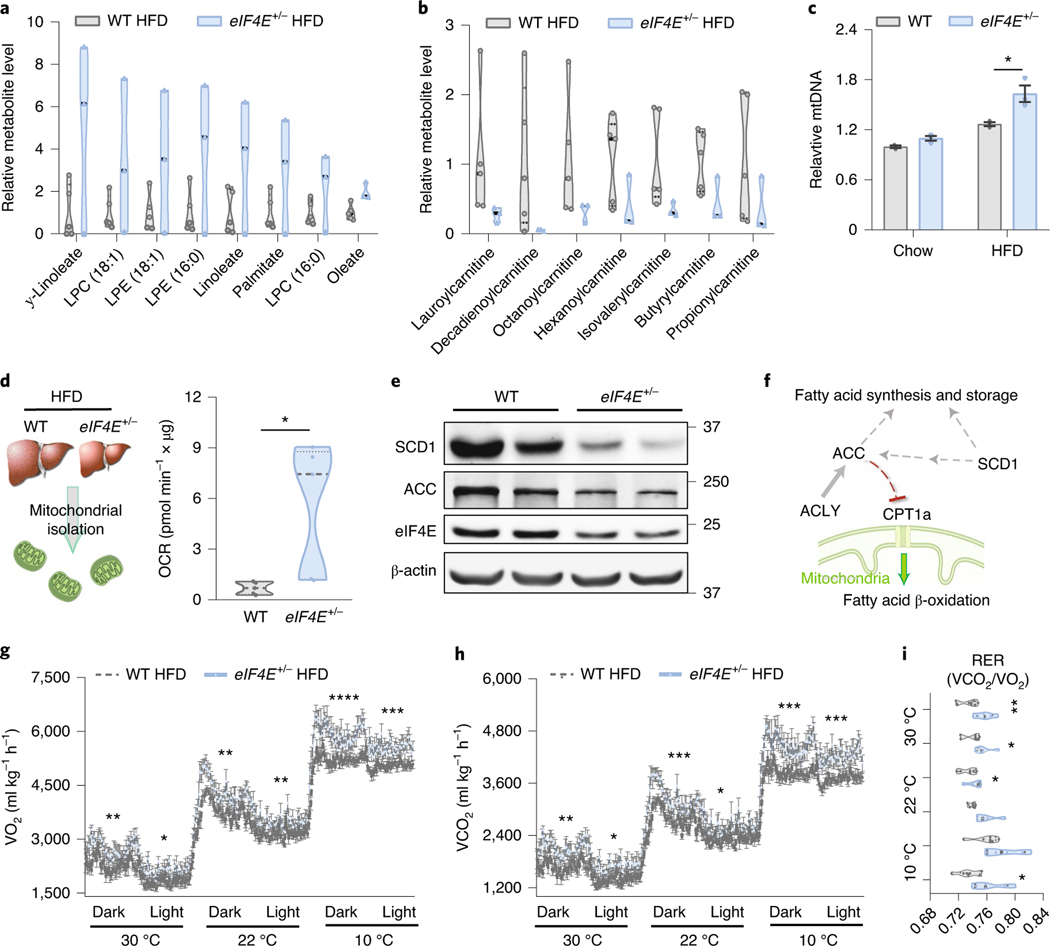
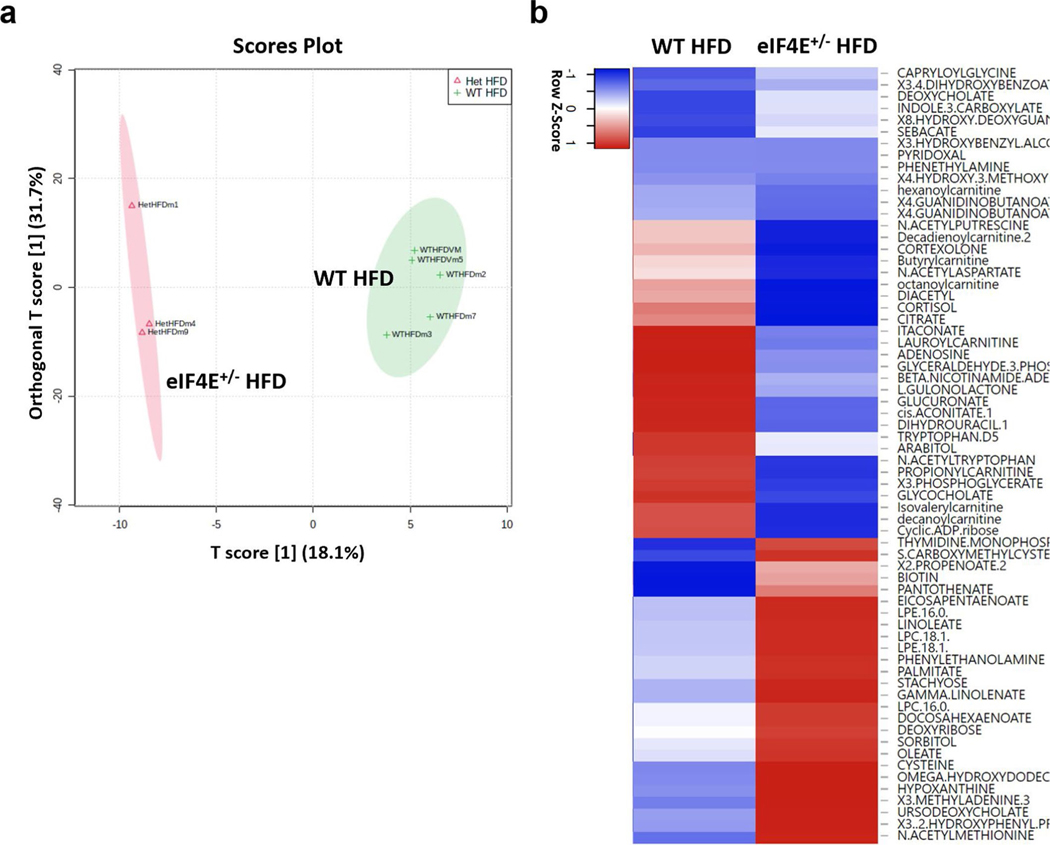
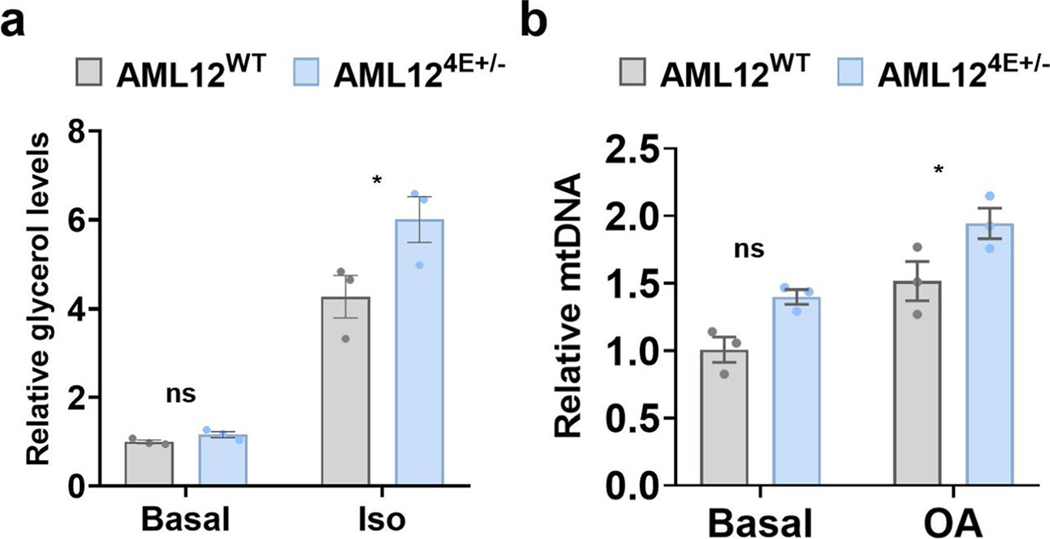
To characterize the impact of eIF4E dosage on lipid metabolism, we performed a targeted metabolomic analysis and detected >300 metabolites extracted from the livers of eIF4E+/− and WT mice. The metabolomic profiles showed a clear distinction based on eIF4E dose as observed by analysis—with >120 metabolites driving this separation (variable importance in projection (VIP) > 1.5)—and partial least-squares–discriminant analysis (PLS–DA) (Extended Data Fig. 6a and Supplementary Table 4). To examine the impact for each metabolite in regard to being either enhanced or lost in relation to eIF4E dose, the top 10% increased and top 10% decreased metabolites were mapped by fold change in relation to expression in WT HFD livers (Extended Data Fig. 6b). While eIF4E+/− livers contained smaller LDs, among all the metabolites that we detected these livers showed an increased abundance of long-chain fatty acids and lipid intermediates including oleate, palmitate and lysolipids (Fig. 5a). These results raise the possibility of an increase in either lipid uptake or lipolysis in eIF4E+/− cells, resulting in free fatty acids and intermediates in lipid hydrolysis. We observed a significant upregulation of triglyceride breakdown in AML124E+/− cells compared to control by measuring glycerol released from triglyceride breakdown after epinephrine stimulus (Extended Data Fig. 7a). Together, these findings suggest that increase in long-chain fatty acids may be the result of increased lipid breakdown in cells with reduced eIF4E dose.
Fig. 5 |. Increased mitochondrial activity and energy expenditure with reduced eIF4E.
a, Relative selected lipid metabolite levels labelled from livers of WT and eIF4E+/− male mice fed with HFD for 20 weeks, by metabolomics analysis (n = 5, 3 independent biological replicates). b, Relative selected acylcarnitine metabolite levels labelled from livers of WT and eIF4E+/− male mice fed with HFD for 20 weeks, by metabolomics analysis (n = 5, 3 independent biological replicates). c, Relative mitochondrial abundance (n = 3, 3 independent biological replicates; *P = 0.023, unpaired, two-tailed Student’s t-test). d, Schematic (left) of isolated mitochondria prepared from livers of WT and eIF4E+/− mice fed with HFD, which were analysed for OCR (right) with an ADP stimulus quantified using a Seahorse Flux Analyzer in the presence of a substrate of palmitoyl-carnitine (n = 5, 5 independent biological replicates; *P = 0.026, unpaired, two-tailed Student’s t-test). e, Immunoblots from indicated samples validating MS analysis of targets in relation to eIF4e dose; proteins were examined over three independent biological replicates per genotype. f, Schematic summary of identified targets for the balance of lipid processing and fatty acid oxidation in mitochondria. g,h, Whole-body OCR represented as VO2 (g) and VCO2 (h) of WT and eIF4E+/− mice on HFD for 3 days at the indicated temperatures. i, Average ReR per 12-h cycle (n = 6, 6 independent biological replicates; *P < 0.05, **P < 0.01, ***P < 0.005, ****P < 0.0001, unpaired, two-tailed Student’s t-test). For violin plots, all data are shown with median dashed black line and upper/lower quartiles as light grey line in independent biological replicates. For line and bar graphs, values represent mean ± s.e.m. of independent biological replicates.
Intriguingly, metabolomics also revealed a dramatic decrease in long-chain acylcarnitine levels in eIF4E+/− livers (Fig. 5b and Extended Data Fig. 6b). Acylcarnitines are intermediates involved in the process of shuttling fatty acids into the mitochondria to facilitate their β-oxidation as a fuel to yield energy. HFD feeding has been reported to lead to an accumulation of long-chain acylcarnitine as a result of insufficient β-oxidation to cope with lipid overload25. However, in eIF4E+/− mice that are resistant to HFD-induced obesity, we observed a decrease in long-chain acylcarnitines. We therefore hypothesized that the lower long-chain acylcarnitine levels in eIF4E+/− liver had resulted from increased fatty acid β-oxidation within the mitochondria. We first measured mitochondrial density and observed an increase in mitochondrial abundance in the livers of eIF4E+/− mice on HFD (Fig. 5c). Similar trends were also observed in AML12 cells based on eIF4E dose (Extended Data Fig. 7b). For direct evaluation of fatty acid β-oxidation (FAO), we further isolated mitochondria from WT and eIF4E+/− livers under HFD and used palmitoyl-carnitine as a substrate with adenosine diphosphate (ADP) to provoke oxygen consumption (Fig. 5d). The same level of mitochondria was used per sample, and we observed a significant increase in oxygen consumption rate (OCR) by eIF4E+/− mitochondria compared to that in WT, once more suggesting an increase of FAO in eIF4E+/− liver (Fig. 5d).
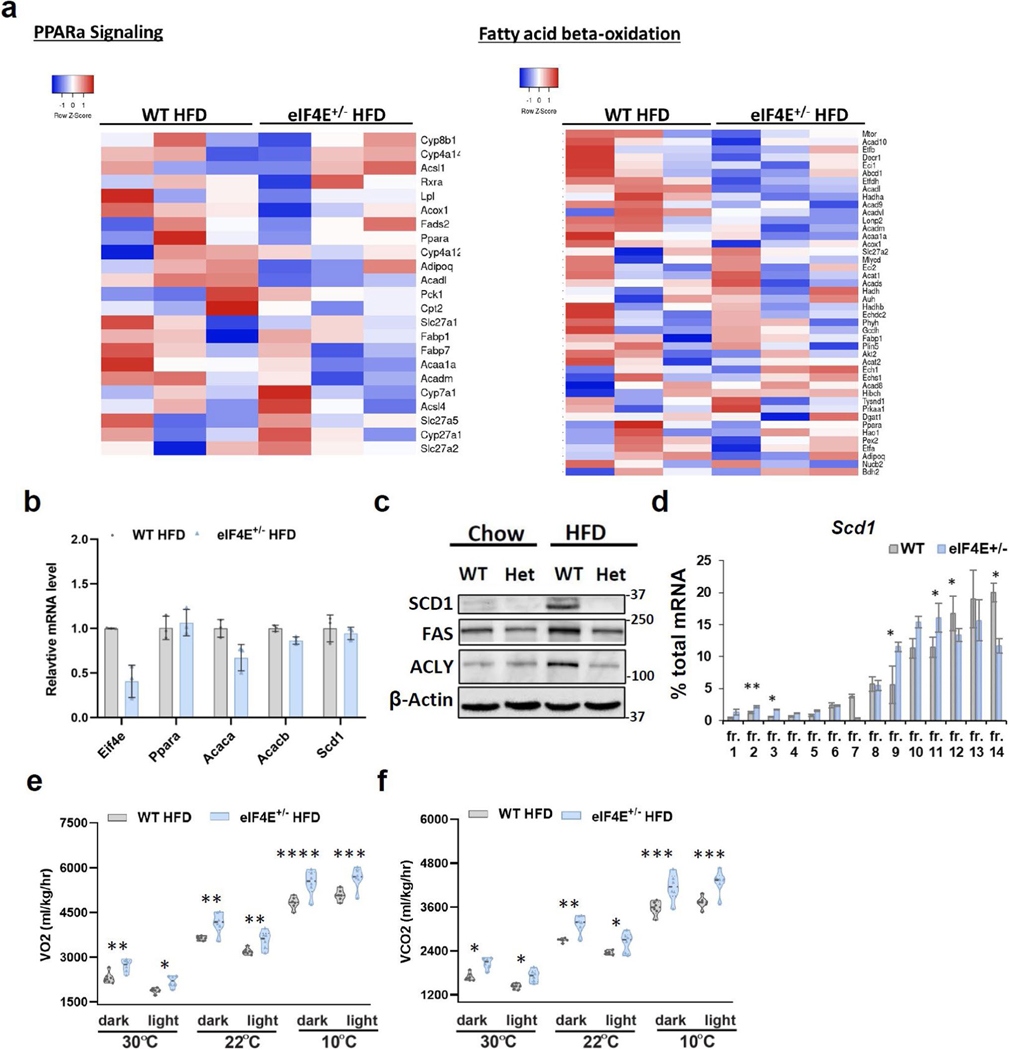
To evaluate the mechanism underlying these results, we first examined the expression of proteins directly within FAO pathway analysis in our MS data and observed no significant alterations in eIF4E+/− HFD livers (Extended Data Fig. 8a). Similarly, we saw no changes in components within the PPAR-α signalling pathway or directly in expression of Ppara, encoding a transcription factor known to control energy metabolism in relation to FAO (Extended Data Fig. 8a,b). Interestingly, in our MS analysis we identified that eIF4E dose alters two independent yet parallel pathways that impinge on FAO signalling—lipid processing and fatty acid synthesis, while also increasing one main enzyme for FAO in the mitochondria.
In the direct analysis between WT and eIF4E+/− HFD livers, an additional key rate-limiting factor that orchestrates the biosynthesis of mono-unsaturated fatty acids, stearoyl-CoA desaturase (SCD1), was significantly downregulated in eIF4E+/− livers (Fig. 5e, Extended Data Fig. 8c and Supplementary Table 5). This mRNA similarly showed translational regulation by eIF4E dose within polysomes (Extended Data Fig. 8d). Therefore, eIF4E directly regulates the translation of lipid components required for transport, storage and processing (LPIN, PLIN2 and SCD1). The loss of all three of these proteins has, individually, been shown to increase free fatty acid abundance sufficient to activate FAO26. A knockout mouse for Plin2 or Scd1 on HFD also showed an increase in β-oxidation; Plin2 loss decreased fatty acid synthesis genes (acetyl-CoA carboxylase (ACC), FASN and SCD1)24,27, while loss of Scd1 led to a decrease in ACC abundance28. Importantly, ACC produces malonyl-CoA which allosterically inhibits CPT1, the rate-limiting enzyme in FAO. Reduced ACC de-represses CPT1 and primes cells for FAO. Notably, ACC and other components in the fatty acid synthesis pathway were significantly reduced in eIF4E+/− livers (ACLY and FASN) (Fig. 5e,f, Extended Data Fig. 8c and Supplementary Table 5). However, the transport proteins for FAO remained unaltered (CPT1, CPT2 and SLC25a20) while one of the four main FAO enzymes was significantly increased (Hsd17b10, 3-hydroxyacyl-CoA dehydrogenase; Supplementary Table 5). Together, these data indicate that eIF4E+/− livers are compromised in lipid processing, synthesis and storage and are concurrently de-repressed for FAO. This, coupled with increased mitochondrial density and enzyme abundance to drive the third step of β-oxidation of long-chain fatty acids, suggests an increase in lipid breakdown for energy.
We next investigated whether an increase in FAO correlates with mouse energy expenditure, by utilizing a comprehensive laboratory animal-monitoring system (CLAMS) to measure whole-body volume of oxygen uptake (VO2) and exhaled carbon dioxide (VCO2) and to calculate the respiratory exchange rate (RER), which is an established method used to quantify energy expenditure at the whole-body level29. Following HFD, eIF4E+/− mice showed significantly higher VO2, VCO2 and RER than WT mice, suggesting that the former have overall increased energy expenditure (Fig. 5g–i and Extended Data Fig. 8e,f). Altogether, these data demonstrate that eIF4E loss of function induces parallel, pleiotropic metabolic effects that converge to increase the capacity for fatty acid β-oxidation. eIF4E+/− mice block lipid transport and storage pathways while reducing fatty acid synthesis pathways and expanding mitochondrial density, the outcome being increased free fatty acids and activation of FAO that, in part, allow for the observed increase in both OCR and energy expenditure that may contribute to the increased fitness observed following HFD.
Targeting eIF4E activity restrains HFD-induced obesity.
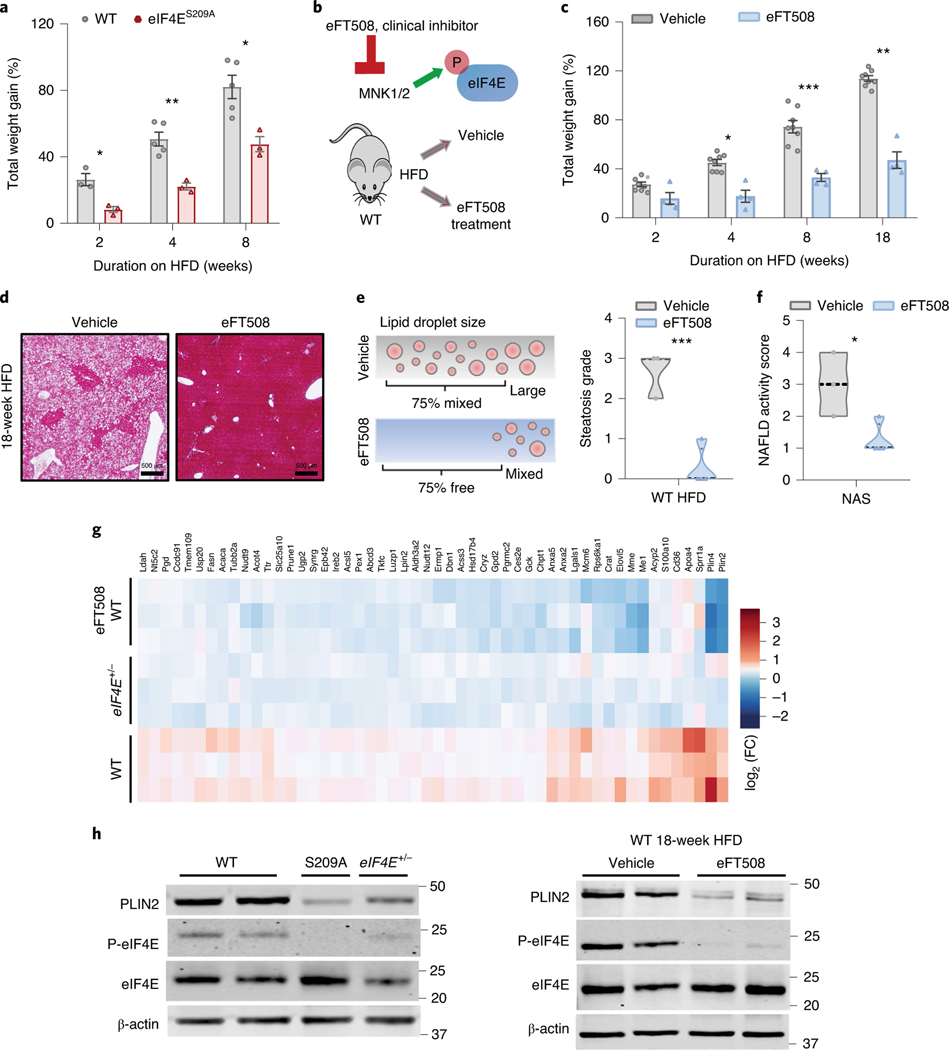
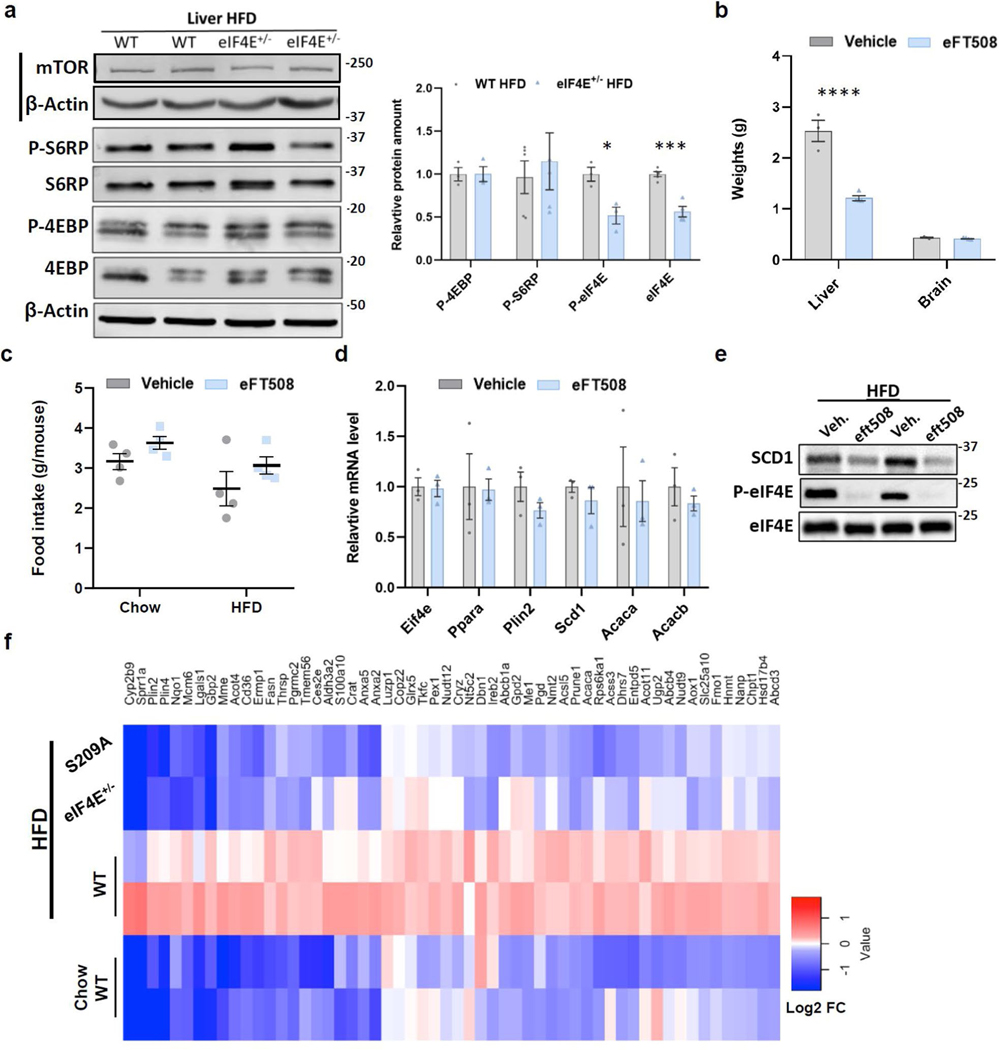
At present there are a limited number of therapeutic interventions available for obesity and obesity-induced disease. Although alteration in mTOR signalling components has been shown during HFD-induced obesity15,16,30, few have direct druggable targets and we found that mTOR signalling remained unaltered in eIF4E+/− mice (Extended Data Fig. 9a)12. However, we observed elevated phosphorylation of eIF4E at S209 following HFD (Fig. 5c,g). This is consistent with an increase in phosphorylated eIF4E at S209, which is known to positively stimulate eIF4E activity31–33. Importantly, eIF4E phosphorylation-deficient mice (eIF4ES209A) show no global developmental or growth defects33. To explore the role of eIF4E in vivo in obesity, we placed mice deficient in eIF4E phosphorylation (S209A) on HFD to monitor weight gain. These eIF4ES209A mice showed significant resistance to HFD-induced weight gain, almost to the same extent as following 50% loss of eIF4E expression, which highlights the importance of eIF4E S209 phosphorylation in these processes (Fig. 6a).
Fig. 6 |. Pharmacological inhibition of eIF4E activity protects mice from diet-induced obesity and steatosis.
a, Body weight gain, relative to starting point, for WT and eIF4eS209A mice on HFD for the indicated durations (n = 5, 3 independent biological replicates; *P < 0.015, **P = 0.0035, two-way ANOVA with Sidak’s multiple comparison test). b, Schematic of clinical inhibition of eIF4e activity with eFT508 blockage of phosphorylation (P) at S209 in WT mice on HFD. c, Body weight gain, relative to starting weight, for WT mice on HFD given either vehicle or eFT508 treatment for indicated durations (n = 8, 4 independent biological replicates; *P = 0.02, **P = 0.004, ***P = 0.0002, two-way ANOVA with Sidak’s multiple comparison test). d, Representative image of Masson’s trichrome staining of liver tissue sections from mice on HFD for 18 weeks with or without treatment; scale bars, 500 μm (reviewed in n = 3, 4 independent biological replicates). e,f, Lipid droplet size (%) based on pathologist scoring (e), with steatosis grading and NAFLD activity score (f); n = 3, 4 independent biological replicates; *P = 0.027, ***P = 0.00192, unpaired, two-tailed Student’s t-test). g, Heat map depicting relative expression of proteins significantly reduced in livers of eIF4E+/− and WT following eFT508 treatment in relation to WT livers during HFD, shown as colour-coded log2(FC) across biological triplicate samples of WT, eIF4E+/− and WT treated with eFT508 on HFD. h, Immunoblots depicting expression of PLIN2, P-eIF4e and eIF4e relative to β-actin in livers of WT, eIF4eS209A or eIF4E+/– mice on HFD for 20 weeks (left). Similar representative immunoblots from livers of WT mice on HFD for 18 weeks treated with either vehicle or eFT508 treatment (right). Values are expressed as mean ± s.e.m. of independent biological replicates.
We next asked whether we could target eIF4E activity to treat obesity and increased fat deposition in the liver. In phase 2 cancer clinical trials, eFT508 is a potent clinical compound that selectively blocks phosphorylation of eIF4E on S209 through targeting the upstream kinases MNK1/2, which is thought to positively increase eIF4E activity32–34. Importantly, double-knockout MNK1/2 mice are phenotypically normal, suggesting that global inhibition of MNK activity is possible but without adverse consequences on organismal physiology and cellular homeostasis34. Therefore we tested for the therapeutic benefit of targeting eIF4E phosphorylation during diet-induced obesity. To this end, we treated WT mice with eFT508 while feeding them on HFD (Fig. 6b). Strikingly, WT mice treated with eFT508 gained significantly less weight than littermates treated with vehicle (Fig. 6c). As with eIF4E+/− mice, eFT508 treatment markedly reduced both HFD-induced liver weight and lipid accumulation, leading to significantly less steatosis with a lower NAFLD activity score (Fig. 6d–f and Extended Data Fig. 9b). Importantly this was independent of food intake because mice given both vehicle and treatment consistently ate the same amount of either normal chow or HFD (Extended Data Fig. 9c).
To survey the effects of eFT508 treatment during HFD, we performed additional, unbiased proteomics analysis on livers from WT mice treated with eFT508 under HFD using TMT–MS. Of the 310 proteins significantly upregulated following HFD in WT mice from previous proteomics analysis, 109 were significantly downregulated with eFT508 treatment. Those tested also showed no alteration in transcript levels during treatment, which suggests additional translational regulation (Extended Data Fig. 9d,e). Importantly, 52 proteins overlap with the 80 proteins whose expression is dependent on eIF4E dosage following HFD (Fig. 6g and Supplementary Table 6). Furthermore, 56 proteins dependent on eIF4E dose also overlapped with genetic loss of S209A in the liver of mice on HFD (Extended Data Fig. 9f and Supplementary Table 7), and 39 directly between eIF4ES209A and eFT508-treated mice. Similarly to the results of proteomics analysis of eIF4E+/− livers from mice on HFD, PLIN2 is among the top hits as are other proteins involved in lipid metabolic processing and lipid homeostasis pathways (LPIN2, ACACA (ACC), ACSL5 and FASN). Immunoblot assays also confirmed that PLIN2 was significantly lower in mice with a phosphorylation-deficient mutation (eIF4ES209A), and in livers treated with eFT508 compared to vehicle-treated controls following HFD (Fig. 6h). These results further underscore the importance of eIF4E phosphorylation for its dynamic activity in regulation of the translation of lipid-processing proteins, and highlights a potential treatment for inhibition of diet-induced obesity.
Discussion
Aberrant lipid processing has emerged as a main driver steering metabolic syndromes including obesity, diabetes and cardiovascular diseases, as well as various aggressive and prevalent cancers including hepatocellular carcinoma. This dysregulation can be driven by an increased flux of lipids into the body, through HFD, or may be altered by selected oncogenic signalling pathways to rewire lipid metabolic enzymes by either expression or activity. Understanding the dynamic signalling events underlying lipid regulation can be imperative not only in treating related diseases, but also for future preventative measures or to enhance lipid utilization for maintenance of health.
Here we unexpectedly discovered that diminished eIF4E levels can enhance metabolic fitness and, in turn, prevent obesity while feeding a diet enriched in lipids. Importantly, we uncovered a unique mechanism for eIF4E-dependent translation in the control of lipid processing, transport, storage and LD growth. How, and to what extent, cells store, mobilize and utilize fatty acids in LDs for essential cellular energy metabolism to maintain overall fitness remains an outstanding question. Indeed, an excess of lipid deposition in the liver through abnormal LD growth has been linked to insulin resistance, ER stress, inflammation and chronic liver diseases, including increased risk of liver cancer6,17,18,35,36. Therefore, our results provide a mechanistic role of eIF4E-dependent translational control in the pathogenesis of HFD-induced obesity and related metabolic disease. In addition to their storage function, it is now appreciated that the rapid biogenesis and turnover of LDs can control signalling pathways to regulate energy metabolism, cellular stress responses and inflammation18,19,36. Therefore, because translation is a rapid means of changing protein abundance, our data suggest that eIF4E activity may represent a sensor linking upstream lipid-mediated stimuli with an intracellular response directed to fatty acid synthesis and LD biology.
Our results show that decreased eIF4E dose is advantageous for weight maintenance following HFD, resulting in routing of excess fatty acids to mitochondria-mediated energy production and increased overall fitness. The findings also have therapeutic implications in obesity and related comorbidities. In line with upstream, lipid-mediated signalling converging on eIF4E we found that, following lipid-enriched nutrient stimulation, eIF4E phosphorylation is drastically enhanced. While eIF4E phosphorylation and the MNK kinases are dispensable for normal mammalian development, physiology and cellular homeostasis33,34, it remains an outstanding question of why and when reduction in eIF4E activity becomes beneficial. We show that genetic loss or clinical inhibition of eIF4E phosphorylation by eFT508, already in phase 2 clinical trials for cancer, also inhibits the eIF4E-mediated translation programme and weight gain observed following HFD. Because it is clear that reduction of eIF4E activity is advantageous in halting tumour growth12, our results provide a compelling rationale to test eIF4E inhibitors in tumours associated with obesity and, potentially, to even activate increased fatty acid β-oxidation to promote fitness. Together, these studies show how regulation of the dose and activity of a ubiquitously expressed translation factor can have unexpected consequences on metabolic health, and demonstrate the therapeutic benefit of targeting its activity for increased energy expenditure.
Methods
Mice and diet.
Eif4e genetic loss-of-function mice (eIF4E+/−)12 and phosphorylation mutant mice (Eif4eS209A/S209A)33 were maintained on a C57BL/6 J background (stock no. 000664, Jax). For the study of HFD, male mice at 8 weeks of age were either maintained on University of California San Francisco (UCSF) standard laboratory rodent chow (PicoLab Rodent Diet, no. 5053; 4.7 kcal g−1) or fed on 60% HFD (no. D12492i, Research Diets; 5.2 kcal g−1) and monitored as indicated per experiment. Mouse cohorts consisted of littermates or similar litters weaned together, typically co-housed with up to five male mice per cage. Animals were housed in a pathogen-free barrier environment, at ~20 °C on a 12/12-h dark/light cycle throughout the study, and were supplied water ad libitum. All experiments were performed in compliance with guidelines approved by the Institutional Animal Care and Use Committee of UCSF under approval no. AN180952–02B.
Metabolic mouse studies.
Mice on regular chow or HFD were independently placed in cages of a CLAMS (Columbus Instruments) and allowed >24 h to acclimate to single housing. Mice were examined for whole-body energy expenditure (VO2 and VCO2), food intake and locomotor activity (beam break counts) at the indicated temperatures. Fat mass and lean mass were measured at the indicated times by a Body Composition Analyzer EchoMRI (Echo Medical Systems). For glucose tolerance testing experiments, mice on the indicated diets for the times specified in figure legends were fasted overnight then injected intraperitoneally with glucose (1.5 g kg−1 body weight). Blood samples were collected at the indicated time points, and glucose levels were measured using blood glucose test strips (no. 89080, Contour).
Tissue dissection and preparation.
At the indicated time points mice were euthanized followed by cervical dislocation and, typically, immediate heart puncture to collect blood for plasma sample collection. The indicated tissues were dissected, weighed and snap-frozen. Tissues were stored at −80 °C if not continually processed for selected assays. Liver tissue was crushed by mortar and pestle while frozen, then aliquoted for subsequent experiments. To preserve RNA integrity, the homogenizer was wiped with RNaseZap (no. R2020, Ambion) and then washed with diethyl pyrocarbonate between samples.
Tissue staining.
Tissue samples were either fixed in formalin followed by ethanol dehydration before paraffin embedding, or directly mounted in optimal cutting temperature (OCT) compound and stored at −80 °C. Morphology was examined on sections stained with both haematoxylin and eosin (H&E) and Mason’s trichrome. Oil red O staining was performed in OCT-mounted liver sections. All embedding, sectioning and staining was completed by UCSF core services.
Adipocyte quantification.
Images of WAT were taken on a Zeiss AxioImager 2 microscope using ZEN 3.1 (Blue edition) software. Images were opened using Fiji ImageJ (v.1.52p), viewed as a hyperstack in greyscale. Stacks were separated into images and isolated into colour channels (red, green and blue). Using the green channel to maximize contrast between cell and background, the image type was changed to eight-bit, then inverted. Background colour and noise were removed using in-house ImageJ tools, then segmented using the Morphological Segmentation plug-in37. The gradient radii were adjusted to predict cell size before morphological operation. Tolerance values were adjusted to apply watershed segmentation to adipocyte shape and size. After running the morphological segmentation tool, a new image was created to display the overlaid dams. The new image was changed again to eight-bit then underwent a Gaussian blur filter using ImageJ’s Gaussian blur tool. Threshold values were changed for accurate matching of the original image and analysis for particles, excluding all edges. After obtaining areas for each adipocyte, cut-offs of 300 and 39,000 μm2 were used, respectively, to remove smaller particles not predicted to be adipocytes and larger particles predicted to be multiple-merged-layer adipocytes. Averages for each slide were taken then compared between WT and eIF4E+/− tissue slides.
Adipogenesis.
Tissues were dissected and dissociated, and cells counted for plating of even numbers to six-well dishes. Adipocyte differentiation was induced by treatment of confluent pre-adipocytes with DMEM containing 10% fetal bovine serum (FBS), 0.5 mM isobutylmethylxanthine, 125 nM indomethacin, 2 μg ml−1 dexamethasone, 850 nM insulin, 1 nM T3 and 0.5 μM rosiglitazone. Two days after induction, cells were switched to maintenance medium containing 10% FBS, 850 nM insulin, 1 nM T3 and 0.5 μM rosiglitazone. Cells were monitored and imaged after 6 days of induction on an Echo Revolve microscope.
Tissue pathology evaluation.
Unidentifiable slides were numerically labelled and submitted to R.M.G., a board-certified anatomic pathologist with expertise in NAFLD, to blindly review H&E- and trichrome-stained slides. Histological assessment, including lipid description per slide, steatosis score, NAS and additional notes, was shared based on validated scoring systems38.
TMT–MS sample preparation and labelling.
Liver portions were excised (cubes ~2–3 mm in length) and homogenized in 100 μl of 8 M urea using a probe sonicator (ThermoFisher Scientific). Total protein content in the extracts was determined utilizing a Micro BCA Protein Assay Kit (no. 23235, Thermo Scientific). Aliquots containing 170 μg of protein were treated with 8.8 mM DTT at 56 °C for 15 min, followed by incubation for 30 min at room temperature in the dark with 15 mM iodoacetamide. For tryptic digestion, the samples were then diluted fourfold with 100 mM ammonium bicarbonate to reduce urea concentration to 2 M, followed by the addition of 5% (w/w) modified trypsin (Promega). The pH was adjusted to 8.0 with 250 mM ammonium bicarbonate and the samples were incubated for 12 h at 37 °C. Next, a further aliquot of trypsin was added (2% w/w) with digestion for an additional 6 h. Samples were then acidified with formic acid to a final concentration of 5%. The digests were desalted using a MAX-RP Sep-Pak classic C18 cartridge (Waters) following the manufacturer’s protocol. Sep-Pak eluates were dried-evaporated in preparation for labelling with TMT11-plex reagents. Dried samples were labelled according to instructions for the TMT11-plex kit (no. A34808, ThermoFisher Scientific). All labelled materials were combined and desalted using a C18 Sep-Pak. The Sep-Pak eluate was dried in preparation for fractionation by high-pH, reverse-phase liquid chromatography.
High-pH, reverse-phase liquid chromatography.
Fractionation of labelled samples was performed in an ÄKTA purifier system (GE Healthcare Life Sciences), utilizing a Phenomenex Gemini 5-μm C18 110-Å 150 × 4.60-mm2 column in a 1–50% acetonitrile (MeCN) gradient in the presence of 20 mM ammonium formiate, operating at a flow rate of 0.550 ml min−1. Buffer A consisted of 20 mM ammonium formate (pH 10.0) and buffer B consisted of 20 mM ammonium formate in 90% MeCN (pH 10.0). Gradient details were as follows: 1–9% buffer B for 14 min, 9–49% buffer B for 4 min, 49–70% buffer B for 36 min and 1% buffer B for 3 min. Fifty peptide-containing fractions were collected, evaporated and resuspended in 0.1% formic acid.
MS analysis.
Aliquots (each containing around 3 μg of digested material) of 11 non-consecutive chromatographic fractions were run onto a 2 μm × 75 μm × 50 cm PepMap RSLC C18 EasySpray column (Thermo Scientific) using 3-h MeCN gradients (2–30% in 0.1% formic acid), and were used to elute peptides at a flow rate of 300 nl min−1 for analysis in an Orbitrap Lumos Fusion mass spectrometer (Thermo Scientific) in positive ion mode. MS spectra were acquired at 375–1,500 m/z with a resolution of 120,000. For each MS spectrum, multiply charged ions above the selected threshold (2 × 10⁴) were selected for tandem MS (MS–MS) in cycles of 3 s with an isolation window of 0.7 m/z. Precursor ions were fragmented by HCD using stepped relative collision energies of 30, 35 and 40 to ensure efficient generation of both sequence ions and TMT reporter ions. MS–MS spectra were acquired in centroid mode with resolution 50,000 and 110 m/z. A dynamic exclusion window was applied, which prevented selection of the same level of m/z for 30 s after acquisition.
Peptide and protein identification and TMT quantitation.
Peak lists were generated using PAVA in-house software39. All generated peak lists were searched against the mouse subset of the SwissProt database (SwissProt.2019.07.31) using Protein Prospector40 with the following parameters: enzyme specificity was set as trypsin, and up to two missed cleavages per peptide were allowed. Carbamidomethylation of cysteine residues, and TMT labelling of lysine residues and the N terminus of the protein, were allowed as fixed modifications. N-acetylation of the N terminus of the protein, loss of protein N-terminal methionine, pyroglutamate formation from peptide N-terminal glutamines and oxidation of methionine were allowed as variable modifications. Mass tolerance was 10 and 30 ppm in MS and MS–MS, respectively. The false-positive rate was estimated by searching the data using a concatenated database containing the original SwissProt database, as well as a version of each original entry where the sequence had been randomized; FDR = 1% was permitted at the protein and peptide levels. For quantitation, only unique peptides were considered—those common to several proteins were not used for quantitative analysis. Relative quantization of peptide abundance was performed by calculation of the intensity of reporter ions corresponding to different TMT labels present in MS–MS spectra. Intensities were determined by Protein Prospector. Summed intensity on each TMT channel for all identified spectra was used to normalize individual intensity values. Relative abundances were calculated as ratios versus average intensity levels in the four channels corresponding to control samples. Spectra representing replicate measurements of the same peptide were kept and used to calculate dispersion and significance threshold for the analysis. For total relative protein levels, peptide ratios were aggregated to protein levels using median values of log2 ratios. The MS proteomics data have been deposited with the ProteomeXchange Consortium via the PRIDE partner repository, with the dataset identifier PXD023440.
Bioinformatic analysis of MS datasets.
Based on log2-transformed proteomics data from each sample, we performed differential protein expression analysis using limma (v.3.42.2, Bioconductor Biobase 3.10, R 3.5.3) on median normalized protein data to calculate fold change and adjusted P values (FDR) of each gene41,42: WT fed with HFD versus WT fed with chow; WT fed with HFD versus eIF4E+/− fed with HFD; and WT fed with HFD versus WT fed with HFD and treated with eFT508. Heat maps were drawn using the heatmap.2 function in the package ggplot2 (v.3.0, R 3.5.3).
Functional annotation of gene set enrichment.
Genes significantly increased under HFD in WT and that were dependent on eIF4E dose (80 proteins) were analysed using the DAVID bioinformatics resource. Functional annotation clustering performed using DAVID defined settings incorporating gene sets from Gene Ontology (GO) (biological process and molecular function) and UP keywords. The full gene lists from MS analysis were used as background to check enrichment against proteome. The top gene categories statistically significant (FDR < 0.05) acquired from a combined selected annotation view were graphed and pursed to evaluate the requirements for eIF4E regulation.
Immunoblot analysis.
Immunoblot analysis was performed on samples lysed in RiPA lysis buffer (50 mM Tris-HCl pH 8.0), 150 mM NaCl, 1% NP-40, 0.1% SDS, 0.5% sodium deoxycholate, 1 mM EDTA and 1 mM DTT) with the addition of PhosSTOP (no. 4906837001, Roche) and Complete Mini proteasome inhibitors (no. 4693124001, Roche) using standard procedures. Briefly, lysates were iced and vortexed for 30 min, then centrifuged, and an aliquot of supernatant was used for Bradford assay (or bicinchoninic acid (BCA) assay) to determine protein concentration. Immunoblot analysis was performed using commercial antibodies at a ratio of 1:1,000 for eIF4E (BD Biosciences, no. 610269), β-actin (Sigma, no. A5316), phospho-eIF4E S209 (Cell Signaling, no. 9741), PLIN2 (Proteintech, no. 15294–1-AP), UCP1 (Cell Signaling, no. 14670), SCD1 (Cell Signaling, no. 2438), ACC (Cell Signaling, no. 3676), ACLY (Cell Signaling, no. 4332), FASN (Cell Signaling, no. 3189), mTOR (Cell Signaling, no. 2972), S6RP/PS6 (Cell Signaling, no. 2317/4858) and P-4EBP/4EBP (Cell Signaling, no. 9644/9451). Secondary antibodies used were HRP Conjugate Anti-Mouse IgG (Promega, no. W4021) and HRP Conjugate Anti-Rabbit IgG (Promega, no. W4011). IRdye secondary antibodies were Anti-Mouse IgG Polyclonal Antibody (IRDye, 680RD, no. VWR 102673–408) and Anti-Rabbit IgG Polyclonal Antibody (IRDye, 800CW, no. VWR 102673–330). All immunoblots were repeated a minimum of three times with biologically independent samples. Where mentioned, proteins were quantified using Fiji ImageJ (v.1.52p) software for analysis of the optical density of immunoblots normalized to loading control.
Quantitative PCR.
RNA was isolated using TRIzol Reagent (no. T9424, Invitrogen) according to the manufacturer’s protocol, followed by quantification on nanodrop. Samples were processed using a High-capacity Complementary DNA Reverse Transcription kit (no. 4368813, Applied Biosystems). cDNA samples were diluted 1:20 and 1 μl of template was used in SYBR green (no. A25743, ThermoFisher Scientific) for detection of quantitative PCR (qPCR) assay. To quantify firefly (FLuc) and Renilla (RLuc) luciferase mRNA levels, DNA was removed from isolated RNA using a DNA-free Kit (Turbo, no. AM1907). Next, FLuc 5′-GTCGGGAAGACCTGCCACGC-3 and RLuc 5′-ATCACGGAGAACTCGCTC-3′ were used as primers to reverse transcribe total RNA isolated from samples (SuperScript III Reverse Transcriptase, no. 18080085, ThermoFisher Scientific).
Liver polysome profiles and fractioning.
Liver tissue from indicated samples was first homogeneized in lysis buffer (1.5 mM KCl, 2.5 mM MgCl2, 5 mM Tris pH 7.5, 1% Triton X-100, 1% sodium deoxycholate and RNase Out), then 50 μg ml−1 cycloheximide was added and samples were lightly vortexed followed by centrifugation at approximately 3,000 r.p.m. for 15 min at 4 °C. Supernatant was collected and 50 μg ml−1 cycloheximide added in extra lysis buffer, followed by centrifugation at 12,600 r.p.m. for 10 min at 4 °C. Supernatants were collected, checked for optical density (OD)260 and protein and adjusted with lysis buffer to load equal concentrations onto a 15–45% sucrose gradient prepared with a gradient maker (BioComp). Samples were spun at 37,500 r.p.m. for 2.5 h at 4 °C in a SW41 rotor and Beckman ultracentrifuge, then separated on a gradient fractionation system (BioComp) for evaluation of polysome profiles and collection of fractions. Fractions were labelled 1–14 following gradient collection and stored at −80°C until required for analysis.
Analysis of polysomal-associated mRNAs.
RNA was isolated from individual fractions using TRIzol LS Reagent (no. 10296010, Invitrogen), spiked with FLuc RNA as internal control (approximately 0.5 μg in total diluted in TRIzol LS before addition to 28 fractions). RNA quality was checked by nanodrop and running of RNA agarose gels. These gels also show ribosomal RNA to determine monosome fractions. A fixed volume of RNA from each fraction was reverse transcribed to cDNA using a cDNA Reverse Transcription kit (no. 4368813, Applied Biosystems). cDNA samples were diluted 1:20, and 1 μl of template was used for qPCR assay. RNA levels were quantified, normalized to internal FLuc as control, summed across all fractions, analysed and presented as percentages of this total.
Cell culture, CRISPR clones and reagents.
AML12 cells (CRL-2254, American Type Culture Collection (ATCC)) were cultured in DMEM/Ham’s F12 medium supplemented with 10% FBS (5 μg ml−1 insulin, 5 μg ml−1 transferrin, 5 μg ml−1 selenium, 40 ng ml−1 dexamethasone, 100 U ml−1 penicillin and 100 μg ml−1 streptomycin). Oleate-containing medium was prepared by the addition of BSA-conjugated oleic acid (no. SIAL-O3008, Sigma) to culture medium. Control cell culture medium contained the same levels of fatty acid-free BSA (no. A8806, Sigma). To generate eIF4E+/− AML12 cell lines, single-guide RNA (ATTAaGGAAACCACCCCTACC) targeting eIF4E was cloned into plasmid PX458 containing Cas9-green fluorescent protein (GFP). AML12 cells were transfected with the plasmid using Lipofectamine LTX with Plus Reagent (no. A12621, ThermoFisher) and selected by GFP using Sorter. Single cells were then plated and grown to create single-cell clones. eIF4E+/− cell lines were picked based on eIF4E expression levels by immunoblotting and sequencing on sgRNA target regions. Primers used for sequencing were: forward, GAGTAGCCCGATTCTCCTAGAGAG; reverse, CTACAGGCTGACAACTGATCACATC. AML12 cells were transfected with plasmid containing Plin2 cDNA tagged with Flag (no. NM_007408, ORIGENE) using Lipofectamine LTX with Plus Reagent (no. A12621, ThermoFisher).
Assays for cell viability and death.
AML12WT and AML124E+/− cells were seeded in equal numbers in 96-well plates at 1 × 10³ cells per well. Viable cells were quantified using CellTiter-Glo luminescent cell viability assay (no. G7570, Promega) after 24 or 48 h based on the assay manual with a Glomax 96 Microplate Luminometer (Promega). Apoptosis was accessed in AML12WT and AML124E+/− cells using APC conjugated Annexin V antibody (no. 84–848, BD Pharmingen) and staining with propidium iodide (PI, no. P4864, Sigma). Dead and dying cells were scored as Annexin V-positive and/or PI-positive on an Attune flow cytometer (Invitrogen). Analysis of data was performed using FlowJo 10.5.2 software. The gating strategy shown in Extended Data Fig. 4b was used to differentiate live and dead/dying AML12 cells. Cells were first gated on forward scatter (FSCA) versus side scatter (SSCA) to discard cell debris. Next, FSCH (height) versus FSCA (area) was used to select single cells. Single cells were then gated for Annexin V- and PI-positive cells.
Cellular triglyceride measurement.
Cells were lysed with 1× RiPA buffer (no. ab156034, abcam) on ice for 30 min and vortexed for 30 s. Triglyceride from whole cell lysates was quantified calorimetrically by measurement of glycerol using an Infinity Triglycerides Kit (no. TR22421, ThermoFisher) and normalized to protein concentration measured by BCA assay (no. ab102536, abcam).
Radiochemical labelling, lipid uptake and analysis.
[18F]FTHA synthesis43 was performed on Sofie Biosciences ELIXYS FLEX/CHEM. After purification, final product formulation required human serum albumin (HSA, 4% w/w) as stabilizing agent. Injections were done in 10% ethanol/saline containing 4% HSA. Animals were fasted for 12 h before injection, and synthesis for [18F]FTHA was completed the morning of the experiment for maximum stability. Mice were scanned in pairs (one WT plus one eIF4E+/−). All in vivo imaging was performed using a micro-positron emission tomography–computed tomography (PET–CT) scanner (Inveon, Siemens Molecular Solutions). Each animal was anaesthetized with isoflurane and oxygen. Electrocardiogram (ECG) electrodes were attached to the limbs to monitor and acquire signals. Mice were positioned on the scanning bed with the heart centred in the field of view. Each radiotracer was administered via tail vein injection, and data acquisition began at the time of injection. Dynamic ECG-gated (BioVet System, m2m Imaging Corp.) list mode PET data were acquired over 60 min. For PET acquisition, a CT scan was acquired with 120 projections under continuous rotation. Analysis was done with an AMIDE viewer based on direct regions of interest per tissue.
Lipid uptake assay.
Liver tissues were homogenized 15 times in RiPA buffer on ice and vortexed for 30 s. Lysates were centrifuged at 12,000g for 5 min at 4 °C. Supernatant, including the fat cake, was moved to a new tube and vortexed for 30 s. Cells were treated with fluorescent fatty acid analogue (10 μM Bodipy-FL-C12; no. D3822, ThermoFisher) in the cell culture medium and incubated for different periods of time. Uptake was terminated by removal of the medium and washing of cells with cold PBS. Cells were then lysed using 1× RiPA. Bodipy fluorescence (excitation 500 nM, emission 510 nM) in the whole cell lysate was measured and normalized to protein concentration as measured by BCA assay, as an index of fatty acid uptake.
Lipolysis assay.
Lipolysis assay was performed using a Lipolysis Assay Kit (no. ab185433, Abcam) according to the manufacturer’s protocol. Briefly, cells were either incubated at 37 °C for 3 h in glycerol assay buffer or stimulated with isoproterenol (ISO, 100 μM). Cells were then washed with lipolysis wash buffer and lysed using lipolysis buffer. After addition of the reaction mix to standard or test samples and incubation for 30 min at room temperature, glycerol released from cells was measured by absorbance at OD570. Glycerol levels per cell were calculated by normalizing total glycerol levels to cell number, which was quantified using CellTiter-Glo Luminescent Cell Viability Assay (no. G7570, Promega) as the index of lipolysis.
Immunofluorescence and image analysis.
Immunofluorescence analyses were performed on cells grown on coverslips. Cells were fixed in a freshly prepared solution of 4% paraformaldehyde for 10 min at room temperature, rinsed three times with PBS, permeabilized with 0.3% Triton X-100 for 10 min and washed three times with PBS. Permeabilized cells were blocked with 10% goat serum in PBS. Cells on coverslips were then incubated for 2 h at room temperature with a mouse anti-Flag antibody (diluted 1:100; no. F1804, Sigma) and incubated with an Alexa-568-conjugated anti-mouse antibody (diluted 1:300; no. A11031, Invitrogen) for 1 h. After washing with PBS/Tween three times, cells were incubated with BODIPY 493/503 (no. D3922, ThermoFisher) for 10 min and washed twice with PBS. Specimens were observed using a Zeiss Spinning Disc confocal & TIRF, and images were analysed using Fiji ImageJ (v.1.52p).
Cell polysome fractionation.
AML12 cells were treated with oleate-containing media for 4 h, washed with cold PBS plus 100 μg ml−1 cycloheximide (no. 01810, Sigma) for 2 min and then lysed directly in polysome lysis buffer (10 mM Tris-HCl pH 8.0, 140 mM NaCl, 1.5 mM MgCl2, 0.25% NP-40, 0.1% Triton X-100, 50 mM DTT, 100 μg ml−1 cycloheximide and RNasin) for 20 min. Lysates were spun down for 10 min at 9,300g, and supernatants were loaded onto a 15–45% sucrose gradient. Samples were spun at 37,000 r.p.m. for 2.5 h at 4 °C in a Beckman L8–70M ultracentrifuge. Samples were then separated on a gradient fractionation system (BioComp) to evaluate polysome profiles and collect fractions.
5′ UTR luciferase reporter assays.
5 ′UTRs were amplified from WT mouse liver cDNA and cloned into the pGL3 (Fluc) construct vector. AML12 cell lines were transfected simultaneously with pGL3, the 5′ UTR of interest construct, and the pRL (Rluc) plasmid using Lipofectamine LTX (no. 15338100, Invitrogen). Medium was changed 24 h post transfection to one containing 150 μM oleic acid. Cells were collected 24 h after incubation with oleic acid, half were assayed using the Dual luciferase kit (no. E1960, Promega) and the other half processed withTRIzol (no. T9424, Invitrogen) for RNA purification. Correlation of luciferase activity was normalized to Fluc and Rluc RNA levels as quantified by qPCR with reverse transcription (RT–qPCR), then firefly luciferase activity was normalized to Renilla luciferase activity.
Targeted metabolomics.
Tissues were collected into microcentrifuge tubes, snap-frozen in liquid nitrogen and stored at −80 °C until processed. Following crushing of liver tissue (Tissue dissection and preparation), ~75 mg of frozen sample was aliquoted into a separate microcentrifuge tube and 1 ml of 80% methanol added. The solution was then homogenized and vortexed, and 200 μl of the homogenate was transferred to a new microcentrifuge tube with 800 μl of ice-cold 80% methanol already added. The solution was vortexed rigorously for 1 min then centrifuged for 15 min at 4 °C. The supernatant was transferred to a new tube then placed in a Speedvac, without heat, to dry the tube. To prevent cross-contamination, a breathable membrane was applied to the top of each tube. The metabolite was shipped to UT Southwestern for untargeted acquisition, followed by targeted metabolomics analysis based on extraction of 600 compounds on which previously run external standards were validated.
Data acquisition was performed by reverse-phase chromatography on a 1290 ultra-high-performance liquid chromatography system interfaced to a high-resolution 6550 iFunnel Q-TOF mass spectrometer (Agilent Technologies). The mass spectrometer was operated in both positive and negative mode (electrospray ionization (ESI)+ and ESI−). Analytes were separated on an Acquity UPLC HSS T3 column (1.8 μm × 2.1 mm × 150 mm; Waters) maintained at room temperature. Mobile phase A composition was 0.1% formic acid in water, and mobile phase B composition was 0.1% formic acid in 100% acetonitrile. The liquid chromatography gradient was 0 min, 1% B; 5 min, 5% B; 15 min, 99% B; 23 min, 99% B; 24 min, 1% B; 25 min, 1% B. The flow rate was 250 μl min−1 and the sample injection volume was 5 μl. ESI source conditions were as follows: dry gas temperature 225 °C and flow 18 l min−1, fragmentor voltage 175 V, sheath gas temperature 350 °C and flow 12 l min−1, nozzle voltage 500 V and capillary voltage +3,500 V in positive mode and −3,500 V in negative. The instrument was set to acquire over the full m/z range of 40–1,700 in both modes, with a MS acquisition rate of one spectrum s−1 in profile format. Three quality control repeated injections from a single sample pool were also run; created by combining the same volume (5 μl) from each of the study samples. The three injections were staged across the acquisition of all study samples (beginning, middle and end) to assess instrumental variation during the run (by calculating the coefficient of variation: percentage s.d. divided by the mean). Four additional internal standards were added to samples for initial assessment of the quality of each sample run: asparate D3, glutamate D3, valine D8 and tryptophan D5.
Raw data files (.d) were processed using Profinder B.08.00 SP3 software (Agilent Technologies) with an in-house database incorporating retention time and accurate mass information on 600 standards from the Mass Spectrometry Metabolite Library (IROA Technologies), which was created under the same analysis conditions. The in-house database matching parameters were mass tolerance 10 ppm and retention time tolerance 0.5 min. Peak integration result was manually curated in Profinder for improved consistency and exported as a spreadsheet (.csv). The peak area for each detected metabolite (320/600 reviewed) was normalized against the total ion count of each sample and the mean for each metabolite within the sample batch, to correct for variations introduced by handling through instrument analysis. Multivariate data analysis approaches, including PLS–DA and ortho-PLS–DA, were performed using Metaboanalyst 4.0. We performed feature selection in PLS–DA to identify metabolites that maximize separation between samples. The importance of a metabolite in the model is measured by VIP score: the score for a metabolite calculated as a weighted sum of squared correlations between this metabolite and the derived PLS–DA components. Each weight corresponds to the percentage variation in the response variable, explained by a PLS–DA component. The VIP score of a metabolite indicates its intensity of association with PLS–DA components that best distinguish the groups. The average of VIP2 scores equals 1 and, by convention, VIP > 1 is used as a criterion for variable selection; metabolites with VIP > 1 are reported.
Mitochondrial copy measurement.
Analysis of mitochondrial copy number in livers and AML12 cells was carried out using mitochondrion-encoded NADH dehydrogenase-1 (ND1) as the mitochondrial DNA marker and tyrosine 3-monooxygenase as a genomic marker44. Total DNA, including mtDNA and genomic DNA, was isolated from livers or AML12 cells using quickextract DNA extraction solution (no. QE09050, Lucigen). We used 100 nM DNA to check mtDNA and genomic markers by RT–qPCR analysis. The primer pairs used for RT–qPCR analysis of mtDNA included ND1 (forward, 5′-TGACCCATAGCCATAATATGATTT-3′; reverse, 5′-CTCTACGTTAAACCCTGATACTAA-3′) and tyrosine 3-monooxygenase (forward, 5′-ACAATGTTCtTTGGCCCATGTG −3′; reverse, 5′-ATCCCAGGCAGACTGTAAGAG −3′).
Mitochondrial isolation for respiration measurements.
Mitochondria were isolated from the livers of male mice fed HFD for 20 weeks. After euthanization, blood was immediately removed from the heart and the liver dissected. A piece of the same liver lobe was cut, weighed, minced with scissors and re-weighed, and equal concentrations immediately placed in ice-cold mitochondrial isolation medium (210 mM d-mannitol, 70 mM sucrose, 5 mM HEPES, 1 mM EGTA, 0.5% fatty acid-free BSA, pH 7.2). The tissue samples were homogenized using 30 strokes in a Potter–Elvehjem tissue grinder (Sigma). Following centrifugation at 800g for 10 min at 4 °C, the supernatant was transferred to a new tube and centrifuged at 8,000g for 10 min at 4 °C. The supernatant and lipids were then carefully removed from the pellet, which was washed twice with ice-cold mitochondrial isolation medium, and centrifugation was repeated. The final pellet was resuspended in MAS buffer (220 mM d-mannitol, 70 mM sucrose, 10 mM KH2PO4, 5 mM MgCl2, 2 mM HEPES, 1 mM EGTA, 0.2% fatty acid-free BSA, pH 7.2) with substrate (40 μM palmitoyl-carnitine and 0.1 mM malate). Mitochondrial protein concentration was determined by the DC protein assay kit (no. 5000112, Bio-Rad) with BSA as a standard, and 25 μg of mitochondria were seeded per well on a Seahorse 96-well plate. OCR was measured on mitochondria respiring on palmitoyl-carnitine and malate in the presence of ADP (no. A5763, Sigma) using a Seahorse XF96 flux Analyzer45.
Preclinical trial with eFT508.
Mouse cohorts were placed on HFD at 8 weeks of age and started on treatment with either vehicle or eFT508 treatment within 24 h. Mice were treated from Monday to Friday with 10 mg kg−1 eFT508 or vehicle control by oral gavage over 18 weeks of monitoring. Weights were monitored at the indicated times to review changes compared to initial starting weight. Following euthanization and dissection, tissue weights were recorded and samples collected (Tissue dissection and preparation).
Oligonucleotides.
Oligonucleotide primers were based on either published literature or the National Center for Biotechnology Information site Primer-BLAST. All primers were designed at approximately 20 bases with a 50% G/C content and average melting temperature of 55 °C. All primer sets were confirmed with BLAST, and primers were then tested for a single clean melt curve within a readable value in relation to controls. Oligonucleotides for qPCR were as follows:
Eif4e forward 5′-CCCACCTGCAGAAGAGGAA-3′, reverse
5′-ATCGAAGGTTTGCTTGCCA-3′
β-Actin forward 5′-CTAAGGCCAACCGTGAAAAG-3′, reverse
5′-ACCAGAGGCATACAGGGACA-3′
B2m forward 5′-GGTCTTTCTGGTGCTTGTCT-3′, reverse
5′-CGTAGCAGTTCAGTATGTTCG-3′
FLuc forward 5′-ATCCGGAAGCGACCAACGCC-3′, reverse
5′-GTCGGGAAGACCTGCCACGC-3′
RLuc forward 5′-CGTCGTCCAACATTATCATGG-3′, reverse
5′-ATCACGGAGAACTCGCTC-3′
Plin2 forward 5′-GACCTTGTGTCCTCCGCTTAT-3′; reverse
5′-CAACCGCAATTTGTGGCTC-3′
Lpin2 forward 5′-TTTGTTTGTGGTGCCTTCAC-3′; reverse
5′- GGTTTGAGACAGAATCCCAGG-3′
Acsl5 forward 5′-TGGACGCTCTGAAGTCACCC-3′; rev.
5′-AAATTCAGACCCTGGGAAGGGC-3′
Apoc3 forward 5′-GCTTGGGACTCATGGTACG-3′; reverse
5′-GCAAGGATCCCTCTACCTCT-3′
Apoh forward 5′-AGATGTGTCCCCAGAGTATGT-3′; reverse
5′-TCCTCCGTGCACTTAGATGA-3′
Ucp1 fwd 5′-CACCTTCCCGCTGGACACT-3′; rev.
5′-CCCTAGGACACCTTTATACCTAATGG-3′
Adrb1 fwd 5′-CCGAAAGCAGGTGAATGCAA-3′; rev
5′-AGCCAGTAAGCCATACTAAGCCACA-3′
Ppara fwd 5′-GTGCAGCCTCAGCCAAGTT-3′; rev.
5′-TGGGGAGAGAGGACAGATGG-3′
Acaca fwd 5′-AGAACCTGCAGAAACTCATCC-3′; rev.
5′-TTTAGCGTGGGGATGTTCC-3′
Acacb fwd 5′-ATCCCTCCCTACCTCTGCTG-3′; rev.
5′-GGATGGTGGCTATCTGCTGG-3′
Scd1 fwd 5′-AGGCCTGTACGGGATCATACT-3′; rev.
5′-AGAGCGCTGGTCATGTAGTAG-3′
Statistical analysis and reproducibility.
Data are presented as the average mean of values, with error bars representing either s.d. or s.d. of the mean of at least three experiments, as noted in figure legends. Violin-plotted data represent all data points, with median marked by a black dashed line and upper/lower quartiles by light grey lines. The statistical significance of the difference between experimental groups in instances of single comparisons was determined by unpaired, two-tailed Student’s t-test. Multiple means comparisons between two groups were determined by two-way analysis of variance (ANOVA) followed by Sidak’s multiple comparison tests to determine statistical significance. Data were organized using Excel 2016 (Microsoft), and graphing and statistical analyses were performed using Prism 8.0.1 (GraphPad Software, Inc.). Unless otherwise noted in figure legends or distinct method analysis, P values indicate statistical significance denoted by *P < 0.05, **P < 0.01, ***P < 0.005, ****P < 0.0001, and not significant by P > 0.05. Figures were drafted in PowerPoint 2016 (Microsoft) and finalized using Illustrator 2021 (Adobe). Some images were adapted from BioRender.com (2020). All experiments were repeated in at least three sets, and sample sizes for reproducibility are indicated in the figure legends. Where representative images for fluorescence staining, immunohistochemical staining and immunoblot are shown, these results were independently observed three times. When possible, the investigators were blinded during experiments and outcome assessment; this is noted in Methods for those experiments typically performed by collaborators.
Reporting Summary.
Further information regarding research design is available in the Nature Research Reporting Summary linked to this article.
Data availability
The mass spectrometry proteomics data have been deposited with the ProteomeXchange46 Consortium via the PRIDE partner repository with the dataset identifier PXD023440. The SwissProt database (SwissProt.2019.07.31) was used for mouse subset comparison of data. All remaining data are available within the manuscript and Supplementary information. eIF4E+/− mice can be made available following completion of a material agreement transfer with D.R. Further information and requests for resources should be directed to D.R. for fulfilment. Source data are provided with this paper.
Extended Data
Extended Data Fig. 1 |. eIF4E dose does not influence growth, movement, or food intake.
a, Body weight for WT and eIF4e+/− C57BL/6 J male mice on regular chow diet for indicated durations (n = 20, 6, 3 for each genotype). Values represent the mean ± SeM, of independent biological replicates. b, Whole body fat percentage by echo-MRI data of mice on regular diet (n = 6, 6). c, Monitored food intake of regular chow diet in mice over 24 hr (n = 6, 6). d, Monitored movement of mice on regular chow diet over 24 hr (n = 6, 6). Violin plots show all independent biological replicates with the median as a dotted black line and the upper and lower quartiles as light grey lines.
Extended Data Fig. 2 |. Metabolic hormones, fat tissue, adipogenesis and thermogenesis are not altered by eIF4E dose.
a, Leptin and other metabolic hormone concentrations in plasma of mice on labelled diets for 20 weeks (n = 4 for WT mice, n = 3 for eIF4e+/−). b, Indicated tissue weight relative to body weight per mouse; WAT is from perigonadal region (PGF). Violin plots show all independent biological replicates with the median as a dotted black line and the upper and lower quartiles as light grey lines. c, Representative images of H&e stained BAT and WAT from mice on HFD 20 weeks, (reviewed n = 4, 4 per tissue) WAT quantified in (d). Scale bar represents 100 um (BAT) and 200 um (WAT). d, Lipid droplet quantification by size per mouse, left, and average across mice (n = 4, 4), right. e, Seeded inguinal (Ing) white adipocytes on day 0 of stimulating adipogenesis, day 4, and day 6 after oil red staining of lipids (repeated in triplicate per tissue, with biological replicates per genotype). Black scale bar represents 50 μm. f, Seeded brown adipose tissue (BAT) isolated adipocytes on day 0 of stimulating adipogenesis, day 4, and day 6 after oil red staining of lipids (repeated in triplicate per tissue, with biological replicates per genotype). Black scale bar represents 50 μm. g, Relative transcript levels in WAT tissue (n = 4, 3 of independent biological replicates with mean ± SeM). h, Representative immunoblots from BAT and WAT from mice on HFD 20 weeks, left, and quantification of UCP1 protein levels (n = 3, 3 of independent biological replicates with mean ± SeM), right. All values are taken of independent biological replicates, ns = P > 0.05, unpaired two-tailed Student’s t test.
Extended Data Fig. 3 |. Global protein synthesis remains unperturbed by eIF4E dose on HFD in liver tissue.
Representative polysome profiles from in vivo liver tissue from mice on HFD for 20 weeks.
Extended Data Fig. 4 |. eIF4E dose has select metabolic effects, altering lipolysis but not lipid uptake.
a, Relative proliferation at indicated time points in AML12 cells (n = 3, 3). Violin plots show all independent replicates with the median as a dotted black line and the upper and lower quartiles as light grey lines. b, Representative flow plots from AML12 cells stained with AnnexinV and PI, left, with relative viability quantified, right (n = 3, 3 independent replicates). c, Representative polysome profile from AML12 cells. d, Representative qPCR analysis of Plin2 mRNA isolated from sucrose gradient fractions of AML12WT and AML124e+/− cells treated with oleic acid for 4 hr. Values correspond to the percentage of total mRNA across the fractions with free ribosomal subunits correspond to fractions 3–5, 80 S monosome or low polysome fractions 6–10, and high polysomes within fractions 11–14 (n = 3, 3 technical replicates, mean ± SeM, *P < 0.05; ****P < 0.0001 by unpaired, two-tailed Student’s t test). e, qPCR analysis of Plin2 mRNA of AML12WT and AML124e+/− cells treated with oleic acid for 4 hours (n = 3, 3 independent replicates, mean ± SeM, ****P < 0.00004 unpaired, two-tailed Student’s t test). f, Representative qPCR analysis of β-actin mRNA isolated from sucrose gradient fractions (n = 3, 3 technical replicates).
Extended Data Fig. 5 |. Circulating lipids and 18F-FTHA lipid uptake into metabolic tissues.
a, Free fatty acids quantified in plasma from mice on 20 weeks HFD (n = 5 WT per diet, 3 eIF4e+/− per diet), mean ± SeM, comparison between Chow and HFD groups, *P < 0.013 by unpaired, two-tailed Student’s t test. b, Lipids quantified in plasma from mice on 20 weeks HFD (n = 5 WT per diet, 3 eIF4e+/− per diet), mean ± SEM, comparison on HFD LDL *P = 0.0317; comparison between Chow and HFD groups, ****P < 0.00005 by unpaired, two-tailed Student’s t test. c, 18F-FTHA expression in ROI drawn per tissue indicated (n = 1 per Chow mice as representative [based on maximum scan time for stability of isotope]; n = 3, 3 independent biological mice per experimental HFD group).
Extended Data Fig. 6 |. Metabolomics grouping by genotype highlighting top altered detected compounds.
a, Ortho PLS-DA plots each point represents an individual sample of mouse liver from 20 weeks on HFD, and how similar that sample is per all detected compounds compared to others run. eIF4e+/− liver samples clustered similar and separate from WT liver samples (n = 3, 5 respectively). b, Heatmap depicting the top 10% of metabolites increased or decreased across those detected (64/320). Lipids and carnitines showed strongest trend.
Extended Data Fig. 7 |. A decrease in eIF4E dose increases lipolysis and mitochondria numbers.
a, Relative glycerol released from cells after 3 hr as an index of lipolysis levels in AML12 cells in basal condition or with 100 μM isoproterenol stimulation (n = 3, 3 independent replicates per group), mean ± SeM, ns = P > 0.05; *P = 0.016; by two-way ANOVA. Glycerol levels were normalized by cell number. b, Relative mitochondria abundance. (n = 3, 3 independent replicates per group), mean ± SeM, ns = P > 0.05; *P = 0.043; by two-way ANOVA.
Extended Data Fig. 8 |. PPAR and FAO pathway expression is independent of eIF4E effects during HFD-induced obesity.
a, Heatmap of KeGG pathway proteins depicted relative expression color coded log2 (fold change) (Log2FC) across biological triplicates of WT and eIF4e+/− livers on HFD (n = 3 per group of independent biological replicates). b, qPCR analysis of relative mRNA levels of labelled transcripts in WT or eIF4e+/− (n = 4, 4 independent biological replicates, mean ± SD) liver on HFD for 20 weeks, β-actin was used as internal control. c, Representative immunoblots of targets from mass spectral analysis between diets and genotypes (validated in three or more independent biological replicates). d, Representative qPCR analysis of Scd1 isolated from sucrose gradient fractions of WT or eIF4e+/− liver on HFD. Values correspond to the percentage of total mRNA across the fractions where free ribosomal subunits correspond to lower fractions 1–5, 80 S monosome or low polysome fractions 6–10, and high polysomes within fractions 11–14 (n = 3, 3 technical replicates); mean ± SD, *P < 0.05; **P < 0.01; by unpaired two tailed Student’s t test. e, f, Whole-body oxygen consumption rate of WT and eIF4e+/− mice on HFD for three days per 12 hr cycle (n = 6, 6). Violin plots show all data points with a black dotted line indicating the median and light gray lines for the upper and lower quartiles; *P < 0.05; **P < 0.01; *** P < 0.005; ****P < 0.0001 by two-way ANOVA.
Extended Data Fig. 9 |. Genetic loss of eIF4E S209 or eFT508 treatment during HFD prevents weight gain in liver tissue.
a, Representative immunoblots for mTOR signaling. Same samples were loaded on two gels to capture large and small proteins (blots marked by vertical black line), left, and quantification, right, in indicated samples (n = 3 or more independent biological samples). Data represents mean ± SeM, *P = 0.019; ***P = 0.0002 by unpaired, two-tailed Student’s t test. b, Liver tissue or Brain (control tissue) weight from mice after 18 weeks on HFD with either Vehicle or eFT508 treatment (n = 3, 4 independent biological samples); mean ± SeM, ****P < 0.0001, unpaired, two-tailed Student’s t test. c, Food intake, average per day, per mouse on either Chow or HFD with Vehicle or eFT508 (n = 4, 4). d, qPCR analysis of relative mRNA levels of labelled transcripts in Vehicle or eFT508 treated (n = 3, 3) liver on HFD for 20 weeks, β-actin was used as internal control. e, Representative immunoblots between treatment, protein amount was quantified independently by Mass spectral analysis (n = 3, 3 independent biological replicates). f, Heatmap of depicted relative expression color coded log2 (fold change) (Log2FC) across independent biological samples from WT, eIF4e+/−, eIF4eS209A livers as labeled.
Supplementary Material
Acknowledgements
We thank members of the Ruggero laboratory for discussion, and the Mouse Pathology, Preclinical Therapeutics, and Biomedical Imaging Core facilities at UCSF for their assistance in our study. We thank J. Blecha at UCSF for synthesis of [18F]FTHA. We thank eFFECTOR Therapeutics for supplying eFT508. We thank the VUMC Hormone Assay & Analytical Services and Lipid Core and the Children’s Medical Center Research Institute at the University of Texas Southwestern Medical Center for performance and analysis of targeted metabolomics. Mass spectrometry was provided by the Mass Spectrometry Resource at UCSF (A.L. Burlingame, Director) supported by the Dr Miriam and Sheldon G. Adelson Medical Research Foundation and the UCSF Program for Breakthrough Biomedical Research. C.S.C. was funded by the American Cancer Society (no. PF-14-212-01-RMC). H.Y. is funded by the American Heart Association (no. P0540503). Y.O. is supported by the JSPS Overseas Research Fellowships. S.K. is supported by NIH (no. DK97441). D.R. is a Leukemia and Lymphoma Society Scholar. This research was funded by NIH grant nos. R01CA184624 (D.R.) and R35CA242986 (D.R.) and by the American Cancer Society RP-19-181-01-RMC (American Cancer Society Research Professor Award) (D.R.). The VUMC Cores are supported by NIH grant nos. DK059637 (MMPC) and DK020593 (DRTC).
Footnotes
Additional information
Extended data is available for this paper at https://doi.org/10.1038/s42255-021-00349-z.
Supplementary information The online version contains supplementary material available at https://doi.org/10.1038/s42255-021-00349-z.
Peer review information Nature Metabolism thanks Andrew Murray, Nahum Sonenberg and the other, anonymous, reviewer(s) for their contribution to the peer review of this work. Primary Handling Editor: George Caputa.
Reprints and permissions information is available at www.nature.com/reprints.
Competing interests
R.J.D. is an advisor for Agios Pharmaceuticals. D.R. is a shareholder of eFFECTOR Therapeutics, Inc. and a member of its scientific advisory board. Other authors declare no competing interests.
References
- 1.World Health Organization. Fact Sheet – Obesity and Overweight. February 2018. (World Health Organization, 2018; ); https://www.who.int/news-room/fact-sheets/detail/obesity-and-overweight [Google Scholar]
- 2.World Health Organization. Obesity: Preventing and Managing the Global Epidemic. Report of a WHO Consultation. Technical Report Series 894 (World Health Organization, 2000); https://www.who.int/nutrition/publications/obesity/WHO_TRS_894/en/ [PubMed] [Google Scholar]
- 3.Hu S. et al. Dietary fat, but not protein or carbohydrate, regulates energy intake and causes adiposity in mice. Cell Metab. 28, 415–431 (2018). [DOI] [PubMed] [Google Scholar]
- 4.Walther TC, Chung J. & Farese RV Jr. Lipid droplet biogenesis. Annu. Rev. Cell Dev. Biol 33, 491–510 (2017). [DOI] [PMC free article] [PubMed] [Google Scholar]
- 5.Greenberg AS et al. The role of lipid droplets in metabolic disease in rodents and humans. J. Clin. Invest 121, 2102–2110 (2011). [DOI] [PMC free article] [PubMed] [Google Scholar]
- 6.Friedman SL, Neuschwander-Tetri BA, Rinella M. & Sanyal AJ Mechanisms of NAFLD development and therapeutic strategies. Nat. Med 24, 908–922 (2018). [DOI] [PMC free article] [PubMed] [Google Scholar]
- 7.Virtue S. & Vidal-Puig A. Adipose tissue expandability, lipotoxicity and the metabolic syndrome—an allostatic perspective. Biochim. Biophys. Acta 1801, 338–349 (2010). [DOI] [PubMed] [Google Scholar]
- 8.Font-Burgada J, Sun B. & Karin M. Obesity and cancer: the oil that feeds the flame. Cell Metab. 23, 48–62 (2016). [DOI] [PubMed] [Google Scholar]
- 9.Xu S, Zhang X. & Liu P. Lipid droplet proteins and metabolic diseases. Biochim. Biophys. Acta, Mol. Basis Dis 1864, 1968–1983 (2018). [DOI] [PubMed] [Google Scholar]
- 10.Stone TW, McPherson M. & Gail L. Darlington, obesity and cancer: existing and new hypotheses for a causal connection. EBioMedicine 30, 14–28 (2018). [DOI] [PMC free article] [PubMed] [Google Scholar]
- 11.Purdom T. et al. Understanding the factors that effect maximal fat oxidation. J. Int Soc. Sports Nutr 15, 3 (2018). [DOI] [PMC free article] [PubMed] [Google Scholar]
- 12.Truitt ML et al. Differential requirements for eIF4E dose in normal development and cancer. Cell 162, 59–71 (2015). [DOI] [PMC free article] [PubMed] [Google Scholar]
- 13.Collins S, Martin TL, Surwit RS & Robidoux J. Genetic vulnerability to diet-induced obesity in the C57BL/6J mouse: physiological and molecular characteristics. Physiol. Behav 81, 243–248 (2004). [DOI] [PubMed] [Google Scholar]
- 14.Tsukiyama-Kohara K. et al. Adipose tissue reduction in mice lacking the translational inhibitor 4E-BP1. Nat. Med 7, 1128–1132 (2001). [DOI] [PubMed] [Google Scholar]
- 15.Le Bacquer O. et al. Elevated sensitivity to diet-induced obesity and insulin resistance in mice lacking 4E-BP1 and 4E-BP2. J. Clin. Invest 117, 387–396 (2007). [DOI] [PMC free article] [PubMed] [Google Scholar]
- 16.Le Bacquer O. et al. Muscle metabolic alterations induced by genetic ablation of 4E-BP1 and 4E-BP2 in response to diet-induced obesity. Mol. Nutr. Food Res 10.1002/mnfr.201700128 (2017). [DOI] [PubMed] [Google Scholar]
- 17.Zhang X. NAFLD related-HCC: the relationship with metabolic disorders. Adv. Exp. Med. Biol 1061, 55–62 (2018). [DOI] [PubMed] [Google Scholar]
- 18.Gluchowski NL, Becuwe M, Walther TC & Farese RV Jr. Lipid droplets and liver disease: from basic biology to clinical implications. Nat. Rev. Gastroenterol. Hepatol 14, 343–355 (2017). [DOI] [PMC free article] [PubMed] [Google Scholar]
- 19.Kimmel AR & Sztalryd C. The perilipins: major cytosolic lipid droplet-associated proteins and their roles in cellular lipid storage, mobilization, and systemic homeostasis. Annu. Rev. Nutr 36, 471–509 (2016). [DOI] [PubMed] [Google Scholar]
- 20.Wu JC, Merlino G. & Fausto N. Establishment and characterization of differentiated, nontransformed hepatocyte cell lines derived from mice transgenic for transforming growth factor alpha. Proc. Natl Acad. Sci. USA 91, 674–678 (1994). [DOI] [PMC free article] [PubMed] [Google Scholar]
- 21.Onal G, Kutlu O, Gozuacik D. & Dokmeci S. Emre, lipid droplets in health and disease. Lipids Health Dis. 16, 128 (2017). [DOI] [PMC free article] [PubMed] [Google Scholar]
- 22.Najt CP et al. Structural and functional assessment of perilipin 2 lipid binding domain(s). Biochemistry 53, 7051–7066 (2014). [DOI] [PMC free article] [PubMed] [Google Scholar]
- 23.Fukushima M. et al. Adipose differentiation related protein induces lipid accumulation and lipid droplet formation in hepatic stellate cells. Vitr. Cell Dev. Biol. Anim 41, 321–324 (2005). [DOI] [PubMed] [Google Scholar]
- 24.McManaman JL et al. Perilipin-2-null mice are protected against diet-induced obesity, adipose inflammation, and fatty liver disease. J. Lipid Res 54, 1346–1359 (2013). [DOI] [PMC free article] [PubMed] [Google Scholar]
- 25.Ciapaite J. et al. Differential effects of short- and long-term high-fat diet feeding on hepatic fatty acid metabolism in rats. Biochim. Biophys. Acta 1811, 441–451 (2011). [DOI] [PubMed] [Google Scholar]
- 26.Turcotte LP, Richter EA & Kiens B. Increased plasma FFA uptake and oxidation during prolonged exercise in trained vs. untrained humans. Am. J. Physiol. Endocrinol. Metab 262, E791–E799 (1992). [DOI] [PubMed] [Google Scholar]
- 27.Najt CP et al. Liver-specific loss of Perilipin 2 alleviates diet-induced hepatic steatosis, inflammation, and fibrosis. Am. J. Physiol. Gastrointest. Liver Physiol 310, G726–G738 (2016). [DOI] [PMC free article] [PubMed] [Google Scholar]
- 28.Dobrzyn P. et al. Stearoyl-CoA desaturase 1 deficiency increases fatty acid oxidation by activating AMP-activated protein kinase in liver. Proc. Natl Acad. Sci. USA 101, 6409–6414 (2004). [DOI] [PMC free article] [PubMed] [Google Scholar]
- 29.Mina AI et al. CalR: a web-based analysis tool for indirect calorimetry experiments. Cell Metab. 28, 656–666 (2018). [DOI] [PMC free article] [PubMed] [Google Scholar]
- 30.Um SH et al. Absence of S6K1 protects against age- and diet-induced obesity while enhancing insulin sensitivity. Nature 431, 200–205 (2004). [DOI] [PubMed] [Google Scholar]
- 31.Wendel HG et al. Dissecting eIF4E action in tumorigenesis. Genes Dev. 21, 3232–3237 (2007). [DOI] [PMC free article] [PubMed] [Google Scholar]
- 32.Hay N. Mnk earmarks eIF4E for cancer therapy. Proc. Natl Acad. Sci. USA 107, 13975–13976 (2010). [DOI] [PMC free article] [PubMed] [Google Scholar]
- 33.Furic L. et al. eIF4E phosphorylation promotes tumorigenesis and is associated with prostate cancer progression. Proc. Natl Acad. Sci. USA 107, 14134–14139 (2010). [DOI] [PMC free article] [PubMed] [Google Scholar]
- 34.Ueda T, Watanabe-Fukunaga R, Fukuyama H, Nagata S. & Fukunaga R. Mnk2 and Mnk1 are essential for constitutive and inducible phosphorylation of eukaryotic initiation factor 4E but not for cell growth or development. Mol. Cell. Biol 24, 6539–6549 (2004). [DOI] [PMC free article] [PubMed] [Google Scholar]
- 35.Saltiel AR & Olefsky JM Inflammatory mechanisms linking obesity and metabolic disease. J. Clin. Invest 127, 1–4 (2017). [DOI] [PMC free article] [PubMed] [Google Scholar]
- 36.Koyama Y. & Brenner DA Liver inflammation and fibrosis. J. Clin. Invest 127, 55–64 (2017). [DOI] [PMC free article] [PubMed] [Google Scholar]
- 37.Legland D, Arganda-Carreras I. & Andrey P. MorphoLibJ: integrated library and plugins for mathematical morphology with ImageJ. Bioinformatics 32, 3532–3534 (2016). [DOI] [PubMed] [Google Scholar]
- 38.Kleiner DE et al. Nonalcoholic steatohepatitis clinical research network: design and validation of a histological scoring system for nonalcoholic fatty liver disease. Hepatology 41, 1313–1321 (2005). [DOI] [PubMed] [Google Scholar]
- 39.Guan S, Price JC, Prusiner SB, Ghaemmaghami S. & Burlingame AL Mol. Cell. Proteomics 10, M111.010728 (2011). [DOI] [PMC free article] [PubMed] [Google Scholar]
- 40.Clauser KR et al. Role of accurate mass measurement (+/−10 ppm) in protein identification strategies employing MS or MS/MS and database searching. Anal. Chem 71, 2871–2882 (1999). [DOI] [PubMed] [Google Scholar]
- 41.Ritchie ME et al. Limma powers differential expression analyses for RNA-sequencing and microarray studies. Nucleic Acids Res. 43, e47 (2015). [DOI] [PMC free article] [PubMed] [Google Scholar]
- 42.Grover M. et al. Proteomics in gastroparesis: unique and overlapping protein signatures in diabetic and idiopathic gastroparesis. Am. J. Physiol. Gastrointest. Liver Physiol 317, G716–G726 (2019). [DOI] [PMC free article] [PubMed] [Google Scholar]
- 43.Janabi M, Gullberg GT & O’Neil JP The use of GE’s automated synthesis module (FxFN) for the production of [18F]fluorodihydrorotenol (FDHROL) and [18F]fluoro-thia-6-heptadecanoic acid. J. Labelled Comp. Radiopharm 54, S431 (2011). [Google Scholar]
- 44.Liu X. et al. Ablation of ALCAT1 mitigates hypertrophic cardiomyopathy through effects on oxidative stress and mitophagy. Mol. Cell. Biol 32, 4493–4504 (2012). [DOI] [PMC free article] [PubMed] [Google Scholar]
- 45.Iuso A. et al. Assessing mitochondrial bioenergetics in isolated mitochondria from various mouse tissues using Seahorse XF96 Analyzer. Methods Mol. Biol 1567, 217–230 (2017). [DOI] [PubMed] [Google Scholar]
- 46.Deutsch EW et al. The ProteomeXchange consortium in 2020: enabling ‘big data’ approaches in proteomics. Nucleic Acids Res. 48, D1145–D1152 (2020). [DOI] [PMC free article] [PubMed] [Google Scholar]
Associated Data
This section collects any data citations, data availability statements, or supplementary materials included in this article.
Supplementary Materials
Data Availability Statement
The mass spectrometry proteomics data have been deposited with the ProteomeXchange46 Consortium via the PRIDE partner repository with the dataset identifier PXD023440. The SwissProt database (SwissProt.2019.07.31) was used for mouse subset comparison of data. All remaining data are available within the manuscript and Supplementary information. eIF4E+/− mice can be made available following completion of a material agreement transfer with D.R. Further information and requests for resources should be directed to D.R. for fulfilment. Source data are provided with this paper.


