Abstract
Aims
Linear lesions are routinely created by radiofrequency catheter ablation. Unwanted electrical conduction gaps can be produced and are often difficult to ablate. This study aimed to clarify the characteristics of conduction gaps during atrial fibrillation ablation by analysing bidirectional activation maps using a high-density mapping system (RHYTHMIA).
Methods and results
This retrospective study included 31 patients who had conduction gaps along pulmonary vein (PV) isolation or box ablation lesions. Activation maps were sequentially created during pacing from the coronary sinus and PV to reveal the earliest activation site, defined by the entrance and exit. The locations, length between the entrance and exit (gap length), and direction were analysed. Thirty-four bidirectional activation maps were drawn: 21 were box isolation lesions (box group), and 13 were PV isolation lesions (PVI group). Among the box group, nine conduction gaps were present in the roof region and 12 in the bottom region, while nine in right PV and four in left PV among the PVI group. Gap lengths in the roof region were longer than those in the bottom region (26.8 ± 11.8 vs. 14.5 ± 9.8 mm; P = 0.022), while those in right PV tended to longer than those in left PV (28.0 ± 15.3 vs. 16.8 ± 8.0 mm, P = 0.201).
Conclusion
The entrances and exits of electrical conduction gaps were separated, especially in the roof region, indicating that epicardial conduction might contribute to gap formation. Identifying the bidirectional conduction gap might indicate the location and direction of epicardial conduction.
Keywords: Catheter ablation, Conduction gap, Atrial fibrillation, High-density mapping, Epicardial conduction
Graphical Abstract
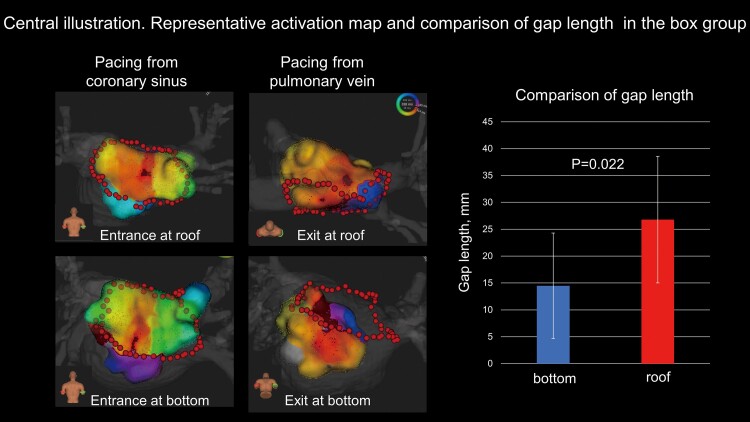
Graphical abstract.
Bidirectional activation maps for conduction gap at roof and bottom are shown. The length between the entrance and exit (gap length) is longer at roof line than bottom line (26.8 ± 11.8 vs. 14.6 ± 9.8 mm, P = 0.022).
What’s new?
The entrance and exit of incomplete pulmonary vein ablation lesions were often far from each other, indicating that epicardial conduction might contribute to gap formation.
The LUMIPOINT algorithm visualized the far-field potential, which might represent epicardial electrograms and epicardial conduction breakthroughs beyond the ablation line.
Anisotropic conduction was clearly observed at the posterior wall of the left atrium.
Introduction
Electrical pulmonary vein (PV) isolation by catheter ablation is an established treatment for paroxysmal atrial fibrillation (AF).1 In persistent AF, the clinical benefit of a single ring box isolation, including all four PVs and the left atrial (LA) posterior wall, over PV isolation alone, has been reported.2 Since electrical reconnection of PVs is one of the leading causes of AF recurrence, complete PV isolation is of the utmost importance.3 Single circumferential radiofrequency (RF) applications may be insufficient to achieve PV or box isolation. In such cases, identifying the electrical conduction gaps and additional RF applications is required to complete the electrical isolation. This can be challenging, especially at the roof and bottom lines in box isolation because of complex gap pathways or weak electrogram signals within the ablation scar.
The RHYTHMIA mapping system (Boston Scientific, Cambridge, MA, USA) is capable of rapid, ultra-high-resolution, electro-anatomical, and activation mapping. It has effectively identified conduction gaps in linear lesions in canine models4 and is reportedly useful in identifying conduction gaps in PV ablation or the critical isthmus of atrial tachycardia.5–7
We hypothesized that creating bidirectional activation maps of the LA using the RHYTHMIA mapping system would identify conduction gaps and aid in analysing their characteristics and differences between their entrances and exits.
Methods
Study population
From January 2020 to June 2021, AF ablation was performed in 268 patients at Keio University Hospital. Bidirectional activation maps were created when electrical isolation was not accomplished after single circumferential RF application. We developed maps along the PV (PVI group) and box lesions (box group). For patients who had undergone prior AF ablation, bidirectional activation maps were created if reconnected PV or box isolation was present. Data on clinical variables were obtained from all patients. The study protocol was approved by the Institutional Review Board Committee of the hospital. All participants provided written informed consent.
Catheter ablation procedure
Oral anticoagulation therapy was introduced at least 1 month before ablation. All anti-arrhythmic drugs were discontinued for at least five half-lives before ablation. Patients underwent cardiac computed tomography to rule out thrombus in the LA appendage and to obtain three-dimensional LA geometries.
Ablations were performed under deep sedation with propofol and monitored using a bispectral index monitor (Aspect Medical Systems, Newton, MA, USA), maintaining a value between 40 and 60. An oral airway and facial mask for auto servo-ventilation (ResMed, Teijin, Tokyo, Japan) were provided to stabilize respiration. Unfractionated heparin was administered before trans-septal puncture to maintain an activated clotting time of 300–400 s. To record the His-bundle electrogram with proximal electrodes, a multielectrode catheter was introduced into the right ventricle through the femoral vein. Another catheter was introduced into the coronary sinus (CS) via the right jugular vein to record the right atrial and superior vena caval electrograms and for intracardiac electrical cardioversion. An IntellaTip MiFi or IntellaNav StablePoint (Boston Scientific, Cambridge, MA, USA) open-irrigated ablation catheter and an IntellaMap Orion (Boston Scientific, Cambridge, MA, USA) 64 mini-electrode basket catheter were inserted into the LA via the right femoral vein. Two septal punctures were made to access the LA. The procedures were performed under RHYTHMIA electroanatomic mapping system guidance.
The strategies for initial AF ablation were ipsilateral circumferential PV isolation for paroxysmal AF and single ring box isolation for persistent AF. The ablation strategy for recurrent AF was electrical isolation of the reconnected PV or box ablation lesions. RF energy was also delivered for non-PV triggers or atrial tachycardias repeatedly induced by programmed electrical stimulation, with or without isoproterenol infusion. Further ablation was performed at the operator’s discretion. The RF energy was delivered using the same RF generator (Maestro 4000; Boston Scientific, Cambridge, MA) in the power-controlled mode, with power delivery set at 35 W (25 W near the oesophagus). RF application was monitored by a local impedance drop for the MiFi ablation catheter and by contact force and a local impedance drop for the StablePoint ablation catheter. The target local impedance drop for an RF application was 20–40 Ω for the MiFi ablation catheter. The target contact force for an RF application was 10–30 g for the StablePoint ablation catheter, and the RF application was forcibly stopped when the local impedance drop reached 50 Ω. Our target interval of each RF application for a first-pass circumferential ablation was 4–5 mm. In addition, we confirmed the average RF application interval for each case after the ablation procedures in de novo cases; the anatomic length of a first-pass circumferential line on cardiac computed tomography was divided by the number of RF application for a first-pass circumferential line. For both catheters, RF application was stopped when the duration reached 30 s or the oesophageal temperature reached 39°C. Surface and endocardial electrograms were continuously monitored and recorded for offline analysis (Bard Electrophysiology, Boston Scientific, Cambridge, MA, USA). The intracardiac electrogram was filtered from 30 to 250 Hz and measured at a sweep speed of 100 mm/s.
Electrical conduction gap mapping
The conduction gap between the PV and LA was identified using the Orion catheter. Electrical cardioversion was performed if the patient had AF before mapping. The tightness for geometry setting and projection distance were set at the minimum values in the RHYTHMIA mapping system. Fill threshold was set at 5 mm. The PV side of the conduction gap was the earliest activation site within the PV or box ablation lesions during the pacing from the CS with cycle length of 600 ms; this was denoted as the entrance of the conduction gap. The LA side of the conduction gap had the earliest activation outside the PV or box ablation lesions during the pacing from the PV with cycle length of 600 ms; this was denoted as the exit of the conduction gap. The local activation timing was automatically annotated on the largest bipolar amplitude signal, and the consistency with neighbouring points was considered. The beat acceptance criteria comprised the stable cycle length, stable propagation time between the two CS reference electrodes, expiration phase, stable catheter motion, reproducible beats, and tracking quality. After creating it, we confirmed that the three-dimensional map did not have any unnatural dents and that it matched the three-dimensional LA geometry constructed by cardiac computed tomography. The gap length was defined as the length between the entrance and exit and was measured using the three-dimensional map geometry. The gap lengths were compared between both groups. The RF application distance at the conduction gap were defined as a distance between two RF application tags where the straight line between the entrance and exit and the ablation line were intersected. The RF application distance at the conduction gap and average RF application interval were compared, and the relation between the RF application distance at conduction gap and gap length were evaluated.
In the box group, the vertical (upward and downward) and horizontal (rightward and leftward) endocardial activation speed at the entrance and exit were measured to investigate the conduction characteristics of the LA myocardium around the gaps. The endocardial activation speed was calculated using an isochronal map; the vertical activation speed was calculated by dividing the longest distance from the earliest point after 10 ms by 10 ms, and the horizontal activation speed was defined as the directional activation speed perpendicular to the vertical conduction. Activation speed ratio was defined as the ratio between vertical and horizontal activation speeds in order to demonstrate the anisotropic conduction at the LA posterior wall. Additionally, we drew a straight line between the entrance and exit (gap direction line) and measured the angle at the intersection points between this line and the ablation line (gap conduction angle).
The bidirectional maps were also analysed using LUMIPOINT software, whose activation algorithm evaluated all detectable deflections above the baseline noise for local consistency to distinguish actual cardiac activations from artefacts, including the small electrograms that were not annotated in the standard mapping algorithm. The SKYLINE histogram displays the relative surface area of the map that shows activation at a particular point within the mapping window. A high y-axis value indicates a larger activation area, while a low value indicates that a smaller area is activating. Additionally, the LUMIPOINT software can depict split and complex activations. Split activation illuminates the regions of split activation. Complex activation illuminates electrograms in which at least one component falls within the secondary activation window. The peak slider is used to adjust the number of peaks necessary to classify a signal as a complex activation. In the box group, the locations of split and complex activations along the incomplete ablation line were analysed to show the contribution of the epicardial conduction to gap formation.
After bidirectional assessment of the conduction gaps, we placed the Orion catheter in the PV and applied RF energy to complete the PV or box isolation, ablating the conduction gap exit. If RF was ineffective, we moved the ablation catheter towards the conduction gap entrance and reapplied RF. If a change was observed in the atria or PV activation sequence during RF application, the other conduction gap was assumed to still be present. We created a second bidirectional activation map to identify the remaining conduction gaps.
Statistical analysis
Continuous variables are presented as means and standard deviations and categorical variables as numbers and percentages. Group differences were evaluated using the t-test for continuous variables. A linear regression analysis was calculated to determine the relationships. All statistical calculations and analyses were performed using SPSS (version 24.0; IBM Corp., Armonk, NY, USA). Differences were considered statistically significant at P < 0.05.
Results
Study participants
Among 268 patients with AF ablations, 202, 53, 10, and 3 underwent the first, second, third, and fourth sessions, respectively; 45 underwent single ring box isolation, and 223 underwent ipsilateral circumferential PV isolation during initial AF ablation. Thirty-four bidirectional activation maps (21 in the box group and 13 in the PVI group) were created for 31 patients (18 in the box group and 13 in the PVI group), consisting of de novo (29 maps) and previous (5 maps) lesions. In de novo cases, the average RF application interval for the first-pass circumferential ablation was 4.1 ± 0.5 mm.
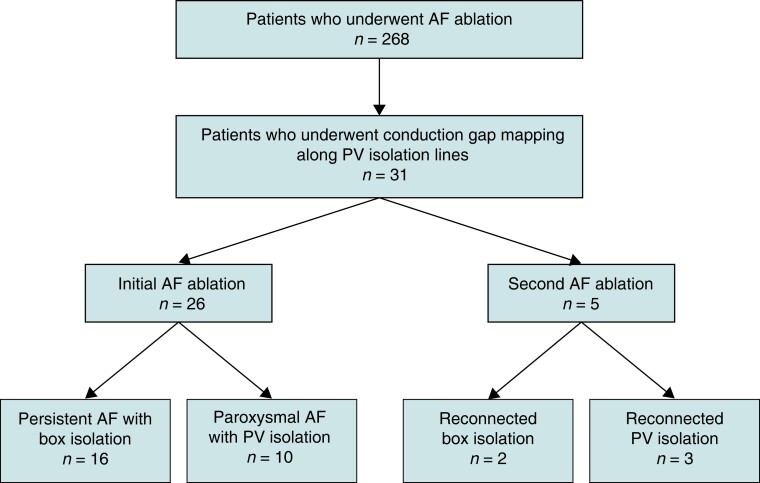
Of the 31 patients for whom bidirectional activation maps were created, 26 (10 with paroxysmal AF and 16 with persistent AF) underwent initial AF ablation, while five (three with ipsilateral circumferential PV isolations and two with box isolations) underwent a second one. The flowchart of the study is shown in Figure 1. The baseline characteristics of the 31 patients (26 men and 5 women) are shown in Table 1. One patient had dilated cardiomyopathy, two had hypertrophic cardiomyopathy, and the rest had no structural heart disease. In three patients from the box group, RF was applied after mapping, and changes in the activation sequence of the atria or PV during ablation were observed. Therefore, we created a second bidirectional activation map to identify the remaining conduction gaps. In such cases, the conduction gap locations changed from the bottom to the roof region.
Figure 1.
Flowchart of the patients. AF, atrial fibrillation; box isolation, simultaneous electrical isolation of all four PVs; PV, pulmonary vein.
Table 1.
Baseline characteristics of the study population
| Characteristic | n = 31 |
|---|---|
| Age, years | 60.6 ± 9.8 |
| Body mass index, kg/m2 | 25.3 ± 4.1 |
| LA diameter, mm | 41.3 ± 7.1 |
| CHA2DS2-VASc score | 1.5 ± 1.0 |
| Female | 5 (16.1) |
| AF type (paroxysmal) | 10 (32.3) |
| AF type (recurrent) | 5 (16.1) |
| Heart failure | 3 (9.7) |
| Hypertension | 15 (48.4) |
| Diabetes | 6 (19.4) |
| Stroke | 0 (0.0) |
| Coronary artery disease | 0 (0.0) |
Data are presented as the number of patients (%) or mean ± standard deviation.
AF, atrial fibrillation; CHA2DS2-VASc, heart failure, hypertension, age 75 years (doubled), diabetes mellitus, stroke (doubled), vascular disease, age 65–74 years, and female sex; LA, left atrium.
PV or box isolation was completed using our ablation method in 26 patients. Single ring box isolations were not accomplished in four patients in the box group. Therefore, we changed our strategy to ipsilateral PV isolation; the electrical gaps remained at the roof lesion in two patients and at the bottom lesion in two. In one patient in the PVI group, a relatively long (38.8 mm) gap remained at the posterior portion of the right PV, whose exit was at the LA posterior wall. Therefore, we added the roof and bottom lines to simultaneously isolate the LA posterior wall and right PV. No complications occurred in any of the patients.
Bidirectional activation mapping
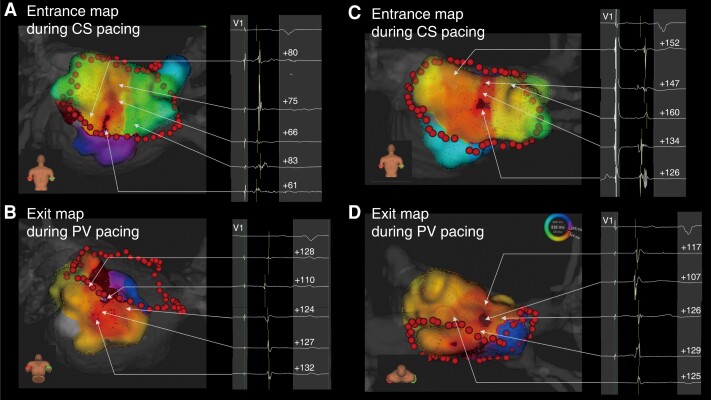
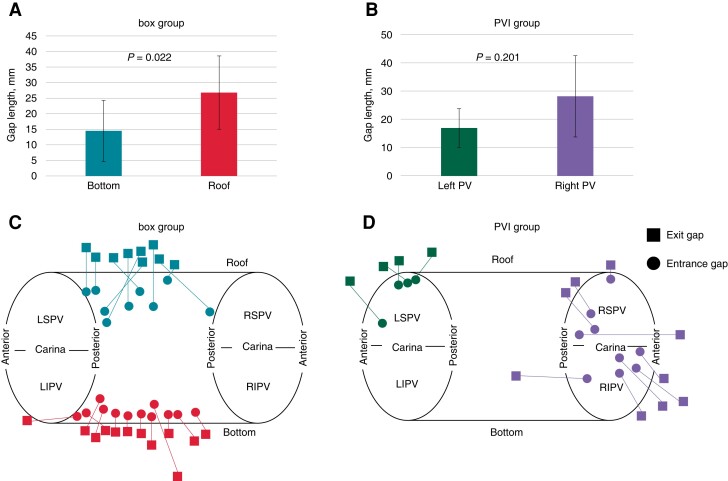
Thirty-four bidirectional activation maps were created (21 in the box group and 13 in the PVI group), with parameters listed in Table 2. The mean, median, minimum, and maximum gap lengths were 21.6 ± 13.0, 17.5 (11.8–30.5), 3.8, and 57.2 mm, respectively. Representative cases with short and long gap lengths are shown in Figure 2. In the box group, nine maps showed conduction gaps at the roof lesion, while 12 showed them at the bottom lesion. The gap length was significantly longer at the roof than at the bottom lesions (26.8 ± 11.8 vs. 14.6 ± 9.8 mm, P = 0.022) (Figure3A, C). In the PVI group, the conduction gaps were located around the right PV in nine maps and around the left PV in four. The gap length tended to be longer around the right than the left PV, although there was no significant difference (28.0 ± 15.3 vs. 16.8 ± 8.0 mm, P = 0.201) (Figure 3B, D). Figure 3C and 3D show the entrance and exit locations in the LA; the linear length between the entrance and exit correlated with the actual gap length. The distance between the RF applications at the conduction gaps was significantly longer than the average RF application interval (5.5 ± 1.6 vs. 4.1 ± 0.5 mm, P < 0.01). The gap length and the RF application distance at the conduction gap were not correlated each other (r = − 0.33 and P = 0.864). Among the box group, the RF application distance at the conduction gaps were not significantly different between the roof and bottom regions (5.8 ± 1.3 vs. 5.6 ± 2.2 mm, P = 0.809).
Table 2.
Electroanatomic gap map parameters
| Variable | n = 34 |
|---|---|
| Entrance map point, n | 3498.3 ± 1701.3 |
| Entrance map time, s | 344.2 ± 154.5 |
| Exit map point, n | 2500.5 ± 1036.4 |
| Exit map time, s | 344.6 ± 159.4 |
| Gap length, mm | 21.6 ± 13.0 |
| Gap length using LUMIPOINT, mm | 19.2 ± 13.0 |
Data are presented as mean ± standard deviation. Gap length is defined as the length between the entrance and exit.
Figure 2.
Bidirectional activation maps of the electrical conduction gap. (A, B) Example of a short gap length at the bottom lesion. (C, D) Example of a long gap length at the roof lesion. CS, coronary sinus; PV, pulmonary vein.
Figure 3.
Regional distribution of the entrances and exits and their gap lengths. (A) The gap length is longer at the roof lesion than at the bottom lesion in the box group (26.8 ± 11.8 and 14.6 ± 9.8 mm, respectively; P = 0.022). (B) The gap length tends to be longer around the right PV than around the left PV, although there is no significant difference (28.0 ± 15.3 vs. 16.8 ± 8.0 mm, P = 0.201). (C, D) The conduction gaps are located at the roof lesion in nine cases and at the bottom lesion in 12 cases in the box group and around the right PV in nine cases and around the left PV in four cases in the PVI group. ▪ and ● indicate exit and entrance, respectively. The linear length between the entrance and exit correlates with the actual gap length. PV, pulmonary vein; LIPV, left inferior pulmonary vein; RIPV, right inferior pulmonary vein; LSPV, left superior pulmonary vein; RSPV, right superior pulmonary vein.
Among the box group, there were two redo procedural cases; one conduction gap location was at the roof region and the other at the bottom region. The gap lengths were 5.3 and 11.4 mm at the roof and bottom regions, respectively. On the other hand, the PVI group comprised three redo procedures; two conduction gap locations were at the right PV with gap lengths of 22.4 and 17.0 mm, respectively, and one was at the left PV with a 13.2 mm gap length. In the meantime, the average gap lengths in de novo cases were 29.5 ± 10.2, 14.7 ± 10.7, 30.0 ± 16.9, and 18.0 ± 9.3 mm at roof, bottom, right pulmonary vein, and left pulmonary vein, respectively.
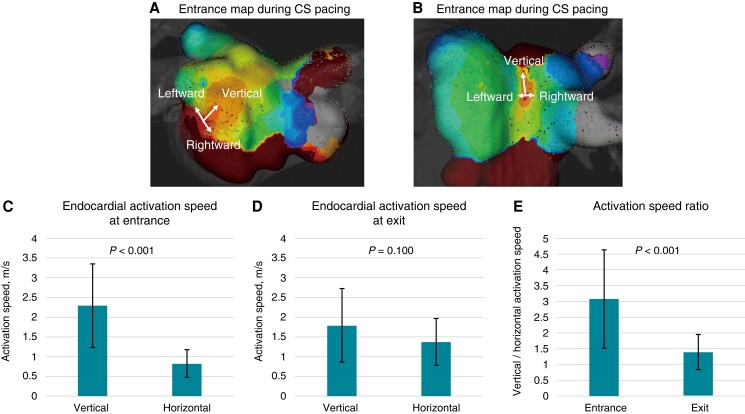
Representative activation maps illustrating endocardial activation speeds at the LA posterior wall are shown in Figure 4A, B. Endocardial activation speeds in the vertical direction were faster than in the horizontal direction at the box lesion entrances, whereas they did not differ at the exits. The activation speed ratios between the two directions were significantly higher at the entrance than at the bottom (Figure 4C–E). The entrance activation speed ratio was not different for roof and bottom lesions (3.2 ± 2.0 vs. 2.9 ± 0.8, P = 0.68). An activation speed ratio ≥2 or ≤0.5 was observed in 16 (76.2%) entrance and four (19.0%) exit lesions. Rightward and leftward activation speeds in the horizontal direction at the entrance were 0.53 ± 0.28 and 0.50 ± 0.26 m/s, respectively (P = 0.752). The activation speed ratio between the leftward and rightward directions at the entrance was 1.2 ± 0.8. These activation speeds ratios were not different for roof and bottom lesions (1.2 ± 1.1 vs. 1.2 ± 0.6, P = 0.992). Endocardial activation speeds in the horizontal direction at the entrance were not different in the rightward and leftward directions. The bidirectional activation speed between the entrance and exit was measured using 15 bidirectional activation maps in the box group; the activation speeds in the activation map pacing from the CS and PV did not differ (0.62 ± 0.43 vs. 0.59 ± 0.38 m/s, P = 0.831). The mean gap conduction angle was 58.2° ± 29.9° and was 90° in seven maps, 0° (exit and entrance on the ablation line) in three maps, and diagonal (<70° to the ablation lines) in 11 maps. Among the two redo procedural cases, the gap angles were 49.5° at the roof gap and 36.2° at the bottom gap, while the average gap angle in de novo cases was 59.8 ± 31.8° and nine maps (47.4%) represented the diagonal angle (<70° to the ablation lines).
Figure 4.
Three-dimensional map showing the anisotropic property of the electrical activation speed at the left atrial posterior wall. (A, B) The endocardial activation speeds in the vertical direction are faster than those in the horizontal direction, whereas the endocardial activation speeds in the horizontal direction did not differ between the rightward and leftward directions. (C) The endocardial activation speed at the entrance into the box lesion is 2.3 ± 1.1 m/s in the vertical direction and 0.8 ± 0.4 m/s in the horizontal direction (P < 0.001). (D) The endocardial activation speed at the exit from the box lesion is 1.7 ± 0.9 m/s in the vertical direction and 1.4 ± 0.6 m/s in the horizontal direction (P = 0.100). (E) The activation speed ratios between the vertical and horizontal directions are 3.1 ± 1.6 at the entrance and 1.4 ± 0.6 at the exit (P < 0.001). CS, coronary sinus.
LUMIPOINT assessment
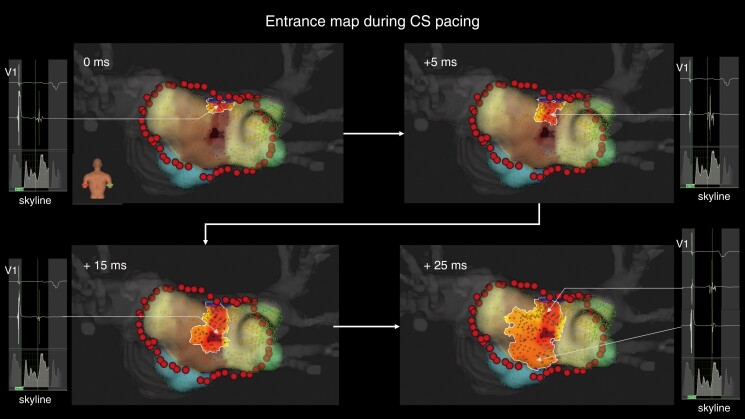
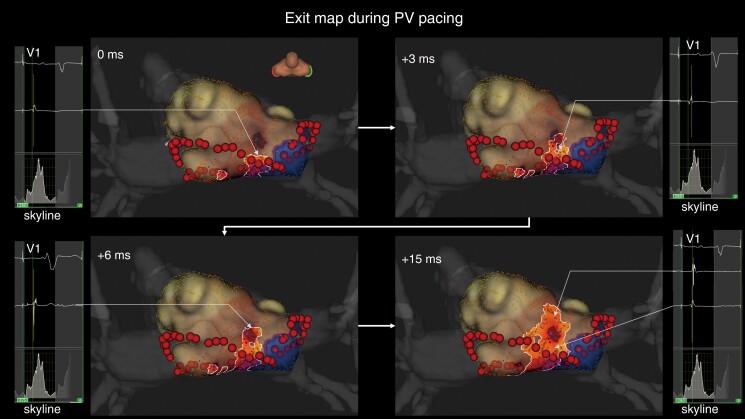
When applying the LUMIPOINT activation algorithm, the mean gap length was 19.2 ± 13.0 mm, which was not significantly different from the gap length measured using the standard algorithm (P = 0.472). In 10 cases, the algorithm exhibited far-field potentials conducted linearly from the ablation line towards the entrance or exit separated from the ablation line and the local potential conducted centrifugally from the entrance or exit. The gap location in these cases was three roof and four bottom lesions in the box group and two lesions around the right PV and one around the left PV in the PVI group. The gap length in these cases did not significantly differ from that in the other cases (21.1 ± 10.7 vs. 21.8 ± 14.4 mm, P = 0.887). A representative case is shown in Figures 5 and 6 and see Supplementary material online, Video S1.
Figure 5.
Representative case of epicardial conduction visualization during coronary sinus pacing. The entrance identified by the standard algorithm is at the centre of the box lesion. In the LUMIPOINT activation algorithm, electrical activation conducts linearly, from the roof line to the entrance, and centrifugally. The electrograms highlighted by the LUMIPOINT activation algorithm and the Skyline histogram are also shown. CS, coronary sinus.
Figure 6.
Representative case of epicardial conduction visualization during pulmonary vein pacing. The exit identified by the standard algorithm is located away from the roof ablation line. In the LUMIPOINT activation algorithm, electrical activation is conducted continuously from the roof line to the exit and is then conducted centrifugally. The electrograms highlighted by the LUMIPOINT activation algorithm and the Skyline histogram are also shown. PV, pulmonary vein.
In the box group, split activation along the incomplete ablation line was fully depicted in eight cases (four at the roof line and four at the bottom line) and partially in eight cases (three at the roof line and five at the bottom line) (see Supplementary material online, Figure S1). The confidence slider for split activation was set at 50%. Among eight cases with partially depicted split activation along the incomplete ablation line, complex activations were observed where split activations were absent at the incomplete ablation line in five cases (one at the roof line and four at the bottom line). The peak slider was set at 7.9 ± 1.5 to analyse the complex activation of interest.
Discussion
This retrospective study provided information on bidirectional conduction gap mapping along PV or box ablation lesions using the RHYTHMIA mapping system. The main findings are (i) the entrance and exit of incomplete PV ablation lesions were often far from each other, and the gap direction lines connecting them were diagonal to the ablation lines in most cases; (ii) the distance between the entrance and exit of the conduction gap was longer at the roof lesion than at the bottom lesion in the box group and tended to be longer in the right than in the left PV in the PVI group; (iii) in some cases, the LUMIPOINT algorithm visualized the far-field potential, which might represent epicardial electrograms and epicardial conduction breakthroughs beyond the ablation line; and (iv) anisotropic conduction was clearly demonstrated at the posterior LA within box lesions.
Comparison with previous investigations
A conduction block between the LA and PV is not always achievable by one-round encircling of RF applications. However, performing the required additional RF applications for complete linear lesions can be challenging because of the difficulty in identifying electrical conduction gaps. In recent studies, high-density mapping has proven to be effective in assessing the isolation of PVs and identifying critical areas responsible for the maintenance of gap-related re-entrant atrial tachycardias.8–10 Several authors have reported regarding electrical conduction gap mapping. Chee et al.11 investigated bidirectional conduction gap mapping after PV ablation and identified the involvement of epicardial connections through the ligament of Marshall, while Barrio-Lopez et al.12 reported epicardial connections with a prevalence of 13.5% after a first-pass encircling of PVs. In our study, the entrances and exits of uncompleted PV ablation lesions were far from each other, with gap direction lines often diagonal to the ablation lines, thus indicating that the point of the ablation line nearest to the entrance or exit is not necessarily the actual electrical conduction gap and is not always the optimal ablation site. This may be due to the involvement of epicardial conduction in gap formation; otherwise, the exit or entrance would be close to the ablation line. Our method of identifying the bidirectional electrical conduction gap may indicate the location and direction of the epicardial conduction breakthrough over the incomplete ablation line. The visual image of the epicardial conduction breakthrough is a significant advantage when completing block lines.
Catheter ablation for conduction gaps
After a bidirectional assessment of the conduction gaps, we ablated at the exit to maximize the isolated area. Whenever RF applications at the exit were ineffective, we moved the ablation catheter towards the entrance and applied RF along the presumed epicardial conduction pathway. PV or box isolation was accomplished in all except four patients in the box group (two bottom and two roof lesions) and one in the PVI group. Although we ablated wide lesions around the gaps in four cases of incomplete box isolations, we could not complete the electrical block lines. In these unsuccessful cases, we considered RF applications from the endocardium to block epicardial conduction; however, additional RF applications might have led to serious complications. We abandoned isolation of the LA posterior wall and conducted ipsilateral circumferential PV isolation. In the case of incomplete right PV isolation, the gap was relatively long (38.8 mm), and the exit was at the LA posterior wall; we considered the involvement of the epicardial connection. Therefore, we added the roof and bottom lines from the left PV, and we accomplished simultaneous electrical isolation of the right PV and LA posterior wall.
Involvement of the epicardial muscular bundle
In our study, the gap length at the roof lesion was significantly longer than that at the bottom. This could be due to the septopulmonary bundle; the subepicardial fibres descend along the LA posterior wall between the right and left PV orifices.13 Garcia et al.14 reported a roof-dependent atrial flutter following prior LA posterior wall isolation, in which epicardial conduction through the septopulmonary bundle was shown to persist after complete linear endocardial ablation at the LA posterior wall. Pambrun et al.15 showed that epicardial conduction across the LA roof lesions was not rare and was related to the relatively thick atrial myocardium and the septopulmonary bundle separated from the endocardium by adipose tissue at the LA roof. In the present study, the RF application distances at the conduction gap were longer comparing to the average RF application interval. The longer RF application distance might be involved to the gap formation. On the other hand, there were no relationship between the RF application distance at the conduction gap and the gap length, and the RF application distance at the conduction gap was not significantly different between the roof and bottom regions. This finding suggested that the RF application interval for a first-pass circumferential ablation might not be related to the gap length which might be associated with an epicardial conduction.
LUMIPOINT software
An epicardial electrogram was rarely observed from the electrode catheter in the endocardium. However, in some cases, the Orion catheter enabled observation of the far-field epicardial electrogram from the endocardium, owing to its small electrode size and high density of mapping points. This epicardial electrogram was reflected in propagation maps using the LUMIPOINT algorithm, whereby the epicardial conduction breakthrough over the incomplete ablation line could be visualized in some cases. In eight (38.1%) maps in the box group, split activations were fully observed along the incomplete ablation line, indicating that the ablation line was completed in the three-dimensional map drawn from the endocardium. In five (23.8%) maps, split activations were partially observed along the incomplete ablation line, and complex activations could be observed where the split activation was missing along the incomplete ablation line. These complex activations might have included the electrograms from the epicardial side, thereby contributing to the gap formation.
LA conduction patterns
We also assessed electrical activation speed characteristics around the box lesions. Anisotropy, the property of being directionally dependent, is seen in heart tissue. Activation fronts proceed more rapidly along the fibre orientation,16 and anisotropic properties differ depending on the tissues.17
Conduction at the entrance evidenced the anisotropic property, as the vertical activation speed was faster than the horizontal one, matching the orientation of muscle fibres in the LA posterior wall.18,19 In contrast, no significant differences in endocardial activation speed existed between the vertical and horizontal directions at the exit, perhaps due to the orientation of the muscle fibres. Additionally, the conduction of the far-field potential in the propagation map by the LUMIPOINT algorithm did not always correspond to that of the local potential. Thus, we can extrapolate that the far-field potential was conducted by epicardial fibres, as they had different anisotropic properties than the tissue conducting the local potential, which was mainly the endocardial tissue at the LA posterior wall.
Limitations
The present study had several limitations, as it was a single-centre observational study with a small sample size and the analysis included various ablation strategies such as PV isolation and box lesion sets, as well as chronic and acute reconnections. The heterogeneity of the study population was accounted for an important bias, and in de novo cases, the nearly inevitable effect of tissue oedema could have affected the three-dimensional map. We created a bidirectional gap conduction map during pacing from the PV and CS, but did not do so during from LA appendage pacing to evaluate the roof line where could be better for evaluating conduction block at roof line. In this study, there were three cases with multiple gaps. Each case had a single gap in both the roof line and the bottom line. For each case, we first identified the conduction gap in the bottom line using PV and proximal CS pacing. The conduction sequence of PV and proximal CS pacing changed after ablating the bottom line, shifting to a single gap conduction in the roof line. This suggests that the conduction evaluated by CS and PV pacing before ablating the bottom line was indeed the gap in the bottom line. In cases with multiple conduction gaps, determining through which gap the activation has passed becomes challenging when the pacing sites are distant. That is, pacing in close proximity to the gap is crucial for its identification. In this study, we did not evaluate the distance between pacing sites, both outside and inside the isolated lesions, which could have provided additional insights. Additionally, the activation speed would be more accurately measured by activation points taking from the same cardiac beat. However, considering the size and shape of the Orion catheter, we chose to measure the endocardial activation speed from different cardiac beats. Although the electroanatomic maps suggested the involvement of epicardial conduction, we do not have direct epicardial electrogram recordings to confirm this speculation. However, in some cases, small far-field electrograms, considered to be epicardial, were observed from the endocardium. We believe that the visual imaging of epicardial conduction breakthroughs is important for successful AF ablation. Multicentre studies with larger populations are needed for complete conclusions regarding the advantages of this method.
Conclusions
Our study showed that the entrances and exits of electrical conduction gaps in PV ablation were separate, especially in the roof portion of the LA, suggesting that epicardial conduction contributed to the gap formation. Moreover, the conduction gap direction was often diagonal to linear lesions, likely accounting for the difficulty in making a complete block on the assumed lesion line. Bidirectional conduction gap mapping may indicate the location and direction of the epicardial conduction, which would be an important advantage in completing PV or box isolation.
Supplementary Material
Acknowledgements
We would like to thank Editage (www.editage.com) for English language editing.
Conflict of interest: S.T. received grants from Bayer Pharmaceuticals, Japan Lifeline, and Behringer Ingelheim and received personal fees from Daiichi Sankyo, Bristol-Myers Squibb, Abbott, Medtronic, and Boston Scientific. The remaining authors have no conflicts of interest to declare.
Contributor Information
Kenji Hashimoto, Department of Cardiology, Keio University School of Medicine, 35 Shinanomachi, Shinjuku-ku, Tokyo 160-8582, Japan.
Takehiro Kimura, Department of Cardiology, Keio University School of Medicine, 35 Shinanomachi, Shinjuku-ku, Tokyo 160-8582, Japan.
Yuta Seki, Department of Cardiology, Keio University School of Medicine, 35 Shinanomachi, Shinjuku-ku, Tokyo 160-8582, Japan.
Susumu Ibe, Department of Cardiology, Keio University School of Medicine, 35 Shinanomachi, Shinjuku-ku, Tokyo 160-8582, Japan.
Terumasa Yamashita, Department of Cardiology, Keio University School of Medicine, 35 Shinanomachi, Shinjuku-ku, Tokyo 160-8582, Japan.
Hiroshi Miyama, Department of Cardiology, Keio University School of Medicine, 35 Shinanomachi, Shinjuku-ku, Tokyo 160-8582, Japan.
Taishi Fujisawa, Department of Cardiology, Keio University School of Medicine, 35 Shinanomachi, Shinjuku-ku, Tokyo 160-8582, Japan.
Yoshinori Katsumata, Department of Cardiology, Keio University School of Medicine, 35 Shinanomachi, Shinjuku-ku, Tokyo 160-8582, Japan.
Keiichi Fukuda, Department of Cardiology, Keio University School of Medicine, 35 Shinanomachi, Shinjuku-ku, Tokyo 160-8582, Japan.
Seiji Takatsuki, Department of Cardiology, Keio University School of Medicine, 35 Shinanomachi, Shinjuku-ku, Tokyo 160-8582, Japan.
Supplementary material
Supplementary material is available at Europace online.
Data availability
All relevant data are within the manuscript and its supplementary material online files.
References
- 1. Morillo CA, Verma A, Connolly SJ, Kuck KH, Nair GM, Champagne Jet al. Radiofrequency ablation vs antiarrhythmic drugs as first-line treatment of paroxysmal atrial fibrillation (RAAFT-2): a randomized trial. JAMA 2014;311:692–700. [DOI] [PubMed] [Google Scholar]
- 2. Bai R, Di Biase L, Mohanty P, Trivedi C, Dello Russo A, Themistoclakis Set al. Proven isolation of the pulmonary vein antrum with or without left atrial posterior wall isolation in patients with persistent atrial fibrillation. Heart Rhythm 2016;13:132–40. [DOI] [PubMed] [Google Scholar]
- 3. Rajappan K, Kistler PM, Earley MJ, Thomas G, Izquierdo M, Sporton SCet al. Acute and chronic pulmonary vein reconnection after atrial fibrillation ablation: a prospective characterization of anatomical sites. Pacing Clin Electrophysiol 2008;31:1598–605. [DOI] [PubMed] [Google Scholar]
- 4. Nakagawa H, Ikeda A, Sharma T, Lazzara R, Jackman WM. Rapid high resolution electroanatomical mapping: evaluation of a new system in a canine atrial linear lesion model. Circ Arrhythm Electrophysiol 2012;5:417–24. [DOI] [PubMed] [Google Scholar]
- 5. Laţcu DG, Bun SS, Viera F, Delassi T, El Jamili M, Al Amoura Aet al. Selection of critical isthmus in scar-related atrial tachycardia using a new automated ultrahigh resolution mapping system. Circ Arrhythm Electrophysiol 2017;10:e004510. [DOI] [PubMed] [Google Scholar]
- 6. García-Bolao I, Ballesteros G, Ramos P, Menéndez D, Erkiaga A, Neglia Ret al. Identification of pulmonary vein reconnection gaps with high-density mapping in redo atrial fibrillation ablation procedures. Europace 2018;20:f351–8. [DOI] [PubMed] [Google Scholar]
- 7. Masuda M, Fujita M, Iida O, Okamoto S, Ishihara T, Nanto Ket al. The identification of conduction gaps after pulmonary vein isolation using a new electroanatomic mapping system. Heart Rhythm 2017;14:1606–14. [DOI] [PubMed] [Google Scholar]
- 8. Bohnen M, Weber R, Minners J, Jadidi A, Eichenlaub M, Neumann FJet al. Characterization of circumferential antral pulmonary vein isolation areas resulting from pulsed-field catheter ablation. Europace 2023;25:65–73. [DOI] [PMC free article] [PubMed] [Google Scholar]
- 9. Vlachos K, Efremidis M, Derval N, Martin CA, Takigawa M, Bazoukis Get al. Use of high-density activation and voltage mapping in combination with entrainment to delineate gap-related atrial tachycardias post atrial fibrillation ablation. Europace 2021;23:1052–62. [DOI] [PubMed] [Google Scholar]
- 10. Conte G, Soejima K, de Asmundis C, Bruno J, Cattaneo F, Chierchia GBet al. High-density mapping in patients undergoing ablation of atrial fibrillation with the fourth-generation cryoballoon and the new spiral mapping catheter. Europace 2020;22:1653–8. [DOI] [PubMed] [Google Scholar]
- 11. Chee J, Kalogeropoulos AP, Almasry I, Singh A, Rashba E, Fan R. Identification and endocardial ablation of the ligament of Marshall for pulmonary vein isolation. JACC Clin Electrophysiol 2021;7:283–91. [DOI] [PubMed] [Google Scholar]
- 12. Barrio-Lopez MT, Sanchez-Quintana D, Garcia-Martinez J, Betancur A, Castellanos E, Arceluz Met al. Epicardial connections involving pulmonary veins: the prevalence, predictors, and implications for ablation outcome. Circ Arrhythm Electrophysiol 2020;13:e007544. [DOI] [PubMed] [Google Scholar]
- 13. Ho SY, Cabrera JA, Sanchez-Quintana D. Left atrial anatomy revisited. Circ Arrhythm Electrophysiol 2012;5:220–8. [DOI] [PubMed] [Google Scholar]
- 14. Garcia F, Enriquez A, Arroyo A, Supple G, Marchlinski F, Saenz L. Roof-dependent atrial flutter with an epicardial component: role of the septopulmonary bundle. J Cardiovasc Electrophysiol 2019;30:1159–63. [DOI] [PubMed] [Google Scholar]
- 15. Pambrun T, Duchateau J, Delgove A, Denis A, Constantin M, Ramirez FDet al. Epicardial course of the septopulmonary bundle: anatomical considerations and clinical implications for roof line completion. Heart Rhythm 2021;18:349–57. [DOI] [PubMed] [Google Scholar]
- 16. Koura T, Hara M, Takeuchi S, Ota K, Okada Y, Miyoshi Set al. Anisotropic conduction properties in canine atria analyzed by high-resolution optical mapping: preferential direction of conduction block changes from longitudinal to transverse with increasing age. Circulation 2002;105:2092–8. [DOI] [PubMed] [Google Scholar]
- 17. Valderrábano M. Influence of anisotropic conduction properties in the propagation of the cardiac action potential. Prog Biophys Mol Biol 2007;94:144–68. [DOI] [PMC free article] [PubMed] [Google Scholar]
- 18. Pashakhanloo F, Herzka DA, Ashikaga H, Mori S, Gai N, Bluemke DAet al. Myofiber architecture of the human atria as revealed by submillimeter diffusion tensor imaging. Circ Arrhythm Electrophysiol 2016;9:e004133. [DOI] [PMC free article] [PubMed] [Google Scholar]
- 19. Ho SY, Sánchez-Quintana D. The importance of atrial structure and fibers. Clin Anat 2009;22:52–63. [DOI] [PubMed] [Google Scholar]
Associated Data
This section collects any data citations, data availability statements, or supplementary materials included in this article.
Supplementary Materials
Data Availability Statement
All relevant data are within the manuscript and its supplementary material online files.


