Abstract
Tissue fibrosis and extracellular matrix (ECM) stiffening promote tumor progression. The mechanisms by which ECM regulates its contacting cells have been extensively studied. However, how stiffness influences intercellular communications in the microenvironment for tumor progression remains unknown. Here we report that stiff ECM stimulates the release of exosomes from cancer cells. We delineate a molecular pathway that links stiff ECM to activation of Akt, which in turn promotes GTP-loading to Rab8 that drives exosome secretion. We further show that exosomes generated from cells grown on stiff ECM effectively promote tumor growth. Proteomic analysis revealed that the Notch signaling pathway is activated in cells treated with exosomes derived from tumor cells grown on stiff ECM, consistent with our gene expression analysis of liver tissues from patients. Our study reveals a molecular mechanism that regulates exosome secretion and provides insight into how mechanical properties of the ECM control the tumor microenvironment for tumor growth.
Tissue fibrosis and ECM stiffening are associated with the progression of many tumors including hepatocellular carcinoma, pancreatic ductal adenocarcinoma, and breast cancer1–8. Stiff ECM promotes cell proliferation, epithelial-to-mesenchymal transition, metastasis, and chemoresistance9–16. The effect of stiff ECM is mediated by increased cell tension5, 7. Integrins transduce cues from the ECM through the assembly of adhesion complexes that initiate intracellular signaling and actin remodeling17–19. Reduction of tension attenuated the proliferation of cancer cells7. While the mechanisms by which ECM regulates intracellular signaling have been extensively studied, how stiffness affects the tumor microenvironment and intercellular communication that promote tumor growth is unknown.
Exosomes are small extracellular vesicles (sEV) secreted by cells. Exosomes carry molecules such as signaling proteins and microRNAs that affect the pathophysiology of the recipient cells20–22. Exosomes are generated when the limiting membranes of endosomes invaginate toward the lumen to form multivesicular endosomes (MVEs). When MVEs are transported to and fuse with the plasma membrane, the intraluminal vesicles are released from cells as exosomes20, 23, 24. The Rab family of small GTPases such as Rab27 are master regulators that control biogenesis and release of exosomes25. In cancers, exosomes have been shown to potently affect the tumor microenvironment and promote tumorigenesis and metastasis26, 27. However, the mechanism by which secretion of exosomes is regulated by oncogenic signaling is unclear.
Here we report that a stiff ECM promotes exosome secretion from tumor cells. Combining proteomic analysis, biochemistry, and cell biology, we delineate a molecular pathway linking stiff ECM to oncogenic signaling and exosome trafficking, which ultimately promote tumor progression. Our study suggests that physical properties of ECM not only affect intracellular signaling of the cells, but also impact the tumor microenvironment through secreted exosomes.
RESULTS
Matrix stiffening promotes exosome secretion
To study the effect of matrix stiffness on exosome secretion, we cultured Huh7, a human hepatocellular carcinoma (HCC) cell line, on collagen-coated polyacrylamide gels with elastic moduli of 0.5 kPa (“soft”) and 10 kPa (“stiff”), which have previously been shown to represent the stiffness in normal and cirrhotic livers28, 29. sEVs derived from these cells were isolated from conditioned media by ultra-centrifugation and analyzed by nanoparticle tracking analysis (NTA) and transmission electron microscopy (TEM) (Fig. 1a and Extended Data Fig. 1a). More exosomes, as determined by both exosome number (Fig. 1a and 1d) and the total exosome protein level (Extended Data Fig. 1b), were released from the same numbers of cells grown on the stiff ECM. In addition, western blotting analyses of exosome marker proteins including HRS, Syntenin-1, Alix, Tsg101, and CD63 on exosomes collected from equal amounts of cells further indicate that more exosomes were released from cells cultured on the stiff matrix (henceforth termed as “Exostiff”) than those cultured on the soft matrix (henceforth termed as “Exosoft”) (Fig. 1b and 1c). We did not detect any difference in the diameters of exosomes or the amounts of proteins from the same number of exosomes collected from cells under these two conditions (Extended Data Fig. 1c and Extended Data Fig 1d). In addition to Huh7 cells, increased exosome secretion was also observed in primary human hepatocytes, breast cancer cells (MCF-7) and pancreatic cancer cells (Panc-1) cultured on stiff matrix compared to the soft condition (Fig. 1e, 1f, and Extended Data Fig. 1e). Furthermore, larger fold changes in exosome secretion were observed in MCF10AT (pre-malignant) and MCF10CA (tumorigenic) cell lines compared to their isogenic MCF10A cells (non-malignant) (Extended Data Fig. 1f), suggesting that oncogenic mutations contribute to the sensitivity of cells to matrix stiffness.
Fig. 1. Stiff ECM promotes exosome secretion.
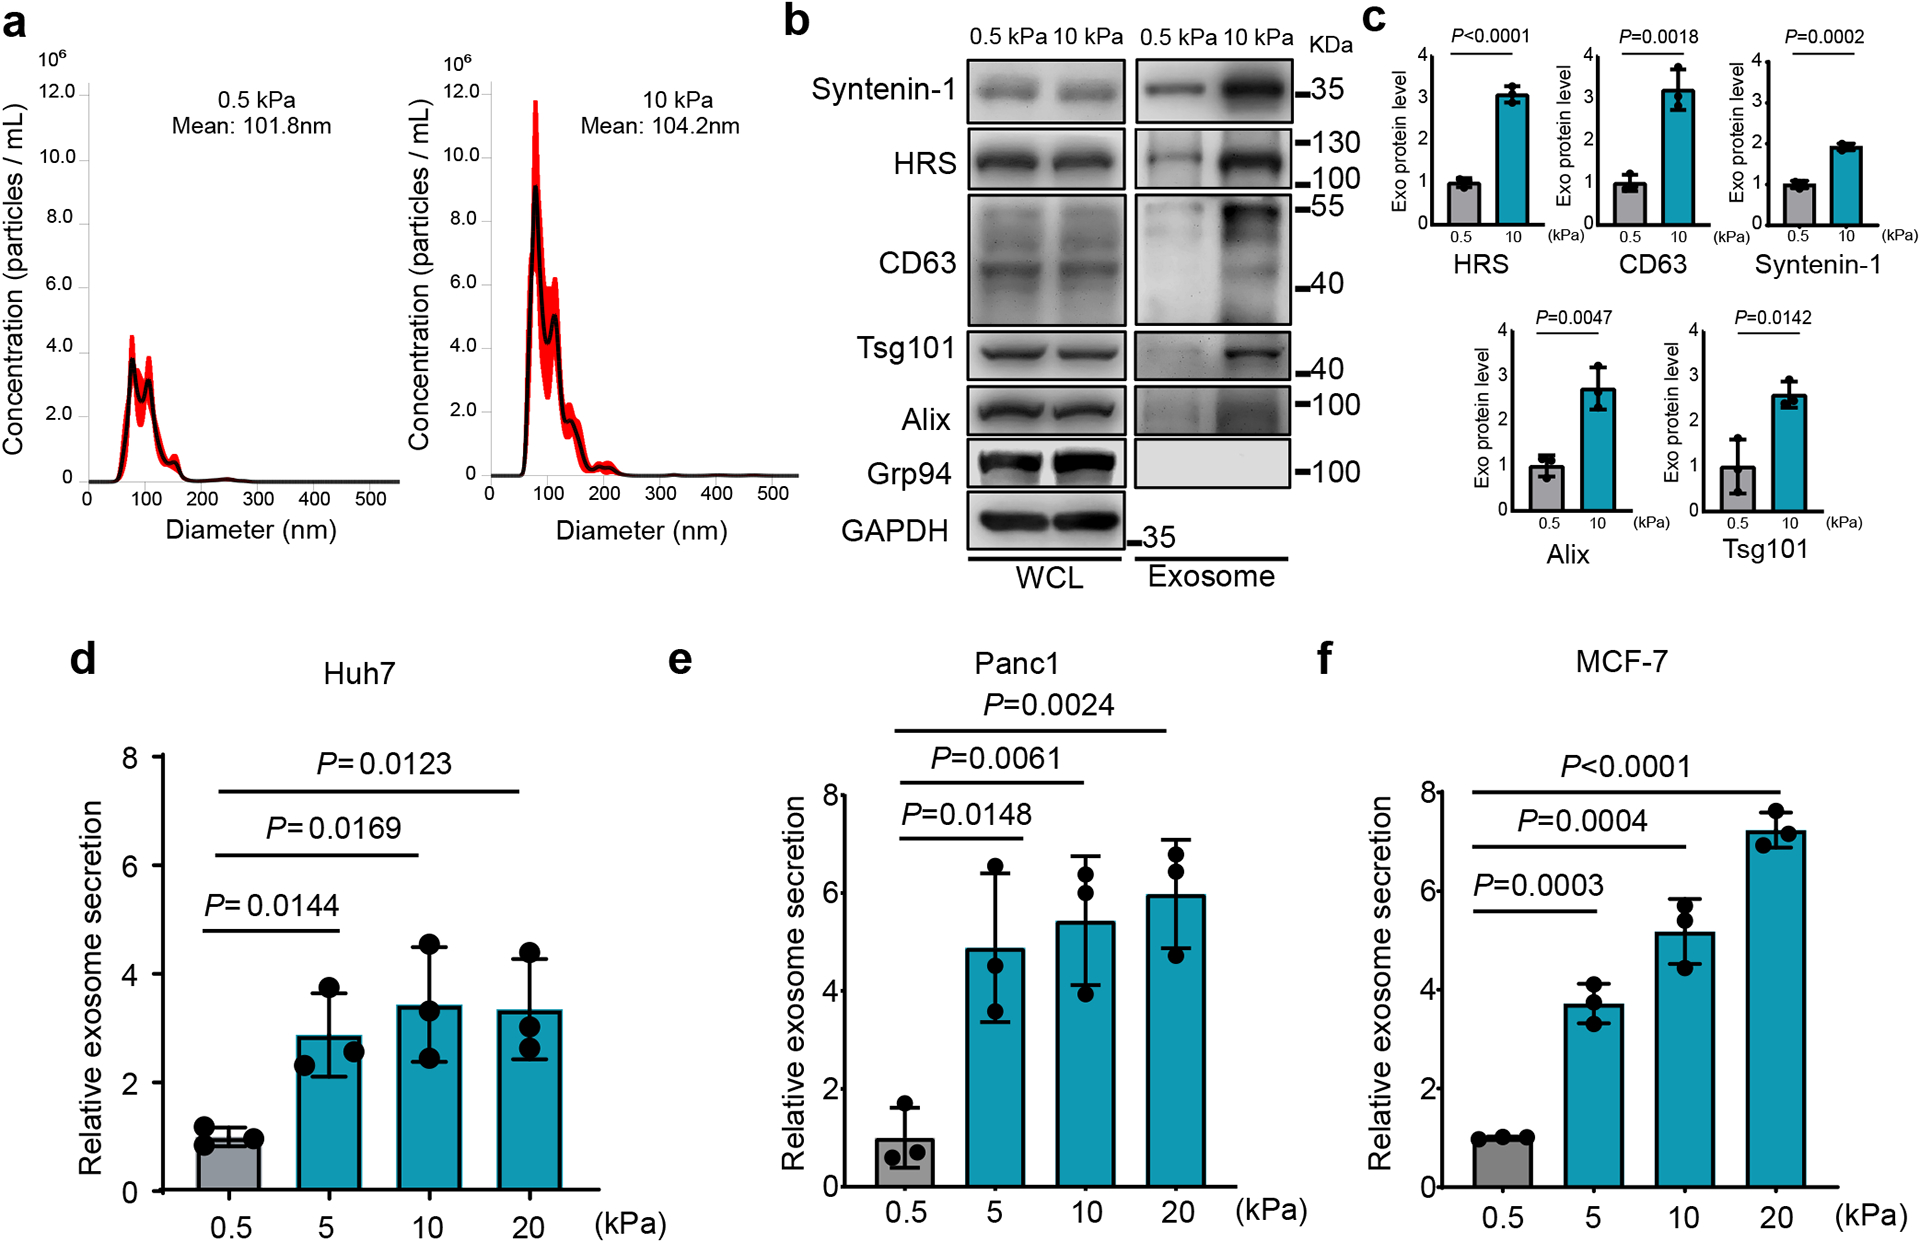
a, The conditioned media from Huh7 cells growing on soft (0.5 kPa) or stiff (10 kPa) matrix were collected. After depletion of cell debris and large vesicles by centrifugation, the supernatant containing exosomes was proceeded for NTA. A representative NTA analysis is shown. The X-axis represents the diameters of the vesicles and the Y-axis represents the concentration (particles/ml) the vesicles (n=3 independent captures). Values are presented as Mean ± S.E.M. b, Immunoblotting of exosome markers (HRS, Syntenin-1, Alix, Tsg101, and CD63) in the whole cell lysate (“WCL”) and purified exosomes from 107 Huh7 cells on soft and stiff matrix. Grp94 (ER marker) was used as a negative control. GAPDH was used as a cell lysate loading control. Molecular weights (in kDa) are shown to the right. c, Quantification of the levels of HRS, Syntenin-1, CD63, Alix, and Tsg101. Proteins on exosomes released from cells grown on 0.5 kPa matrix was normalized as 1. Values are presented as Mean ± S.D. n=3 independent experiments. d-f, Exosomes released from the same number of cells (Huh7, Panc1, and MCF7) grown on matrix with different stiffness were quantified and the amounts of exosomes released from cells grown on 0.5 kPa matrix were normalized as 1. Values are presented as Mean ± S.D. n=3 independent experiments. See METHODS for statistical analyses of all the figures. Source numerical data and unprocessed blots are available in source data.
Akt promotes exosome secretion from cells grown on stiff matrix
To identify the signaling pathway that promotes exosome secretion under stiff condition, we performed Reverse Phase Protein Array (RPPA) analysis, an antibody-based quantitative proteomics technology, on the whole-cell lysates of Huh7 cells grown on the soft vs. stiff matrix. Two clusters of signaling molecules were shown to be upregulated in cells grown on the stiff matrix. One of them included phospho-Akt(S473) and its downstream targets phospho-4E-BP1(S65), phospho-GSK-3(S9S21) (Fig. 2a and Extended Data Fig. 2a). Akt activation in cells was further confirmed by immunoblotting (Extended Data Fig. 2b). In contrast, ERK signaling was not affected by ECM stiffness, suggesting specificity of the activation of the Akt pathway. Another cluster consisted of Jagged1, Hes1, p21, and c-Myc, all being involved in Notch signaling (addressed below). To further test the effect of Akt signaling on exosome secretion, we expressed constitutively active Akt (myr-Akt) in cells. Higher levels of exosome secretion were detected from cells expressing myr-Akt (Fig. 2b). Conversely, treatment with low doses of the Akt inhibitors MK-2206 (100 nM) (Fig. 2c–2e) or GDC-0068 (100 nM) (Extended Data Fig. 2c) showed significantly reduced levels of exosome secretion on the stiff matrix without significant inhibition of cell proliferation (Extended Data Fig. 2d and Extended Data Fig. 2e). We further examined the intracellular distribution of exosome marker proteins in cells treated with MK-2206 by immunofluorescence imaging. Compared to control cells, MK-2206 led to an accumulation of CD63 and LAMP1 at the perinuclear region, suggesting a block of MVE trafficking to the plasma membrane (Fig. 2f and 2g). This pattern of CD63 and LAMP1 localization is similar to that observed in cells with blocked MVE trafficking25.
Fig. 2. Akt promotes exosome secretion from cells grown on stiff matrix.
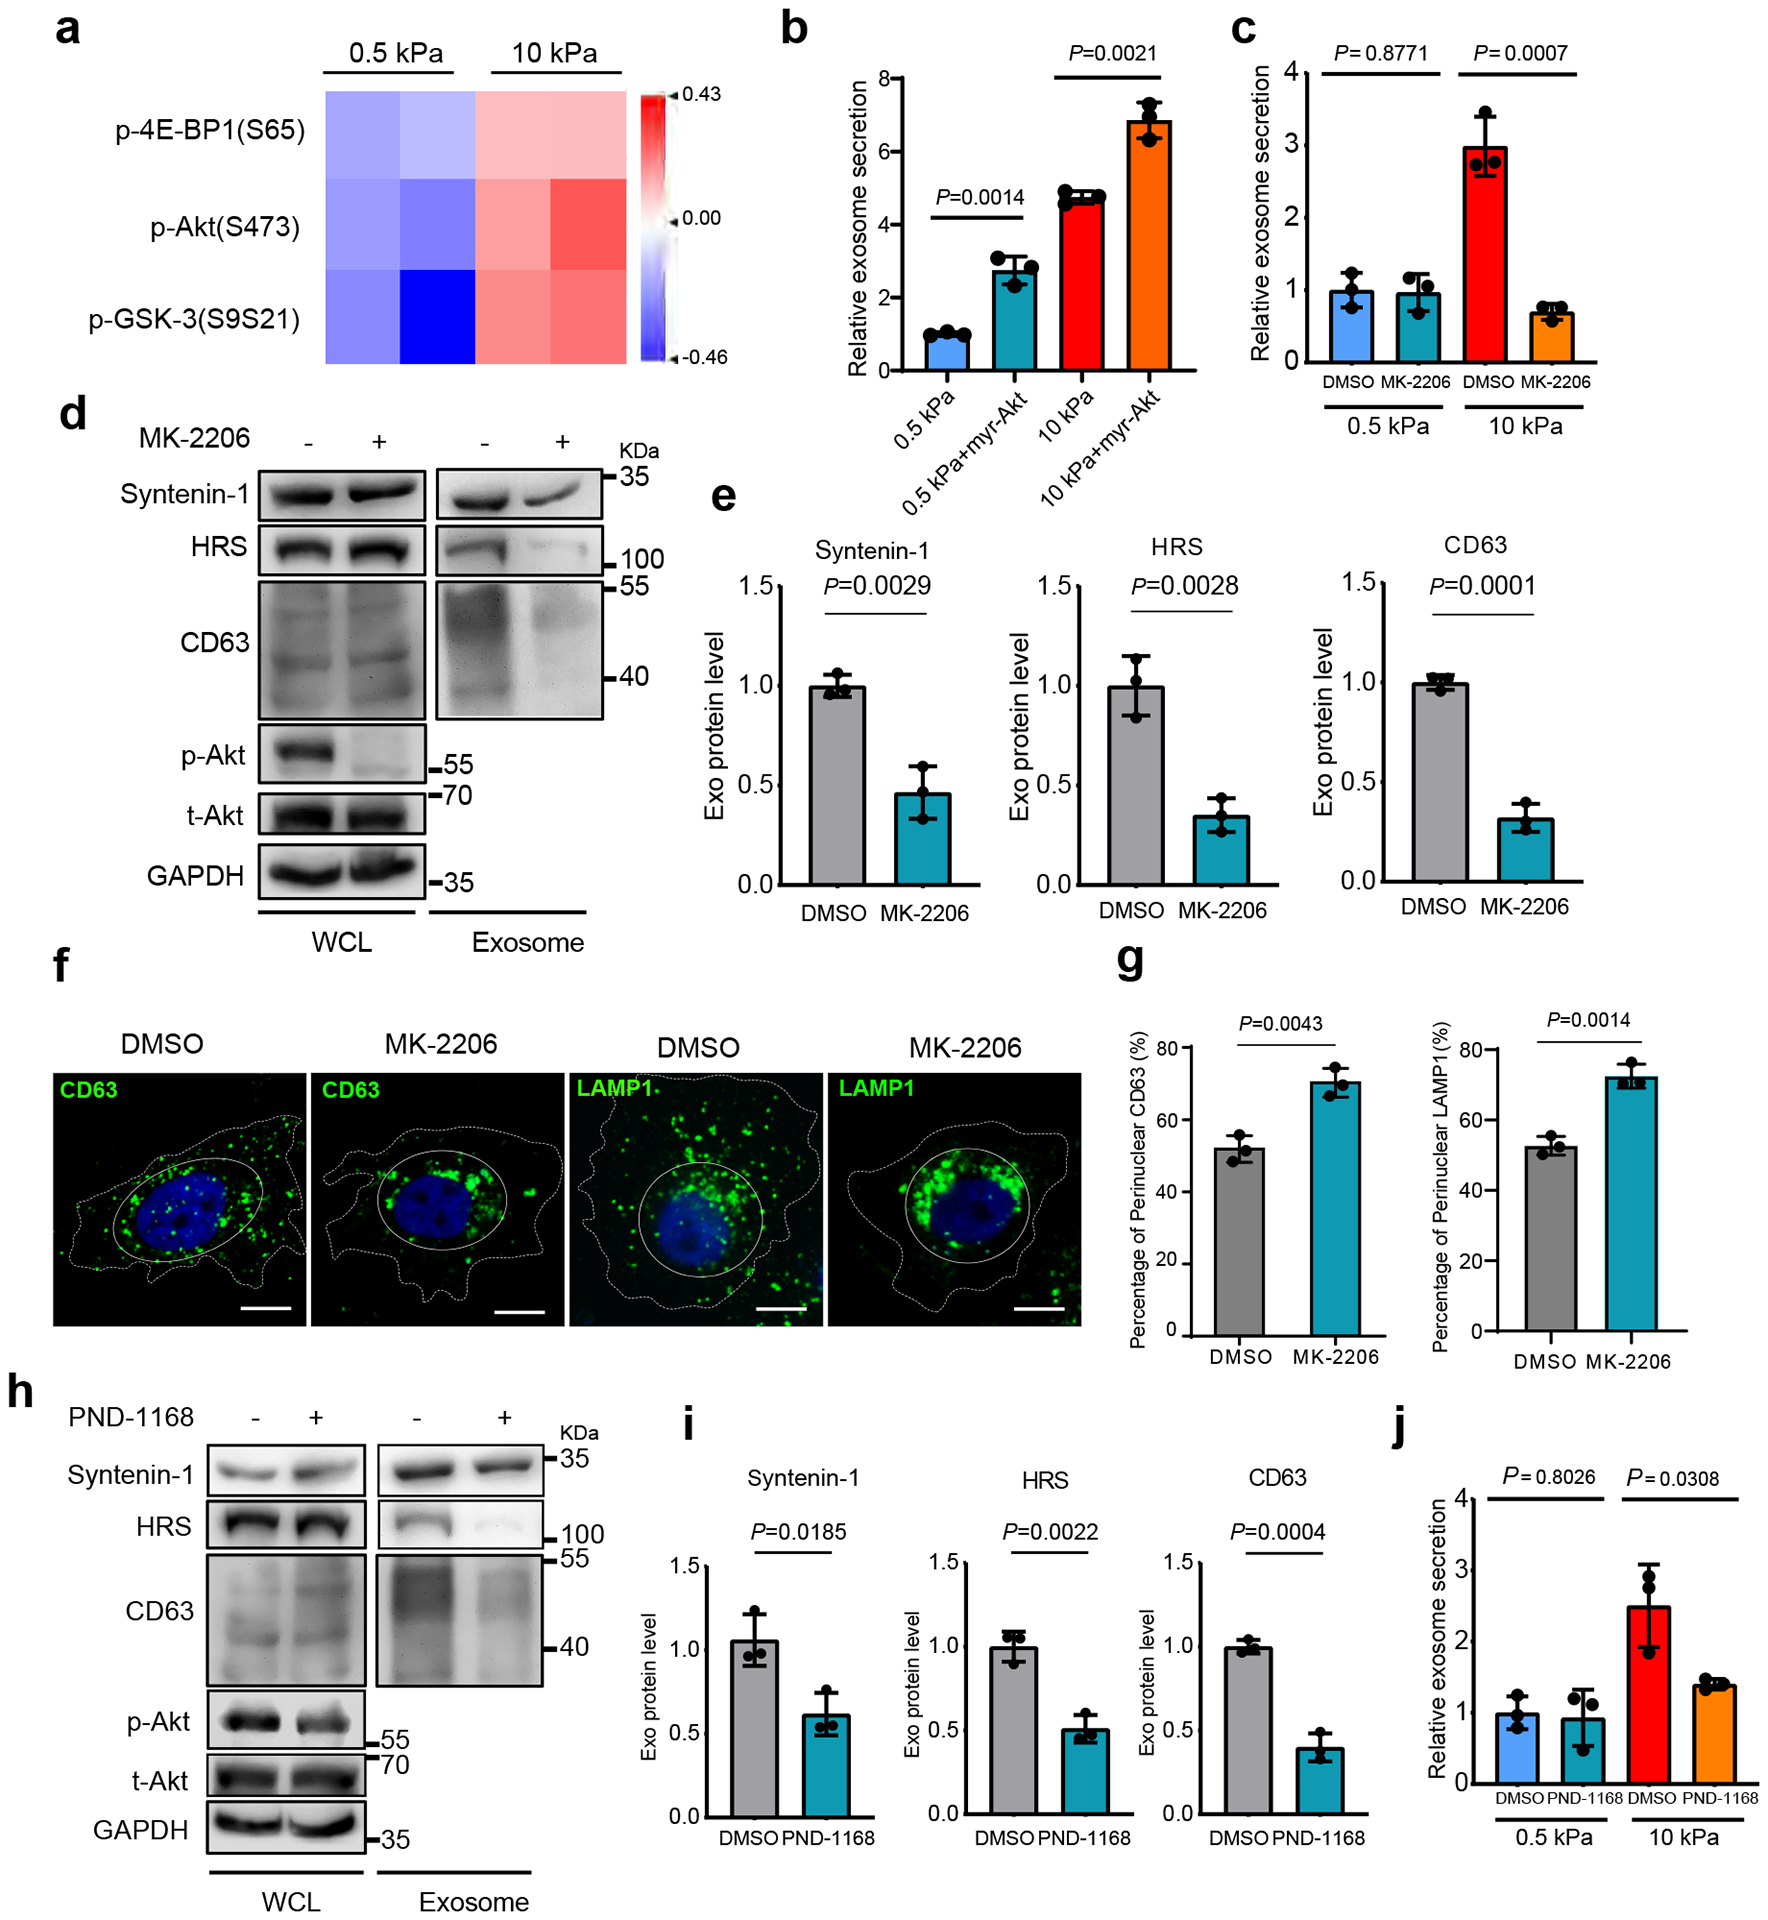
a, Heatmap of RPPA data showing the levels of phospho-Akt and its downstream signaling proteins p-4E-BP1 and pGSK-3 in Huh7 cells grown on soft vs. stiff matrix. b, Exosomes from Huh7 cells expressing GFP control or myr-Akt on soft or stiff matrix were analyzed by NTA. Exosomes from cells expressing GFP on soft matrix was normalized to 1. Relative values are presented as Mean ± S.D., n=3.c, Huh7 cells grown on soft or stiff matrix were treated with DMSO or Akt inhibitor MK-2206. Exosome concentration from the cells treated with DMSO on soft matrix was normalized to 1. Values are presented as Mean ± S.D., n=3. d, Exosomes were purified from the media of equal amounts of Huh7 cells treated with DMSO or MK-2206. The levels of HRS, Syntenin-1, and CD63 in whole cell lysates (“WCL”) and purified exosomes were examined by immunoblotting. Total Akt (t-Akt) and p-Akt in WCL was also examined. GAPDH was used as WCL loading control. e, Quantification of the levels of HRS, Syntenin-1, and CD63. Values are presented as Mean ± S.D. n=3. f, Huh7 cells were treated with MK-2206 and immunostained for CD63 and LAMP1. Scale Bar: 10 μm. Cell peripherals were indicated with dashed lines and the perinuclear region was indicated with solid lines. g, Quantification of the percentage of perinuclear CD63 or LAMP1. Values are presented as Mean ± S.D. n=3. h, An equal amount of Huh7 cells grown on stiff matrix were treated with FAK inhibitor PND-1168, and exosomes in the conditioned media were purified. Exosome markers (HRS, Syntenin-1 and CD63) were examined. The levels of t-Akt and p-Akt in cell lysates were also examined. i, Quantification of the levels of HRS, Syntenin-1 and CD63. Mean ± S.D. n=3. j, Huh7 cells growing on soft or stiff matrix were treated with FAK inhibitor PND-1168. Exosome concentration from cells treated with DMSO on soft matrix was normalized to 1. Values are presented as Mean ± S.D. n=3. Source numerical data and unprocessed blots are available in source data. n represents the number of independent experiments.
Increased ECM stiffness leads to integrin clustering and cytoskeletal reinforcement, which results in increased tension; reduction of cell tension lessened the proliferative behavior of breast cancer cells in culture5, 7. Phosphorylation of focal adhesion kinase (FAK) plays a pivotal role in ECM stiffness-induced cell tension and Akt activation5, 30, 31. We therefore treated cells with the FAK inhibitor PND-1168 to reduce integrin signaling. At a dose (5 μM) that did not significantly inhibit cell proliferation (Extended Data Fig. 2f), PND-1168 treatment reduced Akt phosphorylation and decreased exosome secretion from cells grown on stiff matrix (Fig. 2h–j), suggesting that focal adhesion contributes to Akt activation and exosome secretion.
Matrix stiffening leads to Rab8 activation that regulates exosome secretion
The Rab family of small GTPases are master regulators of vesicular trafficking. We asked whether Akt regulates the activation of Rab27 and Rab8, two members of the Rab family of small GTP-binding proteins implicated in exocytic trafficking. Rab27 was previously shown to mediate exosome trafficking25. Rab27 and Rab8 share a number of common downstream effectors including JFC1, which specifically binds to Rab proteins in their GTP-bound form32, 33. Interestingly, the Rab-binding domain (RBD) of JFC1 pulled down a significantly increased amount of GTP-Rab8, but not GTP-Rab27, from cells grown on stiff compared to soft ECM (Fig. 3a and 3b). MK-2206 treatment reduced the level of GTP-Rab8 (Fig. 3c and 3d), suggesting that Rab8 was activated downstream of Akt under stiff ECM conditions. An increase in total Rab8 was also observed in cells treated with MK2206 (Fig. 3c), probably through a compensatory upregulation of Rab8 expression in cells when Akt was blocked. To test the role of Rab8 in exosome secretion, we overexpressed Rab8 in Huh7 cells. We found that expression of GFP-Rab8 promoted exosome secretion (Fig. 3e, Extended Data Fig. 3a), and the inhibitory effect of MK-2206 on exosome secretion was also attenuated when Rab8 was overexpressed in cells (Extended Data Fig. 3b). In cells grown on stiff matrix, Rab8 knockdown decreased exosome secretion (Fig. 3f–3h). Treatment of Rab8 knockdown cells with MK-2206 did not further reduce exosome secretion (Extended Data Fig. 3c). Fluorescence microscopy showed that CD63 and LAMP1 displayed perinuclear clustering (Fig. 3i and 3j), consistent with the effect of Akt inhibition (Fig. 2f and 2g). Together, these data suggest Rab8 functions downstream of Akt to regulate exosome secretion in response to a stiff matrix.
Fig. 3. Rab8 regulates stiff ECM-mediated exosome secretion.
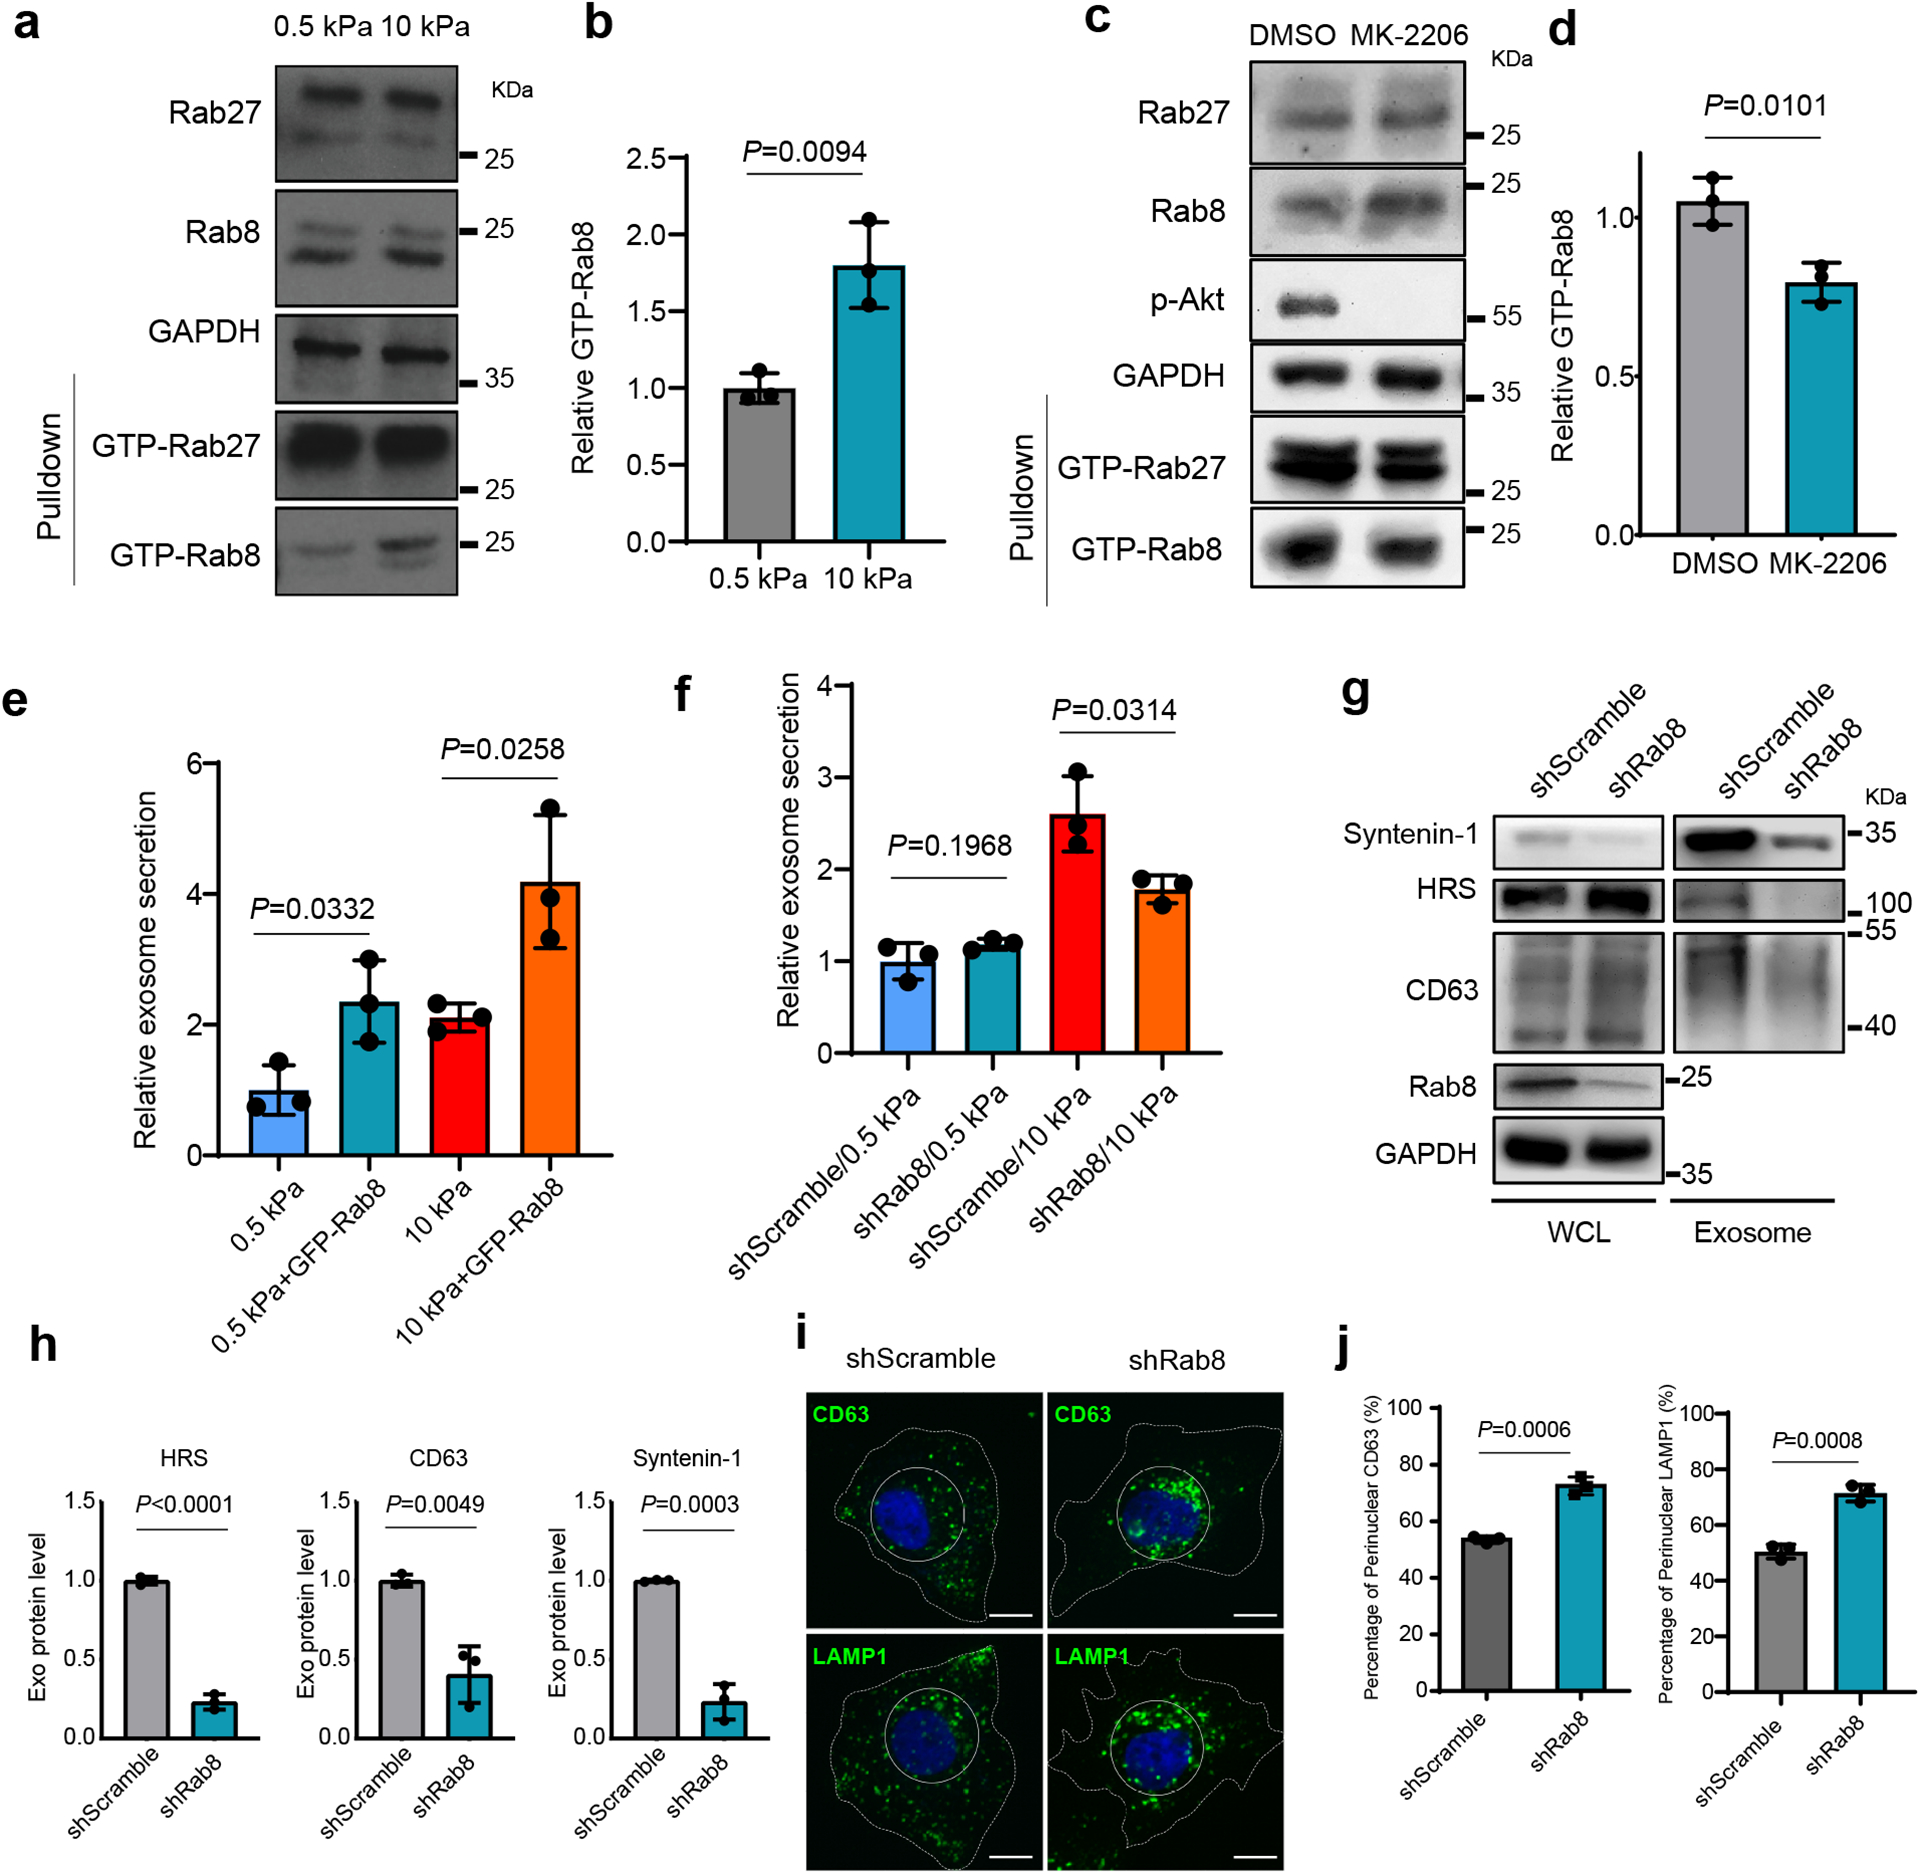
a, The same amounts of lysates from cells grown on 0.5 kPa or 10 kPa matrix were incubated with GST-JFC1 RBD fusion protein. Rab8 and Rab27 in cell lysates or the activated form of Rab8 and Rab27 bound to GST-JFC1 RBD (“GTP-Rab8” and “GTP-Rab27” pulled down) were analyzed by immunoblotting. b, GTP-Rab8 quantified by ImageJ and normalized to levels for cells on soft matrix. Values are presented as Mean ± S.D., n=3. c, Cells grown on stiff matrix were treated with DMSO or MK-2206, and lysed for GST-JFC1 RBD pulldown. Proteins were analyzed by western blotting. d, GTP-Rab8 and GTP-Rab27 were quantified by Image J and normalized to levels of cells treated with DMSO. Values are presented as Mean ± S.D., n=3. e, Huh7 cells expressing GFP or GFP-Rab8 were grown on soft or stiff matrix. The conditioned media were collected for NTA. Exosome concentrations were normalized to those from cells expressing GFP on soft matrix. Values are presented as Mean ± S.D., n=3. f, Conditioned media from Huh7 cells transfected with control shRNA (“shScramble”) or Rab8 shRNA on soft or stiff matrix were collected for NTA. The concentrations of exosomes were normalized to those from cells on soft matrix with control shRNA. Values are presented as Mean ± S.D., n=3. g, Exosomes in the conditioned media of Huh7 cells grown on stiff matrix with or without Rab8 knockdown were purified by ultracentrifugation, and the exosomes from the same number of cells were loaded for immunoblotting for HRS, Syntenin-1, and CD63. h, Quantification of the levels of HRS, Syntenin-1, and CD63. Values are presented as Mean ± S.D. n=3. i, Huh7 cells were treated with control or Rab8 shRNA, and then immunostained for CD63 and LAMP1. Nuclei were stained with DAPI. Rab8 knockdown led to the clustering of CD63 and LAMP1 to the perinuclear region (solid circle). Scale Bar: 10 μm. j, Quantification of the percentage of perinuclear CD63 and LAMP1 signals. Values are presented as Mean ± S.D. n=3. Source numerical data and unprocessed blots are available in source data. n represents the number of independent experiments.
Rabin8 is phosphorylated and activated by Akt
GTP-loading and thus activation of Rab8 is controlled by its guanine nucleotide exchange factor (GEF), Rabin834, 35. Consistent with Rab8 knockdown, Rabin8 knockdown also decreased exosome secretion (Fig. 4a–4c). Sequence analysis and mass spectrometry studies on Rabin8 (PhosphoSitePlus) led to the identification of a phospho-peptide “142LSRLRSPS*VLEVREK156”, which is conserved across species and matches the consensus Akt phosphorylation motif “RxRxxS/T” (Extended Data Fig. 3d). Rabin8 was highly phosphorylated in cells expressing constitutively active Akt, and the phosphorylation was abolished when the serine residue was substituted with alanine (“S149A”) by site-mutagenesis (Fig. 4d). In vitro assays using purified recombinant GST-Rabin8 and myr-Akt confirmed that Rabin8 can be directly phosphorylated by Akt at S149 (Fig. 4e). Rabin8 phosphorylation was detected in cells grown on the stiff matrix and was inhibited by MK-2206 treatment (Fig. 4f), confirming that increased matrix stiffness promoted Rabin8 phosphorylation by Akt.
Fig. 4. Rabin8 is phosphorylated and activated by Akt in cells grown on stiff ECM.
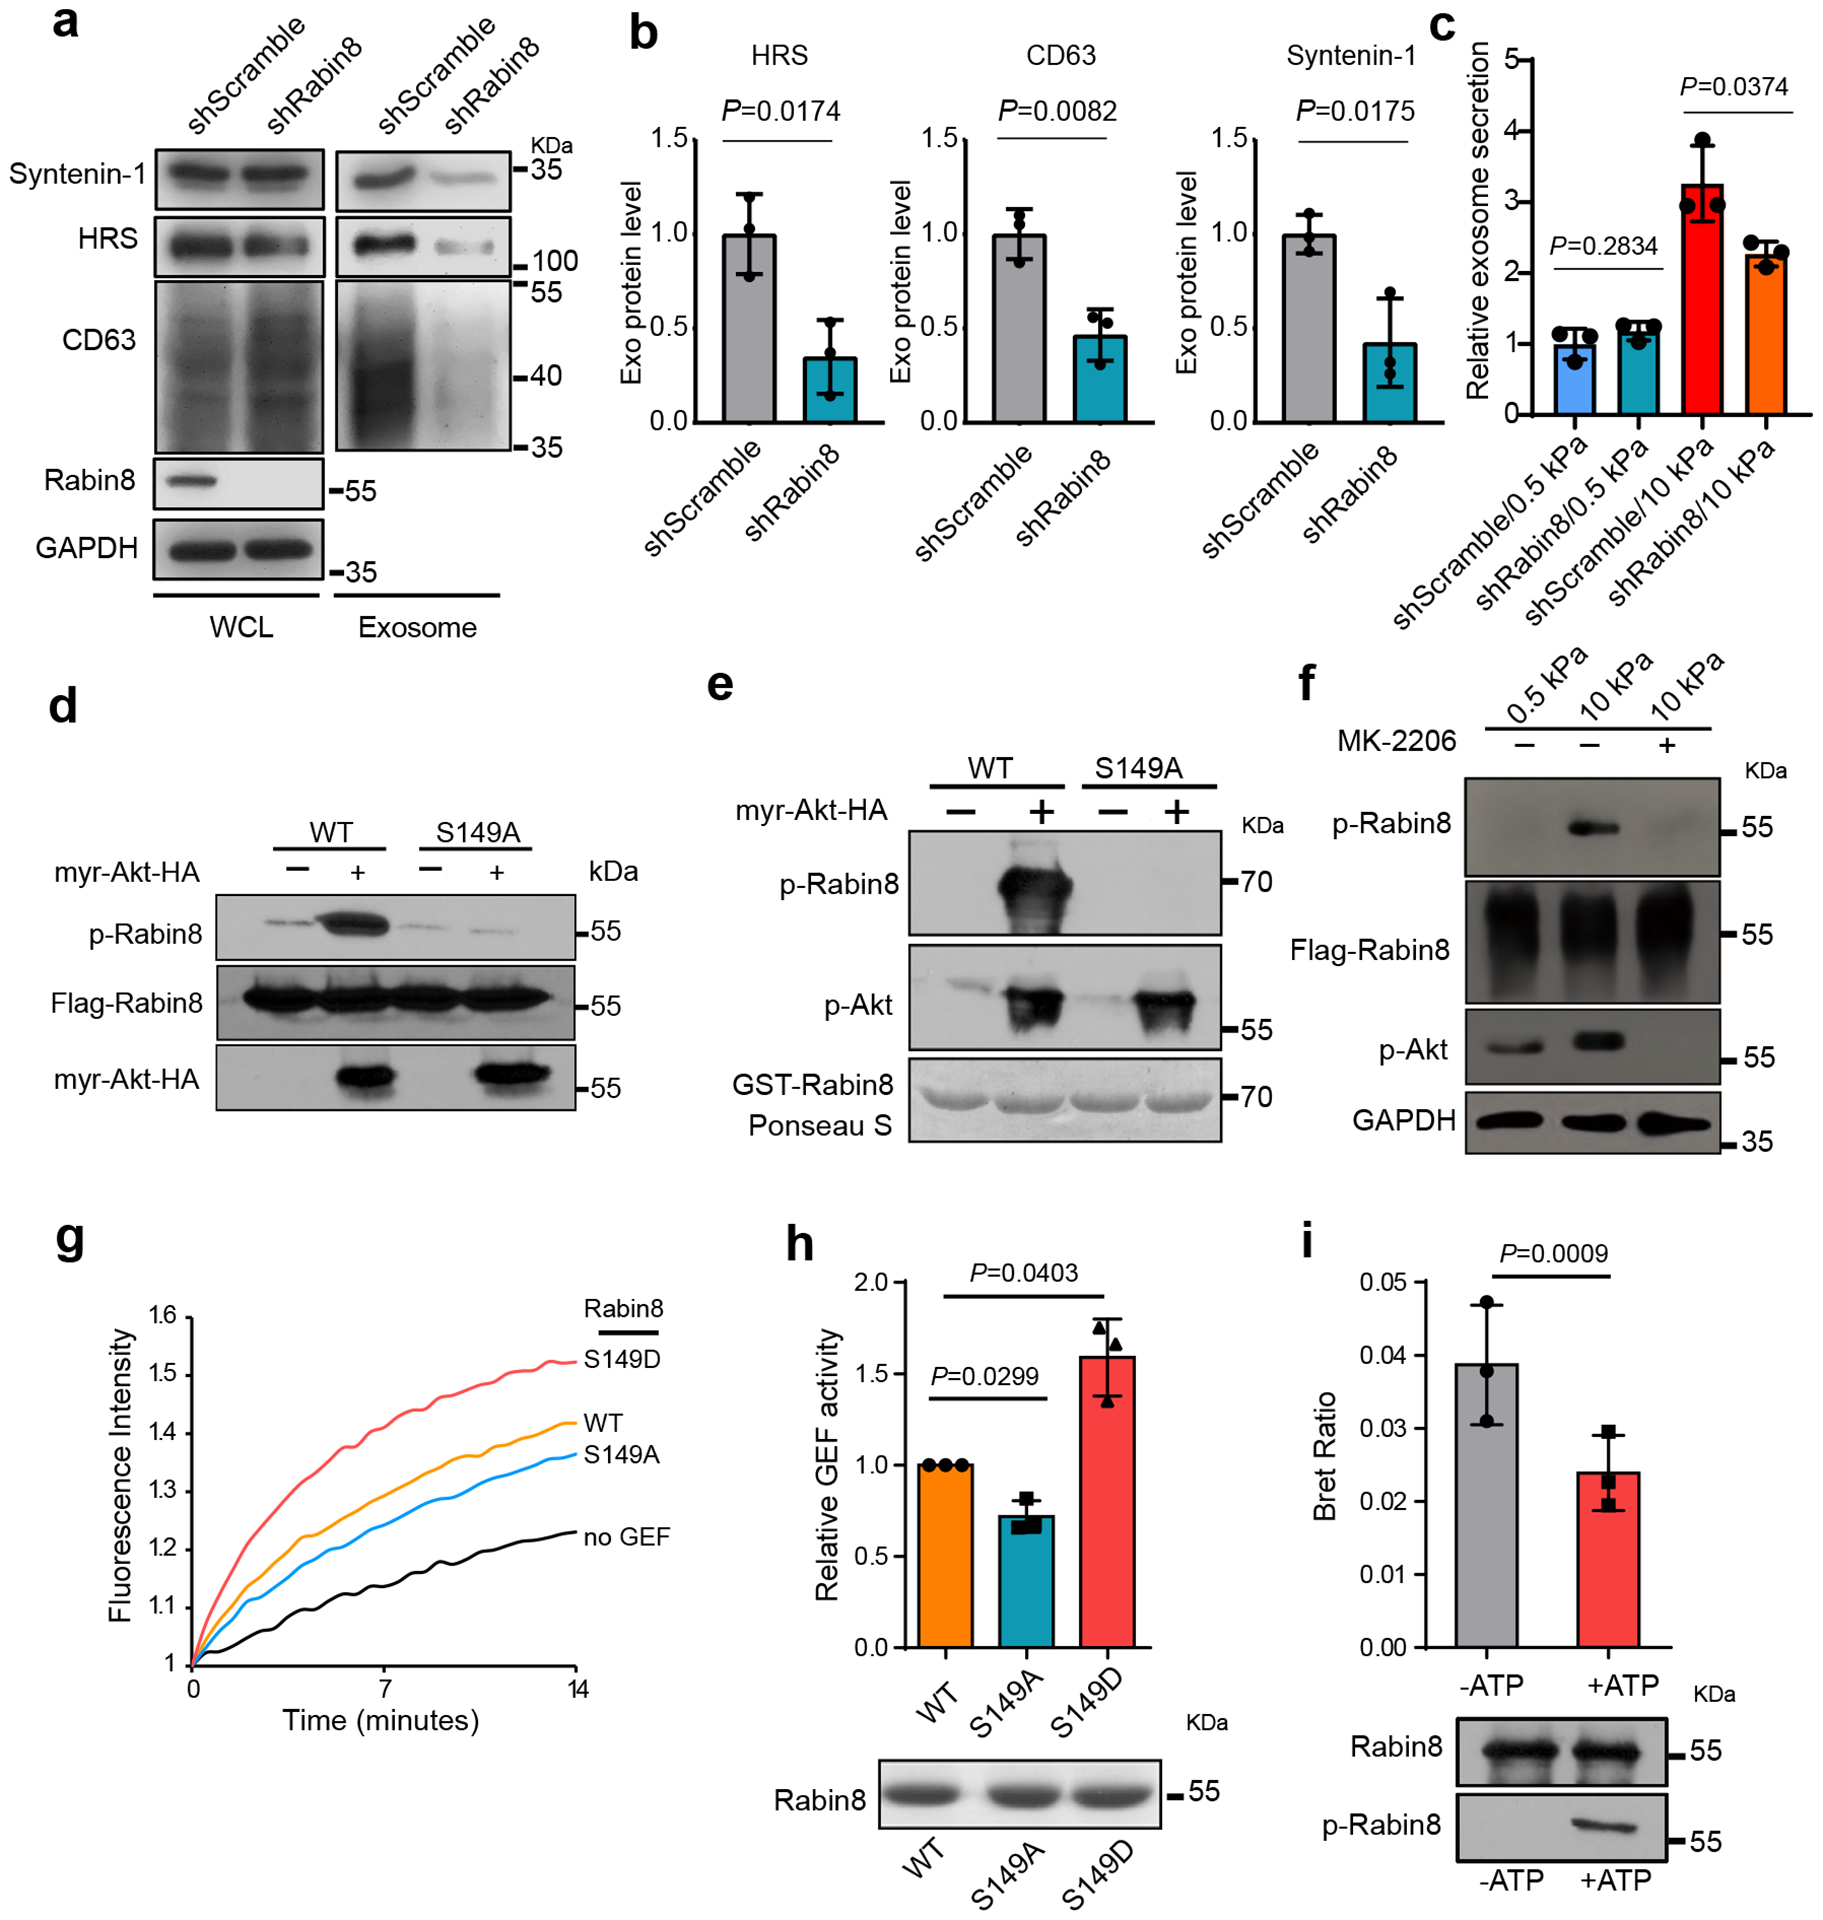
a, Huh7 cells grown on stiff matrix were transfected with control or Rabin8 shRNA. Exosomes in cell media were purified by ultracentrifugation, and the exosomes from the same number of cells were loaded for immunoblotting with antibodies against HRS, CD63, and Syntenin-1. b, Exosomal HRS, CD63, and Syntenin-1 were quantified. Values are presented as Mean ± S.D. n=3. c, Conditioned media from cells treated with control or Rabin8 shRNA on soft and stiff matrix were collected for NTA. Exosome concentrations were normalized to those from cells transfected with control shRNA on soft matrix. Values are presented as Mean ± S.D., n=3. d, Flag-tagged wild-type Rabin8 (WT) or the phospho-deficient mutant Rabin8 (S149A) were co-expressed with myr-Akt or control vector into cells. Flag-Rabin8 was isolated with anti-Flag M2 beads. The phosphorylation of Rabin8 by Akt was examined by phospho-Akt substrate antibody. e, Purified GST-Rabin8 was incubated with or without purified myr-Akt. in vitro phosphorylation of Rabin8 was examined by an Akt phospho-substrate antibody. GST-Rabin8 proteins inputs were shown by Ponceau S. staining. f, Huh7 cells expressing Flag-Rabin8 were grown on soft or stiff matrix. Flag-Rabin8 was pulled down by anti-Flag M2 beads, and its phosphorylation was examined by Akt phospho-substrate antibody. Treatment of cells with MK-2206 inhibited Rabin8 phosphorylation. g, The exchange of GDP-BODIPY bound to Rab8 catalyzed by the wild-type Rabin8, phospho-deficient Rabin8 mutant (S149A), and phospho-mimetic Rabin8 mutant (S149D) was measured. h, Quantification of GEF activities at 7 mins. Values are presented as Mean ± S.D., n=3. Coomassie blue staining shows the protein samples used in the GEF exchange assay. i, Purified Rabin8-NLHT proteins were first incubated with active Akt with or without ATP and then used in the BRET assay. BRET ratios (620nm/460nm) compared. Values are presented as Mean ± S.D., n=3. Immunoblotting of Rabin8 proteins used in BRET assay and their phosphorylation in the presence of ATP were shown below. Source numerical data and unprocessed blots are available in source data. n represents the number of independent experiments.
To investigate how phosphorylation of Rabin8 leads to Rab8 activation, we examined the GEF activity in vitro by performing Rab8 GDP-BODIPY loading assay in the presence of wild type or mutant Rabin8. Compared to wild type Rabin8, the phospho-mimetic mutant Rabin8 (S149D) significantly accelerated the loading of GDP-BODIPY to Rab8, whereas the phospho-defect mutant Rabin8 (S149A) showed a slightly slower loading rate, suggesting that Akt phosphorylation increased Rabin8 GEF activity (Fig. 4g and 4h). Previous bioluminescence resonance energy transfer (BRET) analyses demonstrated that Rabin8 adopts an auto-inhibitory conformation35, 36 (Extended Data Fig. 3e). The BRET ratio, an indicator of auto-inhibition of Rabin836, decreased upon Akt phosphorylation (Fig. 4i), consistent with enhanced GEF activity. Comparing to the cells expressing wild type Rabin8, cells expressing Rabin8 (S149A) secreted fewer exosomes, while those expressing Rabin8 (S149D) secreted more exosomes (Extended Data Fig 3f). Taken together, these results suggest that stiff matrix induces phosphorylation of Rabin8 by Akt, and leads to activation of Rabin8 and subsequent Rab8 GTP-loading, which ultimately promotes exosome secretion.
Exostiff promotes tumor aggression through Notch pathway activation
Tumor-derived exosomes promote tumor growth and cancer progression21, 26, 27. To examine the potential role of exosomes released in cells on a stiff matrix on tumor progression, a syngeneic Hepa1-6 hepatoma model was established in C57L/J mice. Similar to the human cell line Huh7, exosome secretion from the mouse hepatoma cell line Hepa1-6 also showed higher levels of exosome secretion on stiff matrix (Extended Data Fig. 4a–d). We injected the same amounts of exosomes derived from Hepa1–6 cultured on stiff and soft ECM into mice. Exostiff significantly promoted Hepa1–6 tumor growth in comparison to Exosoft (Fig. 5a and 5b). Immunohistochemistry analysis showed higher levels of expression of the proliferation markers Ki67 and PCNA in Exostiff treated tumors, while the expression of cleaved Caspase 3 was comparable in both treatment groups (Fig. 5c and 5d). In addition to using Exostiff and Exosoft, we have also infused exosomes derived from Hepa1–6 cells grown on stiff matrix that were treated with MK-2206 (“ExoMK-2206”). ExoMK-2206 failed to promote tumor growth (Extended Data Fig. 4e).
Fig. 5. Exosomes induced by stiff matrix promote tumor growth.
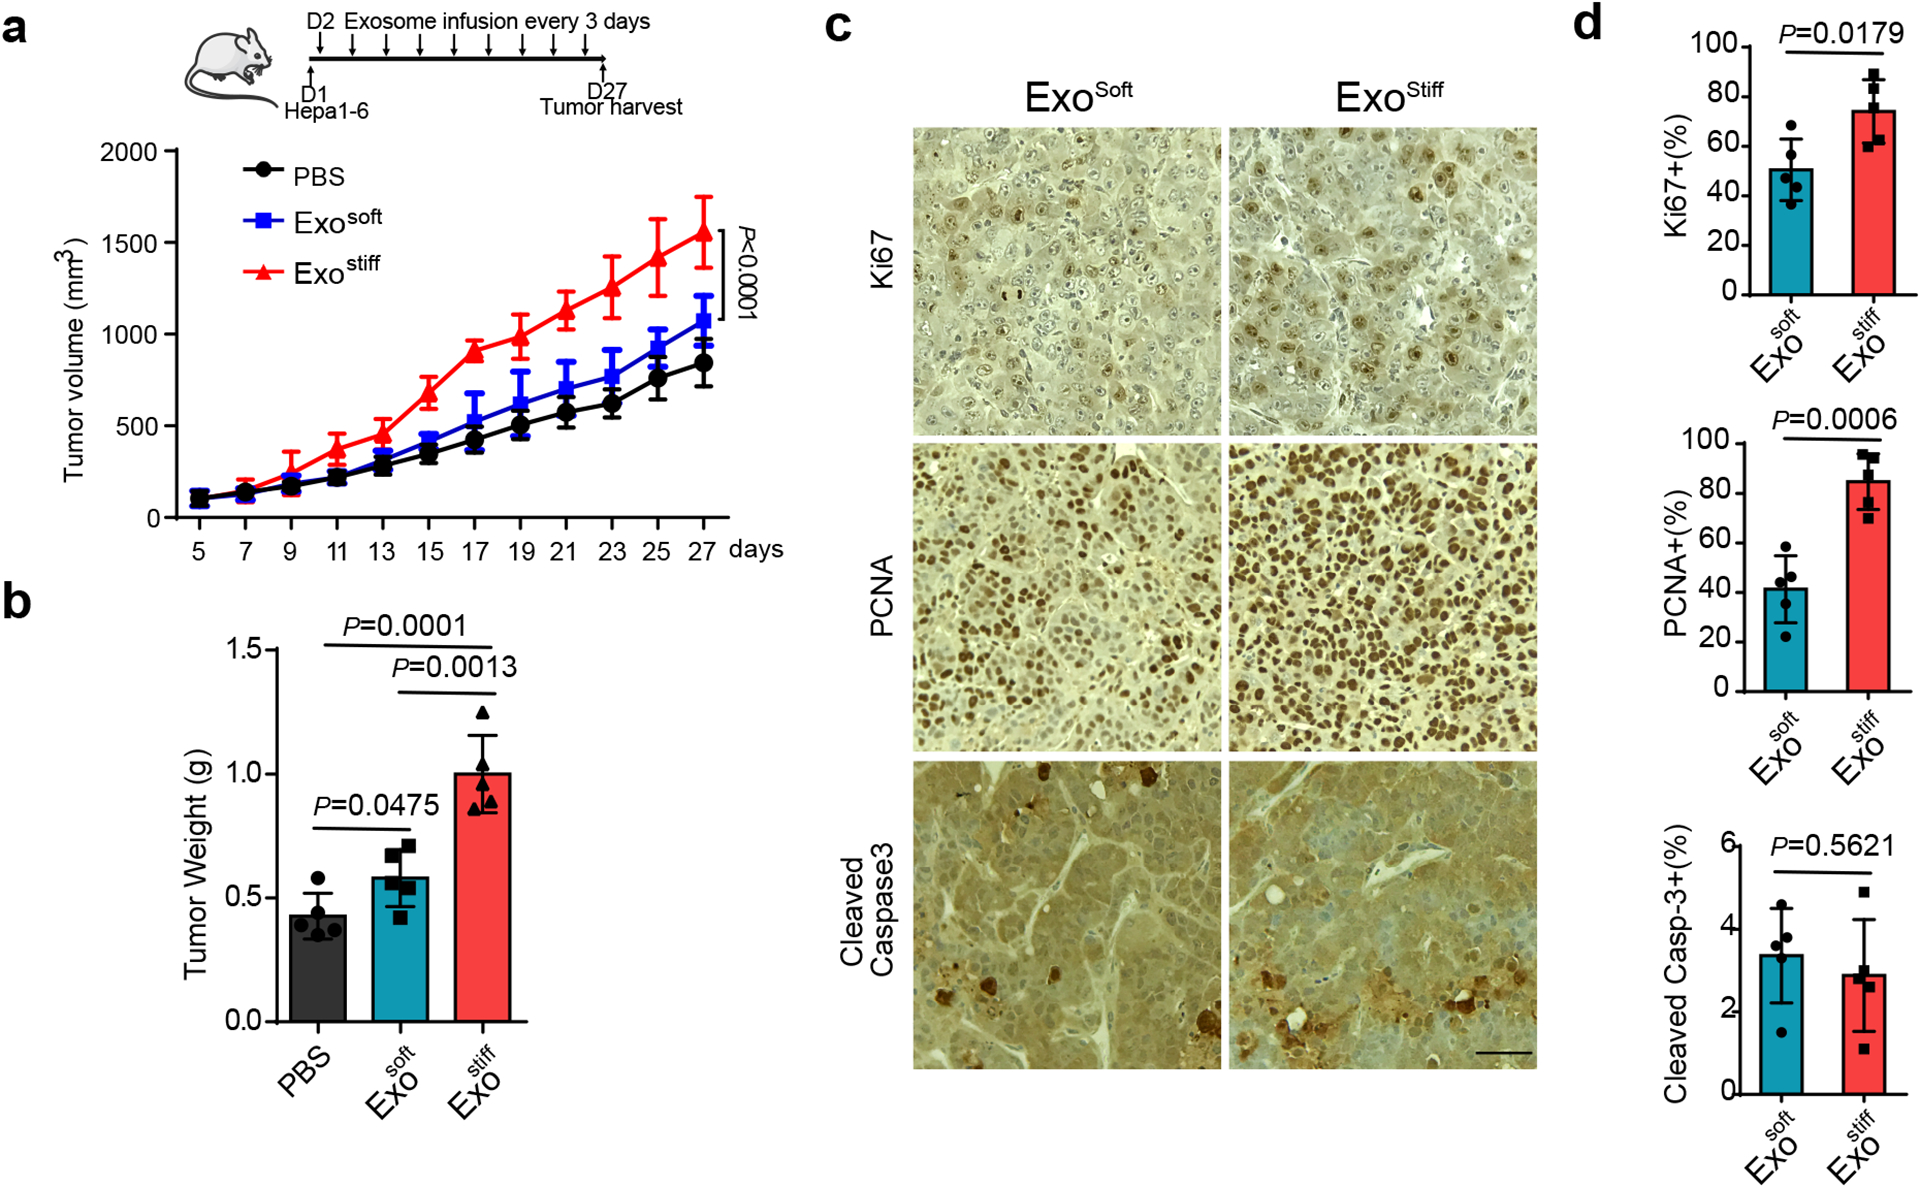
a, Growth curves of Hepa1-6 tumors in C57L/J mice injected with PBS and indicated exosomes (n=5). Values are presented as Mean ± S.D. A diagram indicating the time points of exosome infusion is shown at the top. b, The weights of Hepa1-6 tumors in C57L/J mice after treatment with PBS, Exosoft or Exostiff (n=5). Values are presented as Mean ± S.D. c, Immunohistochemistry of Ki67, PCNA and cleaved Caspase3 on xenograft of mice treated with Exosoft or Exostiff. d, Quantification of cells stained positive with these marker proteins were shown to the right. Scale Bar: 100μm. For all figures above, values are presented as Mean ± S.D., n=5. Source numerical data are available in source data. n represents the number of animals.
As mentioned above, one of the gene clusters that was upregulated in cells grown on stiff ECM in our RPPA analysis was related to Notch signaling pathway (Extended Data Fig. 2a and Extended Data Fig. 5). Western blotting analysis confirmed higher levels of expression of Sox9, c-Myc, Jagged1, and Hes1 in cells cultured on stiff substrates (Fig. 6a), suggesting the activation of the Notch pathway by increased tissue stiffness. Notch signaling promotes cancer progression37 and recent studies have implicated Notch signaling in HCC progression38, 39. Here we analyzed the expression of the Notch downstream genes Hey1, Hey2, Hes1, and Sox9 in non-tumor tissues derived from HCC patients in the Liver Cancer Initiative (LCI). Patients with an active Notch signature had significantly higher levels of alanine transaminase and lower levels of albumin, suggesting a correlation between Notch activation and increased liver damage (Extended Data Fig. 6a and Extended Data Fig. 6b). An activated hepatic stellate cell (HSC) gene signature was previously shown to play a key role in liver fibrosis and cirrhosis40–42. Patients with Notch activation were significantly enriched in the group with the HSC signature (Extended Data Fig. 6c). Moreover, a higher proportion of Notch activation was found in patients with cirrhosis (Extended Data Fig. 6d). Survival risk prediction shows that high Notch gene expression was associated with poor prognosis (Extended Data Fig. 6e). We next sought to determine which Notch pathway-associated genes played a major role in tissue stiffening and tumor progression. We performed Ingenuity Pathway Analysis (IPA) to determine differentially expressed genes between patients with activated and non-activated Notch. We found significant enrichment in signaling pathways including hepatic stellate activation, PI3K/AKT signaling, and mTOR signaling in patients with Notch activation (Extended Data Fig. 6f). These activated pathways are closely related to the Akt/mTOR/Jagged1 signaling cascade43. Together, these data suggest that activated Notch signaling is associated with liver stiffness and HCC progression.
Fig. 6. Notch signaling is activated in cells grown on stiffness ECM or treated with Exostiff.
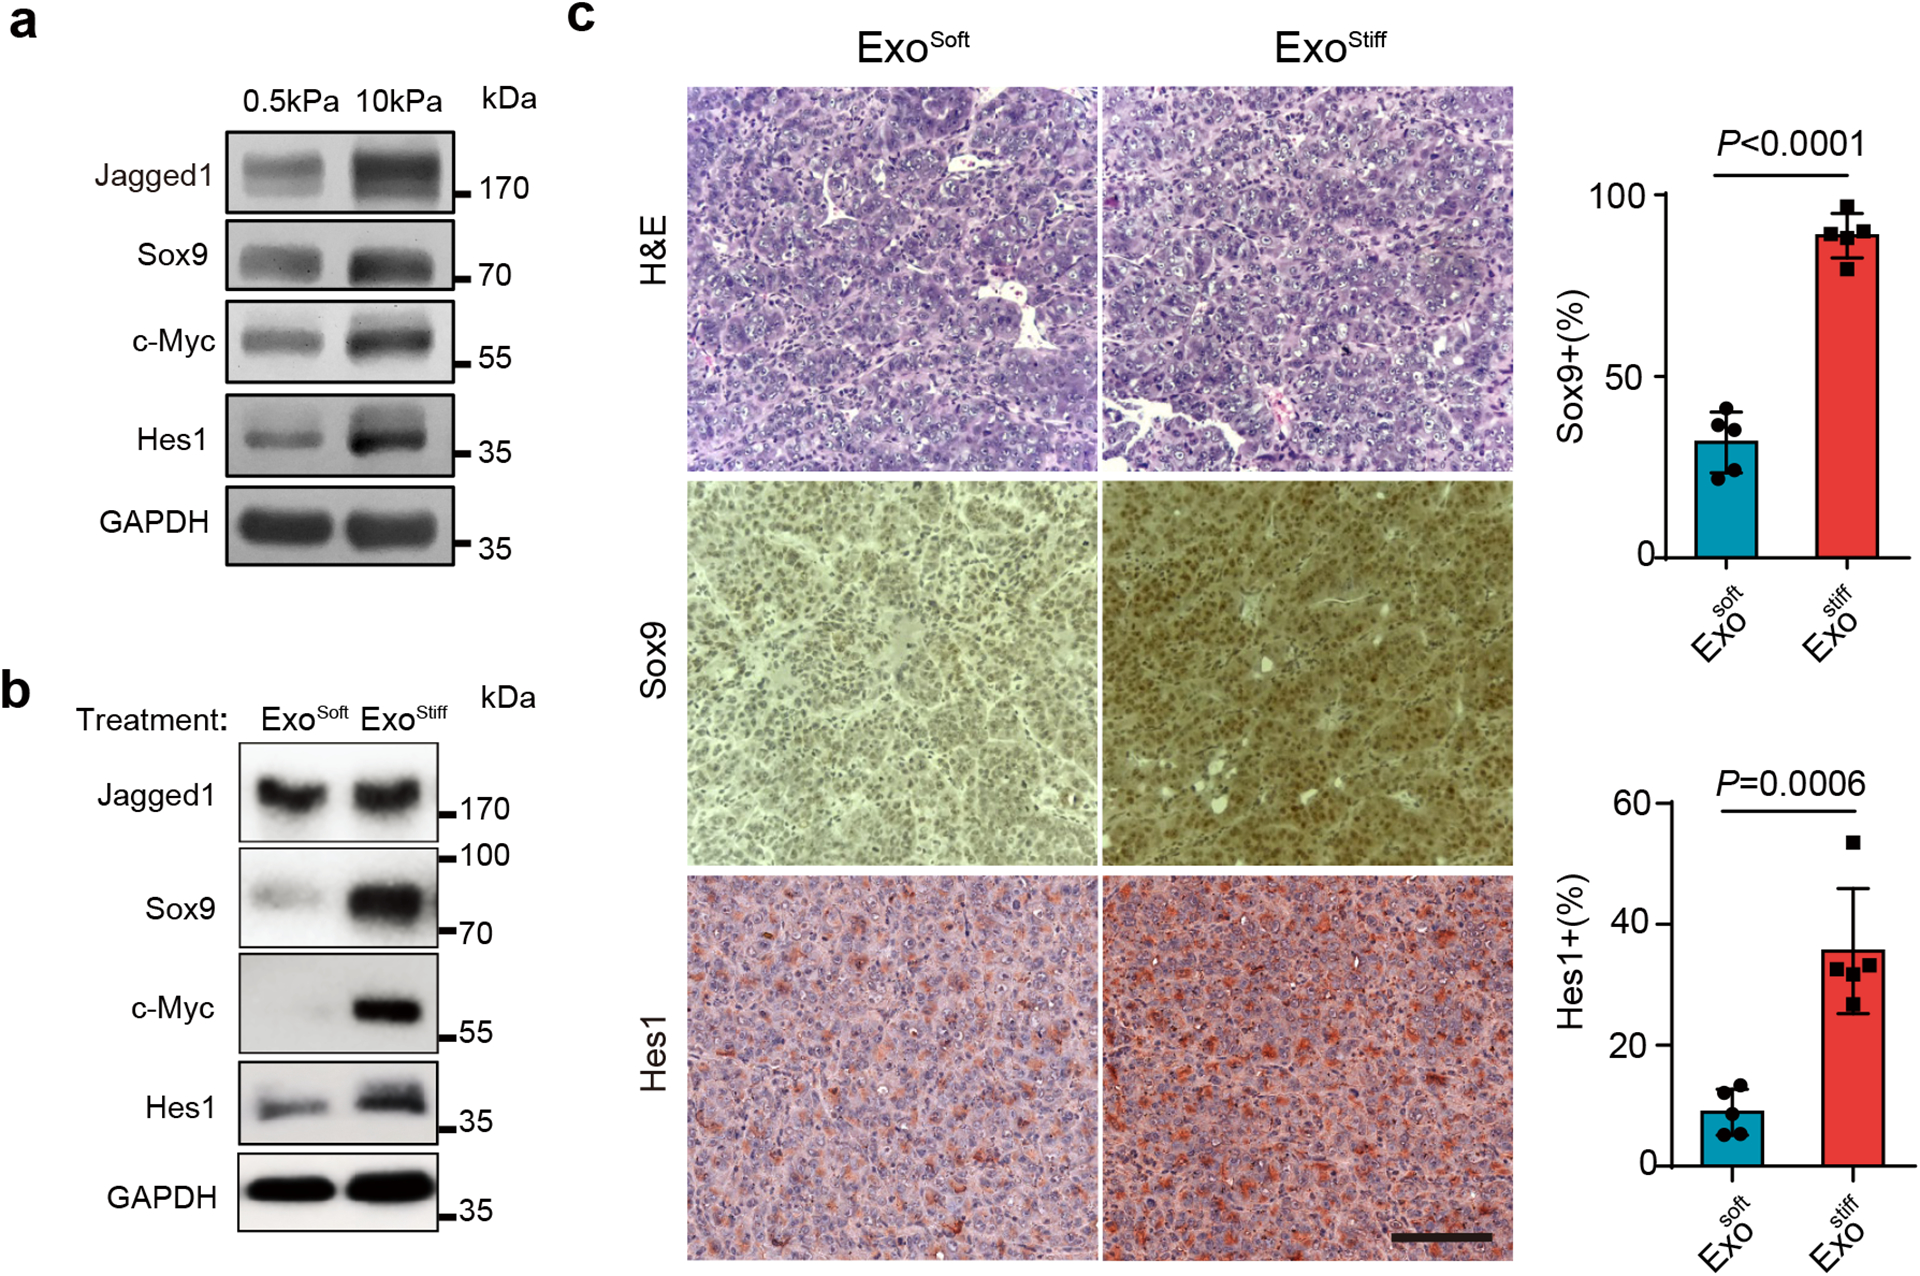
a, Huh7 cells grown on 0.5 or 10 kPa matrix were lysed and the cell lysates were subject to immunoblotting for Notch signaling proteins Sox9, c-Myc, Hes1, and Jagged1. GAPDH was used as a loading control. Molecular weights (in kDa) are shown to the right. b, Huh7 cells grown on the soft matrix were treated with Exosoft or Exostiff. Cell lysates were subjected to immunoblotting with antibodies against Notch pathway proteins. GAPDH was used as a loading control. c, Immunohistochemistry of tumors from mice treated with Exosoft or Exostiff. Tumor tissues were harvested at Day 27 and stained with H&E, Sox9, or Hes1. Scale Bar: 100μm. The percentages of Sox9 and Hes1-positive cells in mouse xenografts were shown at the right. Values are presented as Mean ± S.D., n=5. Source numerical data and unprocessed blots are available in source data. n represents the number of animals.
Next, we tested whether Exostiff contributes to the up-regulation of Notch signaling in Huh7 cells. Cells cultured on soft ECM were treated with purified exosomes. The expression of Notch downstream proteins Sox9, c-Myc, and Hes1 were elevated in cells treated with Exostiff in comparison to those treated with Exosoft (Fig. 6b). It was previously shown that Notch activation led to the formation of HCC-like tumors in mice39. We thus asked whether treatment of Hepa1-6 tumor bearing mice with Exostiff would lead to increased Notch signaling. Exostiff-treated tumor tissues displayed a higher level of expression of Sox9 and Hes1, suggesting the activation of Notch signaling (Fig. 6c).
The Notch pathway is activated when Notch binds to its ligand, Jagged1. In the gene list, we found that Jagged1 was significantly upregulated in patients with activated Notch (Extended Data Fig. 6g). These data suggest that Notch activation was correlated with increased tissue stiffness and tumor progression, probably through Jagged1. Consistent with the data, a higher level of Jagged1 expression was detected in cells grown on stiff matrix as examined by western blotting (Fig. 6a). Notch signaling promotes cancer progression through the regulation of the tumor microenvironment37. It was recently reported that Jagged1 is present on exosomes, and exosomal Jagged1 can potentially activate Notch signaling in receptor cells44. In our proteomics analysis by RPPA, Jagged1 showed higher expression level on Exostiff than on Exosoft (Extended Data Fig. 7). We also found that Jagged1 was enriched in Exostiff for both Huh7 cells and Hepa–6 cells as analyzed by western blotting (Fig. 7a and 7b). Fluorescence microscopy showed that Jagged1 had a higher level of colocalization with exosome marker CD63 and the ESCRT-0 subunit HRS, which mediates exosome cargo sorting into the MVEs, in cells grown on stiff matrix (Fig. 7c and 7d). Co-immunoprecipitation experiments showed an association of Jagged1 with HRS (Fig. 7e). Together, these data suggest that increased Jagged1 expression contributes to the stimulatory function of Exostiff in tumor growth.
Fig. 7. Jagged1 is enriched in Exostiff.
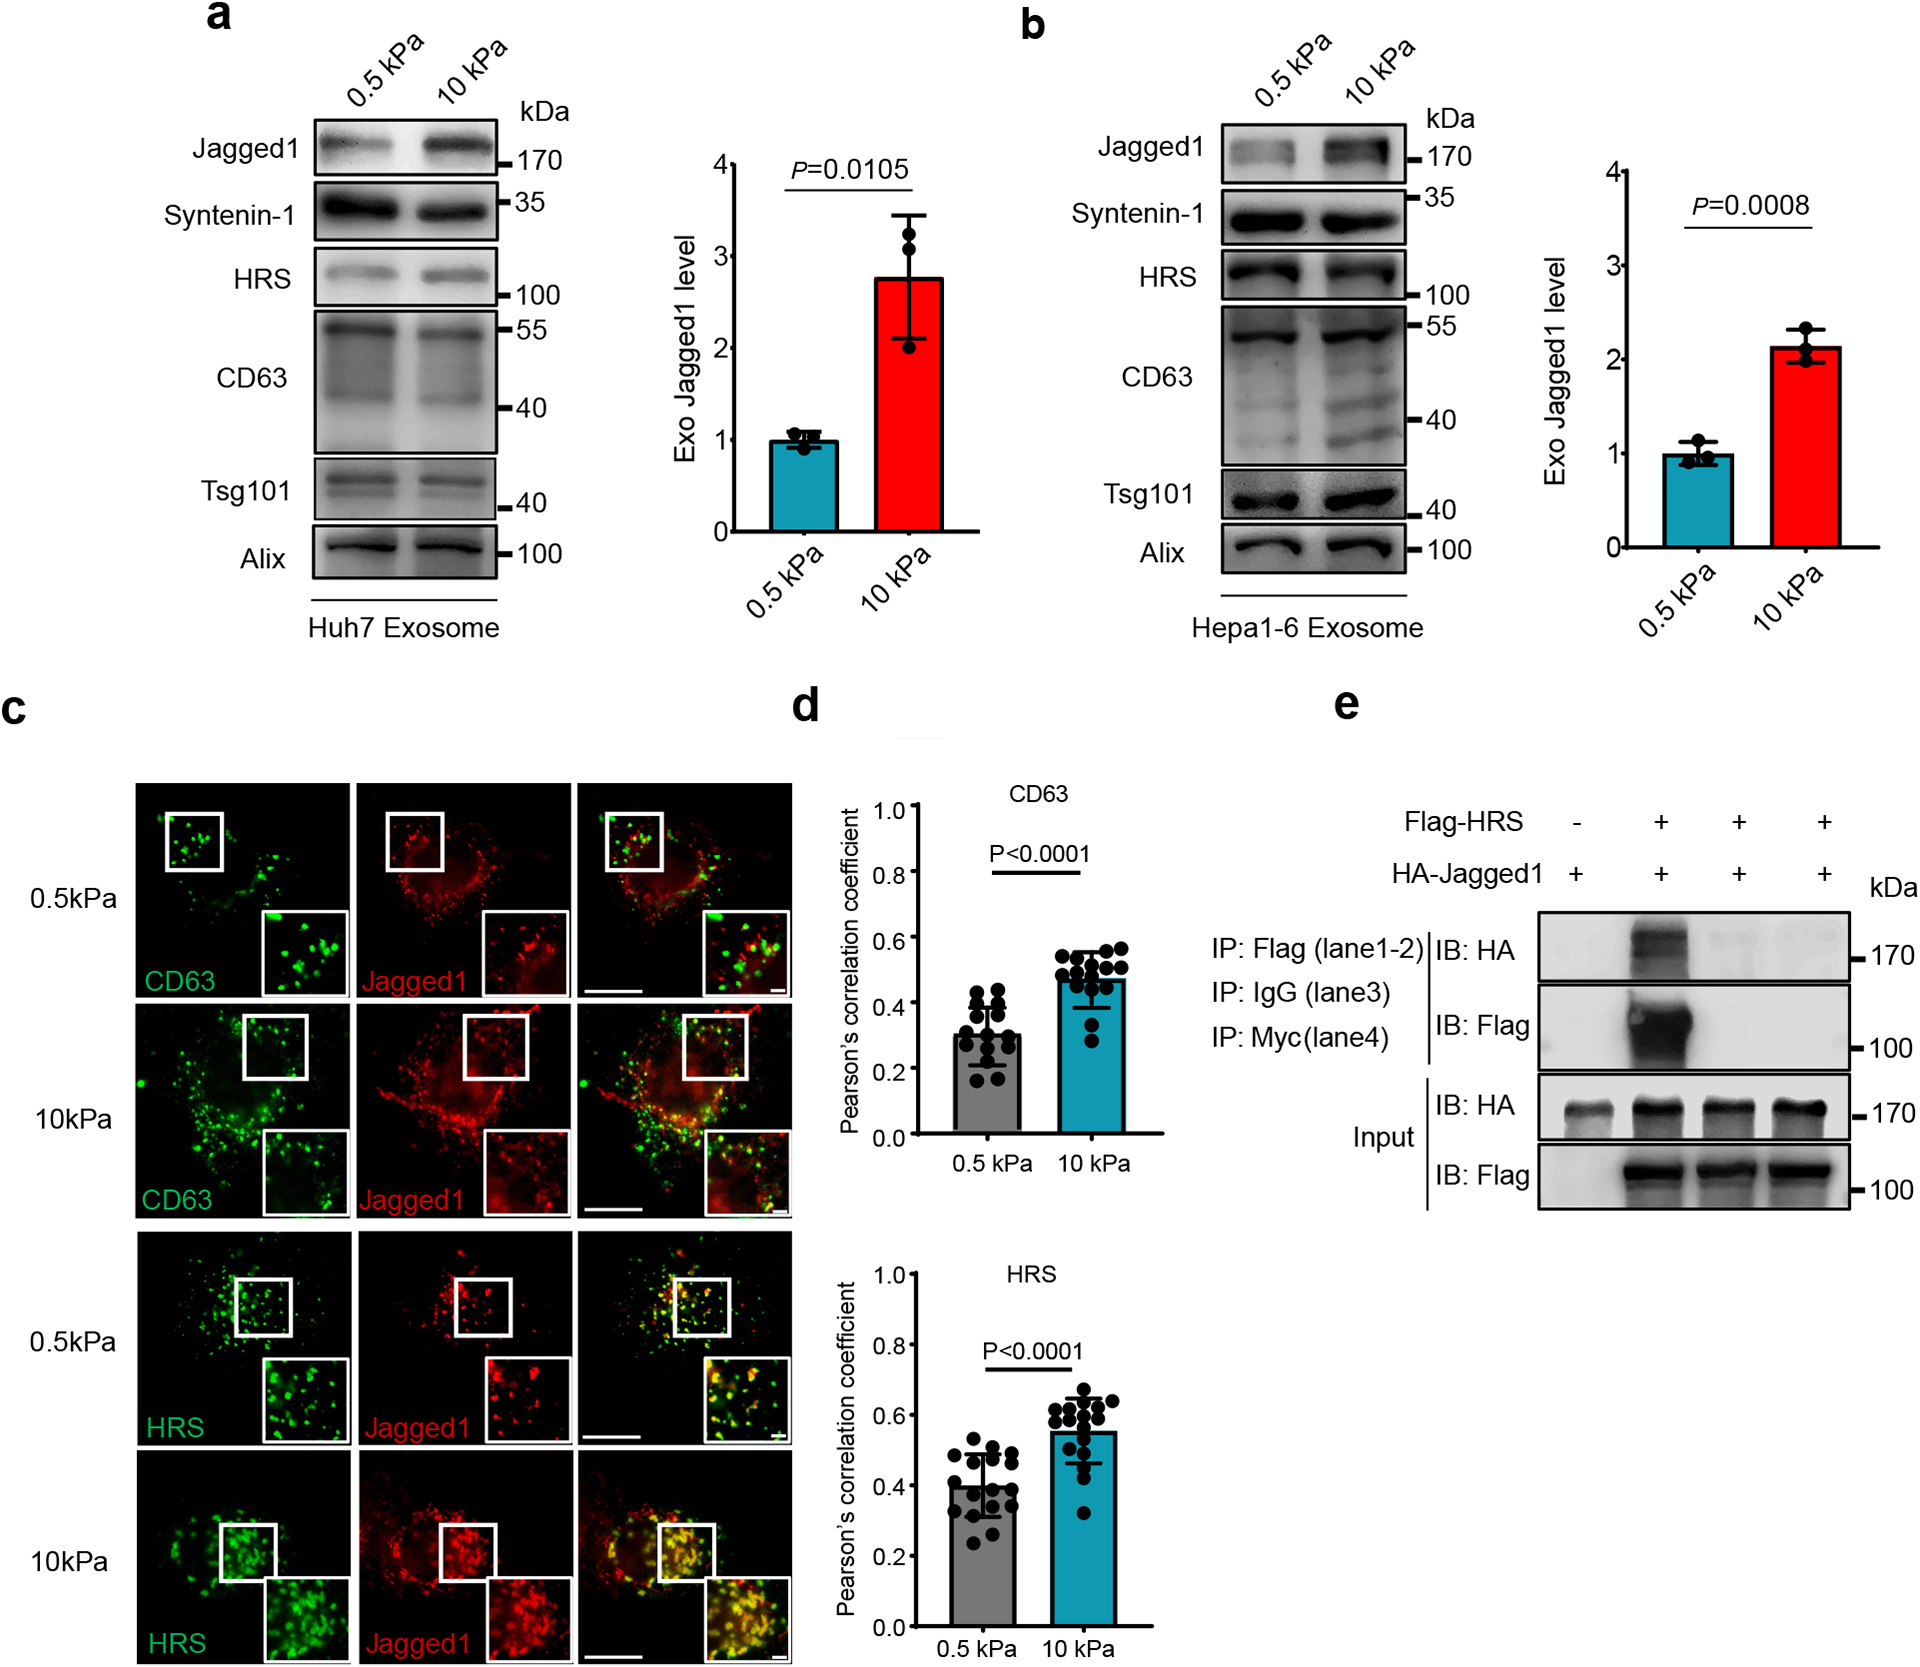
a, b, Exosomes were purified from the conditioned media of Huh7 (a) or Hepa1-6 cells (b) on soft or stiff matrix. The same amounts of exosomes were loaded for immunoblotting of Jagged1, Syntenin-1, HRS, CD63, Tsg101. The quantification is shown at the right. (n=3 independent experiments) c, Jagged1 in Huh7 cells grown on soft and stiff matrix were co-immunostained with antibodies against CD63 or Flag-tagged HRS for fluorescence imaging. Scale Bar: 10μm. Zoom-in view Scale bar: 1μm.d, Pearson’s correlation coefficient of Jagged1 colocalized with CD63 (n=15) or HRS (n=17). n represents the number of cells. e, HA-tagged Jagged1 was co-transfected with Flag-tagged HRS or vector into cells. The cell lysates were subjected to immunoprecipitation with anti-Flag M2 beads. Isotype IgG and anti-Myc epitope antibodies were used as negative controls. For all figures above, values are presented as Mean ± S.D. Source numerical data and unprocessed blots are available in source data.
DISCUSSION
ECM stiffening promotes the progression of various types of cancers1–8. Our study suggests that the effect of ECM stiffness on tumor progression is not only mediated through the intracellular signaling of the cells directly in contact with the ECM, but also involves extracellular vesicles such as the exosomes. Increased ECM stiffness upregulates exosome secretion, which in turn leads to changes in the tumor microenvironment that promote tumor growth.
Our proteomics analysis and biochemistry experiments demonstrate that Akt is activated in Huh7 cells grown on stiff ECM. This result is consistent with a previous observation that PI3K is activated in cancer cells grown on stiff ECM5, 31, 45. Increased ECM stiffness has also been shown to lead to decreased expression of PTEN, which functions to counteract PI3K upstream of Akt activation46. Our gain-of-function and knockdown experiments establish that activated Akt mediates the signaling from stiff ECM to exosome secretion. Previous studies showed that increased ECM stiffness led to integrin clustering and cytoskeletal engagement for focal adhesion formation, which results in increased tension and oncogenic signaling, and inhibition of FAK, a pivotal protein in adhesion, reduced tension5, 7, 30. Here we found that inhibition of FAK reduced Akt activation and exosome release from cells grown on stiff ECM.
In searching for proteins that function to up-regulate exosome secretion, we found that Rab8 is activated in cells in response to increased ECM stiffness. Inhibition of Rab8 reduced exosome secretion on stiff ECM. Conversely, for cells grown on soft ECM, increased expression of Rab8 promotes exosome secretion. These results demonstrate that Rab8 is a key regulator of exosome secretion. To understand how Rab8 is activated upon increased ECM stiffness, we further identified Rabin8, the GEF of Rab8, as a direct downstream target of Akt. Akt phosphorylates Rabin8 at Serine 149. Our biochemistry analyses suggest that phosphorylation at Serine 149 relieves the autoinhibition of Rabin8, which in turn promotes GTP loading to Rab8 to stimulate exosome secretion. Our results reveal a molecular pathway from ECM stiffness to exosome release. Recently, it was also reported that Akt can phosphorylate Rabin8, thereby affecting Rab11a binding to its effector, WDR44, during primary ciliogenesis47. It will be interesting to investigate the role of other Rabin8-associated proteins in exosome secretion under stiff ECM conditions.
At a functional level, we examined whether exosomes generated under stiff ECM influence tumor growth. Our data show that Exostiff significantly promoted the growth of tumor cells in comparison to Exosoft, suggesting that ECM stiffness not only affects intrinsic oncogenic signaling on the contacting tumor cells but also through the production of tumor-promoting exosomes. It is likely that the tumor-promoting effect of Exostiff was mediated through their influence on different types of cells in the tumor microenvironment (e.g., immune cells and fibroblasts) in addition to the tumor cells.
Since the same amounts of Exosoft and Exostiff were used in our experiments, the different effects we observed is probably due to the different compositions between the two types of exosomes. Our proteomics analysis and western blotting experiments showed that Exostiff carried a higher level of Jagged1, a key ligand for Notch activation. A recent study showed that exosomal Jagged1 can activate Notch signaling in receptor cells44, and Notch pathway has been shown to promote the growth of tumors including HCC through paracrine signaling37–39, 48. Our proteomics analysis shows that proteins involved in Notch signaling such as Sox9, Hes1, Jagged1, c-Myc are upregulated in cells grown in stiff ECM conditions. Consistent with these results, our analysis of patient data in Liver Cancer Initiative shows that Notch activation is correlated with cirrhosis and poor prognosis in patients with HCC. Supporting this notion, treatment of tumor cells with Exostiff up-regulates intracellular expression of Sox9, Hes1, and c-Myc, which are all involved in Notch signaling.
Besides furthering the mechanistic understanding the exosome biogenesis, our findings also underscore the need to consider the mechanical properties of substrate used in the study of exosome biogenesis, secretion, and function. This consideration applies not only to cancer but may also to the study of other diseases such as neurodegenerative and cardiovascular disorders.
METHODS
Reagents and cell culture
Human cell lines Huh7 (Cat: CCLV-1079, RRID: CVCL_0336, ATCC), Panc1 (Cat: CRL-1469, ATCC), MCF-7 (Cat: HTB-22, ATCC), and mouse cell line Hepa1-6 (Cat: CRL-1830, ATCC), were cultured in DMEM (Mediatech) supplemented with 10% (v/v) fetal bovine serum (FBS) (Sigma). Cryo-preserved primary human hepatocytes (PHH) were purchased from BD Bioscience (Cat: 454541 BD Gentest Bioscience). PHH were thawed according to the manufacturer’s instructions using Cryopreserved Hepatocyte Recovery Medium (CM7000, Thermo Fisher Scientific) and resuspended in Williams Medium E (Sigma-Aldrich) with plating supplements (CM3000, Thermo Fisher Scientific). MCF10A (Cat: CRL-10317, ATCC), MCF10AT and MCF10CA1d cells (derived from MCF10A in Dr. Fred Miller’s Lab, Karmanos Cancer Institute, Wayne State University) were cultured in mammary epithelial cell CM (PromoCell) according to the protocol recommended by ATCC.
Myr-Akt-HA construct was obtained from Dr. Morris Birnbaum. Jagged1-HA pIRES was a gift from Joan Conaway & Ronald Conaway (Addgene plasmid # 17336; http://n2t.net/addgene:17336 ; RRID:Addgene_17336). Human HRS was constructed into pCMV-3xFlag vector. Flag-tagged Rabin8 and its mutant (S149A, S149D) were cloned into pRlenti vector and transfected into cells with lentivirus. GST-JFC1-RBD (Rab binding domain) was cloned into pGEX-2T-Jg-D1 vector. GST-Rabin8 and GST-Rabin8(S149A) were cloned into pGEX-6P-1 vector. Short hairpin RNAs (shRNA) for human Rab8a (target sequence: AACAAGTGTGATGTGAATGAC) and Rabin8 (target sequence: GTACTGATAGTCTGTCTCGTT) were cloned into pLKO.1 (Addgene 10878). Plasmids were transfected into cells using PEI (Sigma) or Lipofectamine 2000 (Invitrogen, Carlsbad, CA). Cells transfected with shRNA lentivirus were selected by puromycin. Akt inhibitor (MK-2206, GDC-0068) and FAK inhibitor (PND-1168) were purchased from Selleckchem. Antibodies used in this work are listed in Supplementary Table 1.
Polyacrylamide gels
Polyacrylamide gels of variable stiffness were prepared on glass coverslips or 60 mm or 150 mm dishes with modifications of the method initially described28, 29 . Briefly, the glass coverslips or glass dishes were treated with 0.1M NaOH, followed by 0.5% 3-APTMS (Sigma) and 0.5% glutaraldehyde solution (Electron Microscopy Sciences) and air-dried. Acrylamide and bis-acrylamide (National Diagnostics) were mixed in defined ratios (determined by the stiffness) in PBS, and gel polymerization was promoted by the addition of 10% APS (1/100 volume, Millipore) and TEMED (3/1000 volume, Invitrogen). The gel mixture was then dropped on the coverslips and a coverslip that had been treated with a hydrophobic silicone polymer (Rain-X, Illinois Tool Works) was lowered onto the gel droplet. For glass dishes, waterproof membrane films were cut according to the dish size to cover the gel. After removing the top coverslips, the gels were washed with PBS and 0.05% sulfo-SANPAH (Covachem) was added. The gels were then exposed to UV for 5 mins (coverslips) or 20 mins (dishes) to facilitate cross-linker activation and incubated with 0.1mg/ml Collagen I (BD) in PBS for 2 hrs at room temperature. Excess Collagen I was washed off and the gels were kept in PBS at 4°C until cell seeding.
Purification of the exosomes
Cells cultured in full media were washed with serum-free DMEM 3 times and then incubated in serum-free DMEM for 48 hrs. Conditioned media were collected and exosomes were purified by standard differential centrifugation20, 49–52. Briefly, conditioned media were centrifuged at 3,000 × g for 20 min to remove cell debris (Beckman Coulter, Allegra X-14R). Supernatants were then centrifuged at 10,000 × g for 40 min (Beckman Coulter, J2-HS) to remove larger vesicles. Exosomes were pelleted by ultracentrifugation of the supernatants at 120,000 × g for 2 hrs at 4°C (Beckman Coulter, Optima XPN-100). The pelleted exosomes were suspended in PBS and collected by ultracentrifugation at 120,000 × g for 2 hrs at 4°C.
Exosome characterization by NTA
To analyze exosomes in media by NTA, cells (2×10⁶) cultured overnight on polyacrylamide gels with different stiffness were washed 3 times with serum-free DMEM or Opti-MEM and incubated with serum-free DMEM or Opti-MEM for 2 hrs. The cells were then washed 2 times with serum-free DMEM and re-incubated in serum-free DMEM. After 2 hrs, the conditioned media were collected and centrifuged at 3000 × g for 20 min to remove the dead cells and apoptotic bodies. The supernatants were then centrifuged at 10,000 × g for 40 min and proceeded to NTA using NS300 (Malvern) and processed by NanoSight NTA 3.2. Exosomes released from the same number of cells grown on 0.5 kPa and 10 kPa matrix were quantified and the amounts of exosomes released from cells grown on 0.5 kPa matrix were normalized as 1. For drug treatment, cells were incubated with serum-free DMEM for 4 hrs and then incubated with serum-free DMEM with DMSO, Akt inhibitor, or FAK inhibitor for 2 hrs. Cells were washed 2 times and re-incubated with serum-free DMEM with DMSO or inhibitors for 4 hrs. The conditioned media were then collected and proceeded to centrifugation and NTA. For the analysis of purified exosomes, protein concentrations of purified exosomes were determined by Bradford assay (Bio-Rad). The exosomes were diluted to 5 μg/ml for NTA.
Immunoblotting and exosome characterization
For western blot analyses of cell lysates, cells were mechanically scrapped and collected in PBS. Cells were then centrifuged briefly, and the supernatant were discarded. Finally, cells were lysed in lysis buffer (20 mM Tris-HCl, pH 7.4, 100mM KCl, 5mM MgCl2, 0.5% Triton X-100, 1mM DTT, 1mM PMSF, and protease inhibitor cocktail). For western blotting analyses of exosome samples, exosomes from equal amounts of cells (1×10⁷) were collected and the exosome loading was further adjusted according to the protein concentration of cell lysates.
Proteins samples were separated using 12% SDS–PAGE and transferred onto nitrocellulose membranes. The blots were blocked with 5% non-fat milk or BSA in TBST at room temperature for 1 hr and incubated with antibodies overnight at 4 °C, washed, followed by incubation with HRP-conjugated secondary antibodies (Cell Signaling Technology). The blots were developed using X-ray developer or KuikQuant Imager (Kindle Biosciences). Densitometry for western blotting was quantified by Image J (Fiji) version 2.3.0. Bands were converted into 8-bit images, selected by a rectangular selection, and plotted as instructed. Areas were measured by the wand tool and normalized for the final statistical analyses.
Animal study
The mouse experiments were carried out according to protocols approved by the Institutional Animal Care and Use Committee (IACUC) of the University of Pennsylvania. Mice were housed in the University of Pennsylvania Animal Care Facilities under specific pathogen-free (SPF) conditions at 23 ± 2°C ambient temperature with 40% humidity and a 12 hr light/dark cycle (7 am on and 7 pm off). For establishing a syngeneic mouse HCC model in C57L/J mice (The Jackson Laboratory), mice were randomly assigned subjects to treatment groups, and Hepa1-6 cells (2 × 10⁶ cells in 100 μl medium) were subcutaneously injected into the right flanks of 7-week-old male C57L/J mice. A total of 20 μg of exosomes from Hepa1-6 cells were tail vein injected into mice. The injections of exosomes (20 μg in 100 μl PBS) were performed every 3 days. Mice were weighed every 2 days. Tumors were measured using a digital caliper and the tumor volume was calculated by the formula: (width)2 × length/2. The mice were euthanized before the longest dimension of the tumors reached 2.0 cm, as required by IACUC. The number of mice used in the experiments (effective size) were based on literature reporting similar animal studies. Downstream immunohistochemistry analyses (IHC, R&E Histo) of mouse samples were performed in a double-blinded fashion.
Electron microscopy
Purified exosomes suspended in PBS were dropped on formvar carbon-coated nickel grids and fixed with 2.5% glutaraldehyde after staining with 2% uranyl acetate. Grids were air-dried and visualized using a JEM-1011 transmission electron microscope.
Reverse Phase Protein Array (RPPA)
RPPA was performed at the MD Anderson Cancer Center core facility using 40μg protein per sample as previously described52, 53.
Immunofluorescence microscopy
Cells on cover slips were fixed in 4% paraformaldehyde in PBS for 15 min and then permeabilized in 0.1% Triton X-100 in PBS for 5 min. Cells were blocked in PBS with 5% FBS for 1 hour and then incubated with primary antibodies for 1 hour followed by washing and incubation with fluorescence-labeled secondary antibodies for 1 hour (Life Technologies, CA). Fluorescence observation was performed using a Nikon Eclipse Ti confocal microscopy with a 100x objective lens. For quantification of perinuclear CD63, circles were drawn with diameters of approximately two times the diameters of the nucleus of the same cells. Fluorescence intensities were quantified by ImageJ. The fluorescence signal within the circle was presented as the percentage of the total signal. At least 20 cells were quantified for each experiment. Nikon NIS-Elements Advanced Research software (version 4.50 and version 5.21) was used to quantify the Pearson’s correlation coefficient for each individual figures. As a control, one channel of the merged figure was rotated by 90°to generate the baseline Pearson’s correlation coefficient as previously described54.
Immunoprecipitation and pulldown assay
For immunoprecipitation, cells were solubilized in the lysis buffer (20mM Tris-HCl, PH 7.5, 100mM KCl, 5mM MgCl2, 0.5% Triton X-100, 1mM DTT, 1mM PMSF and protease inhibitor cocktail (Roche)) followed by centrifugation at 13,800 × g for 15 mins. The supernatants were incubated with anti-Flag M2 beads (Sigma) for 2 hours at 4°C. The immunoprecipitated proteins were collected and washed four times with lysis buffer. Proteins were subjected to SDS-PAGE and western blot analysis.
To detect the GTP-bound Rab8 and Rab27 in cell lysates, GST-JFC1 RBD domain was purified from E. coli. Huh7 cells grown on different matrices or treated with drugs were lysed in lysis buffer (20 mM Tris-HCl, pH 7.4, 100mM KCl, 5mM MgCl2, 0.5% Triton X-100, 1mM DTT, 1mM PMSF, and protease inhibitor cocktail). The lysates were cleared by centrifugation (13,800 × g, 15 min, 4°C). The supernatants were incubated with GST-JFC1 RBD for 4 hours at 4°C, followed by washing 4 times with lysis buffer. Rab proteins in cell lysates and GTP-bound Rab that were pulled down by GST-JFC1 RBD domain fusion protein were analyzed by SDS-PAGE and western blotting using anti-Rab8 and anti-Rab27 antibodies, respectively.
Phosphorylation assay
GST-Rabin8 or GST-Rabin8(S149A) was purified from E. coli. Myr-Akt-HA was transfected into 293T cells and purified with anti-HA antibody (Roche) and protein G beads. 5μg Rabin8 proteins were incubated with myr-Akt in the kinase assay buffer (25mM Tris-HCl, 2mM β-glycerol phosphate, 2mM DTT, 0.1mM Na3VO4, 10mM MgCl2) plus 0.2mM ATP and phosphatase inhibitor in a total volume of 50μl for 30 min at 30°C. The reactions were stopped by the addition of 10μl 6×SDS loading buffer and boiled for SDS-PAGE and immunoblotting with a Akt phospho-substrate antibody.
Guanine nucleotide exchange assay
Nucleotide exchange was measured using a fluorescence-based assay as previously described36 and performed in 20 mM Tris–HCl, pH 7.5, 150 mM NaCl, 5 mM MgCl2, 1 mM DTT, 5% glycerol, 400 nM BODIPY-GTP, 400 nM Rab8 and 40 nM Rain8. The final volume was 1 ml, and the reaction was performed in Quartz Cuvettes (Hellma). Four reactions were monitored in a Fluorolog-3 spectrometer (HORIBA Scientific; λex= 500 nm, λem= 510 nm, and 2 nm slits) in parallel.
BRET assay
The conformation change of Rabin8 was monitored by BRET assay as previously described25, 41. Briefly, Rabin8 in pNLHT vector was purified from E.coli. NanoBRET Ligand (Promega) and Furimazine (the substrate of NanoLuc) were diluted to 200 nM and 20 μM in PBS, respectively. The purified proteins were pre-incubated with myr-Akt on Protein A beads with or without ATP. The supernatants were collected and used at 10 nM as the final concentration of Rabin8 proteins in the reactions. The proteins were incubated with 100μL of diluted ligand or PBS in a 96-well plate for 1 min at room temperature. Diluted (100μL) substrate was then added and mixed thoroughly, and the samples were immediately used for luminescence reading at 620 nm (acceptor) and 460 nm (donor) on a Gemini EM Fluorescence Microplate Reader. The calculation of BRET ratio was performed as previously described25.
Cell viability assay
Huh7 cells were seeded in a 96-well plate with 10000 cells/well and treated with serum-free DMEM with DMSO or different doses of MK-2206 and GDC-0068 for 48 hours. Cell viability was accessed by CCK-8 kit (Bimake) according to the manufacturer’s instruction.
Patient liver samples and array data
The gene expression and clinical data for the LCI dataset including 486 tumors and matched non-tumor liver specimens (non-tumor=239 and tumor=247) are available on Gene Expression Omnibus (GEO) GSE14520 (http://www.ncbi.nlm.nih.gov/geo). To model liver stiffness as it relates to HCC, we used gene expression from non-tumor tissues samples. Of the 239 non-tumor samples, only 226 had survival data points, which were used for our analyses. However, not all of 226 patients had complete clinical data points, thus only samples from HCC patients with clinical variables tested were used in the analyses, which is noted in each figure.
Statistics and Reproducibility
Statistical analysis was performed using Graphpad Prism (v8) and R (v3.12 and v3.2.5). No statistical method was used to pre-determine sample size. Samples and images in all experiments were acquired randomly. Except for the mouse experiments (see above), the investigators were not blinded to allocation during experiments and outcome assessment. Data are expressed as mean ± standard deviation (s.d.) from at least three separate experiments performed in triplicate unless specifically indicated. One set of data from more than 4 different sets for Fig. 7a was excluded from final statistical analysis as technical errors in immunoblotting of the same protein sample resulted in ambiguous readouts in two repeats. Unpaired two-tailed Student’s t-test was performed (Fig. 1c, 1d, 1e, 1f, 2b, 2c, 2e, 2g, 2i, 2j, 3b, 3d, 3e, 3f, 3h, 3j, 4b, 4c, 5d, 6c, 7a, 7b, 7d, Extended Data Fig. 1b, 1c, 1d, 1e, 1f, 2a, 2c, 3b, 3c, 3f, 4a, 4c, 4d, 5b, 7. A value of P < 0.05 was considered statistically significant. For Fig. 4h, the unadjusted p-values are presented for fold changes using a one-sample t-test with the null hypothesis that relative change was equal to 1. A value of P < 0.05 was considered statistically significant. For Fig. 4i, ratio paired t-test was performed. A value of P < 0.05 was considered statistically significant. A two-way ANOVA was performed on Fig. 5a and Extended Data Fig. 4e. A value of P < 0.05 was considered statistically significant. One-way ANOVA was performed on Extended Data Fig. 2d, 2e, 2f, and the p-values were generated from Dunnett’s multiple comparisons test. A value of P < 0.05 was considered statistically significant. Volcano Plot is generated using VolcaNoseR (https://huygens.science.uva.nl/VolcaNoseR/)55. Log2(Fold_Change), -Log10(P-Value), and protein names from the RPPA data file. For Fig. 4d, 4e, 4f, 6a, 6b, 7e, and Extended Data Fig. 2b, data represents at least 3 independent experiments.
Enrichment analysis was used to test whether a specific gene list (observed) is different from a gene list randomly selected from all genes in the analysis (expected) using Chi-square or Fisher’s Exact test. Student’s t-tests were performed when there were two groups. BRB-ArrayTools was used to directly predict the survival risk group based on expression from non-tumor samples of four Notch markers (Hes1, Hey1, Hey2, and SOX9), obtaining 10-fold cross-validated Kaplan-Meier survival curves and computing a permutation significance level for the separation among the cross-validated Kaplan-Meier survival curves. (http://linus.nci.nih.gov/BRB-ArrayTools.html). A permutation p-value <0.05 is considered significant. The results yield two groups: high-risk (Notch-high) and low-risk (Notch-low). Kaplan-Meier curves were then calculated and the log rank test was used to test for a difference between the survival curves. Clinical variables between Notch-high and Notch-low groups were compared using nonparametric Mann-Whitney tests to test the difference with p<0.05 as significant. Patients with hepatic stellate cell activation were previously identified using the HSC gene signature, a set of 194 abundantly expressed in activated hepatic stellate cells, by Ji and colleagues40. To identify differentially expressed genes between Notch-high and Notch-low groups, we performed class comparison analyses (p<0.001) in the LCI cohort, and the gene list was proceeded for Ingenuity Pathway Analyses (Qiagen).
Extended Data
Extended Data Fig. 1. Characterization of exosomes derived from different cells.
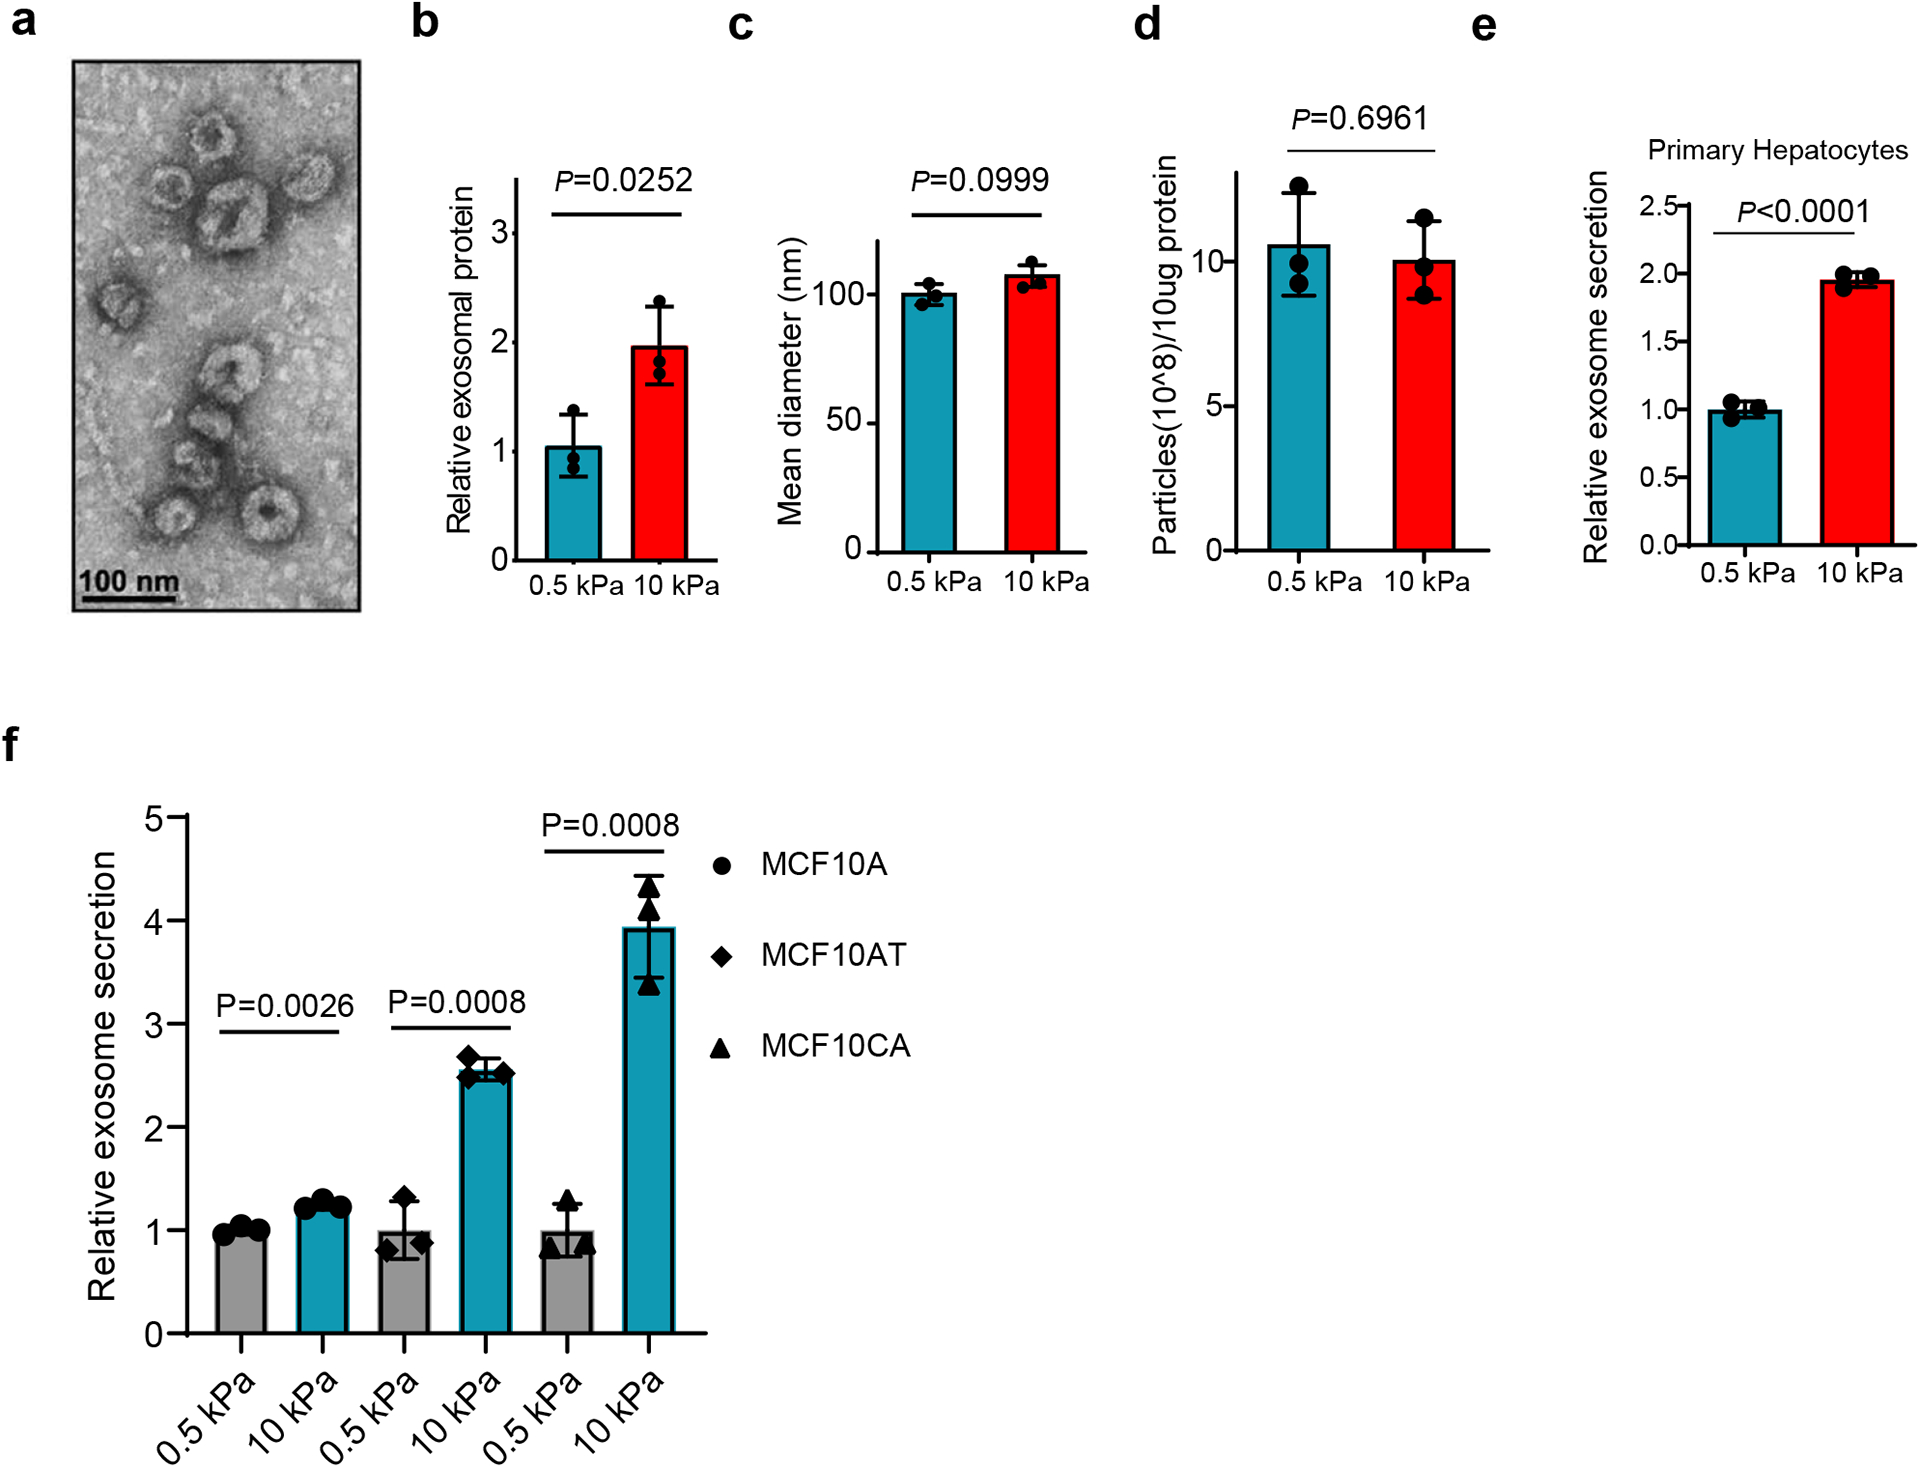
a, Representative TEM image of exosomes purified from the conditioned media of Huh7 cells. Scale bar: 100 nm. b, Purified exosome proteins were quantitated by Bradford assay and the mean was normalized to 1 for exosomal proteins from soft (0.5 kPa) matrix. Exosomes were collected from equal numbers of cells. Values are presented as Mean ± S.D. n=3. c, The mean diameters of exosomes purified from the conditioned media of Huh7 cells on soft or stiff matrix. Values are presented as mean ± S.D. 3 independent experiments were performed. At least 106 of purified exosomes were measured by NTA for each experiment. d, Exosomes (10 μg) derived from Huh7 cells on soft or stiff matrix were diluted with 1 ml PBS. The particle concentration was determined by NTA. Values are presented as Mean ± S.D. n=3. e, Exosomes released from the same number of primary hepatocytes grown on matrix with different stiffness were quantified, and the concentration of exosomes released from cells were normalized to the 0.5 kPa group. Values are presented as Mean ± S.D. n=3. F, Exosomes released from the same number of MCF10A, MCF10AT, and MCF10CA cells grown on matrix with different stiffness were quantified. The amounts of exosomes released from the cells were normalized to the 0.5 kPa for each cell line. Mean ± S.D. n=3. Source numerical data and unprocessed blots are available in source data. n represents the number of independent experiments.
Extended Data Fig. 2. Exosome secretion from Huh7 cells treated with Akt and FAK inhibitors.
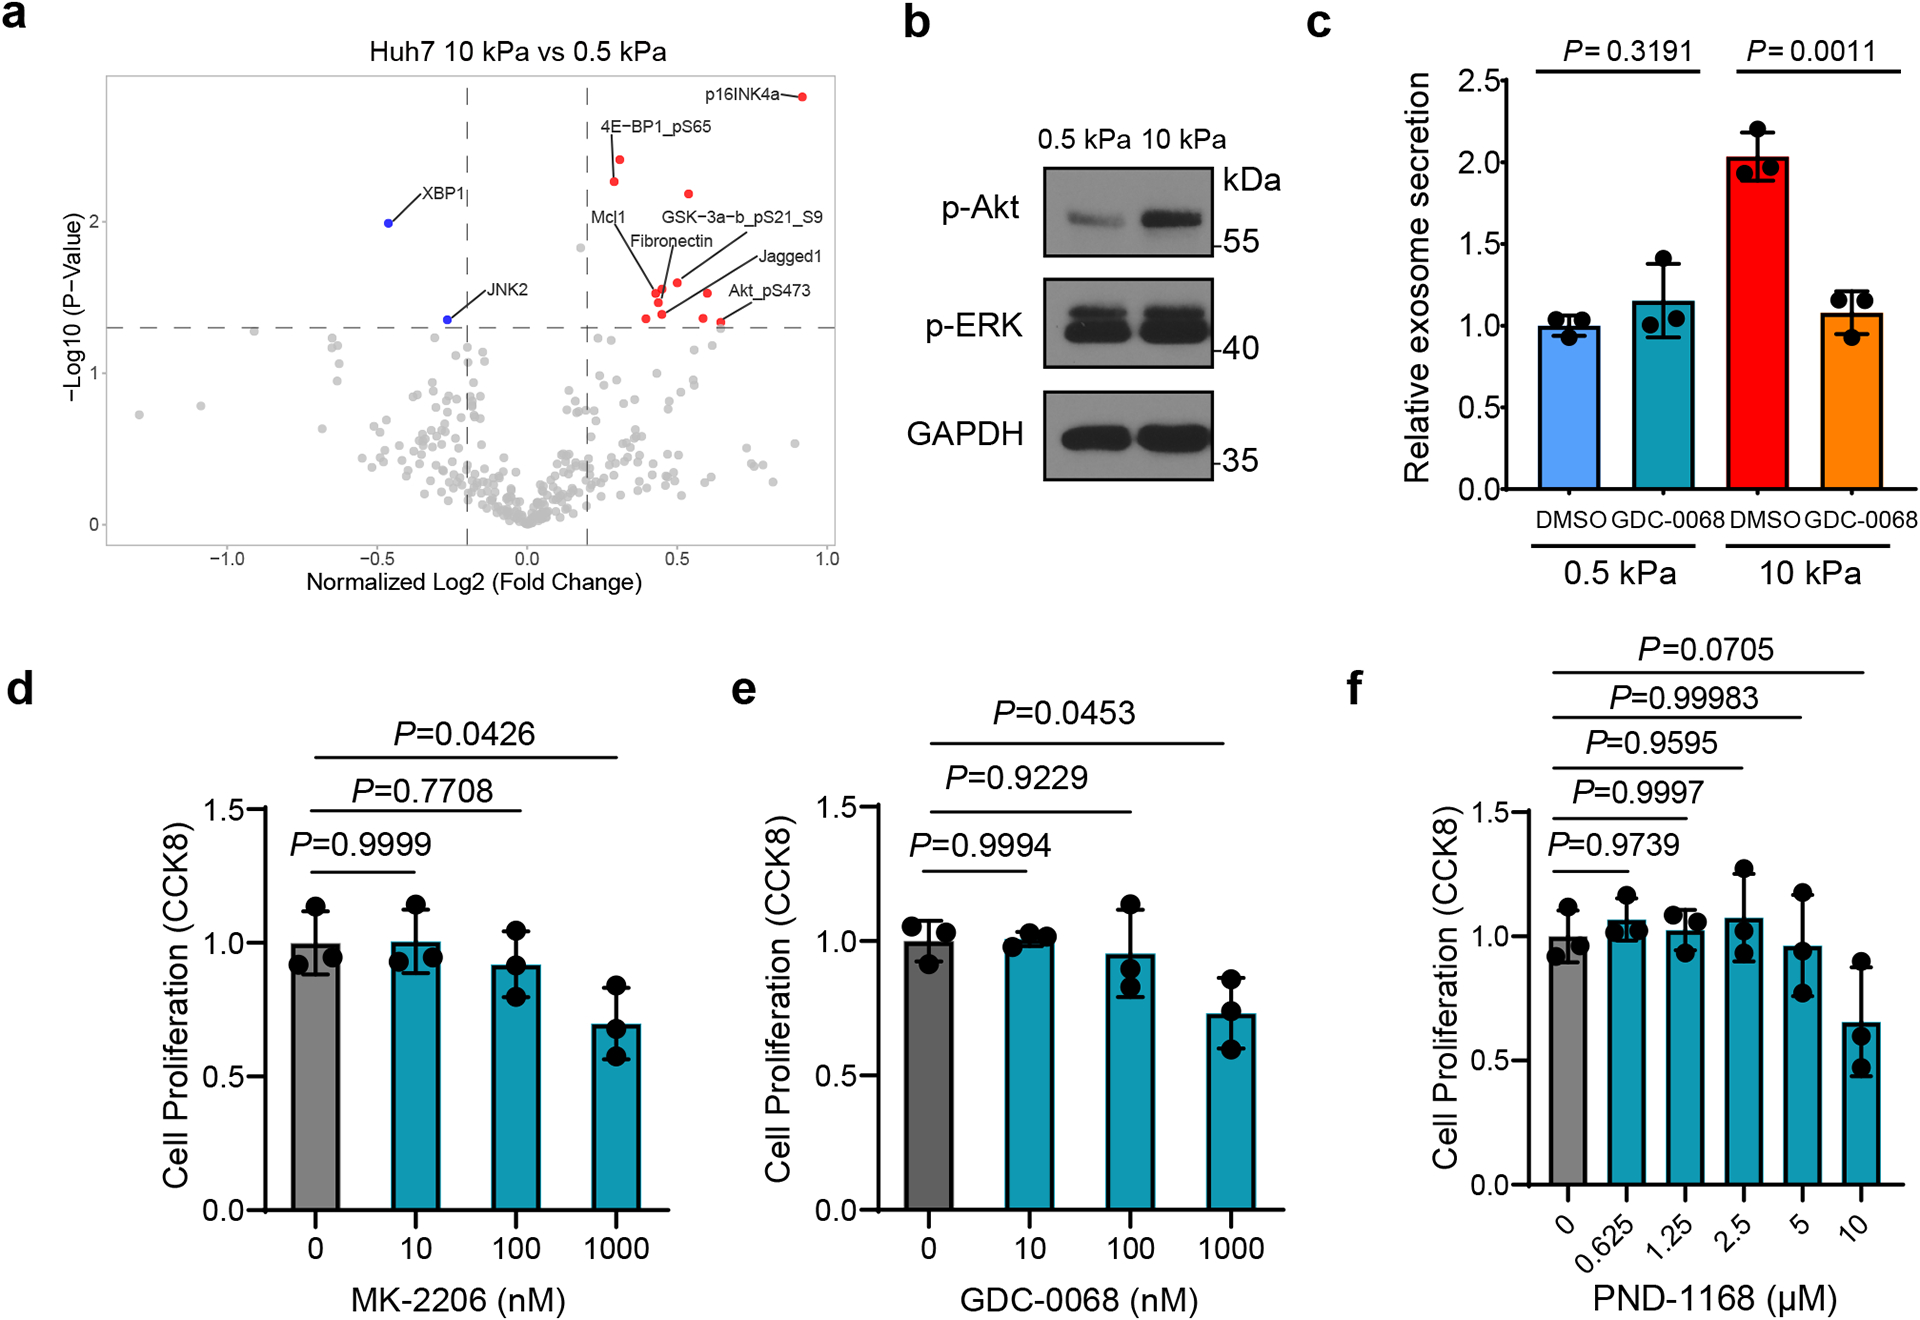
a, Volcano plot of RPPA data displaying the pattern of protein expression for Huh7 cells cultured on stiff (10 kPa) matrix relative to soft (0.5 kPa) matrix. Significantly up- and down-regulated proteins are indicated by red and blue dots, respectively (cut-off p<0.05). All the data points were normalized for protein loading and transformed to Log2 values (labeled “NormLog2” on X-axis). b, Western blots showing the up-regulation of p-Akt but not p-ERK in Huh7 cells grown on stiff ECM. Molecular weights (in kDa) are shown to the right. c, Huh7 cells on soft or stiff matrix were treated with DMSO or Akt inhibitor GDC-0068. The conditioned media were collected and proceeded for NTA. Exosome concentration from the cells treated with DMSO on soft matrix was normalized to 1. Values are presented as Mean ± S.D., n=3. d-f, Huh7 cells were treated with DMSO or various concentrations of Akt inhibitors MK-2206, GDC-0068 or FAK inhibitor PND-1168. Cell viability was examined by CCK-8 assay and normalized to the value of DMSO treated group. Values are presented as Mean ± S.D. n=3. Source numerical data and unprocessed blots are available in source data. n represents the number of independent experiments.
Extended Data Fig. 3. Characterization of Rab8 and Rabin8 in cells grown on different matrix.
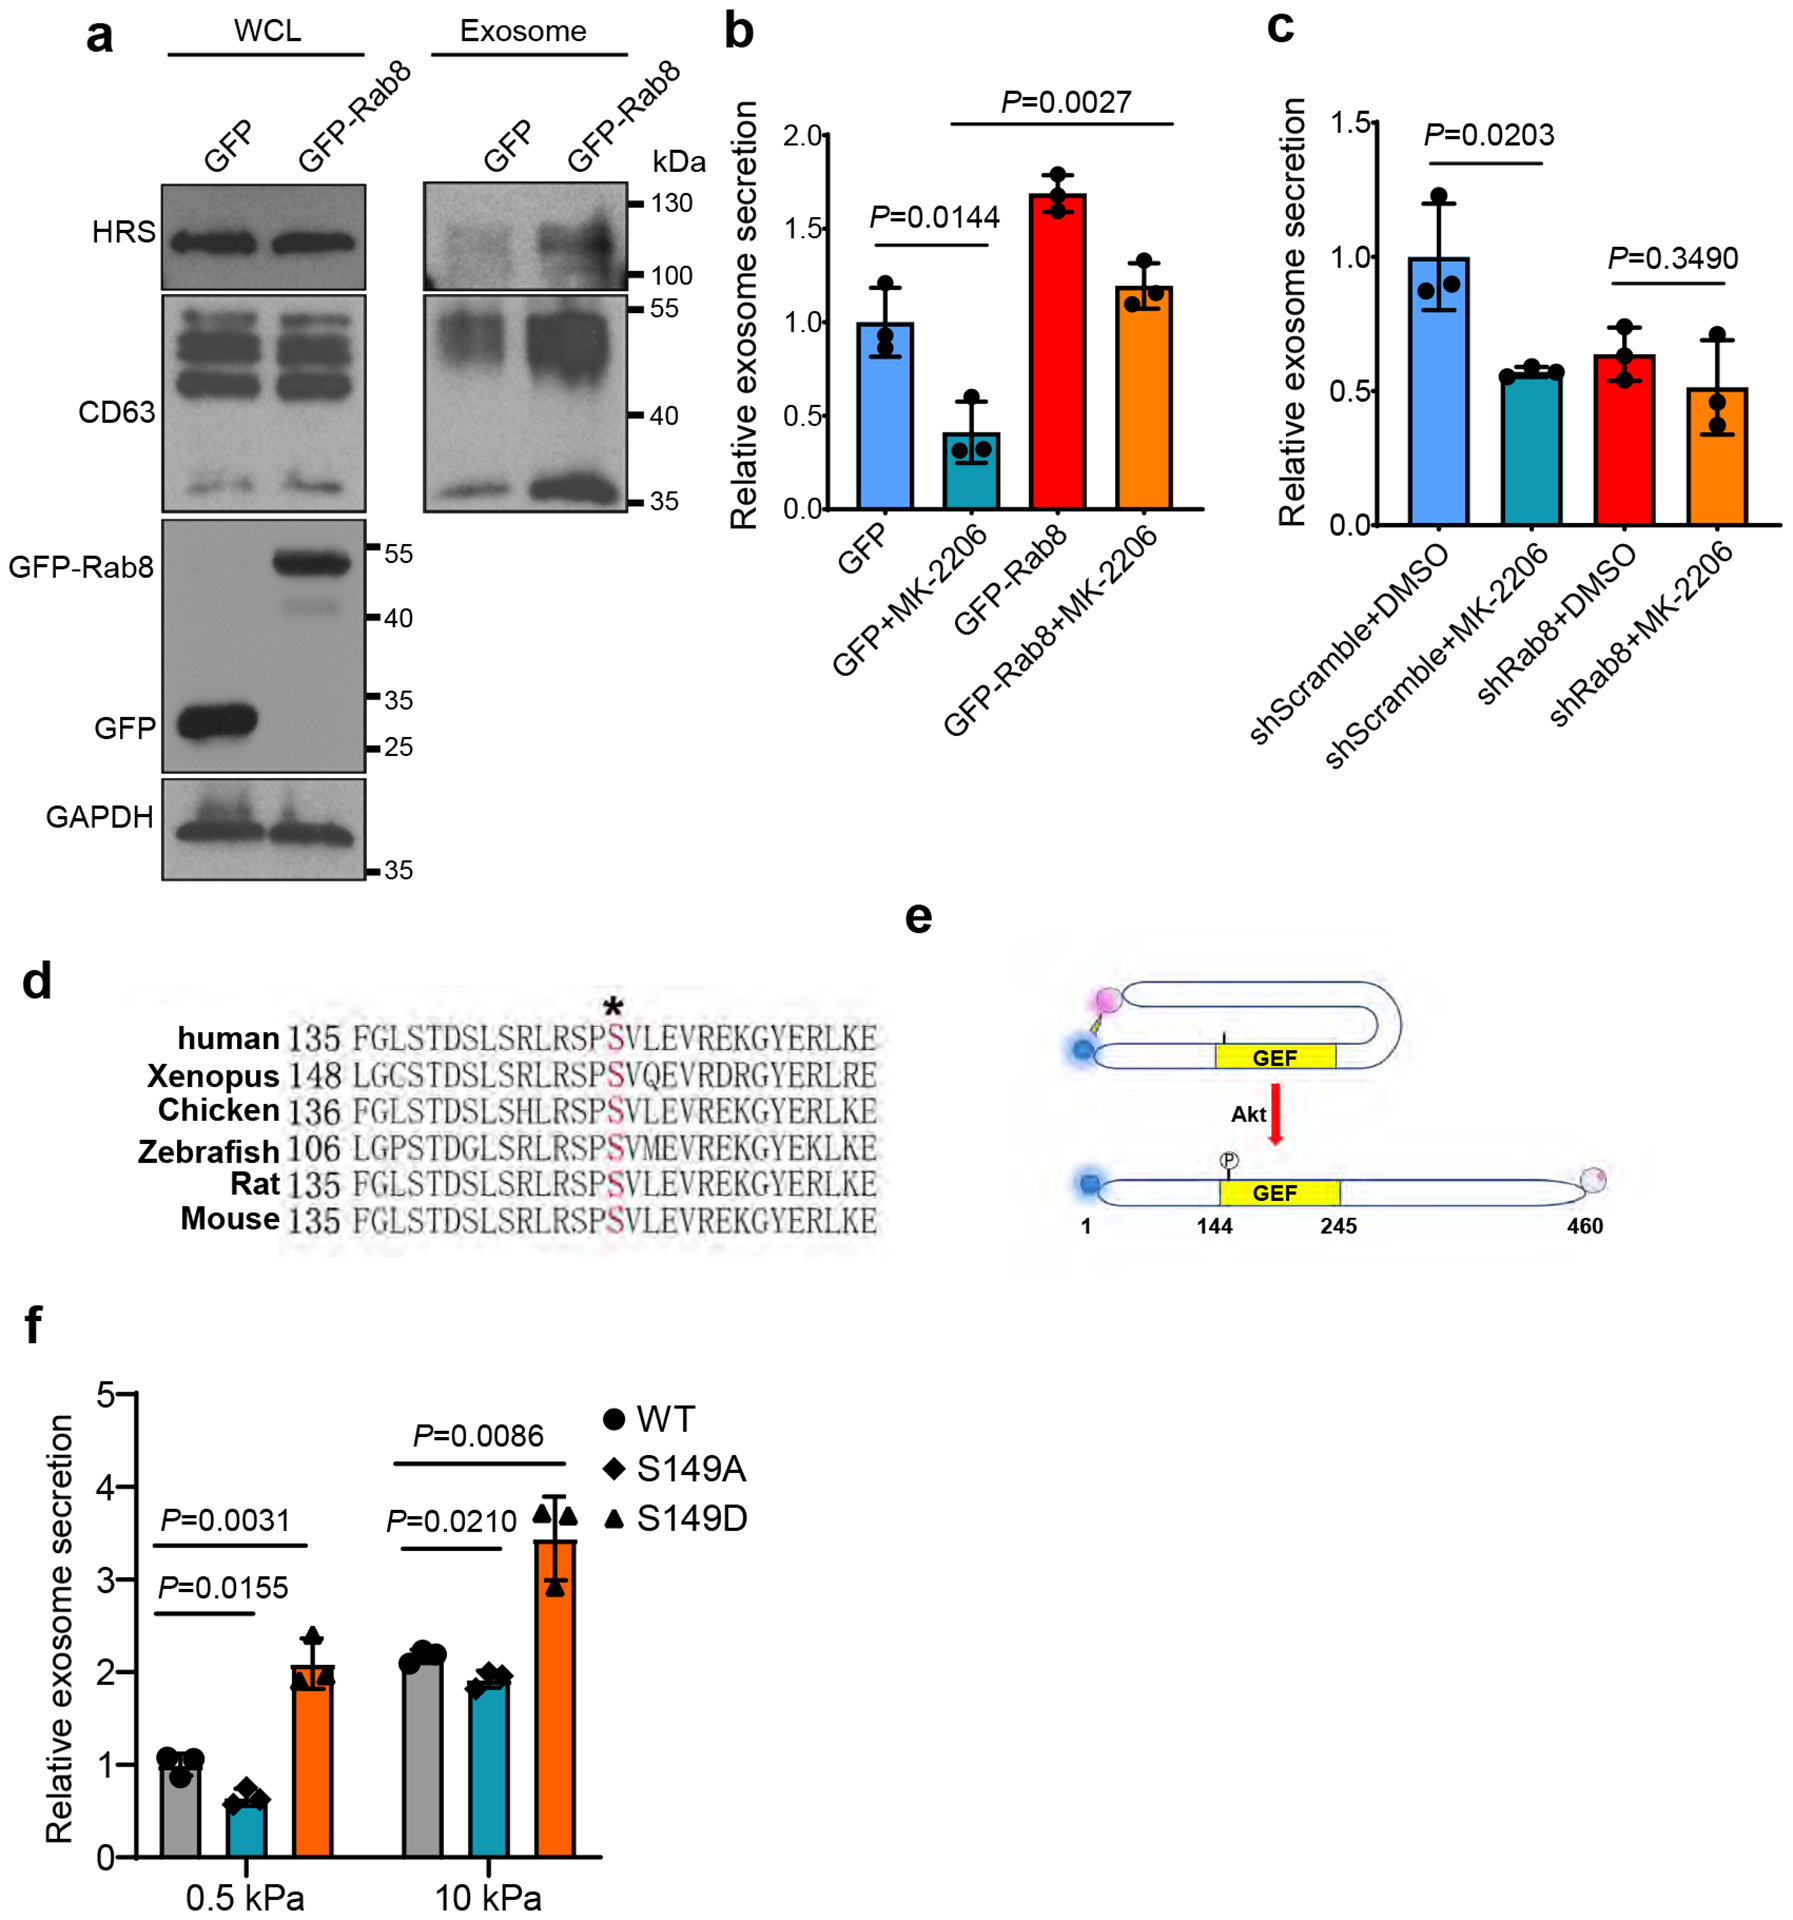
a, Huh7 cells were transfected with GFP or GFP-Rab8 and grown on soft matrix. Exosomes in the conditioned media were purified by ultracentrifugation, and exosomes from the same number of cells were loaded for western blotting with antibodies against exosome markers HRS and CD63. b, Conditioned media from cells expressing GFP or GFP-Rab8 and treated with DMSO or MK-2206 were collected and proceeded for NTA. Exosome concentration was normalized to those from GFP expressing cells treated with DMSO. Values are presented as Mean ± S.D. n=3. c, Conditioned media from cells with control or Rab8 shRNA treated with DMSO or MK-2206 were collected and proceeded for NTA. Exosome concentration was normalized to those from cells with control shRNA and DMSO. Values are presented as Mean ± S.D. n=3. d, Sequence alignment of Rabin8 from different species. The phosphorylation site Serine 149 was shown in red. e, Schematic diagram showing the use of BRET in analyzing Rabin8 conformation. NanoLuc (BRET donor) and HaloTag (BRET acceptor) were fused to the N and C terminus of Rabin8, respectively. When Rabin8 is adopted in a “closed” conformation and autoinhibited, BRET will occur owing to the close proximity between the donor and acceptor. If Rabin8 switches to an “open” conformation induced by Akt phosphorylation on S149, the BRET signal will significantly decrease. f, Huh7 cells were transfected with different Rabin8 variants (WT, S149A, and S149D). Conditioned media were collected and proceeded for NTA. Exosome concentration was normalized to those from cells expressing wild type Rabin8 on soft matrix (n=3). Values are presented as Mean ± S.D. Source numerical data and unprocessed blots are available in source data. n represents the number of independent experiments.
Extended Data Fig. 4. Hepa1-6 cells secreted more exosomes when grown on stiff Matrix.
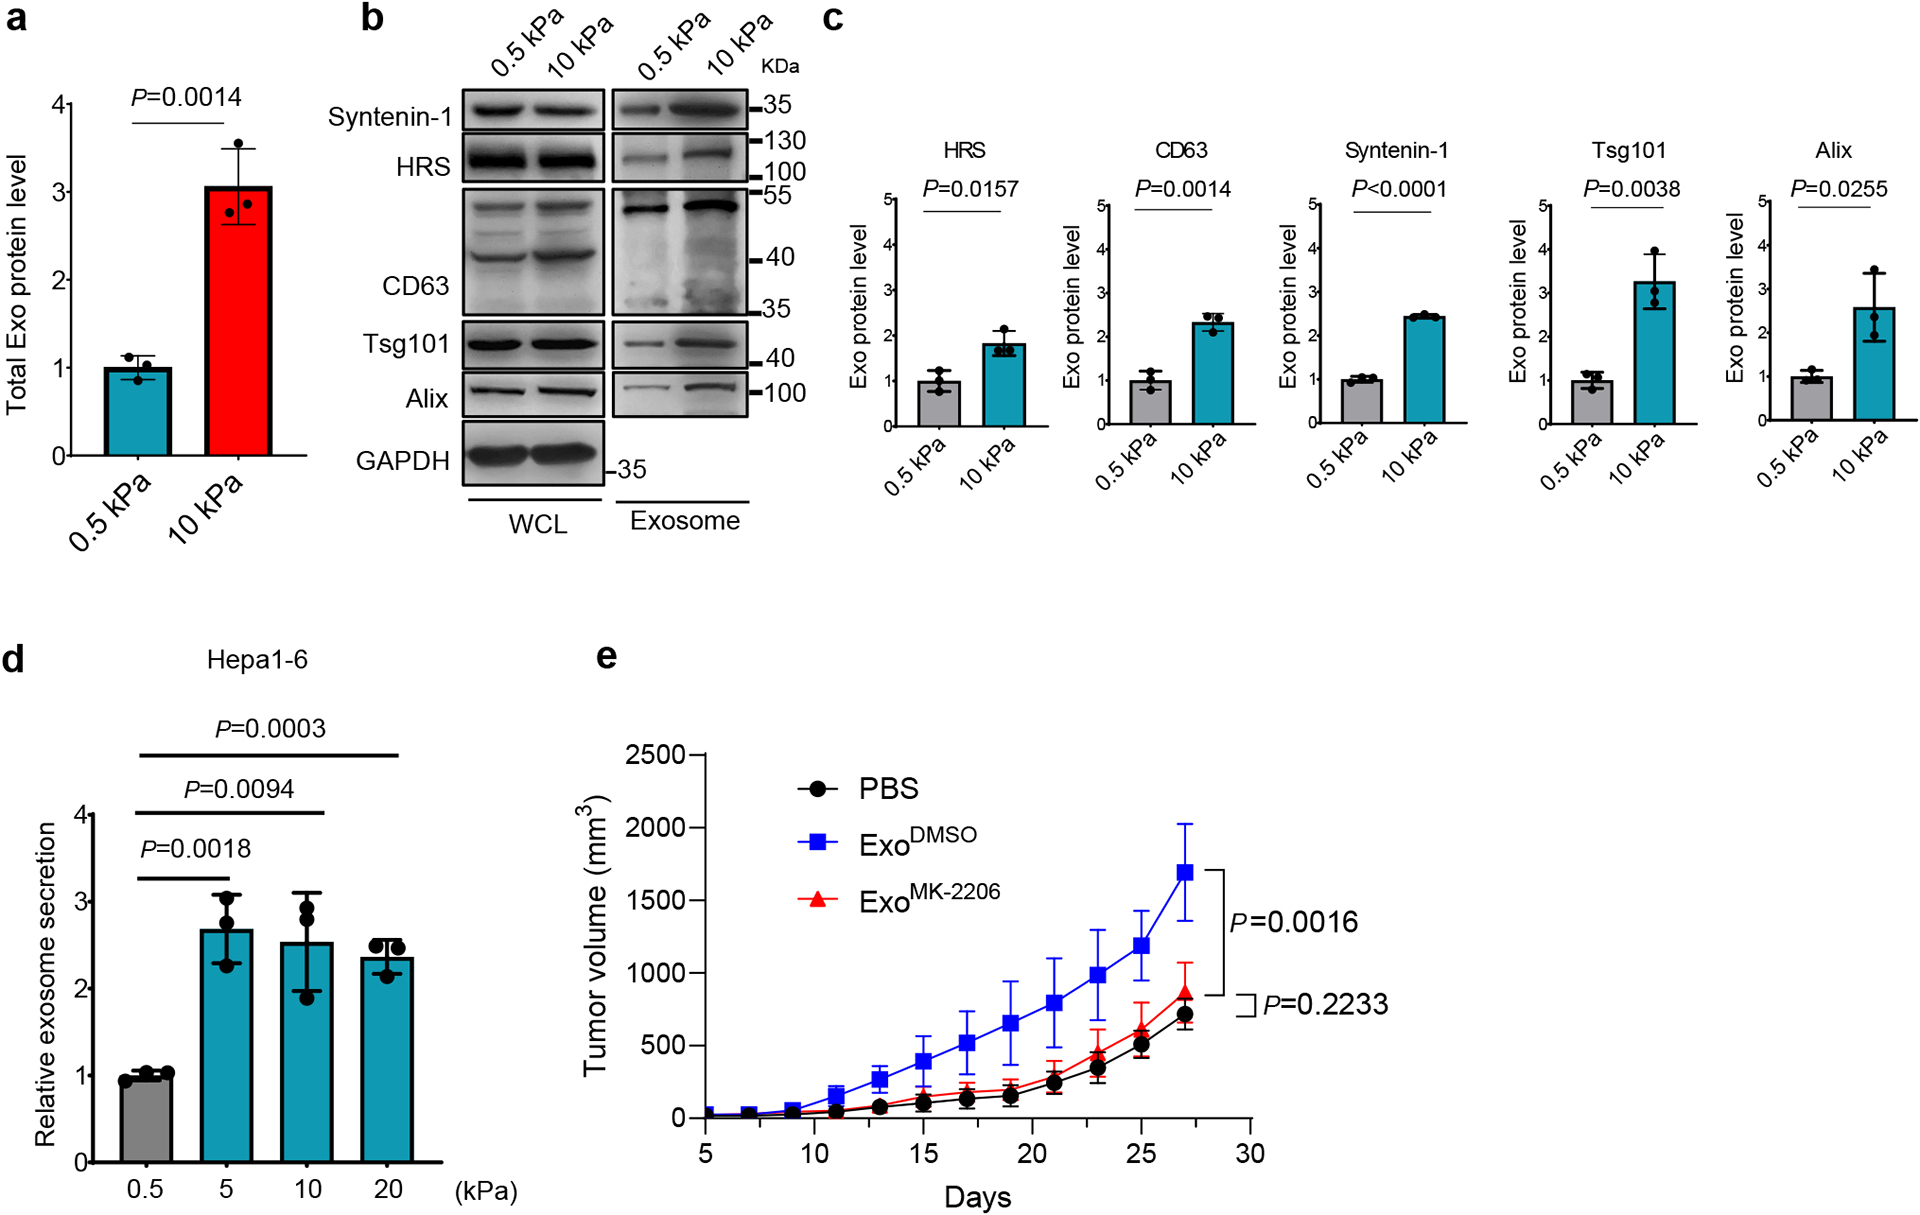
a, Hepa1-6 cells were cultured on soft (0.5 kPa) or stiff (10 kPa) matrix. Exosomes in the conditioned media were purified. Quantification of the exosomal proteins by Bradford assay. The amounts of exosomal proteins were normalized to those from soft matrix. Values are presented as Mean ± S.D. n=3. b, Exosomes from the same number of cells were analyzed by immunoblotting using antibodies against indicated exosome markers. c, Quantification of the levels of HRS, Syntenin-1, CD63, Alix and Tsg101 is presented. Mean ± S.D. n=3. d, Exosomes released from the same number of Hepa1-6 cells grown on matrix with different stiffness were quantified, and the concentration of exosomes released from cells grown on 0.5 kPa matrix were normalized as 1. Values are presented as Mean ± S.D. n=3. n represents the number of independent experiments. e, Growth curves of Hepa 1-6 tumors in C57L/J mice injected with PBS or the same amounts of exosomes derived from Hepa1-6 cells treated with DMSO or MK-2206 (n=5 mice). Values are presented as Mean ± S.D. Source numerical data and unprocessed blots are available in source data.
Extended Data Fig. 5. Expression of the Notch pathway proteins in Huh7 cells grown on soft or stiff matrix.
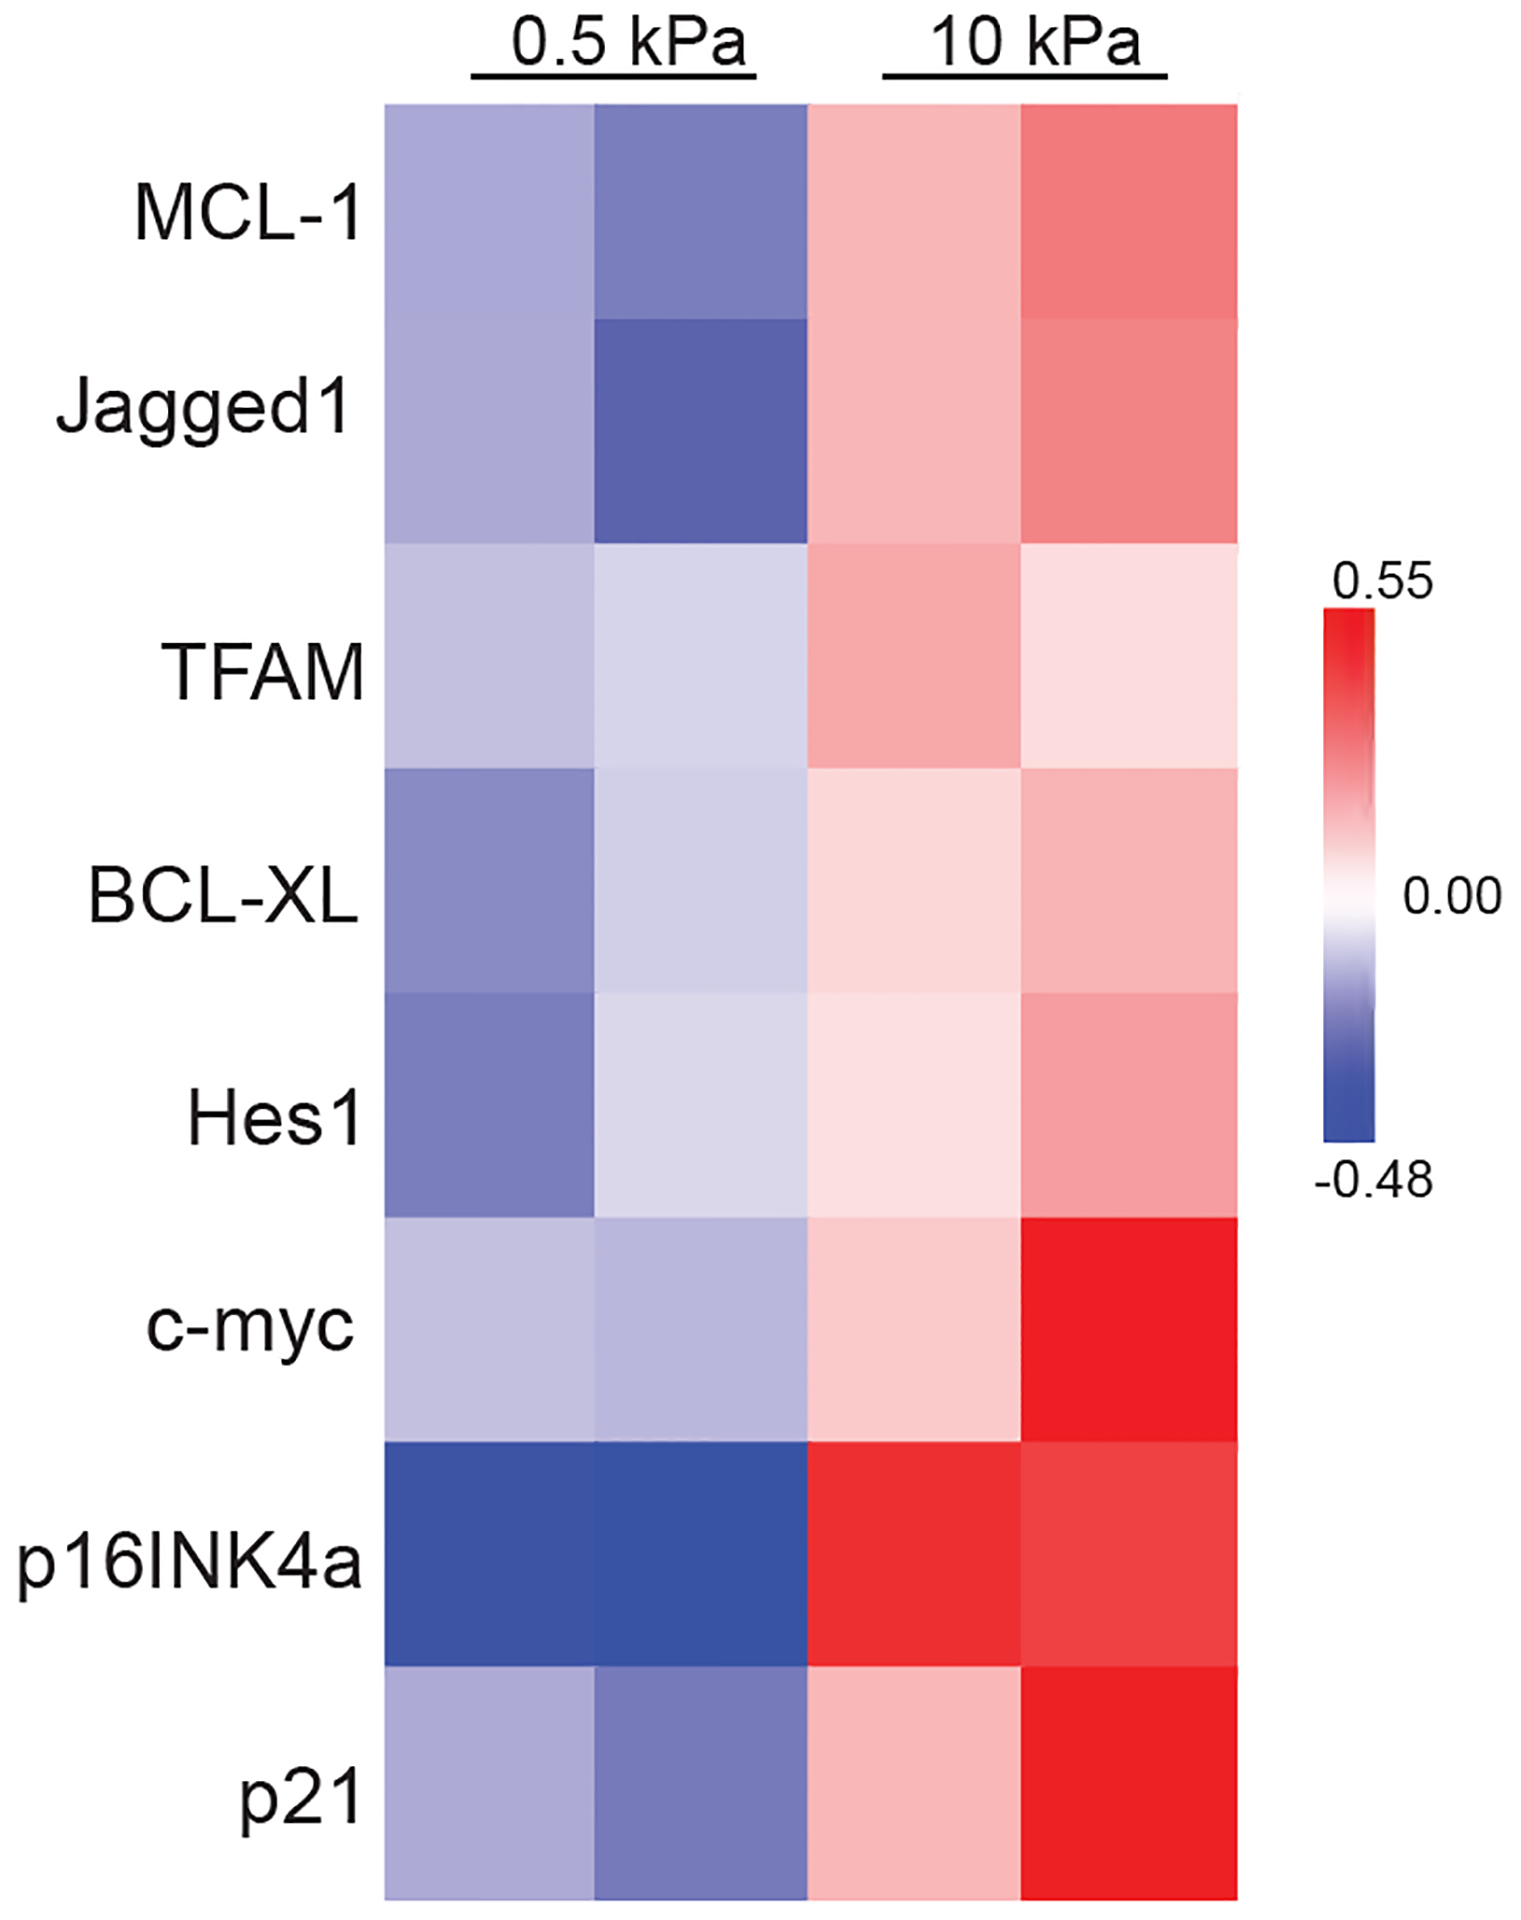
Heatmap of RPPA data showing the levels of the Notch pathway proteins in Huh7 cells grown on soft (0.5 kPa) or stiff (10 kPa) matrix. Source numerical data is available in source data.
Extended Data Fig. 6. Gene expression analysis of liver tissues from patients.
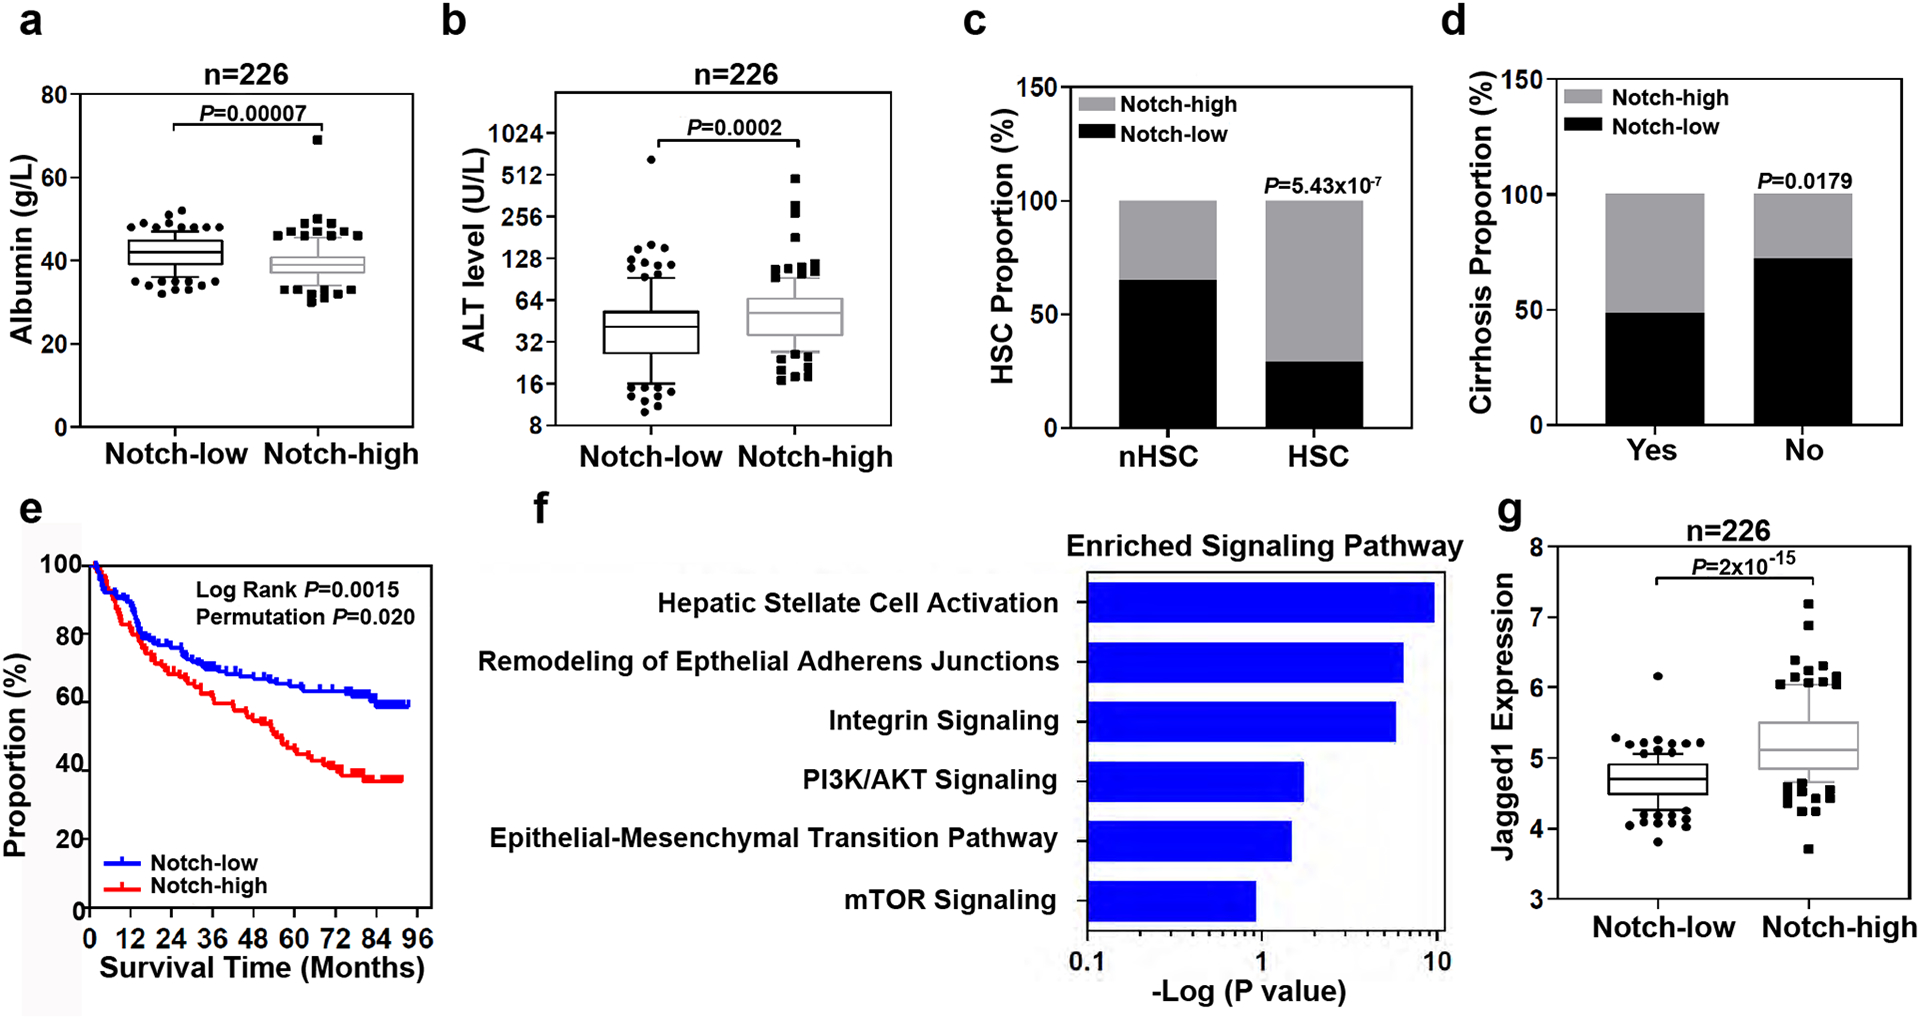
a, Box and whisker plot (bars represent 10–90 percentile, dots represent outliers) of albumin levels in the serum of 226 HCC patients with high (n=113 patients) or low (n=113 patients) Notch gene expression (p value is from Mann-Whitney test (two-tailed). b, Box and whisker plot (bars represent 10–90 percentile, dots represent outliers) of alanine transaminase (ALT) levels in the serum of 226 HCC patients with high (n=113 patients) or low (n=113 patients) Notch gene expression (p value is from Mann-Whitney test (two-tailed). c, Analysis of Notch-high and Notch-low patients with HSC or without (nHSC) the HSC gene signature (Fishers Exact test). d, Notch-high (n=113 patients) and Notch-low (n=113 patients) patients with or without cirrhosis (Fishers Exact test). The proportion of patients with high Notch genes expression in each group were analyzed (Fishers Exact test). e, Survival risk prediction analysis based on the expression data of four Notch associated genes, HEY1, HEY2, HES1, and SOX9 in non-tumor tissues derived from 226 HCC patients (Kaplan-Meier Cox Log Rank test between two groups and leave one out permutation analyses (1000X)). f, Top enriched signaling pathways associated with Notch activation. Ingenuity Pathway Analysis was performed on 1,872 differentially expressed genes (p<0.001) between high-Notch) and low-Notch patient non-tumor samples (see Methods for detail). -log(p-value) were calculated using Fisher’s Exact test with Bonferroni correction. g, Box and whisker plot (bars represent 10–90 percentile, dots represent outliers) analysis of Jagged1 expression in 226 HCC patients with Notch-high (n=113 patients) and Notch-low (n=113 patients) expression.
Extended Data Fig. 7. RPPA of the exosomal proteins collected from Huh7 cells grown on soft or stiff matrix.
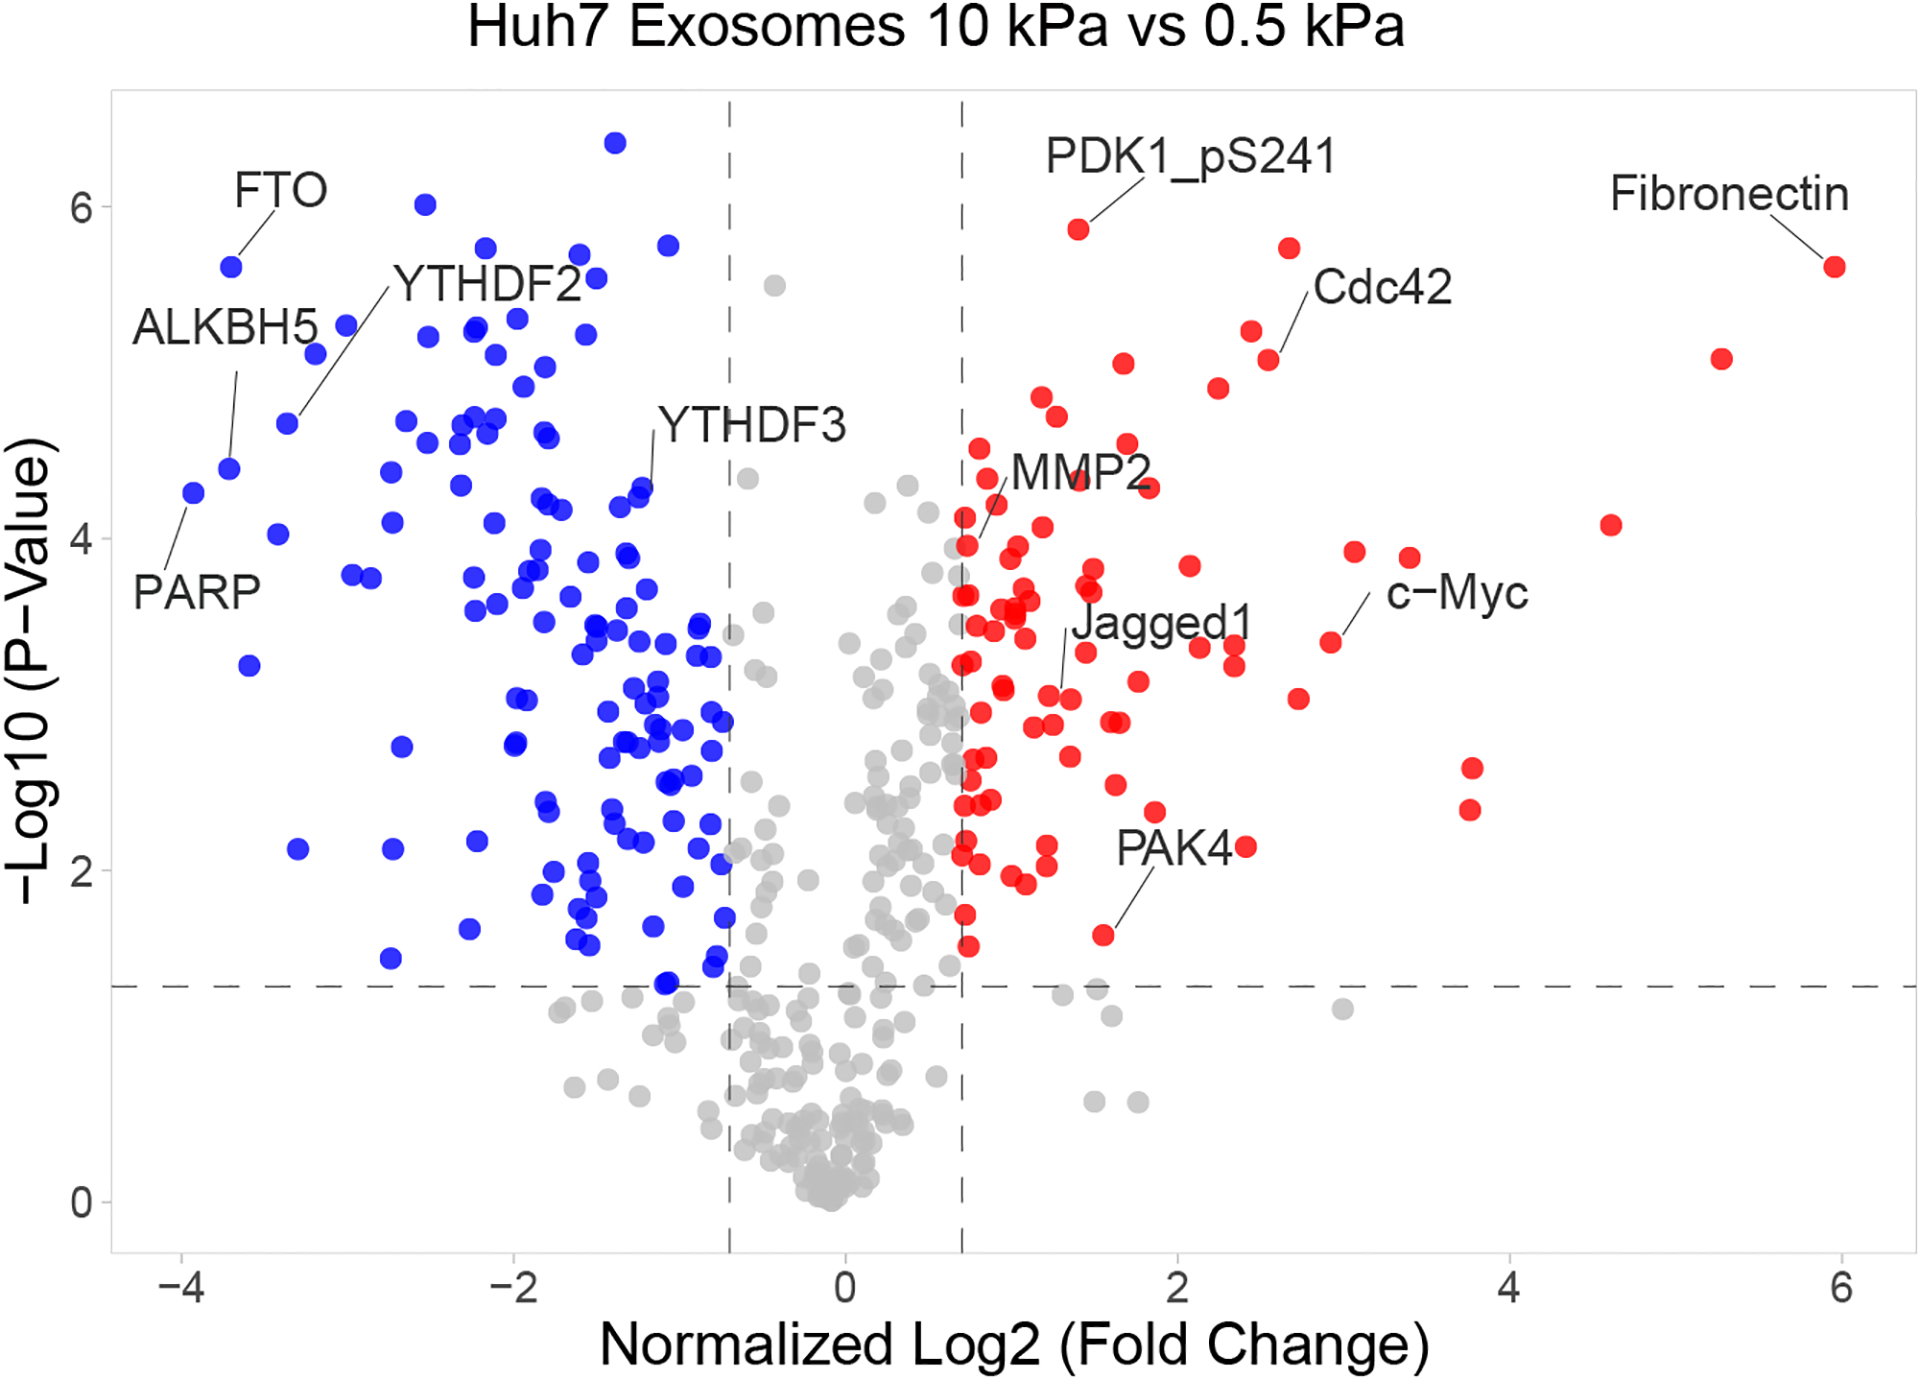
Volcano plot of RPPA data displaying the pattern of protein expression in exosomes derived from Huh7 cells cultured on stiff relative to soft matrix. Significantly up- and down-regulated proteins are indicated by red and blue dots, respectively (cut-off p<0.05). All the data points were normalized for protein loading and transformed to Log2 values on X axis. Source numerical data is available in source data.
Supplementary Material
ACKNOWLEDGEMENTS
The work is supported by NIH grants R35 GM141832 to W.G., NCI U01 CA250044 to R. R., V.M.W, and W. G., NCI intramural research program Z01 BC 010877, Z01 BC 010876, Z01 BC 010313 to H.D. and X-W. W., Abramson Cancer Center Support Grant (CA016520) to P.A.G.
Footnotes
COMPETING INTERESTS
The authors declare no competing interests.
DATA AVAILABILITY STATEMENT
Source data have been provided in Source Data. For patient cohort expression data, the accession code is in the methods section (GSE14520). The gene expression and clinical data for the LCI dataset including 486 tumors and matched non-tumor liver specimens (non-tumor=239 and tumor=247) are available on Gene Expression Omnibus (GEO) GSE14520 (https://www.ncbi.nlm.nih.gov/geo/query/acc.cgi?acc=gse14520). All other data supporting the findings of this study are available from the corresponding author on reasonable request.
REFERENCES
- 1.Butcher DT, Alliston T & Weaver VM A tense situation: forcing tumour progression. Nat Rev Cancer 9, 108–122 (2009). [DOI] [PMC free article] [PubMed] [Google Scholar]
- 2.Broders-Bondon F, Nguyen Ho-Bouldoires TH, Fernandez-Sanchez ME & Farge E Mechanotransduction in tumor progression: The dark side of the force. J Cell Biol 217, 1571–1587 (2018). [DOI] [PMC free article] [PubMed] [Google Scholar]
- 3.Fattovich G, Stroffolini T, Zagni I & Donato F Hepatocellular carcinoma in cirrhosis: incidence and risk factors. Gastroenterology 127, S35–50 (2004). [DOI] [PubMed] [Google Scholar]
- 4.Laklai H et al. Genotype tunes pancreatic ductal adenocarcinoma tissue tension to induce matricellular fibrosis and tumor progression. Nat Med 22, 497–505 (2016). [DOI] [PMC free article] [PubMed] [Google Scholar]
- 5.Levental KR et al. Matrix crosslinking forces tumor progression by enhancing integrin signaling. Cell 139, 891–906 (2009). [DOI] [PMC free article] [PubMed] [Google Scholar]
- 6.Mouw JK, Ou G & Weaver VM Extracellular matrix assembly: a multiscale deconstruction. Nat Rev Mol Cell Biol 15, 771–785 (2014). [DOI] [PMC free article] [PubMed] [Google Scholar]
- 7.Paszek MJ et al. Tensional homeostasis and the malignant phenotype. Cancer Cell 8, 241–254 (2005). [DOI] [PubMed] [Google Scholar]
- 8.Thomas D & Radhakrishnan P Tumor-stromal crosstalk in pancreatic cancer and tissue fibrosis. Mol Cancer 18, 14 (2019). [DOI] [PMC free article] [PubMed] [Google Scholar]
- 9.Haage A & Schneider IC Cellular contractility and extracellular matrix stiffness regulate matrix metalloproteinase activity in pancreatic cancer cells. FASEB J 28, 3589–3599 (2014). [DOI] [PubMed] [Google Scholar]
- 10.Liu C et al. Role of three-dimensional matrix stiffness in regulating the chemoresistance of hepatocellular carcinoma cells. Biotechnol Appl Biochem 62, 556–562 (2015). [DOI] [PubMed] [Google Scholar]
- 11.Lo CM, Wang HB, Dembo M & Wang YL Cell movement is guided by the rigidity of the substrate. Biophys J 79, 144–152 (2000). [DOI] [PMC free article] [PubMed] [Google Scholar]
- 12.Pathak A & Kumar S Independent regulation of tumor cell migration by matrix stiffness and confinement. Proc Natl Acad Sci U S A 109, 10334–10339 (2012). [DOI] [PMC free article] [PubMed] [Google Scholar]
- 13.Plotnikov SV & Waterman CM Guiding cell migration by tugging. Curr Opin Cell Biol 25, 619–626 (2013). [DOI] [PMC free article] [PubMed] [Google Scholar]
- 14.Rice AJ et al. Matrix stiffness induces epithelial-mesenchymal transition and promotes chemoresistance in pancreatic cancer cells. Oncogenesis 6, e352 (2017). [DOI] [PMC free article] [PubMed] [Google Scholar]
- 15.Swaminathan V et al. Mechanical stiffness grades metastatic potential in patient tumor cells and in cancer cell lines. Cancer Res 71, 5075–5080 (2011). [DOI] [PMC free article] [PubMed] [Google Scholar]
- 16.Wei SC et al. Matrix stiffness drives epithelial-mesenchymal transition and tumour metastasis through a TWIST1-G3BP2 mechanotransduction pathway. Nat Cell Biol 17, 678–688 (2015). [DOI] [PMC free article] [PubMed] [Google Scholar]
- 17.Guilluy C et al. The Rho GEFs LARG and GEF-H1 regulate the mechanical response to force on integrins. Nat Cell Biol 13, 722–727 (2011). [DOI] [PMC free article] [PubMed] [Google Scholar]
- 18.Hytonen VP & Wehrle-Haller B Mechanosensing in cell-matrix adhesions - Converting tension into chemical signals. Exp Cell Res 343, 35–41 (2016). [DOI] [PubMed] [Google Scholar]
- 19.Miranti CK & Brugge JS Sensing the environment: a historical perspective on integrin signal transduction. Nat Cell Biol 4, E83–90 (2002). [DOI] [PubMed] [Google Scholar]
- 20.Colombo M, Raposo G & Thery C Biogenesis, secretion, and intercellular interactions of exosomes and other extracellular vesicles. Annu Rev Cell Dev Biol 30, 255–289 (2014). [DOI] [PubMed] [Google Scholar]
- 21.Kalluri R & LeBleu VS The biology, function, and biomedical applications of exosomes. Science 367 (2020). [DOI] [PMC free article] [PubMed] [Google Scholar]
- 22.Pegtel DM & Gould SJ Exosomes. Annu Rev Biochem 88, 487–514 (2019). [DOI] [PubMed] [Google Scholar]
- 23.Mathieu M, Martin-Jaular L, Lavieu G & Thery C Specificities of secretion and uptake of exosomes and other extracellular vesicles for cell-to-cell communication. Nat Cell Biol 21, 9–17 (2019). [DOI] [PubMed] [Google Scholar]
- 24.Raposo G & Stoorvogel W Extracellular vesicles: exosomes, microvesicles, and friends. J Cell Biol 200, 373–383 (2013). [DOI] [PMC free article] [PubMed] [Google Scholar]
- 25.Ostrowski M et al. Rab27a and Rab27b control different steps of the exosome secretion pathway. Nat Cell Biol 12, 19–30; sup pp 11–13 (2010). [DOI] [PubMed] [Google Scholar]
- 26.Becker A et al. Extracellular Vesicles in Cancer: Cell-to-Cell Mediators of Metastasis. Cancer Cell 30, 836–848 (2016). [DOI] [PMC free article] [PubMed] [Google Scholar]
- 27.Kalluri R The biology and function of exosomes in cancer. J Clin Invest 126, 1208–1215 (2016). [DOI] [PMC free article] [PubMed] [Google Scholar]
- 28.Georges PC et al. Increased stiffness of the rat liver precedes matrix deposition: implications for fibrosis. Am J Physiol Gastrointest Liver Physiol 293, G1147–1154 (2007). [DOI] [PubMed] [Google Scholar]
- 29.Lu Q et al. Hepatocellular carcinoma: stiffness value and ratio to discriminate malignant from benign focal liver lesions. Radiology 275, 880–888 (2015). [DOI] [PubMed] [Google Scholar]
- 30.Wang HB, Dembo M, Hanks SK & Wang YL Focal adhesion kinase is involved in mechanosensing during fibroblast migration. P Natl Acad Sci USA 98, 11295–11300 (2001). [DOI] [PMC free article] [PubMed] [Google Scholar]
- 31.Schrader J et al. Matrix stiffness modulates proliferation, chemotherapeutic response, and dormancy in hepatocellular carcinoma cells. Hepatology 53, 1192–1205 (2011). [DOI] [PMC free article] [PubMed] [Google Scholar]
- 32.Hattula K et al. Characterization of the Rab8-specific membrane traffic route linked to protrusion formation. J Cell Sci 119, 4866–4877 (2006). [DOI] [PubMed] [Google Scholar]
- 33.Strom M, Hume AN, Tarafder AK, Barkagianni E & Seabra MC A family of Rab27-binding proteins. Melanophilin links Rab27a and myosin Va function in melanosome transport. J Biol Chem 277, 25423–25430 (2002). [DOI] [PubMed] [Google Scholar]
- 34.Knodler A et al. Coordination of Rab8 and Rab11 in primary ciliogenesis. Proc Natl Acad Sci U S A 107, 6346–6351 (2010). [DOI] [PMC free article] [PubMed] [Google Scholar]
- 35.Feng S et al. A Rab8 guanine nucleotide exchange factor-effector interaction network regulates primary ciliogenesis. J Biol Chem 287, 15602–15609 (2012). [DOI] [PMC free article] [PubMed] [Google Scholar]
- 36.Wang J et al. Activation of Rab8 guanine nucleotide exchange factor Rabin8 by ERK1/2 in response to EGF signaling. Proc Natl Acad Sci U S A 112, 148–153 (2015). [DOI] [PMC free article] [PubMed] [Google Scholar]
- 37.Meurette O & Mehlen P Notch Signaling in the Tumor Microenvironment. Cancer Cell 34, 536–548 (2018). [DOI] [PubMed] [Google Scholar]
- 38.Huang Q, Li J, Zheng J & Wei A The Carcinogenic Role of the Notch Signaling Pathway in the Development of Hepatocellular Carcinoma. J Cancer 10, 1570–1579 (2019). [DOI] [PMC free article] [PubMed] [Google Scholar]
- 39.Villanueva A et al. Notch Signaling Is Activated in Human Hepatocellular Carcinoma and Induces Tumor Formation in Mice. Gastroenterology 143, 1660–1669 (2012). [DOI] [PMC free article] [PubMed] [Google Scholar]
- 40.Ji J et al. Hepatic stellate cell and monocyte interaction contributes to poor prognosis in hepatocellular carcinoma. Hepatology 62, 481–495 (2015). [DOI] [PMC free article] [PubMed] [Google Scholar]
- 41.Tsuchida T & Friedman SL Mechanisms of hepatic stellate cell activation. Nat Rev Gastroenterol Hepatol 14, 397–411 (2017). [DOI] [PubMed] [Google Scholar]
- 42.Zhou WC, Zhang QB & Qiao L Pathogenesis of liver cirrhosis. World J Gastroenterol 20, 7312–7324 (2014). [DOI] [PMC free article] [PubMed] [Google Scholar]
- 43.Ma JH et al. Mammalian target of rapamycin regulates murine and human cell differentiation through STAT3/p63/Jagged/Notch cascade. Journal of Clinical Investigation 120, 103–114 (2010). [DOI] [PMC free article] [PubMed] [Google Scholar]
- 44.Gonzalez-King H et al. Hypoxia Inducible Factor-1alpha Potentiates Jagged 1-Mediated Angiogenesis by Mesenchymal Stem Cell-Derived Exosomes. Stem Cells 35, 1747–1759 (2017). [DOI] [PubMed] [Google Scholar]
- 45.Rubashkin MG et al. Force engages vinculin and promotes tumor progression by enhancing PI3K activation of phosphatidylinositol (3,4,5)-triphosphate. Cancer Res 74, 4597–4611 (2014). [DOI] [PMC free article] [PubMed] [Google Scholar]
- 46.Mouw JK et al. Tissue mechanics modulate microRNA-dependent PTEN expression to regulate malignant progression. Nat Med 20, 360–367 (2014). [DOI] [PMC free article] [PubMed] [Google Scholar]
- 47.Walia V et al. Akt Regulates a Rab11-Effector Switch Required for Ciliogenesis. Dev Cell 50, 229–246 e227 (2019). [DOI] [PMC free article] [PubMed] [Google Scholar]
- 48.Zhang Y et al. Progressive and Prognosis Value of Notch Receptors and Ligands in Hepatocellular Carcinoma: A Systematic Review and Meta-analysis. Sci Rep 7, 14809 (2017). [DOI] [PMC free article] [PubMed] [Google Scholar]
- 49.Thery C, Amigorena S, Raposo G & Clayton A Isolation and characterization of exosomes from cell culture supernatants and biological fluids. Curr Protoc Cell Biol Chapter 3, Unit 3 22 (2006). [DOI] [PubMed] [Google Scholar]
- 50.Thery C et al. Minimal information for studies of extracellular vesicles 2018 (MISEV2018): a position statement of the International Society for Extracellular Vesicles and update of the MISEV2014 guidelines. J Extracell Vesicles 7, 1535750 (2018). [DOI] [PMC free article] [PubMed] [Google Scholar]
- 51.Peinado H et al. Melanoma exosomes educate bone marrow progenitor cells toward a pro-metastatic phenotype through MET. Nature Medicine 18, 883–891 (2012). [DOI] [PMC free article] [PubMed] [Google Scholar]
- 52.Chen G et al. Exosomal PD-L1 contributes to immunosuppression and is associated with anti-PD-1 response. Nature 560, 382–386 (2018). [DOI] [PMC free article] [PubMed] [Google Scholar]
- 53.Lu HZ et al. PAK signalling drives acquired drug resistance to MAPK inhibitors in BRAF-mutant melanomas. Nature 550, 133–136 (2017). [DOI] [PMC free article] [PubMed] [Google Scholar]
- 54.Patwardhan A et al. Routing of the RAB6 secretory pathway towards the lysosome related organelle of melanocytes. Nat Commun 8, 15835 (2017). [DOI] [PMC free article] [PubMed] [Google Scholar]
- 55.Goedhart J & Luijsterburg MS VolcaNoseR is a web app for creating, exploring, labeling and sharing volcano plots. Sci Rep-Uk 10 (2020). [DOI] [PMC free article] [PubMed] [Google Scholar]
Associated Data
This section collects any data citations, data availability statements, or supplementary materials included in this article.
Supplementary Materials
Data Availability Statement
Source data have been provided in Source Data. For patient cohort expression data, the accession code is in the methods section (GSE14520). The gene expression and clinical data for the LCI dataset including 486 tumors and matched non-tumor liver specimens (non-tumor=239 and tumor=247) are available on Gene Expression Omnibus (GEO) GSE14520 (https://www.ncbi.nlm.nih.gov/geo/query/acc.cgi?acc=gse14520). All other data supporting the findings of this study are available from the corresponding author on reasonable request.


