

ABSTRACT
Objective
Adrenoleukodystrophy (ALD) has a poor prognosis when it progresses to the cerebral form (CALD). The aim of this study is to investigate whether cerebrospinal fluid (CSF) neurofilament light chain (cNfL) is a sensitive biomarker for detecting CALD and assessing response to hematopoietic stem cell transplantation (HSCT).
Methods
We conducted a cross‐sectional study of 41 male ALD patients. The cNfL levels in patients with the cerebral form of ALD (CALD) or the cerebello‐brainstem form of ALD were compared with those in patients with adrenomyeloneuropathy (AMN). The correlation between cNfL levels and MRI‐based Loes severity scores was investigated. A longitudinal analysis was performed on patients who underwent multiple CSF examinations.
Results
The cNfL levels in 22 patients with CALD were significantly higher than those in 14 patients with AMN (median, 5545 vs. 1490 pg/mL; p < 0.001). The cutoff cNfL level of 1930 pg/mL showed good sensitivity (95.5%) and specificity (85.7%) for distinguishing CALD from AMN. The cNfL levels were positively correlated with Loes scores (p < 0.001). The cNfL levels in three AMN patients who later converted to CALD increased above the cutoff level during the conversion period, while the cNfL levels in four patients who remained in AMN were consistently below the cutoff. In 10 ALD patients who underwent HSCT, their cNfL levels decreased 3–24 months after HSCT. Two patients whose cNfL increased after HSCT showed deterioration in cognitive functions.
Interpretation
The cNfL level is useful for evaluating the disease activities of ALD and the response to HSCT.
Introduction
Adrenoleukodystrophy (ALD, OMIM #300100) is an X‐linked neurological disease that is caused by pathogenic variants in ATP‐binding cassette subfamily D member 1 (ABCD1). 1 , 2 ALD is classified into four major clinical types based on the clinical manifestations and the extent of brain lesions: adrenal insufficiency without neurological manifestations (Addison type), adrenomyeloneuropathy (AMN) with spastic paraparesis, cerebello‐brainstem form of ALD (CBALD) presenting with cerebellar ataxia and lower limb spasticity along with magnetic resonance imaging (MRI) findings limited to the cerebellum and brainstem, and cerebral form of ALD (CALD) with cerebral white matter lesions and cognitive dysfunction. 3 , 4 Patients with childhood CALD exhibit a rapidly progressive course, and 46% of them die during a mean follow‐up period of 5.9 years. 5 Similarly, adult CALD has a poor prognosis with a median survival of 7.5 years. 6 For childhood CALD patients, clinical efficacy of hematopoietic stem cell transplantation (HSCT) has been established when performed at an early disease stage. 7 , 8 , 9 We previously demonstrated the efficacy of HSCT for adult/adolescent patients with CALD or CBALD when performed at an early disease stage. 10 HSCT was not beneficial for childhood CALD in advanced stages. 11 Because brain lesions in CALD rapidly progress, it is crucial to establish the diagnosis of CALD as early as possible to obtain the favorable clinical efficacy of HSCT.
Currently, brain MRI is used to evaluate the extent of demyelinating brain lesions in patients with ALD. Serial evaluation of MRI findings employing the MRI‐based Loes severity score 12 has been used to semi‐quantitatively evaluate the progression of cerebral lesions. Gadolinium (Gd) contrast enhancement, which reflects the disruption of the blood–brain barrier and active inflammatory demyelination, is also widely used to evaluate the activity of cerebral lesions in ALD. 13 However, it is difficult to quantitatively evaluate the degree of axonal damage and demyelination using MRI. Furthermore, patients with CALD or CBALD do not always show Gd enhancement. 10 , 14 Therefore, sensitive biomarkers that closely reflect the activity of ALD would be highly useful for early detection of CALD or CBALD.
Neurofilament light chain (NfL) is a cytoskeletal protein that composes neurofilaments and is exclusively expressed in neurons. Recently, NfL has been widely used as a reliable and sensitive marker for assessing the severity and progression of various neurological disorders. 15 A previous study showed that plasma NfL (pNfL) levels were elevated in CALD patients and found useful in discriminating CALD from AMN. 16 However, the pNfL levels in CALD partially overlapped with those in AMN. 16 As NfL is released into the cerebrospinal fluid (CSF) upon neuroaxonal damage and further leaked into blood stream, the NfL level in CSF (cNfL) is expected to more sensitively reflect damages in central nervous system than pNfL. Additionally, the previous study only documented changes in pNfL levels after HSCT in two patients. 16
In this study, we evaluated the usefulness of cNfL levels for assessing the activity of inflammatory demyelination in CALD and CBALD, and for detecting the conversion from AMN to CALD or CBALD. We furthermore investigated changes in cNfL levels after HSCT in 14 ALD patients.
Methods
Patients and clinical assessment
Flow charts of the analyses are shown in Figure 1. First, we performed a cross‐sectional study of 41 male ALD patients who were hospitalized at the Department of Neurology at the University of Tokyo Hospital and underwent at least one CSF examinations between March 2008 and October 2021. CSF samples were collected for the clinical care of the patients. All the patients were confirmed to carry pathogenic variants of ABCD1 and elevated levels of very long‐chain saturated fatty acids in plasma sphingomyelin. For patients who underwent multiple CSF examinations, the results of their initial CSF examination were used for the cross‐sectional analysis. Brain MRI was carried out within 2 months before or after the initial CSF examination in all the patients. The Loes score 12 of brain MRI was evaluated by the radiologist (H.M.) and neurologist (T.M.) of this research group independently, and the ultimate decision was made on the basis of mutual agreement. Clinical phenotypes were assessed when the initial CSF examination was made.
Figure 1.
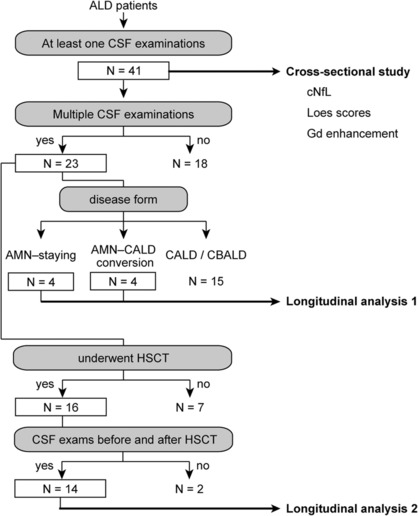
Patient selection for the analysis of cNfL. We conducted a retrospective analysis of ALD patients admitted to the neurological department of the University of Tokyo Hospital between March 2008 and October 2021. There were 41 ALD patients who underwent at least one CSF examination. A cross‐sectional study was conducted for these 41 ALD patients. In the cross‐sectional study, cNfL of the initial CSF samples and the Loes severity scores were assessed for all the patients. For gadolinium contrast‐enhanced MRI, only those who underwent this imaging modality were included in the analysis. A longitudinal study was then conducted on ALD patients who underwent multiple CSF examinations and consisted of two parts. In the first part, patients were classified according to changes in disease forms. To investigate whether cNfL is useful in detecting conversion from AMN to CALD, we examined changes in cNfL levels and the Loes scores in a group of patients who converted from AMN to CALD and a group of patients who remained in AMN (“AMN‐staying”) (Longitudinal analysis 1). In the second part, to investigate changes in cNfL levels after HSCT, we focused on ALD patients who underwent CSF examinations before and after HSCT (Longitudinal analysis 2). One patient was included in both parts of the longitudinal study (Figs 4A and 5A, Patient 1).
We defined the clinical phenotypes of ALD as follows. When cerebral lesions with or without Gd enhancement detected by MRI, patients were classified as having CALD. When the patients had cerebellar and/or brainstem lesions without cerebral lesions in MR images, they were classified as having CBALD. Patients exhibiting only spastic paraparesis without any lesions or those with MRI findings confined to pyramidal tracts were classified as having AMN. Patients with only faint hyperintensities in T2‐weighted images surrounding the dorsal horn of the lateral ventricles that did not enlarge in the following examinations were classified as having AMN, not CALD. Therefore, the maximum Loes score for AMN is three (internal capsule, brainstem pyramidal tract, and white matter surrounding the posterior horn of the lateral ventricle). We defined “conversion from AMN (or CBALD) to CALD” as the time when the appearance of any cerebral lesions other than faint hyperintensities in T2‐weighted images in the white matter surrounding the posterior horn of the lateral ventricles on head MRI was recognized. Similarly, we defined “conversion from AMN to CBALD” as the time when the appearance of cerebellar and/or brainstem lesions without cerebral lesions was recognized.
Next, a longitudinal analysis was performed on the patients who underwent multiple CSF examinations, which consisted of two parts. To investigate whether cNfL is useful in detecting conversion from AMN to CALD, we examined changes in cNfL levels and the Loes scores in a group of patients who converted from AMN to CALD and a group of patients who remained in AMN (Longitudinal analysis 1). To evaluate the therapeutic effect of HSCT on cNfL levels, we focused on ALD patients whose CSF was collected before and after HSCT (Longitudinal analysis 2). The indications and protocols of HSCT were described previously. 10
This is a single‐institution‐based retrospective study. Written informed consent was obtained from all the patients. This study was approved by the institutional review board of the University of Tokyo.
Sample processing and laboratory methods
After CSF samples were collected, they were centrifuged for 10 min at 3000 rpm at 4°C, and 0.5–2.0 mL aliquots of the supernatant were placed into 2‐mL polypropylene tubes and stored at −80°C until use. The NfL levels in CSF were measured using the NF‐light Kit (UmanDiagnostics, Umeå, Sweden) following the manufacturer's instructions. The measurements were conducted in duplicate and the average of two measurements was taken as the cNfL level. The variation between the two measurements of the same sample was <8.4% in 89 samples.
Statistical analyses
Continuous and ordinal parameters were described by the median and the interquartile range (IQR). Univariate analyses were performed using the Mann–Whitney–Wilcoxon test or the Kruskal–Wallis multiple comparison tests followed by the Steel–Dwass post hoc test. The correlation of cNfL level with Loes score was assessed by the Spearman's rank correlation method. We evaluated the relationship between cNfL level and the presence of Gd‐enhanced lesions by multiple regression analysis in which age at the initial CSF examination, presence of Gd‐enhanced lesions, and Loes scores were response variables and the cNfL level was an objective variable. The term for Gd is set to 1 if Gd‐enhanced lesions exist and 0 otherwise. All statistical tests were two‐tailed, and p‐values <0.05 indicated statistically significant differences. The EZR (R version 4.0.3) and Microsoft Excel (Microsoft, Redmond, WA, USA) were used for all analyses and the preparation of figures. 17 , 18
Results
Cross‐sectional analyses of cNfL levels in patients with various clinical phenotypes of ALD
In the cross‐sectional study, there were 14 AMN patients, 22 CALD patients, and 5 CBALD patients. Among the 22 CALD patients, one had adolescent‐onset CALD, and the others had adult‐onset CALD. The clinical characteristics of the patients at the initial CSF examination are shown in Table 1. At the initial CSF examination, none of the ALD patients had undergone HSCT. The cNfL levels in CALD patients were significantly higher than those in AMN patients [Fig. 2A, median (IQR), 5550 (4320–8540) pg/mL vs. 1490 (1170–1660) pg/mL, p = 1.0 × 10⁻⁵, Kruskal–Wallis test]. Although we did not have data on cNfL levels in healthy controls, the previous report showed that the median (IQR) of cNfL level in 42 healthy controls was 205 (80–1300) pg/mL using the same kit. 19 The cNfL levels in patients with CBALD were also markedly higher than those in AMN patients, although this difference was statistically not significant presumably because of the small sample size and large variations [median 10,100 (9430–11,400) pg/mL, p = 0.068, Kruskal–Wallis test]. There was no significant difference between the cNfL levels in CALD and those in CBALD (p = 0.48, Kruskal–Wallis test). We conducted a logistic regression analysis and obtained the receiver operating characteristic curves (ROC) to determine the sensitivity and specificity of cNfL level in discriminating CALD patients from AMN patients. cNfL level was shown to be a potent indicator for discriminating CALD from AMN [Fig. 2B, area under the curve (AUC), 0.964] with the optimal cutoff cNfL level of 1930 pg/mL (95.5% sensitivity and 85.7% specificity).
Table 1.
Baseline demographic data of patients with AMN, CALD, and CBALD at the timepoint of initial cerebrospinal fluid examination.
| AMN | CALD | CBALD | Healthy control 1 | |
|---|---|---|---|---|
| Number of patients | 14 | 22 | 5 | 42 |
| Age at the initial CSF examination | 32.7 (30.6–44.3) | 37.3 (28.9–48.8) | 22.6 (20.9–25.3) | NA |
| EDSS | 3.3 (2.1–3.5) | 3.0 (0.0–5.4) | 3.0 (2.0–3.5) | NA |
| Loes score | 1.5 (0.1–2.0) | 6.0 (4.0–8.9) | 4.5 (3.0–5.0) | NA |
| Gd enhancement, n | 0 (0%) | 18 (81.8%) | 2 (40.0%) | NA |
| WAIS FIQ | 98.5 (78.5–107) | 84.0 (76.0–98.0) | 85.0 (76.0–87.0) | NA |
| WAIS PIQ | 94.0 (80.3–102.8) | 78.0 (65.8–92.3) | 75.0 (67.0–84.0) | NA |
| WAIS VIQ | 99.0 (80.3–113.3) | 92.5 (84.5–105.8) | 89.0 (82.0–104.0) | NA |
| cNfL, pg/mL |
1490 (1170–1660) |
5550 (4320–8540) |
10,100 (9430–11,400) |
205 (80–1300) |
Values are presented as median (interquartile range) or number (percentage).
AMN, adrenomyeloneuropathy; CALD, cerebral form of adrenoleukodystrophy; CBALD, cerebello‐brainstem form of adrenoleukodystrophy; cNfL, neurofilament light levels in cerebrospinal fluid; EDSS, expanded disability status scale; FIQ, full‐scale intelligence quotient; Gd, gadolinium; NA, not available; PIQ, performance intelligence quotient; VIQ, verbal intelligence quotient.
The cNfL levels for healthy controls were taken from data in Novakova et al. 19
Figure 2.

NfL levels in AMN, CALD, and CBALD patients. (A) cNfL levels in AMN (n = 14), CALD (n = 22), and CBALD patients (n = 5) who did not undergo HSCT. The median cNfL levels and the interquartile ranges were indicated by a gray box. The difference in means between groups was statistically significant (p = 2.4 × 10⁻⁵, Kruskal–Wallis multiple comparison tests). The p‐values were obtained with the nonparametric Steel–Dwass test. n.s., not statistically significant. (B) Receiver operating characteristic (ROC) curve for the capability of cNfL level to discriminate CALD from AMN. Area under the curve (AUC) = 0.964 (0.91–1 CI 95%).
Correlation of cNfL levels with Loes scores and Gd enhancement
First, we determined whether cNfL levels correlated with the extent of the cerebral lesions as evaluated by the Loes score in the cross‐sectional study. We found a statistically significant positive correlation of cNfL levels with Loes scores (Fig. 3A, Spearman's r = 0.72, p = 1.4 × 10⁻⁷). We then compared cNfL levels between CALD or CBALD patients with and those without Gd‐enhanced lesions. As AMN patients do not have Gd‐enhanced lesions by definition, we excluded AMN patients in this analysis. One patient who received a double dose of the Gd contrast was included in the group with Gd‐enhanced lesions. The cNfL levels in patients with CALD or CBALD showing Gd‐enhanced lesions were not significantly different from those not showing Gd‐enhanced lesions [Fig. 3B, median (IQR), 6210 (4450–8790) pg/mL vs. 9550 (2940–10,800) pg/mL, p = 0.98, Mann–Whitney–Wilcoxon test]. In the patients with CALD or CBALD, multiple logistic regression analysis with the Loes score, presence of Gd‐enhanced lesions, and age as predictors revealed that the Loes score was a positive predictor of cNfL level (p = 0.043), whereas presence of Gd‐enhanced lesions was not (p = 0.94), showing that cNfL level correlates with the Loes score but not with the presence of Gd‐enhanced lesions (Table 2). Of note, some patients with Gd‐enhanced lesions had very high cNfL levels.
Figure 3.

Relationship between brain‐MRI‐based Loes severity score and cNfL level. (A) Correlation between the MRI‐based severity score of Loes and cNfL level (n = 41). The dotted line shows the linear regression. (B) cNfL levels in CALD or CBALD patients classified by the presence (n = 20) or absence (n = 7) of Gd‐enhanced lesions. The median and the interquartile ranges are indicated by bold bars and gray boxes, respectively. n.s., not statistically significant.
Table 2.
Coefficients table of multiple regression analysis.
| Partial regression coefficient | Standard error | t value | p | |
|---|---|---|---|---|
| Intercept | 6280 | 2900 | 2.17 | 0.041 |
| Loes score | 476 | 222 | 2.14 | 0.043 |
| Gd enhancement | 136 | 1900 | 0.071 | 0.94 |
| Age | −52.4 | 70.3 | −0.75 | 0.46 |
Elevated cNfL level during conversion from AMN to CALD or CBALD—Longitudinal analysis 1
We next performed a longitudinal analysis of cNfL levels in ALD patients who underwent multiple CSF examinations. Of the 23 patients who underwent multiple CSF examinations, 4 were “AMN‐staying” patients, that is, patients who remained as AMN, and 4 converted from AMN to CALD (Fig. 1, Longitudinal analysis 1). The remaining 15 patients already had CALD or CBALD at diagnosis.
The cNfL levels in AMN‐staying patients remained below the AMN–CALD cutoff for a period of 3.5–10.9 years (Fig. 4B). In contrast, of the four patients who converted from AMN to CALD, the cNfL levels were below the AMN–CALD cutoff cNfL value of 1930 pg/mL before the conversion (Patients 1 and 2) followed by an increase after the conversion (Fig. 4A). Patient 3 had cNfL level higher than the AMN–CALD cutoff 12 months before conversion from AMN to CALD, and Patient 4 had a high cNfL level shortly after the conversion from AMN to CBALD. In Patient 2, the cNfL level and Loes score further increased approximately 6 months after the conversion. Although the sample size was small, the high or increasing cNfL levels above the AMN–CALD cutoff cNfL level were associated with the conversion from AMN to CALD or CBALD.
Figure 4.
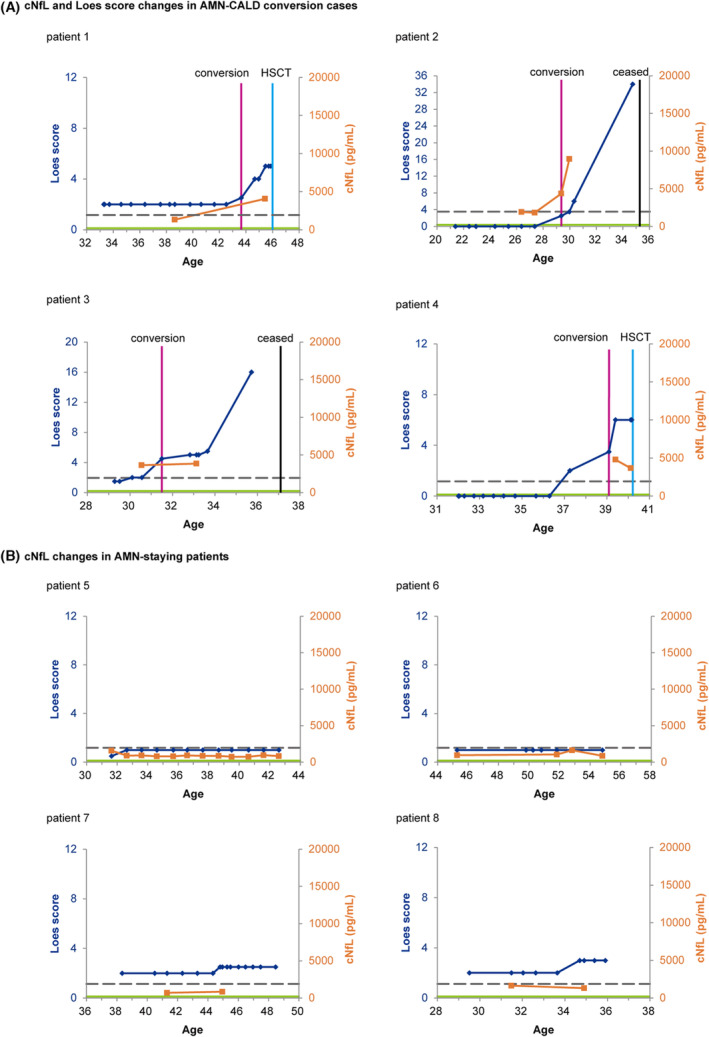
Longitudinal analysis of cNfL levels in ALD patients before or without HSCT. (A) Changes in cNfL level and Loes score over time in patients with AMN that later converted to CALD or CBALD. (B) Temporal profile of cNfL levels and Loes scores in AMN‐staying patients. Blue and orange lines indicate the Loes scores and cNfL levels, respectively. Magenta lines indicate the time of the AMN–CALD conversion (Patient 1, 3, and 4) or that of AMN–CBALD conversion (Patient 2). The gray dotted line shows the AMN–CALD cutoff cNfL level. The green line shows the median cNfL value of 205 pg/ml in healthy controls. 19 Note that only the Loes scores and cNfL levels before HSCT (shown in cyan lines) are shown in this figure. The values on the vertical axes are standardized to Loes scores up to 12 and cNfL levels up to 20,000 pg/mL. The vertical axes of the Loes scores for Patients 2 and 3 were adjusted because the maximum Loes scores of these patients exceeded 12.
Change in cNfL levels in patients with CALD or CBALD before and after HSCT—Longitudinal analysis 2
To investigate the role of cNfL levels for evaluating efficacy of HSCT, we longitudinally analyzed changes in cNfL levels in patients with CALD or CBALD who underwent HSCT. Of the 23 ALD patients who underwent multiple CSF examinations, 16 underwent HSCT, 14 of whom underwent CSF examination both before and after HSCT (Fig. 1, Longitudinal analysis 2). The cNfL levels decreased after HSCT in 10 patients (Patients 1, 9–17), while the cNfL levels increased 2–16 months after HSCT in 4 patients (patients 18–21) (Fig. 5).
Figure 5.

Changes in cNfL levels in ALD patients before and after HSCT. (A) Longitudinal cNfL levels in 10 ALD patients whose cNfL levels decreased after HSCT. (B) Longitudinal cNfL levels in four ALD patients whose cNfL levels elevated after HSCT. The time when HSCT was performed was set to 0. The gray dotted line shows the AMN–CALD cutoff cNfL level. Patients 1, 9–11, 14, 15, 17, 20, and 21 had CALD, and Patients 12, 13, 16, 18, and 19 had CBALD.
Of the 10 patients who showed a decrease in cNfL level after HSCT, 6 patients whose cNfL levels decreased substantially in 3–24 months after HSCT initially had relatively high cNfL levels (>4000 pg/mL) before HSCT (Fig. 5A, patients 1 and 9–13). More than 2 years after HSCT, the cNfL levels of these patients still showed a gradual decrease. The cNfL levels in the three patients (Patients 1, 9, and 11) decreased below the AMN–CALD cutoff cNfL level of 1930 pg/mL after HSCT. Patients 14–16 had relatively low cNfL levels (<2500 pg/mL) before HSCT, and their cNfL levels further decreased mildly after HSCT. All the 10 patients (Patients 1 and 9–17) who showed a decrease in cNfL levels after HSCT had preserved cognitive function and stable brain lesions on MRI at the last follow‐up.
Of the 4 patients who showed increase in the cNfL levels (patients 18–21, Fig. 5B), the cNfL level decreased in the following follow‐up period in patient 18. In each of patients 19–21, only one CSF sample was available after HSCT. Cognitive function deteriorated in two patients (patients 20 and 21), while it was preserved in the other two patients (patients 17 and 18). Patients 20 and 21 became speechless and unable to communicate 6 and 4 months after HSCT, respectively. After publication of our previous report, 10 patient 21 died 13.8 months after HSCT owing to frequent aspiration pneumonia.
Discussion
We found that cNfL levels were markedly increased in patients with CALD or CBALD than in those with AMN and that cNfL levels were positively correlated with the extent of the brain lesions. Longitudinal analyses of cNfL levels and the clinical presentations of the patients revealed that cNfL levels remained below the cutoff cNfL level while patients remained having AMN, and they increased when AMN converted to CALD or CBALD. Furthermore, we observed that the cNfL levels in the majority of the ALD patients who underwent HSCT sharply decreased by 2 years after HSCT, then gradually declined.
Whether cNfL level or MRI can be used to detect conversion from AMN to CALD or CBALD earlier is of clinical importance. Patients who converted to CALD typically showed a rapid increase in Loes score, as in patients 1–3 (Fig. 4A). Of the three patients, the increase in cNfL level was found before the detection by MRI lesion enlargement in one patient (Patient 3), simultaneously with lesion enlargement in one patient (Patient 2), and after the conversion in one patient (Patient 1). Owing to the small number of patients with AMN–CALD conversion, however, further investigation with a larger number of patients would be needed before we can conclusively determine whether cNfL level or MRI can detect the conversion at an earlier stage. Because this is a retrospective study, the interval and frequency of CSF examination varied, with MRI being performed more frequently than CSF examinations (Fig. 4). Thus, there remains a possibility of selection bias in CSF sampling. Nonetheless, it is noteworthy that the increase in cNfL level before the detection by MRI lesion enlargement was observed in one patient (Patient 3). Despite the limitation of the study, the present study indicates that cNfL level is a promising biomarker to detect conversion from AMN to CALD or CBALD. To determine whether cNfL level or MRI can detect conversion from AMN to CALD or CBALD at an earlier stage, it would be necessary to match the interval and frequency of CSF examinations with those of MRI examinations as a prospective study.
Another biomarker of disease activity of ALD is the presence of Gd‐enhanced lesions. In our study, cNfL levels were not higher in patients with Gd‐enhanced lesions than in those without Gd‐enhanced lesions. In addition, the cNfL level was sometimes high even in the absence of Gd‐enhanced lesions. From these observations, NfL level, which reflects axonal disorders throughout the brain, may more sensitively reflect the disease activity of ALD than the presence of Gd‐enhanced lesions.
Regarding implications of measuring cNfL levels after HSCT, we observed the changes in cNfL levels after HSCT in 14 ALD patients. In six patients whose pre‐HSCT cNfL levels were high (>4000 pg/mL), cNfL levels sharply decreased 3–24 months after HSCT and then further decreased at a slower pace. In addition, cNfL levels in three patients eventually decreased to levels comparable to those in AMN patients after HSCT. Three patients who had relatively low cNfL levels (<2500 pg/mL) before HSCT also showed a decrease in cNfL levels after HSCT. These changes in cNfL levels, which decrease as early as 3 months after HSCT, are interpreted to reflect the cessation of neuro‐axonal damage with HSCT. The cessation of neuro‐axonal damage with HSCT is further supported by the stabilization of MRI lesions within approximately 1 year. Consequently, the changes in the cNfL levels may be more useful than MRI for sensitive evaluation of the changes in the neuro‐axonal damage after HSCT.
Of note, among patients who had elevated cNfL levels after HSCT, cognitive function deteriorated in two patients (Fig. 5B, Patients 20 and 21). During the period of coordinating the bank donor for HSCT, Patient 20 had progressively deteriorated motor function and Patient 21 exhibited enlarged cerebral lesions. In Patient 21, the number of total nucleated cells per recipient body weight was as low as 0.92 × 10⁸/kg. Although engraftment was confirmed, the three blood cell lineages were scarce, and regular blood transfusions were required. The deterioration prior to HSCT in Patients 20 and 21 and the low number of transfused cells in Patient 21 may underlie the poor response to HSCT. Although the number of patients is small, an increase in cNfL level above the pretreatment level may indicate an insufficient response to HSCT. Taken together, cNfL level reflects the disease activity of CALD and CBALD and the treatment response after HSCT more sensitively than brain MRI findings.
In this study, we measured cNfL levels. Whether cNfL or blood NfL level is more useful for evaluating the disease activity of ALD is another important issue. 16 , 20 Considering that the CSF compartment is closer to brain lesions than the blood stream, cNfL level seems to sensitively reflect the presence of brain lesions. 21 Neuroaxonal damage in the central nervous system as well as inflammatory or infectious diseases in the peripheral nerves have been shown to affect the plasma and serum NfL levels. 21 As demonstrated in this study, the AUC on the ROC curve that divides CALD from AMN was 0.964 for cNfL, which was substantially higher than the previously reported 0.73 for pNfL (Fig. 2). 16 Thus, cNfL level appears to be promising as a sensitive biomarker in the evaluation of the disease activity of CALD and CBALD. Compared with the collection of blood samples, however, frequent collection of CSF samples is a substantial burden for patients. Further studies are needed to determine the clinical usefulness of cNfL and pNfL in assessing disease activity in ALD patients and the appropriate clinical use of cNfL and pNfL.
The lack of data on cNfL levels in healthy controls is a limitation. However, the ELISA kit we used is widely used, and cNfL levels in healthy controls were determined using this same kit. 19
In summary, cNfL level is useful for evaluating neuro‐axonal damages in CALD and CBALD. Longitudinal measurements of cNfL level may serve as a potent biomarker for detecting the conversion from AMN to CALD or CBALD. The cNfL levels after HSCT well reflect the disease activity and the treatment response.
Funding Information
This study was supported by grants (20ek0109491h0001, 21ek0109491h0002, and 22ek0109491h0003) from the Japan Agency for Medical Research and Development (AMED), and KAKENHI (19K17001, 22K07533, 22r K07413) from the Ministry of Education, Culture, Sports, Science and Technology of Japan.
Author Contributions
T.K. designed and conceptualized the study, analyzed the data; wrote the draft of the manuscript. T.M. evaluated MR images, designed and conceptualized the study, and wrote the draft of the manuscript. H.M. evaluated MR images and wrote the draft of the manuscript. H.I., S.T., and T.T. designed and conceptualized the study, and wrote the draft of the manuscript.
Conflict of Interest
The authors have no conflict of interest to declare.
Funding Statement
This work was funded by Japan Agency for Medical Research and Development grants 20ek0109491h0001, 21ek0109491h0002, and 22ek0109491h0003; Ministry of Education, Culture, Sports, Science and Technology of Japan grants 19K17001, 22K07413, and 22K07533.
Data Availability Statement
The data supporting these findings are available upon request.
References
- 1. Mosser J, Douar AM, Sarde CO, et al. Putative X‐linked adrenoleukodystrophy gene shares unexpected homology with ABC transporters. Nature. 1993;361:726‐730. [DOI] [PubMed] [Google Scholar]
- 2. Takano H, Koike R, Onodera O, Sasaki R, Tsuji S. Mutational analysis and genotype‐phenotype correlation of 29 unrelated Japanese patients with X‐linked adrenoleukodystrophy. Arch Neurol. 1999;56:295‐300. [DOI] [PubMed] [Google Scholar]
- 3. Moser HW, Mahmood A, Raymond GV. X‐linked adrenoleukodystrophy. Nat Clin Pract Neurol. 2007;3:140‐151. [DOI] [PubMed] [Google Scholar]
- 4. Takemoto Y, Suzuki Y, Tamakoshi A, et al. Epidemiology of X‐linked adrenoleukodystrophy in Japan. J Hum Genet. 2002;47:590‐593. [DOI] [PubMed] [Google Scholar]
- 5. Mahmood A, Raymond GV, Dubey P, Peters C, Moser HW. Survival analysis of haematopoietic cell transplantation for childhood cerebral X‐linked adrenoleukodystrophy: a comparison study. Lancet Neurol. 2007;6:687‐692. [DOI] [PubMed] [Google Scholar]
- 6. Suzuki Y, Takemoto Y, Shimozawa N, et al. Natural history of X‐linked adrenoleukodystrophy in Japan. Brain Dev. 2005;27:353‐357. [DOI] [PubMed] [Google Scholar]
- 7. Aubourg P, Blanche S, Jambaqué I, et al. Reversal of early neurologic and Neuroradiologic manifestations of X‐linked Adrenoleukodystrophy by bone marrow transplantation. N Engl J Med. 1990;322:1860‐1866. [DOI] [PubMed] [Google Scholar]
- 8. Shapiro E, Krivit W, Lockman L, et al. Long‐term effect of bone‐marrow transplantation for childhood‐onset cerebral X‐linked adrenoleukodystrophy. Lancet. 2000;356:713‐718. [DOI] [PubMed] [Google Scholar]
- 9. Peters C, Charnas LR, Tan Y, et al. Cerebral X‐linked adrenoleukodystrophy: the international hematopoietic cell transplantation experience from 1982 to 1999. Blood. 2004;104:881‐888. [DOI] [PubMed] [Google Scholar]
- 10. Matsukawa T, Yamamoto T, Honda A, et al. Clinical efficacy of haematopoietic stem cell transplantation for adult adrenoleukodystrophy. Brain Commun. 2020;2:fcz048. [DOI] [PMC free article] [PubMed] [Google Scholar]
- 11. Moser HW, Tutschka PJ, Brown FR, et al. Bone marrow transplant in adrenoleukodystrophy. Neurology. 1984;34:1410‐1417. [DOI] [PubMed] [Google Scholar]
- 12. Loes DJ, Hite S, Moser H, et al. Adrenoleukodystrophy: a scoring method for brain MR observations. Am J Neuroradiol. 1994;15:1761‐1766. [PMC free article] [PubMed] [Google Scholar]
- 13. Miller WP, Mantovani LF, Muzic J, et al. Intensity of MRI gadolinium enhancement in cerebral Adrenoleukodystrophy: a biomarker for inflammation and predictor of outcome following transplantation in higher risk patients. Am J Neuroradiol. 2016;37:367‐372. [DOI] [PMC free article] [PubMed] [Google Scholar]
- 14. Mallack EJ, van de Stadt S, Caruso PA, et al. Clinical and radiographic course of arrested cerebral adrenoleukodystrophy. Neurology. 2020;94:e2499‐e2507. [DOI] [PMC free article] [PubMed] [Google Scholar]
- 15. Khalil M, Teunissen CE, Otto M, et al. Neurofilaments as biomarkers in neurological disorders. Nat Rev Neurol. 2018;14:577‐589. [DOI] [PubMed] [Google Scholar]
- 16. Weinhofer I, Rommer P, Zierfuss B, et al. Neurofilament light chain as a potential biomarker for monitoring neurodegeneration in X‐linked adrenoleukodystrophy. Nat Commun. 2021;12:1816. [DOI] [PMC free article] [PubMed] [Google Scholar]
- 17. Kanda Y. Investigation of the freely available easy‐to‐use software “EZR” for medical statistics. Bone Marrow Transplant. 2013;48:452‐458. [DOI] [PMC free article] [PubMed] [Google Scholar]
- 18. Ihaka R, Gentleman R. R: a language for data analysis and graphics. J Comput Graph Stat. 1996;5:299‐314. [Google Scholar]
- 19. Novakova L, Zetterberg H, Sundström P, et al. Monitoring disease activity in multiple sclerosis using serum neurofilament light protein. Neurology. 2017;89:2230‐2237. [DOI] [PMC free article] [PubMed] [Google Scholar]
- 20. van Ballegoij WJC, van de Stadt SIW, Huffnagel IC, et al. Plasma NfL and GFAP as biomarkers of spinal cord degeneration in adrenoleukodystrophy. Ann Clin Transl Neurol. 2020;7:2127‐2136. [DOI] [PMC free article] [PubMed] [Google Scholar]
- 21. Ferreira‐Atuesta C, Reyes S, Giovanonni G, Gnanapavan S. The evolution of Neurofilament light chain in multiple sclerosis. Front Neurosci. 2021;15:1‐13. [DOI] [PMC free article] [PubMed] [Google Scholar]
Associated Data
This section collects any data citations, data availability statements, or supplementary materials included in this article.
Data Availability Statement
The data supporting these findings are available upon request.