

Abstract
Objective:
Little is known about sex differences in response to lifestyle interventions among pediatric populations. The purpose of this analysis was to evaluate sex differences in adiposity following lifestyle interventions among children and adolescents with overweight or obesity aged 6–18 years old.
Methods:
Searches were conducted in PubMed, Web of Science, and MEDLINE (from inception to March 2021) and references from included articles were examined. Eligibility criteria included children and adolescents aged 6 to 18 years old with overweight or obesity, randomization to a lifestyle intervention vs. control group, and assessment of at least one adiposity measure. Corresponding authors were contacted to obtain summary statistics by sex (n=14/49).
Results:
Of 89 full-text articles reviewed, 49 (55%) were included, of which 33 (67%) reported statistically significant intervention effects on adiposity. Only two studies (4%) evaluated sex differences in response to lifestyle intervention, reporting conflicting results. The results of the meta-regression models demonstrated no significant differences in treatment effect between male and female youth for weight (beta=−0.05, SE=0.18; z=−0.28, p=0.8), BMI (beta=0.03, SE=0.14; z=0.19, p=0.85), BMI-z (beta=−0.04, SE=0.18; z=−0.23, p=0.82), BF% (beta=−0.11, SE=0.16; z=−0.67, p=0.51), and waist circumference (beta=−0.30, SE=0.25; z=−1.18, p=0.24).
Conclusion:
The meta-analysis revealed that youth with overweight or obesity do not demonstrate a differential response to lifestyle intervention in relation to adiposity-related outcomes.
Keywords: sexual dimorphism, lifestyle intervention, pediatric, nutrition
Introduction
Sex differences in adiposity emerge during adolescence and persist throughout the life course. Most recent evidence indicates that there is a greater proportion of female youth (17.6% vs. 14.7%) with overweight whereas there is a higher proportion of male youth with obesity (20.5% vs. 18.0%) or severe obesity (6.9% vs. 5.2%), independent of age and race/ethnicity.1 Further, adolescent females tend to have higher total body fat than males, while males tend to have a greater visceral adipose tissue (VAT) than females.2 This disproportional distribution of adiposity between the sexes is associated with differential rates of obesity-related diseases such as type 2 diabetes (female>male),3 non-alcoholic fatty liver disease (male>female),4 and metabolic syndrome (male>female).5
Lifestyle intervention is an efficacious treatment strategy for youth with overweight or obesity as demonstrated by reductions in weight, BMI, and BMI-z.6–9 Effective lifestyle interventions typically include both a dietary and physical activity (PA) component,9 involvement of a therapeutic team (i.e., dietitian and physician),9 a duration of at least 6 months,9 and the incorporation of behavioral change strategies.10 Further, past reviews have shown that multi-strategy nutrition education, which consists of behavioral change and parental involvement, is a key component of successful interventions.11,12 Despite these design similarities, lifestyle interventions can vary based on setting (home, school, or community); level of intervention (individual, parent, or family); duration, intensity, and behavioral targets. Whether the response of adipose tissue to lifestyle intervention is also differentiated by sex has yet to be established and will inform future precision approaches that treat obesity and obesity-related diseases among high-risk youth.
Although sex differences in response to lifestyle interventions are seldom reported in the literature, there is evidence to support this notion. A secondary data analysis of a lifestyle intervention that demonstrated a significant reduction in adiposity13 found that the intervention effect was more pronounced in male youth as compared to female youth for reduction in body fat percent (BF%) and increase in fat-free mass.14 Similarly, other lifestyle interventions have demonstrated a significantly greater reduction in overweight15,16 or obesity17 prevalence, and BMI16 for adolescent males as compared to females. Conversely, long-term follow-up of two lifestyle interventions demonstrated greater reductions in BMI-z17 and weight18 among adolescent females as compared to males. Taken together, these studies suggest male youth may experience greater short-term reductions in adiposity whereas female youth may obtain greater long-term benefit following a lifestyle intervention; however, further research is warranted.
This systematic review aims to evaluate whether lifestyle interventions for treatment of overweight or obesity results in differential effects between male and female youth for a variety of anthropometric and adiposity measures. This review also aims to describe the magnitude of the differential response to lifestyle intervention between the sexes through a meta-analysis examining the pooled effects for weight, BMI, BMI-z, and WC.
Methods
The protocol was registered through PROSPERO (CRD42021229762), and data extraction followed 2020 Preferred Reporting Items for Systematic Reviews and Meta-Analyses guidelines.19
Search strategy
Literature was searched in three electronic databases (PubMed, Web of Science, and MEDLINE) from inception through March 2021. The search strings used can be found in Table S1.
Inclusion and Exclusion Criteria
The searches were limited to randomized controlled trials, English language, full-text, and human subject research. Additional inclusion criteria were: 1) male and female, children and adolescents aged at least 6 but less than 18 years old with an age- and sex- adjusted BMI, BMI-z, or BMI percentile that met country specific definitions for overweight or obesity, 2) lifestyle intervention that included both nutritional and PA components, 3) control group (CG) that received no intervention, modified version of the intervention, or usual care, and 4) a measure of adiposity (e.g., BMI, BMI-z, BF%, fat mass). Studies that focused only on diet or PA, included a medication component, or did not have a CG were excluded. The age range was selected because children are typically in school five days a week beginning at six years of age and physical activity recommendations are the same for youth aged 6–17 years old.
Data extraction
A standardized data form (Microsoft Excel, Microsoft, 2010) was used for extraction and tabulation. The following data were extracted during the initial review of article titles and abstracts: abbreviated citation, specific aim/purpose, study design, country, age of population, sample size, primary and secondary outcomes of interest, exposure of interest (i.e., summary of intervention components and duration), and main results. The first reviewer (A.M.) performed the individual searches in each of the designated databases, reviewed the titles and abstracts for inclusion/exclusion criteria, entered all data mentioned above into a Microsoft Excel database, and provided an initial eligibility decision (yes/no). If the article was excluded, the reviewer provided a reason for exclusion. A.P. served as the secondary reviewer, reviewed all articles entered in the database and provided a secondary eligibility decision (yes/no). The second reviewer was blinded to the primary reviewer’s initial eligibility decision. K.B.V. served as the tertiary reviewer and reviewed any articles where there was disagreement between the first and secondary reviewer’s eligibility decision. After the initial review of titles and abstracts was complete, the eligible articles were divided among the three reviewers for full-text review. In addition, the reference lists of the included articles were searched to identify any other potentially eligible studies. The majority (95%, n=39/41) of included studies did not report sex differences in response to the intervention; therefore, corresponding authors were contacted to obtain this data.
Assessment of Methodological Quality and Bias
Risk of potential bias and study quality were evaluated using the GRADE (Grading of Recommendations Assessment, Development, and Evaluation) approach and the Quality Assessment of Controlled Intervention Studies developed by the National Heart, Lung, and Blood Institute.20 Each reviewer provided yes/no responses for the articles that they had performed the full-text review. A calculated quality rating of “good” (yes to ≥10 items), “fair” (yes to 5–9 items), or “poor” (yes to ≤4 items) was assigned to each article. Bias was identified using a modified version of the Research Triangle Institute (RTI) 29-item bank created by RTI International for evaluation of risk bias and precision in observational studies.21 Only questions relevant to RCTs were adopted. Reviewers provided yes/no answers to articles they read for full-text review, and A.M. reviewed all responses to determine the type of bias.
Statistical Analysis
After completion of the full-text review, study results of the included articles were summarized based on age group. Age category was assigned based on the mean age of study population. A meta-analysis of study outcome was also performed. All authors of full-text articles deemed sufficiently uniformed were contacted to obtain de-identified, aggregate data to pool results to determine a summary estimate of the effect of sex on response to lifestyle intervention. For each study, means, standard deviations, and sample sizes by sex for pre (baseline) and post (primary study endpoint) intervention and CGs were provided for each adiposity measure reported by the study authors or calculated from raw data. The effect size estimate for the analysis was based on a standardized mean change for pre and post control group designs as defined in equation 5 in Morris et al.22 calculated for males and females separately. The post endpoints for control and intervention groups were based on the primary timepoint measure for the study ranging from 3 months to 2 years. The standardized mean change as the effect size and sampling variance for the effect size was calculated for each study by adiposity measure for the intervention and CGs. The differences between the standardized mean change were then calculated as intervention – control for female and male subgroups for each study by adiposity measure. An individual study effect estimate that is negative indicates a larger standardized mean change (effect size) for the CG. The overall effect size estimate for each adiposity measure was calculated for the standardized mean difference using a random effects model with the Hedges estimator to account for the additional variance component of the heterogeneous populations of the individual studies. A random effects model was also used to determine an overall effect size estimate for male and female youth separately. The two estimates were compared using a meta-regression model with fixed effects as this accounts for residual heterogeneity within each subset by fitting the two random effects models by sex. The heterogeneity of combined results was calculated using Higgins & Thompson’s I2 statistic, H2 statistics, and τ2. An I2 less than 25% and H2 closer to 1 implied low heterogeneity of studies.23 τ2 is defined as the variance of the true effect sizes underlying the data in a random effects model. Forest plots with point size estimates and 95% confidence intervals for each adiposity measure for males and females reflecting study weight were generated to visually inspect the distribution of each individual study around the overall effect estimate. Publication bias was evaluated through examination of a funnel plot. Funnel plots were constructed by plotting the effect estimates of the individual studies on the x-axis and standard error of the effect measure on the y-axis for each adiposity measure for males and females. Any plot that resembled a funnel was interpreted to imply no serious publication bias. However, if one of the quadrants of the funnel in the lower side was absent or blank then we concluded that there was potential serious publication bias and interpret our findings appropriately. All statistical analyses were conducted using R version 4.1.1 and the R package metafor version 3.0.24
Results
Study Selection
During the search, 1,638 studies were identified, of which 791 were duplicate articles across search strings and electronic databases. Of the 847 unique titles, 89 were included for full-text review. Of these, 37 were included for systematic review/meta-analysis. The reference list of the 37 included articles were searched (n=1,545) which yielded an additional 12 eligible studies, for a total of 49 studies. Figure 1 shows the total number of screened, duplicate, excluded, and included full-text articles.
Figure 1.
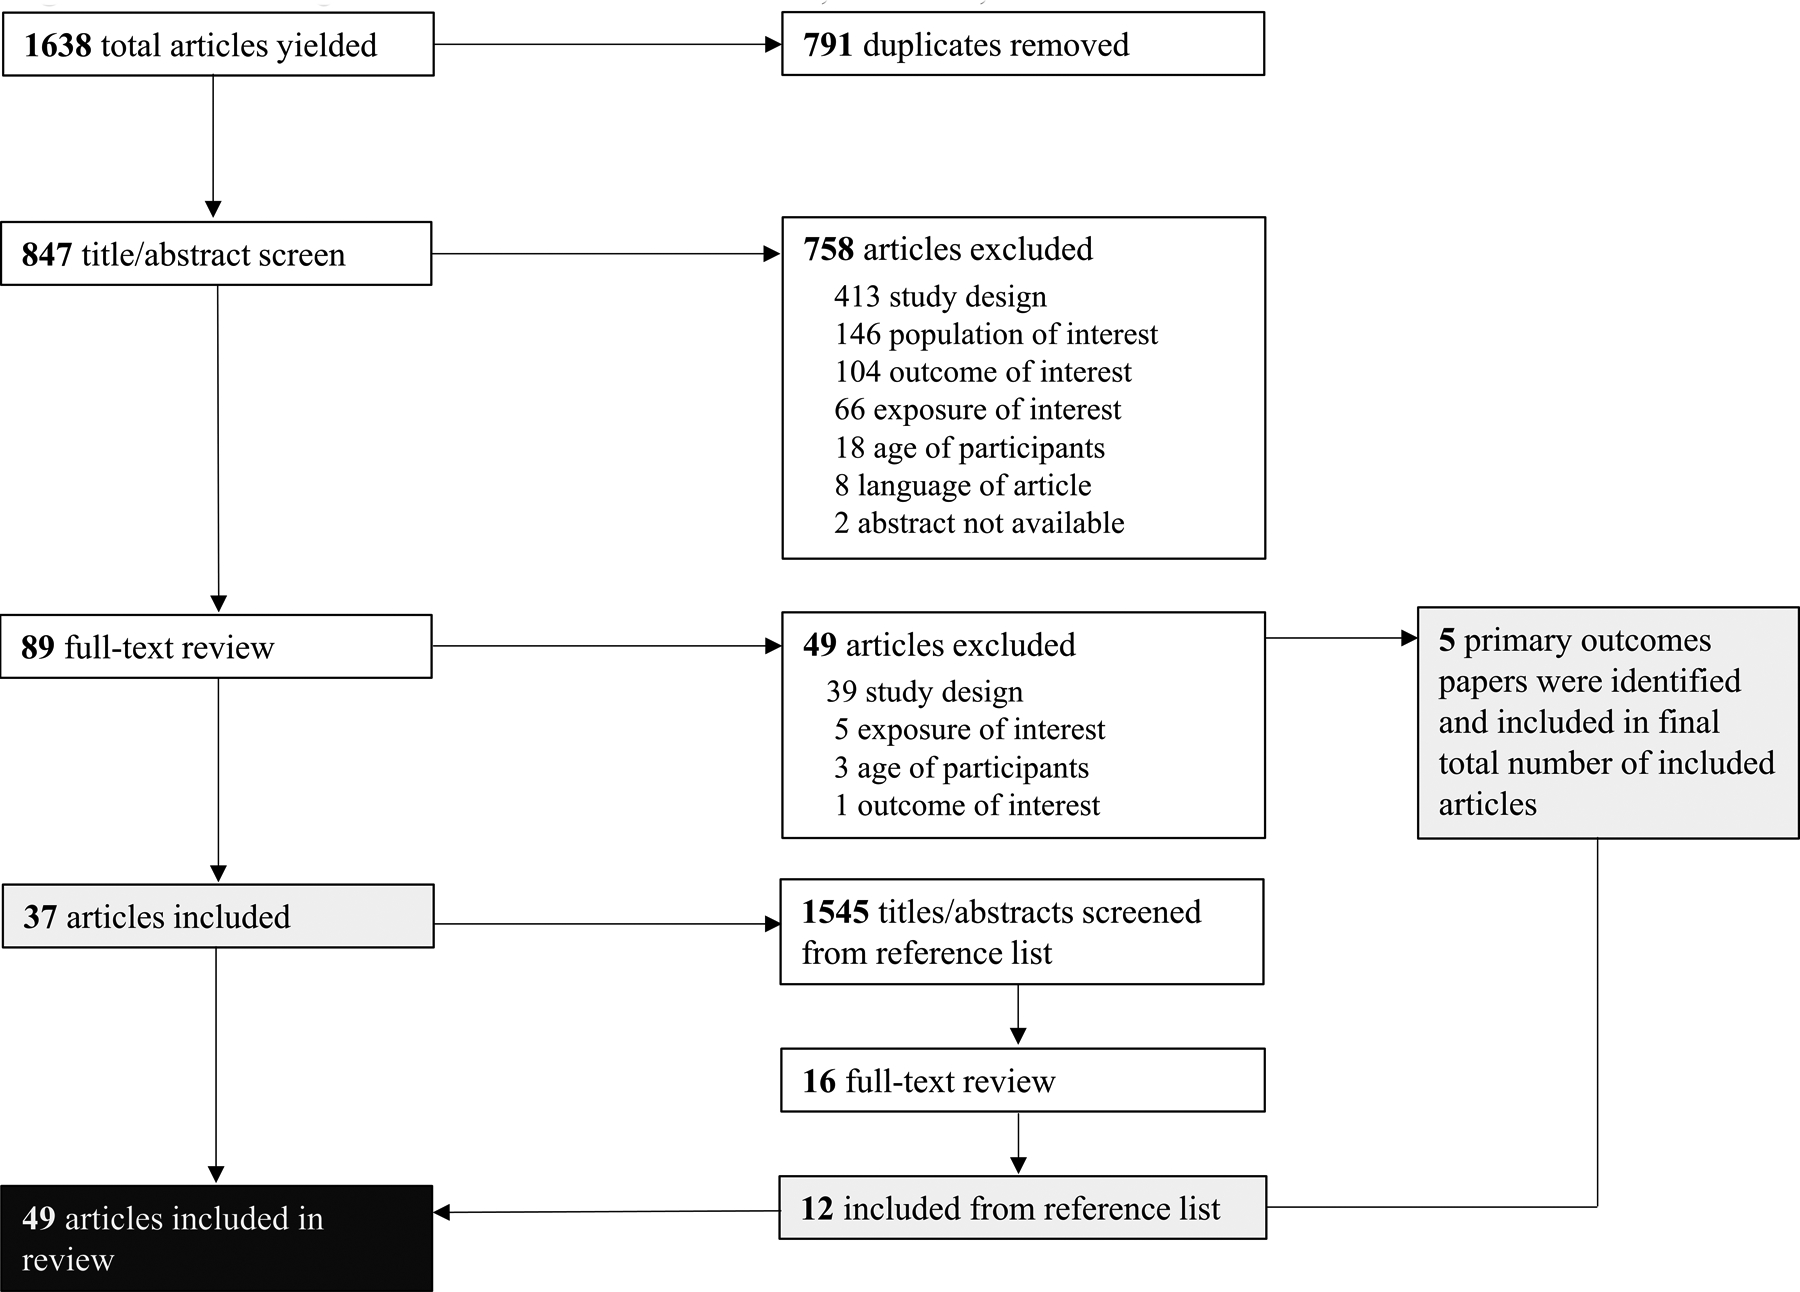
Flow Diagram of Total Articles Screened, Included, and Excluded
Study Characteristics
Table 1 summarizes the main characteristics of the 49 eligible studies. Of these, 14 were conducted in the United States, five each in Australia and China, three in the Netherlands, three in Israel, two each in Germany, Norway, Spain, and the United Kingdom, two in New Zealand, and one each in Belgium, Canada, Finland, Kuwait, Iran, Italy, Malaysia, Mexico, Scotland, and Switzerland. The majority (n=33) of the 49 eligible studies were conducted among children aged 6 to less than 12 years old, with the remaining (n=16) among adolescents aged 12 to less than 18 years old. The number of participants in the included studies ranged from 15 to 360, with a mean sample size of 100 participants. The majority (61%, n=30) of lifestyle interventions were either family-based which, at a minimum, involved at least one parent and the youth participating in the intervention.
Table 1.
Summary of Characteristics of Articles included in the Systematic Review (n=49)
| Source | Objective (s) | Sample Size | Weight Status | Sex (F/M) | Follow-up duration | Subject, age | Study Groups | Adiposity Measure(s) | Study Findings | |
|---|---|---|---|---|---|---|---|---|---|---|
| Intervention(s) | Control | |||||||||
| Abraham 2015 (57) | To assess the feasibility of adding an adapted internet-based curriculum to an existing nutritional program to reduce obesity among adolescents | 48 youth with obesity | BMI > 95th percentile for age | 19/29 | 3- and 6- months | 12–18 years with a mean age of 14.4 years | INT1: Usual care visits at obesity clinic plus internet-based curriculum where participants set monthly diet and PA goals, and received weekly text messages. INT2: Usual care visits at obesity clinic plus four visits with nutritionists over 3 months. |
Usual care visits at obesity clinic that consisted of dietary, PA, and medical history; physical examination, laboratory screening, and obesity counseling with a physician. | % BF, BMI, WC, and HC | No differences between groups for any of the adiposity measures at either 3- or 6-month follow-up. |
| Ahmad 2018 (30) | To evaluate the effectiveness of a FB intervention that combined social media and face-to-face sessions on improvement in adiposity | 134 children with overweight or obesity | BMI z-score > 1.0 SD | 76/58 | 3- and 6- months | 8–11 years old, with a mean age of 9.6±1.2 years | Parental training on children’s nutrition, PA, behavior modification techniques, and parenting skills to improve their children’s health behaviors over 4-months with two weekly Facebook and two half-day face-to-face sessions followed by weekly booster sessions for 12 weeks. | The wait-list control group received small incentives after data collection visits and were offered the intervention after the completion of the final 6-month follow-up. | BMI z-score, WC percentile, and % BF | The intervention led to significant reductions in WC percentile which was maintained at 6-months. However, the between-group difference in BMI z-score was only significant at 6-months. |
| Balagopal 2010 (64) | To examine the effects of PA-based lifestyle intervention on obesity and cardiometabolic outcomes | 15 adolescents with obesity | BMI percentile > 95th percentile for age | 8/7 | 3 months | 14–18 years old, with a mean age of 15.8±0.4 years | 45 min of PA, three times/week with one FB, clinic monitored session per week combined with caloric restriction and healthy nutrition education | Received advice for PA and diet | Weight, BMI, and % BF | The intervention group had a significant reduction in % BF, and maintenance of weight and BMI whereas the control group increased weight and BMI. |
| Benestad 2017 (39) | To assess the effectiveness of a camp-based immersion vs. outpatient family treatment program for obesity prevention | 90 children with obesity | BMI ≥ iso-BMI 30 | 45/45 | 24-months | 7–12 years old, with a mean age of 9.7±1.2 years | 2-week inpatient family summer camp with group and individual sessions focused on behavioral change strategies to make healthier choices. | 4 outpatient days with group and individual sessions on healthy nutrition, PA, parenting skills, and goal setting | Weight, BMI, BMI z-score, WC, % BF, and FM | There were significant between group differences for reduction in BMI, WC, % BF, and FM but not for BMI z-score. |
| Berntsen 2010 (52) | To determine whether the addition of guided active play to a weight management program improved body composition | 60 youth with overweight or obesity | BMI > 97.5th percentile for height* | 31/29 | 5 months | 7–17 years old, with a mean age of 12.1±2.4 years | Received dietary advice by clinical nutritionists at enrollment and participated in biweekly guided group active play sessions for 5 months that included endurance and strength-based activity. Families received a pedometer and an exercise diary book to inspire increased leisure time. |
Received dietary advice by clinical nutritionist and encouraged to increase PA and reduce sedentary lifestyle. Offered active play program after study completion. | BMI, FM, % BF, and LM | The intervention led to a significant 1.8% decrease in % BF but did not lead to improvements in any of the other adiposity measures. |
| Bonham 2017 (65) | To evaluate the effectiveness of a commercially available, structured short-term weight management program to decrease BMI in adolescents | 74 adolescents with obesity | BMI z-score ≥ 1.282* | 55/19 | 3- and 6-months | 13–17 years old, with a mean age of 15.2±1.3 years | JenMe program is a 12-week program developed by dieticians at Jenny Craig that consists of 13 one-on-one sessions that cover dietary and behavioral education, and progress monitoring. | Received the standard healthy eating guidelines for children and were advised to maintain their current lifestyle habits by a consultant. | Weight, BMI z-score | The JenMe program led to a significant decrease in both weight and BMI z-score as compared to the waist-list control (mean diff=−0.23), which contained to decrease in the post-study period. |
| Boodai 2014 (58) | To compare the effectiveness of a good practice intervention vs. primary care referral for treatment of adolescent obesity. | 82 youth with obesity | BMI ≥ 95th percentile | 40/42 | 6 months | 10–14 years old, with a mean age of 12.4±1.2 years. | Intervention consisted of six 1-hour group sessions delivered to adolescents and their parents over a 24-week period that focused on changing behavior targeting factors related to obesity. | Informed that the adolescent had obesity and referred to primary care treatment. | BMI z-score and WC | There was no significant difference in BMI z-score or WC between the groups. Only 23% of the intervention group maintained or lost weight at 6-months compared to 17% of the control group. |
| Boudreau 2013 (72) | To evaluate the effectiveness of a family-centered, primary care– based approach to control childhood obesity through lifestyle choices. | 41 youth with overweight or obesity | BMI ≥ 85th percentile | 16/10 | 6 months | 9–12 years old, with a mean age of 10.3±1.3 years | Intervention included 1.5-hour interactive group classes (1 session/week for 5 weeks with 1 additional session 3 months later) combined with monthly culturally sensitive coaching monthly) to encourage learned lifestyle changes and address barriers for 6 months. | Received intervention 6-month study period | Metabolic markers of obesity and BMI | There was no difference in metabolic markers of obesity or BMI between intervention and waist-list control participants. |
| Brennan 2013 (53) | To test the efficacy of a FB lifestyle program to improve body composition among overweight and obese adolescents. | 63 adolescents with overweight or obesity | BMI adjusted for age and sex ≥ 20.55 kg/m2 according to international cutoffs** | 34/29 | 6 months | 11–19 years old, with a mean age 14.3±1.9 years | Aimed to instigate small maintainable improvements in eating and PA (~60 min/day and <2 hours/day of screen time) habits following Australian national recommendations. Cognitive behavioral principles were used to assist to help families manage barriers to change. | Offered intervention program after 6-month study period | BMI, BMI percentile, BMI-z score, WC, % BF, FM, and LM | The intervention led to significant reductions in weight, BMI, BMI z-score, BMI percentile, fat mass. However, the control group had a significant increase in lean mass compared to the intervention group. |
| Chan 2018 (63) | To evaluate the efficacy of a lifestyle modification program at reversing and reducing NAFLD in obese adolescents. | 52 adolescents with obesity | BMI ≥ 95th percentile | 19/33 | 4- and 17-months | 14–18 years old, with a mean age of 14.8±4.4 | Counseling sessions were provided weekly for 4 months and then bi-monthly for 52 weeks. The lifestyle modification program aimed to improve knowledge, attitudes, and practices regarding diet and exercise based on motivational interviewing and behavioral modification. | Received diet and exercise advice during routine consultations at the Obesity Clinic every 4 months by attending physicians. | Weight, BMI, BMI z-score, WC, % BF | The intervention led to significant between-group changes in weight, BMI, BMI z-score, WC, and % BF. Only % BF was significantly different than control group at 68-week follow-up. |
| Cohen 2016 (31) | To test a family-centered lifestyle intervention using Canada’s Food and PA Guidelines to reduce BMI z-score in children with overweight and obesity. | 78 children with overweight or obesity | BMI for-age > 1 SD for overweight and BMI for-age >2 SD for obesity | 39/39 | 12 months | 6–8.5 years old, with a mean age 7.8±0.8 years | Both groups received six intervention sessions that covered healthy diet and PA.
|
Control group participants were provided the Canada’s Food and PA Guidelines. | BMI z-score, WC, % BF, FM, and LM | Both intervention groups had a significant reduction in BMI z-score at 6- and 12-months. ModTx had significant reductions in BMI z-score, % BF, and fat mass at 6- and 12-months as compared to control. |
| Croker 2012 (68) | To examine the impact of FB behavioral treatment program on improvement in adiposity among children with obesity compared with a waiting-list control group. | 72 children with overweight or obesity | BMI adjusted for age and sex between 18.35 and 27.24 kg/m2 according to international cutoffs** | 50/22 | 1 year | 8–12 years old, with a mean age of 10.3±1.6 years | Children and their parents attended 15, one-hour sessions over 6 months (10 weekly, 3 biweekly, 2 monthly) that included behavior modification techniques to improve diet and PA. | Offered the intervention program after the 6-month study period | BMI, BMI z-score, weight, weight SDSs, waist, waist SDSs, FM index, FFM index |
There were no significant between-group differences for any of the anthropometrics or body composition measures. |
| Diaz 2010 (67) | To compare a lifestyle intervention to a brief primary care physician intervention for treating pediatric obesity in the primary care setting. | 76 youth with obesity | BMI > 95th percentile | 55/21 | 12 months | 9–17 years old, with a mean age of 11.7±2.2 | Twelve consecutive, weekly 2-hour group sessions led by an RD that encouraged goal setting for PA and sedentary levels and focused on the Traffic Light approach to improve dietary habits. | Received monthly consultations with primary care physician that monitored BMI and encouraged healthy lifestyle behaviors. | Weight, BMI z-score, BMI, WC, % BF | The lifestyle group participants had non-significant decreases in weight and BMI whereas the control group had a non-significant increase in both measures leading to significant between-group differences. |
| Farpour-Lambert 2019 (38) | To compare the effectiveness of 6-month lifestyle interventions with standard care on BMI z-score and CVD risk factors. | 74 children with obesity | BMI adjusted for age and sex > 97th percentile | 36/38 | 6 months | 7.5–11.9 years old, with a mean age of 9.6±1.1 years | Individual delivery: Seven monthly behavioral change sessions (3 hrs w/ pediatrician and 4 hrs w/dietician) and two 1-hr PA sessions/week. Group delivery: Fourteen 90-min parent-only and 60-min child-only (11 weekly then 3 monthly meetings over 6 months) behavioral change sessions and two 1-hr PA sessions/week. |
Standard of care for 12 months that included four 45-min consultations (every 3 months) and instructed to maintain current PA level. | BMI, BMI z-score, WC, total fat, abdominal fat, and FFM | Both individual and group delivery resulted in significant reductions in abdominal fat at 6 months. Group delivery also led to significant decreases in BMI and BMI z-score, which continued to improve at 12 months. There were significant reductions in weight, BMI, BMI z-score, and WC at 12 months for the group vs. individual delivery intervention. |
| Gerards 2015 (44) | To assess the effectiveness of a parent-only lifestyle intervention for the prevention of excessive weight gain in children with overweight and obesity | 86 children with overweight or obesity | BMI adjusted for age and sex between 17.28 and 21.6 kg/m2 according to international cutoffs** | 48/44 | 1 year | 4–8 years old, with a mean age of 7.2±1.4 years | 14-weeks comprised of ten 90-min parental group sessions and four individual 15–30-min phone sessions. The intervention consisted of active skills training methods based on self-regulation principles focused on nutritional, PA, and positive parenting strategies. | Received two brochures (one on healthy nutrition and PA and the other on positive parenting) and an internet-based knowledge quiz that tailored advice for home exercises. | BMI z-score, WC, biceps and triceps skinfolds | There were no significant reductions in children’s BMI z-score, WC, or skinfold thickness at 4 or 12 months. There were positive intervention effects of parenting behaviors, child nutrition, and active play. |
| Gillis 2007 (74) | To determine whether reinforcement of nutrition and exercise modification improves child anthropometrics. | 27 youth with obesity | BMI > 90th percentile | NA | 6 months | 7–16 years old, with a mean age of 10.6±2.3 years | 30-min lifestyle education session pre- and post- intervention period, food record one day per week, and weekly phone calls for 3 months | Received basic discussion on healthy diet and exercise. | BMI | The intervention group had a non-significant decrease in BMI whereas the control group had a non-significant increase; however, there were no between-group differences. |
| Golley 2007 (26) | To evaluate the effectiveness of a parenting-skills training for the treatment of overweight in children. | 111 children with overweight | BMI adjusted for age and sex between 17.34 and 19.10 kg/m2 according to international cutoffs** | 71/40 | 6- and 12-months | 6–9 years old, with a mean age 8.2±1.1 years. | Parenting-skills training alone (P) consisted of 4 weekly 2-hr group sessions, then 3 monthly 15 to 20-min individual phone sessions focused on parent competence to manage child’s behavior. Parenting-skills training plus intensive lifestyle education (P+DA) completed parent-only training program plus 7 intensive lifestyle support group sessions. |
Received general healthy lifestyle pamphlet and 4 phone calls over 5 months for retention. | BMI and WC z-score | There was a non-significant reduction in BMI z-score for all groups. Both the P and P+DA groups had a significant decrease in WC z-score at 12-months. Boys in both intervention group had significantly lower BMI and WC z-scores at 6 and 12 months compared with baseline, whereas girls in the WLC group had a significant reduction in BMI z-score. |
| Hofsteenge 2014 (59) | To determine the effects of a multidisciplinary group treatment on anthropometrics and body composition among adolescents with obesity. | 122 adolescents with obesity | BMI adjusted for age and sex ≥ 20.55 kg/m2 according to international cutoffs** | 68/54 | 6- and 18- months | 11–18 years old, with a mean age 14.5±1.8 years | Received 7 sessions (90 mins) every ~3 weeks consisting of healthy diet, sedentary and PA education. Parents also received 2 parallel sessions. Four booster group sessions were scheduled 6, 14, 26, and 36 weeks after the 3-months intervention period. | Received referral to a dietician in the home care setting, which is considered standard of care in the Netherlands | Weight, BMI, BMI z-score, WC, trunk fat, total fat mass | The intervention group had significant reductions in BMI z-score at 18 months, but not at 6 months, when compared to control group. |
| Hughes 2008 (71) | To determine whether a best-practice individualized behavioral intervention reduced BMI z-score relative to standard dietetic care. | 134 youth with obesity | BMI ≥ 98th percentile relative to the UK 1990 reference data* | 75/59 | 1 year | 5–11 years old, with a mean age 8.8±1.8 years | Eight, one-on-one appointments with pediatric RD trained in behavior change counseling over 26 weeks. Sessions used family-centered counseling and behavioral strategies to modify diet, PA, and sedentary behavior. | Received ~4 outpatient appointments with a pediatric RD over 6–10 months, which is standard care in Scotland. | BMI z-score, weight, fat distribution | There were no significant differences in between-group changes in BMI z-or WC score, or weight at 6- or 12-months. BMI z-score significantly decreased, and weight significantly increased in both groups. |
| Janicke 2008 (46) | To investigate the effectiveness of PO vs. FB interventions for pediatric weight management in underserved rural settings. | 93 youth with overweight or obesity | BMI adjusted for age and sex ≥ 85th percentile | Girls: 57% (n=53) Boys: 43% (n=40) |
4- and 10-months | 8–14 years old, with a mean age of 11.1 years. | Interventions were either FB or PO and consisted of weekly 90-min group sessions for 8 weeks, then biweekly for the next 8 weeks. Sessions addressed diet modification, food monitoring, setting dietary goals, and increasing PA. | Offered the weight management intervention after study completion. | Weight, BMI z-score | There were significant reductions in children’s BMI z-scores between PO vs. WLC groups at 4- months. Further, there were significant reductions in BMI z-scores at 10 months in both PO and FB compared to WLC. |
| Jiang 2005 (55) | To determine the feasibility and effectiveness of a FB behavioral approach for treatment of children with obesity in China. | 68 children with obesity | Weight-for-height ≥ 120% of the Chinese reference | 27/41 | 2 years | Children in grades 7–9, with a mean age 13.3±0.7 | Monthly home visits by study pediatrician for behavioral goal setting and obtainment combined with dietary modification using the Traffic Light approach and increase in PA to 20–30 mins per day for four days per week. | No information or intervention | Weight, BMI z-score | The intervention resulted in significant reduction in BMI z-score over the 24-month period. Despite similar linear growth, the control group gained 5.5 kg whereas intervention group lost 0.3 kg in weight. |
| Johnson 1997 (40) | To investigate the influence of nutrition and exercise interventions on weight loss. | 32 children with obesity | Weight at least 20% above ideal for age and sex | 23/9 | 4 months, and 5-years | 8–17 years old, with a mean age of 11±2.3 years | Promoted the stoplight diet and included a gradual increase of aerobic exercise to 45 mins 5–7 days/week. NE group received nutrition intervention for 7 weeks followed by an exercise intervention for 7 weeks. EN group received the opposite sequence. | Control group attended weekly informational sessions on diet and exercise | Weight, skinfold thickness, % BF | Both the NE and EN interventions resulted in significant reductions in weight, BMI, and % BF. which was maintained at 5-year follow-up. There were no differences in adiposity changes between NE vs. EN groups. |
| Johnston 2007 (60) | To evaluate an intensive intervention for weight loss among Mexican American middle school children who are overweight. | 60 children with overweight or obesity | BMI adjusted for age and sex ≥ 85th percentile | 27/33 | 3- and 6- months | 10–14 years old, with a mean age 12.4±0.7 | Twelve-week trainer-led intervention that included nutrition education (1 day/wk) and PA (4 days/wk) followed by 12 weeks of bi-weekly sessions. Parents attend one nutrition and four outdoor PA lessons | Received a 1-week parent-guided manual to increase healthy eating and increasing PA. | BMI, BMI z-score, % BF | Children in the intervention had significant reductions in BMI z-score at both 3 and 6 months when compared to control children. |
| Kalarchian 2009 (41) | To evaluate the efficacy of FB, behavioral program for the management of severe pediatric obesity. | 192 youth with obesity | BMI adjusted for age and sex ≥ 97th percentile | 109/83 | 6-, 12-, and 18-months | 8–12 years old, with a mean age 10.2±1.2 of years | Twenty, 60-min child- and parent-only group meetings for 6 months which followed the Stoplight Eating Plan, recommended daily energy intake based on body weight, and encouraged more PA. Three group sessions and 3 telephone calls were provided between 6–12 months. | Offered two nutrition consultations sessions to develop individual nutrition plan using the Stoplight Eating Plan. | Proportion overweight, % BF, FM, FFM, WC | The intervention led to significant decreases in weight, BMI, % overweight, WC, % BF, and total fat mass at 6 months only. There were no significant long-term (12- and 18-months) differences between intervention and control. |
| Kalavainen 2007 (47) | To compare the efficacy of group treatment focused on promoting a healthy lifestyle with routine counseling for the treatment of childhood obesity. | 70 children with obesity | Weight-for-height between 115–182% above ideal | 42/28 | 6- and 12- months | 7–9 years old, with a mean age of 8.1±0.8 years | Fifteen (weekly for first 10 weeks, biweekly for the last 5 weeks) parent- and child-only 90-min sessions that included non-competitive PA and nutrition education, with one joint session about healthy snacks. | Received booklets about weight management, eating habits, and PA; and attended two 30-min counseling sessions with school nurse. | Weight, BMI, BMI z-score | Intervention children lost significant more weight-for-height and had greater reductions in BMI and BMI z-score than the control children at 6- and 12- months, with girls having greater reductions than boys |
| Kelishadi 2009 (37) | To determine the long-term effects of a dairy-rich diet on generalized and abdominal obesity among prepubescent children with obesity. | 120 children with obesity | BMI adjusted for age and sex ≥ 95th percentile | Not specified | 36 months | 5–6 years old, with a mean age 5.6±0.5 years | All 3 groups attended 6 consecutive monthly family-centered education sessions about healthy nutrition and PA conducted by pediatrician and nutritionist. | BMI z-score, WC, and % BF | BMI z-score, WC, and % BF decreased significantly after the 6-month trial for all groups with WC and % BF remaining lower than baseline values for the DR group at 12 months. | |
| DR group was placed on an isocaloric dairy-rich diet (>800 mg ca/d). ER group was placed on a caloric restricted regimen. |
The control (C) group did not receive any additional recommendation. | |||||||||
| Lee 2014 (29) | To evaluate the effectiveness of a multi-component school-based weight management program for children with overweight or obesity. | 106 youth with overweight or obesity | BMI adjusted for age and sex between 18.35 and 26.67 kg/m2 according to international cutoffs** | 31/75 | 4- and 8- months | 8–12 years old, with a mean age of 10.4±0.8 years | Attended 75-min after-school sessions and one 3-hour weekend session covering healthy eating, exercise and meal planning with parents for 4 months. Parents received an introductory seminar and two, 1-hour sessions on healthy eating and exercise strategies. | Wait-list control group was offered the intervention after study completion | BMI z-score and % BF | The intervention group significantly reduced BMI z-score and % BF as compared to the control group, which was maintained at 8-month follow-up. |
| Mameli 2018 (61) | To test whether a personalized lifestyle program was superior to a standard lifestyle change program at promoting weight loss in children with obesity. | 43 youth with obesity | BMI ≥ 95th percentile for age and sex | 30/19 | 3 months | 10–17 years old, with a mean age of 12.5±2.0 | All participants were encouraged to practice 1 hr/day of moderate to vigorous PA, to minimize sedentary time by reducing screen time (<2 hr/day), and to follow the Mediterranean diet during the 3-month study. | Weight, BMI z-score | A personalized lifestyle program did not result in a significantly greater improvement in weight or BMI z-score. Both groups had a modest increase in weight and a slight decrease in BMI z-score. | |
| Participants were equipped with a wristband accelerometer that calculated energy expenditure and smartphone application to measure energy intake with weekly diet and PA feedback delivered via text message. | Received only dietary and PA instruction. | |||||||||
| McCallum 2007 (69) | To evaluate the effect of a physician-delivered, solution focused intervention on improvement in BMI among children with overweight or obesity. | 163 children with overweight or obesity | BMI age- and sex-adjusted z-score >1.0 but less than 3.0 | 84/79 | 9- and 15-months | 5–9 years old, with a mean age of 7.4±1.6 years. | Intervention included four standard GP consultations over 12 weeks that targeted change in nutrition, PA, and sedentary guided by a personalized family plan. | Received no contact with GP or research team. | BMI and BMI z-score | The brief, FB intervention did not result in BMI improvements at 9- or 15-month follow-up but result in sustained improvement in child nutrition score. |
| Moens 2012 (43) | To evaluate the effect of a parent-led intervention for improvement in weight evolution among children that were overweight. | 50 families with children with overweight | Adjusted BMI for age and sex >120% | 17/33 | 6- and 12-months | 6–12 years old, with a mean age of 9.2±1.4 | Six, 2-hour parent-only group meetings that promoted health lifestyles as an effective approach to prevent further weight gain by RDs and psychologists. | The wait list control group was provided the intervention following the study period. | BMI | The intervention led to a significant decrease in BMI; however, there were no significant between-group differences in BMI. |
| Morell-Azanza 2019 (32) | To evaluate the effects of a FB lifestyle intervention on anthropometric indices in children with abdominal obesity. | 106 youth with obesity | Waist circumference > 90th percentile | 66/40 | 2 years | 7–16 years old, with a mean age of 11.3±2.5 years. | Individual (six sessions with a RD) and group (one PO, and one parent/child) sessions delivered by a multidisciplinary team over 8 weeks and encouragement to follow a moderate hypocaloric Mediterranean diet | Received standard pediatric recommendations on healthy diet and one 30-min RD counseling session and five monitoring visits to obtain anthropometrics. | BMI z-score, WC, HC | The intervention group had a significantly greater reduction in BMI z-score and hip circumference, both groups had a significant reduction in waist circumference. |
| Nemet 2005 (42) | To examine the short- and long-term effects of a 3-month, combined dietary-behavioral-PA intervention on anthropometric measures and body composition among children with obesity. | 46 youth with obesity | BMI ≥ 95th percentile for age and gender | 20/26 | 3- and 12- months | 6–16 years old, with a mean age 11.1±2.4 | Four evening lectures on childhood obesity, general nutrition, a therapeutic nutritional approach for childhood obesity, and PA; six RD counseling sessions; and twice weekly 1-hour PA sessions. Participants were instructed to obtain 30–45 min/wk of additional PA and followed a hypocaloric diet. | Referred to one ambulatory nutritional consultation and instructed to perform PA 3 times per week independently. | BMI-for-age percentile, BMI z-score, % BF, triceps and subscapular skinfolds | The intervention group had significant decreases in weight, BMI, and % BF with continued decreases in BMI and % BF among the intervention group at 12 months. Whereas control subjects had significant increase in weight and % BF after the 3-month study period. |
| O’Connor 2013 (70) | To test the feasibility of a primary care delivered intervention targeted ethnic minority children and their parents for obesity prevention. | 40 children with overweight or obesity | BMI between 85th and 99th percentile | 32/8 | 6 months | 5–8 years old, with a mean age of 6.8±1.1 years | Monthly sessions with trained health advisors for behavior modification goal setting. Sessions focused on national recommendations for age-appropriate dietary intake, PA and TV viewing, parenting practices, and use of the Helping HAND program. | Advised to regularly schedule doctor’s visits and asked to avoid participation in other obesity prevention programs. | BMI, BMI z-score | There were no differences in BMI-z between groups. However, the intervention group had a non-significant improvement in sedentary time and TV viewing. |
| Reinehr 2010 (51) | To evaluate the effectiveness of lifestyle intervention among children with obesity. | 60 youth with obesity | BMI between 90th and 97th percentile* | 38/28 | 6 months | 8–16 years old, with a mean age of 11.5±1.6 years | Two 3-month phases:
|
Waitlist control was offered the intervention after the 6-month study period. | BMI, BMI z-score, WC, FM, LM, % BF, triceps and subscapularis skinfold thickness, and degree of overweight | The intervention group had a significant decrease in BMI, BMI-z-score, WC, % BF, and FM as compared to the control group. There was not a significant sex difference in reduction in BMI z-score among the intervention group. |
| Rodearmel 2007 (73) | To evaluate the effect of small change strategy recommended by America on the Move at preventing excessive weight gain in families with overweight children. | 218 youth with overweight or at risk for overweight | BMI ≥ 85th percentile | 114/104 | 3- and 6- months | 7–14 years old, with a mean age of 11.2± 2.2 years | FB intervention that encouraged a 2000 step increase in average baseline daily steps and a 100 kcal/day reduction in usual diet. Families also received nutrition and PA education and behavioral therapy sessions (15 sessions). | Monitored daily steps and completed pre- and post- sweets survey. Received no nutrition or PA educational materials but completed intervention after study period. | BMI z-scores, BMI%ile, WC, % BF | Both groups had a significant increase in weight but a significant decrease in BMI z-score, with no statistically significant differences between groups. |
| Sacher 2010 (33) | To evaluate the effectiveness of a multicomponent community-based childhood obesity intervention program. | 116 youth with obesity | BMI ≥ 98th percentile relative to the UK 1990 reference data* | 63/53 | 6- and 12- months | 8–12 years old, with a mean age of 10.3±1.3 years | The program included 8 behavior change, 8 nutrition education sessions, 16 one-hour PA (two/week), and one closing session delivered over 9 weeks followed by 12-weeks of free community pool access. A “nondieting” philosophy was advocated throughout the intervention | Waitlist control group received the program after the study period. | WC z-score, BMI z-score, FM, FFM, % BF | Children in the intervention had a significantly greater reduction in BMI z-score, WC, and FM when compared to the control group at 6- and 12- months. |
| Sauder 2018 (34) | To assess a culturally sensitive behavioral intervention adapted from the DPP for American Indian youth for obesity prevention | 62 children with overweight or obesity | BMI ≥ 85th percentile for age and gender | 32/30 | 8 months | 7–10 years old, with a mean age of 9.2±1.1 years | Participants attended 10, 2-hour group classes that included PA, cooking demonstrations, culture crafts, and a group meal. Program goals used the 5–2-1–0 messaging and dietary goals used the Traffic Light Diet. Five counseling sessions to assist with goal setting. | Control participants attended 3 general health and safety group sessions. Sessions also included a healthy group meal. | BMI, BMI z-score, and WC | There was a significant increase in BMI and WC for the control group but not the intervention group. BMI z-score significantly decreased among the intervention group, but significantly increased for the control group. |
| Savoye 2014 (54) | To examine the effects of FB, intensive lifestyle intervention on anthropometrics among youth with obesity and prediabetes. | 75 adolescents with obesity | BMI ≥ 95th percentile for age and gender | 49/26 | 6 months | 10–16 years old, with a mean age of 13.0±1.9 years | Program consisted of two 50-min PA sessions per week, one weekly weigh-in, and a 40-min nutrition/behavior modification class. Participants were encouraged to exercise 3 additional times per week. | Received diet and exercise instruction from clinic RD and followed every 2–3 months by clinician. | Weight, BMI, BMI z-score, % BF, FM | The Bright Bodies program led to significant reductions in BMI z-score, FM, and % BF compared to standard care controls. |
| Savoye 2007 (62) | To compare effects of a weight management program on adiposity of children who are overweight compared to a control group | 135 youth with overweight | BMI ≥ 95th percentile for age and gender | 69/49 | 6- and 12-months | 8–16 years old, with a mean age 12.1±2.3 years | Program consisted of two 50-min PA sessions per week, one weekly weigh-in, and a 40-min nutrition/behavior modification class. Participants were encouraged to exercise 3 additional times per week. | Received diet, exercise, and psychosocial counseling in the obesity clinic every 6 months. | BMI, % BF, FM, weight | The Bright Bodies weight management program led to significantly greater decreases in BMI, weight, FM, and % BF at 6- and 12- months compared to control group. |
| Serra-Paya 2015 (50) | To evaluate the effectiveness of a FB multi-component behavioral intervention on improving anthropometric parameters | 113 children with overweight or obesity | BMI adjusted for age and sex between 17.34 and 26.67 kg/m2 according to international cutoffs** | 60/53 | 8 months | 6–12 years old, with a mean age 9.9±2.0 years | Completed three 1-hour PA sessions/week, 60-min parent- and child-only counseling sessions/week, and three parent and child behavior strategy sessions/week plus 3 weekend fun PA days. | Received 10-min structured family meetings with pediatrician on healthy eating and PA once per month. | Weight, BMI, BMI z-score, WC, WhtR | There were no significant differences in anthropometric parameters between the two groups. |
| Soltero 2018 (13) | To examine the short- and long-term effects of a culturally- and community-based lifestyle intervention among Latino youth with obesity. | 136 adolescents with obesity | BMI ≥ 95th percentile for age and gender or BM ≥ 30 kg/m2 | 74/62 | 3-, 6-, and 12- months | 14–16 years old, with a mean age of 15.4±0.8 years | Youth and their families participated in weekly nutrition and health classes (1 day/week for 60-min) and exercise sessions (3 days/week for 60-min) for 3 months, followed by monthly booster sessions for 3 months | Youth received laboratory results and general health information from a pediatric endocrinologist and RD twice during the study. | BMI, BMI %ile, WC, % % BF, and FFM | The intervention youth significantly reduced weight, BMI %ile, BMI, WC, and % BF compared to control youth. Between group differences for BMI %ile and % BF remained significant at 12 months. |
| Taylor 2015 (35) | To determine whether a FB intervention using frequent contact and limited expert involvement was effective in reducing excessive weight compared with usual care. | 206 children with overweight or obesity | BMI ≥ 95th percentile for age and gender | 114/92 | 12- and 24-months | 4–8 years old, with a mean age of age 6.5±1.4 years | Families attended a single multidisciplinary session (1–2 hours) to develop specific family goals, then had either 10-min phone or 45-min in-person monthly mentor meetings for 12 months, then every third month for another 12 months. | Families had one 45 -min appointment to receive personalized feedback and general healthy lifestyle advice at baseline and 6 months. | Weight, BMI, BMI z-score, WC, WHtR, % BF | Children in the intervention had a significantly lower BMI, BMI z-score, WC, and WHtR at 24-months compared to control children. |
| Vos 2011 (56) | To evaluate short- and long-term effects of a FB multi-disciplinary cognitive behavioral lifestyle intervention on markers of adiposity compared with standard care in children with obesity. | 79 youth with obesity | BMI adjusted for age and sex between 21.57 and 29.69 kg/m2 according to international cutoffs** | 42/37 | 3-, 12-, and 24-months | 8–17 years old, with a mean age 13.3±2.0 years | 2.5 hour group treatment sessions for children alone (7 sessions), parents alone (5 sessions), and one parent and child session. Two to three refresher sessions offered per year. Sessions focused on healthy diet using the traffic life approach, increase PA to optimal amount, and motivational interviewing for behavior change strategies. | Control group received standard advice on PA and nutrition at the start of the study and offered the intervention after the 1-year study period. | BMI and WC z-score, WHtR | Youth in the intervention had a 10% decrease in BMI z-score and 19% decrease in WC z-score at 12 months compared to baseline measures which was maintained at 2-year follow-up. |
| Wake 2009 (45) | To determine the effectiveness of physician delivered, solution focused intervention to reduce BMI gain among children with overweight or obesity using | 258 children with overweight or obesity | BMI adjusted for age and sex between 17.15 and 24.11 kg/m2 according to international cutoffs** | 156/102 | 6- and 12-months | 5–10 years old, with a mean age 7.5±1.4 years | Four standard consultations over 12 weeks targeting change in nutrition, PA, and sedentary behavior, supported by family materials. Same components as LEAP 1 trial design (McCallum et al.) | Received no contact with GP or research team. | BMI, BMI z-score, WC | The intervention youth had a non-significant decrease in BMI at 6- and 12-months when compared to control youth. There were no between-group differences in BMI z-score or WC. |
| Wang 2008 (66) | To investigate the short-term effect of a lifestyle intervention on BMI z-score compared to a control group among children with obesity and NAFLD. | 57 youth with obesity | BMI ≥ 95th percentile for age and gender | 18/39 | 1 month | 10–17 years old, with a mean age of 13.7±2.2 years | Youth participated in daily PA (e.g., swimming, basketball, table tennis) for three hours at a summer camp. Prescribed a low-calorie diet that consisted of 50% carbohydrates and 10% fat with the goal to achieve a reduction of 250 kcal/day. | Received no lifestyle intervention | BMI z-score | The lifestyle intervention led to a significant decrease in BMI and BMI z-score whereas the control group had no change in these indices. However, there were no between-group differences. |
| Weigel 2008 (48) | To evaluate the impact of an outpatient program on BMI z-score among children and adolescents with obesity. | 73 youth with obesity | BMI ≥ 97th percentile for age and gender* | 40/33 | 6- and 12- months | 7–15 years old, with a mean age of 11.2 years | Received 45 to 60-min sessions twice per week that covered PA, nutritional education, and coping strategies. Parents attended monthly meetings and medical supervision including laboratory tests at 0,6, and 12 months. | Received written therapeutic advice from a physician during outpatient visits at baseline and 6 months and were given medical supervision and laboratory tests at 0, 6, 12 months. | BMI, BMI z-score, FM, LM | The intervention group had a significant reduction in BMI and BMI z-score at 12-months but not 6-months. There was a significant between group difference in BMI, BMI z-score, FM, and LM at 6- and 12- months |
| Wilfley 2017 (36) | To evaluate the effects of two doses (high vs. low) of FB weight-control intervention vs control education on child anthropometrics. | 172 children with overweight or obesity | BMI ≥ 85th percentile for age and gender | 106/94 | 4-, 8-, and 12-months | 7–11 years old, with a mean age of 9.4±1.3 years | FB eating and PA changes, skills to manage peer interactions, and building a supportive family and peer environment delivered in 30-min family sessions and 45-min separate child and parent group sessions. LOW intervention group received the intervention biweekly whereas HIGH intervention group received the intervention weekly. | Control group received novel information on nutrition and exercise and participated in hands-on activities as families. | Percentage of overweight, BMI, BMI z-score | The HIGH intervention led to significant decrease of 3.37 and 6.71 in percentage of overweight when compared to the LOW intervention and control groups. Similarly, the HIGH intervention group had a significant change in BMI Z-score (−0.14) when compared to the control group. |
| Wylie-Rosett 2018 (25) | To evaluate the efficacy of a bilingual, physician delivered weight management program to standard care approach with the addition of an enhanced program in a safety-net pediatric primary care setting. | 360 children with overweight or obesity | BMI ≥ 85th percentile for age and gender | 185/175 | 3-, 6-, 9-, and 12 months | 7–12 years old, with a mean age of 9.3±1.7 years. | The Standard Care + Enhanced Program was enriched with eight skill-building core (four in-person group sessions, and four parent/guardian phone consultation) and monthly post-core sessions that focus on dietary modification and increased PA. | One initial, structured 40-min followed by brief (~15-min) quarterly semi-structured pediatrician visits to assess weight-related issues and target FB behavioral changes. | BMI z-score, WC, HC | Both the intervention and standard care group participants had a decrease in BMI z-score during the 12-month study period. There were no group differences; however, older children and female youth exhibited greater decreases compared to younger children and male youth. |
| Yackobovitch-Gavan 2018 (49) | To assess effects of FB interventions targeted parents only or to parents and child for the prevention of childhood obesity | 168 children with obesity | BMI between 85th and 98th percentile for age and gender | 111/57 | 3-, 12-, and 24-months | 5–11 years, with a mean age of 8.3±1.4 years | Consisted of 12 weekly sessions with a dietician and psychologist that targeted behavioral changes in nutrition or lifestyle. In the parents-only group, at least one parent attended the meetings, and in the parents–child group, at least one parent and child attended separate group meetings. | Did not participate in group meetings. Received clinical follow-up only. | BMI z-score | Both the parent-only and parent+child intervention groups had a significant decrease in BMI z-score at 3 months whereas only the parent+child group had a significant decrease at 24 months. There were no significant between-group differences. |
Abbreviations: % BF= percent body fat; BMI=body mass index; BMI %ile= body mass index percentile; BMI z-score; body mass index standard deviation score; DR=dairy-rich; EN=exercise before nutrition group; ER=energy-restricted; FB=family-based; FFM=fat-free mass (kg); FM=fat mass (kg); GP=general practitioner; HC=hip circumference; hrs=hours; INT1=intervention one; INT2=intervention two; JenMe=Jenny Craig’s adolescent weight management program; LM=lean mass (kg); min=minute; ModTx=modified treatment intervention; NAFLD=non-alcoholic fatty liver disease; NE=nutrition before exercise group; PA=physical activity; P=parent-skills training alone; P+DA=parenting-skills training plus intensive lifestyle education; PO=parent-only; RD=registered dietitian; StnTx=standard treatment intervention; WC=waist circumference; WhtR=waist-to-hip ratio; wk=week.
Definitions of overweight and obesity were county specific and differed from U.S. definitions. Norwegian definition for obesity was BMI>97.5th percentile for height. Germany definition for overweight was BMI >90th percentile but <97th percentile, which would be considered obese by U.S. standards. Australia definition for obesity was a BMI z-score ≥ 1.282 with no comorbidities or BMI percentile > 90th.
International cutoffs for BMI were based on the publication by Cole TJ et al, BMJ, 2000;320(7244):1240. The BMI range provided is for the study-specific age-range.
Terminology: Youth referred to studies that included children and adolescents aged greater than 6 but less than 18 years old; Child referred to studies that included children aged greater than 6 but less than 12 years old; Adolescents referred to studies that included adolescents aged greater than 12 but less than 18 years old.
Intervention Effect on Adiposity
Of 49 included articles 33 (65%) reported statistically significant intervention effects on at least one measure of adiposity. Among these studies, BMI-z was the most frequently reported adiposity measure showing significant reductions (n=25, 75%), followed by BMI (n=14, 42%), % BF (n=13, 39%), waist circumference (WC; n=9, 27%), weight (n=9, 27%), and fat mass (FM; n=7, 21%).
Sex Differences in Response to Intervention
Only two studies (4%) evaluated sex differences in response to lifestyle intervention.25,26 One of these studies found significantly greater reductions in BMI-z among adolescent females compared to males.25 In contrast, the other study demonstrated a significant within-group intervention effect for BMI, BMI-z, and WC-z among adolescent males but not in females; however, between-group differences were not analyzed.26 In both intervention groups, male but not female youth had significant reductions in BMI-z and WC-z at 6 and 12 months.26
Summary of existing literature
The main findings from the 49 included studies are summarized below and in Table 1. The proceeding summary is grouped by age (i.e., children aged 6 to <12 years old and adolescents aged 12 to < 18 years). These age groups were used in order to account for the pre- and post-pubertal stages.27,28
Children aged 6 years to <12 years
Of the included studies, 67% (n=33) were among children aged 6–12 years old. The most frequently reported adiposity measures were BMI-z (82%, n=26) and %BF (39%, n=13). Seventy-three percent (n=24) of the interventions were family-based with the remaining studies being either parent-only (12%, n=4), or a combination of parent- or child-only (14%, n=5). One of the parent and child29 interventions was delivered within the school setting. Most studies used nutrition education; however, four interventions used the “Traffic Light” diet and one study used calorie-restricted diets based on child size and energy expenditure.
Fifty-eight percent (n=14) of the family-based studies found statistically significant reductions in one or more adiposity measure: BMI-z (n=10),29–38 BMI (n=6),35,38–42 % BF (n=6),29,37,39–42 WC (n=6),33,35,37–39,41 weight (n=4),38,40–42 fat mass (n=3),33,39,41 percentage overweight (n=2),36,41 WC % (n=1),30 fat mass (n=1),41 hip circumference (n=1),32 and weight-for-height ratio (n=1).35 Seventy-three percent (n=11/15) of the treatment effects remained significant at study follow-up (range: 3 months to 5 years) for at least one adiposity measure.29–31,33,35–38,40,42 The treatment effects for one of the studies was significant at 6 months but did not remain significant at 12- and 18-month follow-up.41 One of the interventions was delivered in the school setting which resulted in significant reductions in BMI-z (−0.21, p = 0.003) and % BF (−2.67%, p = 0.033) compared to the CG that remained significant at 4-month follow-up.29 Conversely, a community-based interventions where parents and children attended group educational and PA sessions twice weekly for 9 weeks, followed by a 12-week free family swimming pass led to significant reductions in WC-z (−0.48, p <0.0001), BMI-z (−0.30, p <0.0001), and FM (−1.4 kg, p=0.02) at 6 months; and WC-z (−0.47, p <0.0001) and BMI-z (−0.23, p <0.0001) remained reduced at 12 months.33 Additionally, a family-based intervention evaluated the effects of an isocaloric dairy-rich (DR) diet and energy-restricted diet on various components of metabolic syndrome.37 All groups experienced a decrease in BMI-z, WC, and %BF, without significant differences between groups.37 These adiposity measures increased during follow-up, but remained lowest in the DR group.37
Five studies evaluated a parent-only intervention,26,43–46 three studies which led to a significant reduction in adiposity,26,43,46 one study that demonstrated a non-significant decrease in adiposity,45 and one study which did not lead to significant treatment effects among the intervention group.44 Moens et al. assessed the effects of a parent-led intervention that trained parents about a healthy balance between energy intake and expenditure and positive behavior change strategies which resulted in a significant decrease in BMI (−5.0%, p=0.02) among the intervention group at 6 months.43 Golley et al. found that both parent interventions resulted in a reduction in BMI-z26 with the parenting-skills plus lifestyle intervention group (mean diff=−0.31) leading to significantly greater reductions in WC-z at 12 months compared to the parenting-skills only intervention (mean diff=−0.17) or CG (mean diff=−0.02).26 Janicke et al. compared a family-based to parent-only intervention and found significant reductions in BMI-z at 4 months in the parent-only group, which was sustained at 10-month follow-up.46 In the intervention by Wake et al. parents attended four consultations with general practitioners to set and record healthy lifestyle goals assisted by a ‘family folder’ that covered healthy lifestyle topics.45 This study led to a non-significant decrease in BMI at 6- (mean diff=−0.12 kg/m2, p=0.38) and 12-months (mean diff=−0.1 kg/m2, p=0.51) for the intervention group.45 Conversely, a parent-only intervention that consisted of 90-minute group sessions that included nutrition, PA, and positive parenting strategies did not result in significant reduction in adiposity when compared to the CG.44
The remaining five interventions used a combination of parent-only, child-only, or parent- and child- only sessions. The intervention in Kalavainen et al. consisted primarily of parent-only and child-only sessions with only one joint session.47 The intervention resulted in a significantly greater reduction in weight-for-height % (−6.8% vs. −1.8%), BMI (−0.8 vs. 0.0), and BMI-z (−0.3 vs. −0.2) when compared to routine care.47 Similarly, Weigel et al. intervention primarily focused on child-only nutrition and PA sessions with monthly parental support meetings.48 The intervention group had significant decreases in BMI (INT: 27.2 vs. CG: 31.7 kg/m2), BMI-z (INT: 2.10 vs. CG: 2.66), and fat mass (INT: 20.9 vs. CG: 32.5 kg) whereas the CG had significant increases,48 which continued at 12-month follow-up. In comparison, Yackobovitch-Gavan et al. had both parent-only and parent-child groups that led to significant reductions in BMI-z of −0.08 and −0.05, respectively, when compared to the CG; however, only the parent-child group had a significant BMI-z reduction at 2-year follow-up.49 Both Serra-Paya et al. and Reinehr et al. had multi-component interventions consisting of sessions geared only towards the child or parent as well as joint family sessions.50,51 Only Reinehr et al. found a significant decrease in BMI-z among the intervention group (−0.26) when compared to the CG (+0.05).51 Conversely, Serra-Paya et al. found a similar decrease in BMI-z for both intervention and CG.50
Adolescents aged 12 to < 18 years
Of the 49 included studies, 33% (n=16) were among youth at least 12 but less than18 years old. All the included studies used some form of BMI assessment as an adiposity measure. Of the 16 studies, 69% (n=11) were family-based interventions,52–62 and five studies focused on lifestyle modification for the adolescent alone.13,63–66
Seventy-three percent (n=8/11) of the family-based interventions found statistically significant reductions in one or more adiposity measure: BMI-z (n=7),53–56,59,60 % BF (n=4),52–54,62 weight (n=4),53–55,62 BMI (n=3),53,54,62 fat mass (n=3),53,54,62 HC (n=1),57 WC (n=1),57 and WC-z (n=1).56 Jiang et al. evaluated a family-based, behavioral intervention which resulted in a significant decrease in BMI-z among intervention participants from ~4.0 at baseline to ~2.5 at 24-months.55 Hofsteenge et al. compared the Go4it family-based intervention delivered in outpatient clinic to dietician referral in a home setting.59 Although BMI-z was not significantly reduced at 6 months, there was a significant between group difference at 18 month follow-up with a reduction among the intervention group and an increase among the CG.59 The Bright Bodies (BB) Weight Management Program included nutrition education and behavior modification classes twice per week for 6 months followed by biweekly sessions for an additional 6 months.62 The CG attended an obesity clinic every 6 months and received diet and exercise counseling from dieticians and physicians.62 At 1 year, participants in the BB program had statistically significant improvements in several adiposity measures compared to the CG: weight (+0.3 vs. +7.7 kg), BMI (−1.7 vs. +1.6 kg/m2), % BF (−4.0 vs. +2.0%), and FM (−3.7 kg vs. +5.5 kg).62 In 2014, Savoye et al. compared the BB Program to standard of care healthy lifestyle advice and found that the BB program resulted in significant treatment effects when compared to CG for BMI-z (−0.09), fat mass (−5.0 kg), and %BF (−3.8%).54 Another study evaluated the effects of a family-based cognitive behavioral lifestyle intervention compared to standard care which demonstrated significant short- and long-term reductions in BMI-z of −0.2 and −0.4 and WC-z of −0.3 and −0.7, respectively, which remained significantly reduced at 2-year follow-up.56 Another study evaluated the efficacy of a family-based lifestyle program that involved initiating small and maintainable changes in eating and activity habits, and utilized cognitive behavioral strategies to manage barriers to change.53 This study found significant reductions between intervention and CG participants for BF (−1.48 vs. +1.77 kg), %BF (−1.17 vs. +0.17%), lean mass (+0.01 vs. +1.37 kg), weight (−1.39 vs. +2.79 kg), BMI (−0.69 vs. +0.76 kg/m2), BMI-z (−0.09 vs. +0.01) and BMI percentile (−1.17 vs. +0.06%ile) all with medium to large effect sizes.53 Berntsen et al. implemented an intervention that consisted of 1-hour biweekly guided active play for five months as compared to a control that received dietary advice and were encouraged to increase PA.52 The intervention resulted in significant between group reductions in %BF among the intervention group (−1.8%) compared to CG (−0.9%).52 Johnston et al. evaluated an instructor-led intervention compared to a self-help program, both aimed at modifying diet and PA using behavior modification strategies, with the intervention program leading to significant reductions in BMI-z and triceps skinfold thickness at 1 and 2 years follow-up.60
Three of the family-based interventions did not result in significant reductions in adiposity measures. Boodai et al. evaluated the effects of a low intensity intervention aimed at modifying sedentary behavior, PA, and diet, which consisted of six hours of contact over 24 weeks.58 Conversely, Abraham et al. evaluated two interventions compared to a CG who attended obesity clinic visits every 3 months.57 The first intervention group received usual care visits every three months plus a 12-week internet-based curriculum, and the second intervention group received usual care visits every three months plus four nutritional counselling sessions.57 The last family-based intervention that did not lead to significant improvements in weight or BMI had participants track energy intake and expenditure using a mobile phone application and wrist accelerometer that provided weekly feedback.61
Six interventions primarily targeted child participation. Balagopal et al. assigned participants to an intervention that included 45 minutes of PA 3 days/week combined with diet counseling compared to a CG.64 The intervention resulted only in a significant reduction in %BF (Pre: 45.5±2.3 kg; Post: 39.2±2.3 kg; p=0.002).64 However, the intervention group maintained weight and BMI whereas the CG had a significant increase in both.64 Bonham et al. evaluated the use of a commercially available weight loss program which resulted in significant reduction in BMI-z (mean difference (MD):−0.23), BMI (MD:−2.5 kg/m2), BMI percentile (MD:−1.6%ile), and weight (MD:−6.6 kg), which was maintained six months after completion of the program.65 Soltero et al. evaluated a 3-month community-based intervention for Latino youth, in which they received weekly nutrition and health classes and 3 days/week of exercise.13 Results showed significant reductions in weight (MD:−2.55 kg), BMI (MD: −1.02 kg/m2), BMI percentile (MD:−0.37), WC (MD: −1.86 cm), and %BF (MD:−2.52%), with reductions sustained for all adiposity measures except WC at 12-month follow-up.13 Chan et al. evaluated a lifestyle intervention based on behavioral modification and motivational interviewing for children with NAFLD that resulted in significant reductions in weight (MD:−4.5 kg) BMI (MD:−1.45 kg/m2), BMI-z (−0.16), and % BF (−4.12%); however, only the reduction in BF% maintained at follow-up.63 Another study evaluated a summer camp treatment delivered to children, and found no significant difference in BMI or BMI-z within or between the intervention and CGs.66
Evaluation of Bias and Threats to Precision
There were 109 potential sources of bias or threats to precision identified among the included studies using the RTI 29-item bank. The most common types of bias were detection (28%, n=31), and attrition bias (19%, n=21), followed by precision (17%, n=18) and selection/confounding (17%, n=19) bias. Six studies30,38,44,45,50,54 had no potential sources of bias or threats to precision. Among the remaining studies, 19% (n=10) had one,13,29,32,34,36,47,67–70 33% (n=16) had two,25,26,31,33,35,39,41,42,46,51–53,57,60,62,71 15% (n=8) had three,37,49,56,59,61,64,65,72 and 12% (n=6) had four.43,48,55,58,63,73 The remaining three studies each had five,40 six,66 and eight74 sources of potential bias or threats to precision, respectively. This information is summarized in Table 2.
Table 2.
Evaluation of Quality and Potential Bias of Included Studies (n=49)
| Source | Quality Rating | Potential Bias |
|---|---|---|
| Abraham 2015 (57) | Good | Information, Selection/Confounding |
| Ahmad 2018 (30) | Good | None |
| Balagopal 2010 (64) | Fair | Precision, Detection, Selection/Confounding |
| Benestad 2017 (39) | Good | Detection, Attrition |
| Berntsen 2010 (52) | Fair | Selection/Confounding, Detection |
| Bonham 2017 (65) | Fair | Detection, Attrition, Selection/Confounding |
| Boodai 2014 (58) | Good | Detection, Attrition, Information, Selection/Confounding |
| Boudreau 2013 (72) | Fair | Precision, Detection, Attrition |
| Brennan 2013 (53) | Fair | Precision, Selection/Confounding, |
| Chan 2018 (63) | Good | Selection/confounding, Precision, Performance, Information, |
| Cohen 2016 (31) | Good | Precision, Detection |
| Croker 2012 (68) | Good | Attrition |
| Diaz 2010 (67) | Good | Attrition |
| Farpour-Lambert 2019 (38) | Good | None |
| Gerards 2015 (44) | Good | None |
| Gillis 2007 (74) | Fair | Performance, Precision, Detection, Attrition, Information, Selection/ Confounding, Overall believability, Reporting |
| Golley 2007 (26) | Good | Detection, Attrition |
| Hofsteenge 2014 (59) | Fair | Precision, Detection, Attrition |
| Hughes 2008 (71) | Good | Attrition, Selection/Confounding |
| Janicke 2008 (46) | Good | Detection, Attrition |
| Jiang 2005 (55) | Good | Selection/Confounding, Information, Precision, Detection |
| Johnson 1997 (40) | Fair | Precision, Detection, Information, Selection/Confounding, Reporting |
| Johnston 2007 (60) | Fair | Precision, Detection |
| Kalarchian 2009 (41) | Good | Detection, Attrition |
| Kalavainen 2007 (47) | Fair | Detection |
| Kelishadi 2009 (37) | Good | Precision, Attrition, Selection/Confounding |
| Lee 2014 (29) | Good | Precision |
| Mameli 2018 (61) | Good | Detection, Attrition, Selection/Confounding |
| McCallum 2007 (69) | Good | Performance |
| Moens 2012 (43) | Fair | Precision, Detection, Selection/Confounding, Overall believability |
| Morell-Azanza 2019 (32) | Good | Detection |
| Nemet 2005 (42) | Good | Detection, Attrition |
| O’Connor 2013 (70) | Fair | Detection |
| Reinehr 2010 (51) | Good | Detection, Selection/Confounding |
| Rodearmel 2007 (73) | Poor | Precision, Detection, Information, Selection/Confounding, |
| Sacher 2010 (33) | Good | Detection, Attrition |
| Sauder 2018 (34) | Good | Detection |
| Savoye 2014 (54) | Good | None |
| Savoye 2007 (62) | Good | Detection, Attrition |
| Serra-Paya 2015 (50) | Good | None |
| Soltero 2018 (13) | Good | Detection |
| Taylor 2015 (35) | Good | Selection/Confounding, Information |
| Vos 2011 (56) | Good | Precision, Detection, Attrition |
| Wake 2009 (45) | Good | None |
| Wang 2008 (66) | Fair | Precision, Attrition, Information, Selection/Confounding, Overall believability, Reporting |
| Weigel 2008 (48) | Fair | Selection/Confounding, Information, Precision, Detection, |
| Wilfley 2017 (36) | Good | Detection |
| Wylie-Rosett 2018 (25) | Good | Precision, Attrition |
| Yackobovitch-Gavan 2018 (49) | Fair | Detection, Attrition, Reporting |
Evaluation of Study Quality
Table S2 provides the responses to each of the 14 items on the Quality Assessment of Controlled Intervention Studies and Table 2 provides the overall quality rating. Of the 49 studies included in the review, 33 studies had an overall quality rating of “good”,13,25,26,29–39,41,42,44–46,50,51,54–58,61–63,67–69,7115 had an overall quality rating of “fair”,40,43,47–49,52,53,59,60,64–66,70,72,74 and one study had an overall quality rating of “poor”.73
Meta-analyses
Data were obtained from 14 of the 49 studies included in the systematic review for the meta-analysis. The mean age of these 14 studies was 10.7 years, with half of the studies conducted among children aged 6 to 12 years old. The number of participants ranged from 40 to 360, with a mean sample size of 124 participants. Fifty percent of the studies (n=7) included youth with overweight or obesity, 43% (n=6) were among youth with obesity, and 7% (n=1) included youth that were overweight only. The majority (64%, n=9) of the lifestyle interventions were either family-based (n=4) or involved both the parent and child (n=5). Sixty-four percent (n=9) of the studies reported statistically significant intervention effects on at least one measure of adiposity. Among these studies, %BF was the most frequently reported adiposity measure showing significant reductions (n=7, 50%), followed by BMI (n=5, 36%), BMI z-score (n=5, 36%), WC (n=4, 29%), weight (n=4, 29%), FM (n=4, 29%), and WHtR (n=1, 7%). A meta-analysis was performed to examine sex differences in weight (n=9), BMI (n=11), BMI-z (n=11), % BF (n=9), and WC (n=10). Forest plots are displayed in Figure 2. The funnel plots for each adiposity measure showed an asymmetrical pattern indicating publication bias (Figure S1).
Figure 2.
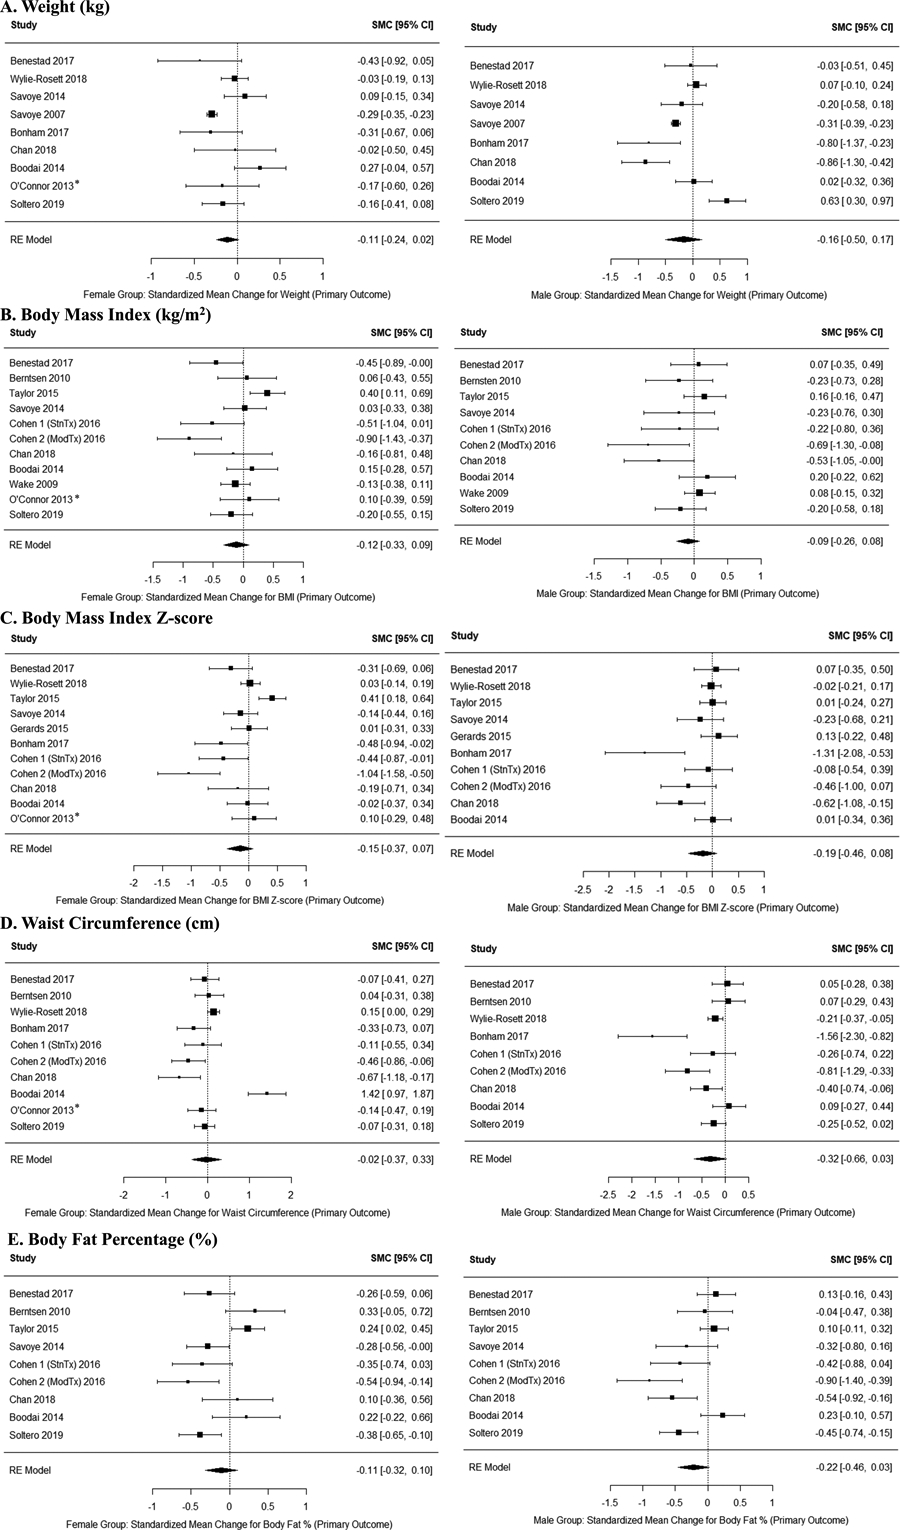
Overall effect size estimates for females (left) and males (right) for weight (A), BMI (B), BMI z-score (C), waist circumference (D), and body fat percentage (E). The overall effect size estimate was calculated for the standardized mean change for each adiposity measure using a random effects model. The standardized mean change for the effect was calculated as intervention - control. So, a negative effect size indicates a larger effect size for the control group. A random effects model was used to determine an overall effect size estimate for males and females separately, then the two estimates were compared using a meta-regression model with fixed effects. * Indicates articles not included for one sex due to small sample size.
Weight.
Six of nine studies were among adolescents aged 12–18 years old13,54,58,62,63,65 with only three of the studies among younger children aged less than 12 years.25,39,70 Six of the interventions were family-based or included the parent and child,25,39,54,58,62,70 whereas three were child-only interventions.13,63,65 Sixty-seven percent of the studies reported a significant intervention effect.13,39,54,58,63,65 The overall pooled estimates for females was −0.1123 (95% CI: −0.2403, 0.0157; I2=60.78%) and for males was −0.1637 (95% CI: −0.4988, 0.1714; I2=92.61%). The meta-regression model comparisons indicated there was no sex-specific treatment effects (beta=−0.051, SE=0.183, Z=−0.281, p=0.779; Figure 2A).
BMI.
Six of the studies were among children under 12 years of age13,31,35,39,69 and five studies were among adolescents between 12–18 years old.13,52,54,58,63,75 Eight of the interventions were family-based or involved both the parent and child,31,35,39,52,54,58,70 whereas the remaining three were child-13,63 and parent-only45 interventions. Only four of the studies reported a main intervention effect for BMI.13,35,39,63 The overall pooled estimates for females was −0.1186 (95% CI: −0.3287, 0.0916; I2=66.0%) and for males was −0.0920 (95% CI: −0.2640, 0.0800; I2=39.99%). The meta-regression model comparisons showed that there were no sex differences in response to the intervention (beta=0.027, SE=0.139, z=0.191, p=0.848; Figure 2B).
BMI-z.
Sixty of eleven of the studies were among children under 12 years of age25,31,35,39,44,70 and the majority (73%, n=8) were family-based or had parent-child sessions.25,31,35,39,54,58,70 Six of the studies reported a significant intervention effect on BMI-z.31,35,54,63,65 The overall pooled estimates for females was −0.1500 (95% CI: −0.3728, 0.0729; I2=79.8%) and for males was −0.1907 (95% CI: −0.4606, 0.0791; I2=80.96%). The meta-regression model comparisons showed that there were no sex-specific treatment effects (beta=−0.041 SE=0.179, z=−0.228, p=0.819; Figure 2C).
Percentage Body Fat.
Five of the studies13,52,54,58,63 were among adolescents older than 12 years and all but two studies13,63 were family-based or involved both parent and child. Fifty-five percent (n=5) of the studies demonstrated significant main intervention effects for % BF.13,39,52,54,63 The overall pooled estimates for females was −0.1075 (95% CI: −0.3170, 0.1021; I2=71.7%) and for males was −0.2166 (95% CI: −0.4591, 0.0259; I2=76.39%). The meta-regression model comparisons showed that there were no sex differences in response to the intervention (beta=−0.1091 SE=0.164, z=−0.667, p=0.505; Figure 2D).
Waist Circumference.
The majority of studies were among adolescents between 12 and 18 years of age (60%, n=6)13,52,58,63,65,70 and were family-based or involved both parent and child (80%, n=8).25,31,39,52,58,70 Only three of the studies reported a significant intervention effect on WC.13,39,63 The overall pooled estimates for females was −0.0225 (95% CI: −0.3713, 0.3264; I2=91.8%) and for males was −0.3181 (95% CI: −0.6614, 0.0251; I2=89.6%). The meta-regression model comparisons showed that there were no sex-specific treatment effects (beta=−0.296 SE=0.250, z=−1.184, p=0.236; Figure 2E).
Discussion
Our systematic review demonstrated that lifestyle intervention is efficacious at improving adiposity among youth, but few interventions examine sex differences in response to lifestyle intervention. The results of our meta-analysis demonstrated male and female youth do not demonstrate a differential response to lifestyle intervention for weight, BMI-z, BF%, or WC. However, interpretations of these results should consider the vast heterogeneity in study design and the strong indication of publication bias. Despite the lack of sex differences, we believe that the consideration of sex during the design, implementation, and interpretation of lifestyle interventions is important because there are not only anatomical and physiological transformations76,77 occurring but also psychosocial differences78 that are emerging between male and female youth during this developmental period.
The importance of sex as a biological variable is not a new concept. Over the last decade, it has become clear that differences between males and females extends beyond reproductive and hormonal health, and affect a wide range of biological functions.79 Despite our current findings indicating no sex differences in adiposity following lifestyle intervention, it is well known that male and female adults have different weight loss strategies80 and successes.81–83 Adult males not only lose weight faster but tend to lose more weight compared to their female counterparts.81–83 These differences may be explained by distinct motivations, individual preferences, and cultural norms to engage in specific health behaviors such as PA84 or dieting85 which are evident among youth. In one study, female adolescents reported less PA and engaged in shorter durations of activity compared to male adolescents,86 with higher exercise dose potentially resulting in greater weight loss.87 Exercise preference may result in different changes in body composition as aerobic exercise leads to greater reductions in BF% whereas resistance training results in greater increases in lean mass.88,89 Male youth prefer more unstructured exercise whereas female youth are drawn to organized or group-based exercise programs.90 Similarly, youth have very different food preferences and dietary intake habits. It has been shown that female youth prefer fruits and vegetables but consume more calories from fast food.91 Whereas, male youth enjoy high-fat and sugary foods,92 meat, fish, and poultry;93 and consume more calories from sugar-sweetened beverages.94 Physiologically, there are sex differences in how the brain processes information about food, specifically among youth with obesity, demonstrating that female youth have greater neural reactivity to higher-energy-dense food cues.95 Further, youth utilize different behavioral strategies for weight less with female youth more likely to follow a healthy diet to lose weight whereas male youth were more concerned about changing body composition by gaining muscle mass.85 Considering these distinct differences in preferences, motivations, behaviors to engage in PA and healthy eating along with physiological differences that influence these behaviors, lifestyle interventions should consider the suitability of individual intervention components for improving adiposity outcomes among youth with overweight or obesity.
It should be noted that the studies included in the present review had drastically different PA and nutrition counseling regimens. The PA ranged from supervised sessions with personal trainers to internet-based educational sessions with the substantial variation in the type of exercise (aerobic vs. anaerobic, group vs. single sessions). Despite the individual interventions using a standardized dietary approach for all included participants, there was heterogeneity across studies in regards to nutrition topics covered, and duration and frequency of nutrition counseling sessions. These differences in study design make examining sex effects challenging, particularly during childhood and adolescence where anatomical and physiological transformations are occurring in conjunction with behavioral and psychosocial changes.
Adolescence marks a unique period of growth and development where sexual dimorphism in obesity risk and risk reduction emerges.96 These differences are partially explained by the physiological changes that coincide with the onset of puberty.27,28 Because of this, we evaluated the literature for children (at least 6 but less than 12 years old) and adolescents (greater than 12 but less than 18 years old) separately in order to account for the pre- and post-pubertal stages. Interestingly, slightly more of the interventions that resulted in a significant reduction in adiposity were among younger children indicating that intervening at a younger age may be more advantageous. Unfortunately, due to the limited number of studies that provided summary statistics by group and sex, we were unable to perform the meta-regression analyses by age group. Further, we grouped studies by the mean age of the study cohort in our evaluation of the literature as the age range of the included studies varied. Despite this, relying on a specific age as inclusion criteria may be misleading and detrimental to intervention effectiveness as puberty onset is unique to each individual. Instead, researchers should base eligibility on a specific stage of pubertal development to obtain a more homogenous sample.
Another key finding stemming from this systematic review was the importance of parental involvement among the studies that led to improvements in adiposity. Seventy percent of the lifestyle interventions that significantly improved at least one adiposity measure included the parent and child. Not surprisingly, the majority of these studies were among younger (aged 6–12 years) children, an age group that may be more attuned to having their parent involved. Past systematic reviews have reported conflicting results regarding the effectiveness of family-based lifestyle interventions among youth.97,98 However, the notion of having the parent be an active intervention participant in lifestyle interventions for the treatment of overweight or obesity among youth is an important concept emerging from the literature. The findings from this review support current guidelines that recommend family-based approaches in behavioral interventions for treating pediatric obesity.99
There were several strengths and limitations to this review and meta-analysis. Despite using well-defined search criteria to screen articles, there was large heterogeneity in the study design, intervention components, adiposity outcomes measured, and age of participants. Due to this, results from the meta-analysis should be interpreted with caution. Further, there were only a few studies that reported sex differences in their primary outcomes paper; therefore, we had to contact many of the corresponding authors in order to obtain the necessary summary statistics. Unfortunately, we were only able to obtain summary statistics from 14 of the included studies. Additionally, because of the limited number of studies that provided summary statistics we were unable to perform subgroup meta-regression analyses for key factors such as age and type of intervention. Further, there are limitations in the measures used by most studies to assess weight change, particularly using BMI in youth with overweight or obesity.100 Percent above the 95th BMI percentile is a more sensitive measure for assessing changes in adiposity; however, none of the included studies used this measurement.101 Finally, the literature search was limited to English-language articles which could have potentially excluded eligible studies.
In conclusion, we did not find significant sex differences in response to lifestyle interventions. Despite these findings, it remains important for researchers to consider sex as a biological factor during the design of lifestyle interventions. Lifestyle interventions that have successfully improved adiposity among youth with overweight and obesity should be required to examine sex differences in intervention effectiveness. As more evidence emerges regarding potential sex differences among these successful interventions, researchers will be able to determine the intervention components that lead to the greatest improvement in health for both male and female youth. This information will better equip healthcare providers to individually tailor healthy lifestyle counseling for their patients that not only considers their distinct biology but also their unique preferences, motivations, and psychosocial influences.
Supplementary Material
Study Importance Questions.
What is already known about this subject?
Sex differences in adiposity emerge during adolescence.
Lifestyle intervention is the cornerstone approach to managing obesity.
Previous research suggests male youth may experience greater short-term reductions in adiposity whereas female youth may obtain greater long-term benefit following a lifestyle intervention.
What are the new findings in your manuscript?
Our systematic review demonstrated that few lifestyle interventions report sex differences.
The meta-analysis revealed that male and female youth do not demonstrate a differential response to lifestyle intervention for weight, BMI, BMI-z, BF%, and waist circumference.
How might your results change the direction of research or the focus of clinical practice?
It remains important for researchers to consider sex as a biological factor during the design of lifestyle interventions to determine the intervention components that lead to the greatest improvement in health for both male and female youth.
This information will better equip healthcare providers to individually tailor healthy lifestyle counseling for their patients that not only considers their distinct biology but also their unique preferences, motivations, and psychosocial influences.
Acknowledgements:
We would like to thank all corresponding authors and investigators that shared their data with us which made this meta-analysis possible. Data is available upon request.
Funding:
Dr. Shaibi was supported by grants from the National Institutes of Health including the National Institute of Diabetes and Digestive and Kidney Diseases (R01DK107579) and the National Institute of Minority Health and Health Disparities (U54MD002316). Dr. Peña was supported through a grant from the National Institute of Diabetes and Digestive and Kidney Diseases (F31DK125037).
Footnotes
Clinical Trial Registration: Not applicable
Disclosure: Dr. Shaibi received personal fees from Phoenix Children’s Hospital for research consultation, which has been disclosed to Arizona State University, outside the submitted work.
References
- 1.Fryar CD, Carroll MD, Afful J, Division of Health and Nutrition Examination Surveys. Prevalence of Overweight, Obesity, and Severe Obesity Among Children and Adolescents Aged 2–19 Years: United States, 1963–1965 Through 2017–2018. Heal E-Stats. 2020;324(12):1208–1210. doi: 10.1001/jama.2020.14590 [DOI] [Google Scholar]
- 2.Staiano AE, Broyles ST, Gupta AK, Katzmarzyk PT. Ethnic and sex differences in visceral, subcutaneous, and total body fat in children and adolescents. Obesity. 2013;21(6):1251–1255. doi: 10.1002/oby.20210 [DOI] [PMC free article] [PubMed] [Google Scholar]
- 3.Pettitt DJ, Talton J, Dabelea D, et al. Prevalence of diabetes in U.S. Youth in 2009: The SEARCH for diabetes in youth study. Diabetes Care. 2014;37(2):402–408. doi: 10.2337/dc13-1838 [DOI] [PMC free article] [PubMed] [Google Scholar]
- 4.Pan JJ, Fallon MB. Gender and racial differences in nonalcoholic fatty liver disease. World J Hepatol. 2014;6(5):274–283. doi: 10.4254/wjh.v6.i5.274 [DOI] [PMC free article] [PubMed] [Google Scholar]
- 5.Miller JM, Kaylor MB, Johannsson M, Bay C, Churilla JR. Prevalence of metabolic syndrome and individual criterion in US adolescents: 2001–2010 national health and nutrition examination survey. Metab Syndr Relat Disord. 2014;12(10):527–532. doi: 10.1089/met.2014.0055 [DOI] [PubMed] [Google Scholar]
- 6.Elvsaas IKØ, Giske L, Fure B, Juvet LK. Multicomponent Lifestyle Interventions for Treating Overweight and Obesity in Children and Adolescents: A Systematic Review and Meta-Analyses. J Obes. 2017;2017. doi: 10.1155/2017/5021902 [DOI] [PMC free article] [PubMed] [Google Scholar]
- 7.Ho M, Garnett SP, Baur L, et al. Effectiveness of lifestyle interventions in child obesity: Systematic review with meta-analysis. Pediatrics. 2012;130(6):1647–1671. doi: 10.1542/peds.2012-1176 [DOI] [PubMed] [Google Scholar]
- 8.Peirson L, Fitzpatrick-Lewis D, Morrison K, Warren R, Usman Ali M, Raina P. Treatment of overweight and obesity in children and youth: a systematic review and meta-analysis. C Open. 2015;3(1):E35–E46. doi: 10.9778/cmajo.20140047 [DOI] [PMC free article] [PubMed] [Google Scholar]
- 9.Bondyra-Wiśniewska B, Myszkowska-Ryciak J, Harton A. Impact of lifestyle intervention programs for children and adolescents with overweight or obesity on body weight and selected cardiometabolic factors—a systematic review. Int J Environ Res Public Health. 2021;18(4):1–32. doi: 10.3390/ijerph18042061 [DOI] [PMC free article] [PubMed] [Google Scholar]
- 10.August GP, Caprio S, Fennoy I, et al. Prevention and treatment of pediatric obesity: An Endocrine Society clinical practice guideline based on expert opinion. J Clin Endocrinol Metab. 2008;93(12):4576–4599. doi: 10.1210/jc.2007-2458 [DOI] [PMC free article] [PubMed] [Google Scholar]
- 11.Meiklejohn S, Ryan L, Palermo C. A Systematic Review of the Impact of Multi-Strategy Nutrition Education Programs on Health and Nutrition of Adolescents. J Nutr Educ Behav. 2016;48(9):631–646.e1. doi: 10.1016/j.jneb.2016.07.015 [DOI] [PubMed] [Google Scholar]
- 12.Hoelscher DM, Evans A, Parcel GS, Kelder SH. Designing effective nutrition interventions for adolescents. J Am Diet Assoc. 2002;102(3 Suppl). doi: 10.1016/s0002-8223(02)90422-0 [DOI] [PubMed] [Google Scholar]
- 13.Soltero EG, Olson ML, Williams AN, et al. Latino Youth with Obesity : A randomized controlled trial. Obes (Silver Spring). 2019;26(12):1856–1865. doi: 10.1002/oby.22300.Effects [DOI] [PMC free article] [PubMed] [Google Scholar]
- 14.Vander Wyst KB, Olson ML, Keller CS, et al. Sex as a moderator of body composition following a randomized controlled lifestyle intervention among Latino youth with obesity. Pediatr Obes. 2020;15(6):1–9. doi: 10.1111/ijpo.12620 [DOI] [PMC free article] [PubMed] [Google Scholar]
- 15.Rancourt D, Barker DH, Jelalian E. Sex as a Moderator of Adolescents’ Weight Loss Treatment Outcomes. J Adolesc Heal. 2018;62(5):591–597. doi: 10.1016/j.jadohealth.2017.12.002.Sex [DOI] [PMC free article] [PubMed] [Google Scholar]
- 16.Epstein LH, Paluch RA, Raynor HA. Sex differences in obese children and siblings in family-based obesity treatment. Obes Res. 2001;9(12):746–753. doi: 10.1038/oby.2001.103 [DOI] [PubMed] [Google Scholar]
- 17.Llauradó E, Tarro L, Moriña D, Aceves-Martins M, Giralt M, Solà R. Follow-up of a healthy lifestyle education program (the EdAl study): four years after cessation of randomized controlled trial intervention. BMC Public Health. 2018;18(1):104. doi: 10.1186/s12889-017-5006-0 [DOI] [PMC free article] [PubMed] [Google Scholar]
- 18.Ning Y, Yang S, Evans RK, et al. Changes in body anthropometry and composition in obese adolescents in a lifestyle intervention program. Eur J Nutr. 2014;53(4):1093–1102. doi: 10.1007/s00394-013-0612-9 [DOI] [PubMed] [Google Scholar]
- 19.Page MJ, McKenzie JE, Bossuyt PM, et al. The PRISMA 2020 statement: An updated guideline for reporting systematic reviews. PLoS Med. 2021;18(3):1–15. doi: 10.1371/JOURNAL.PMED.1003583 [DOI] [PMC free article] [PubMed] [Google Scholar]
- 20.National Heart Lung and Blood Institute. Quality Assessment of Controlled Intervention Studies. Study Quality Assessment Tools. https://www.nhlbi.nih.gov/health-topics/study-quality-assessment-tools
- 21.Viswanathan M, Berkman ND. Development of the RTI item bank on risk of bias and precision of observational studies. J Clin Epidemiol. 2012;65(2):163–178. doi: 10.1016/j.jclinepi.2011.05.008 [DOI] [PubMed] [Google Scholar]
- 22.Morris SB. Estimating Effect Sizes From Pretest-Posttest-Control Group Designs. Organ Res Methods. 2008;11(2):364–386. [Google Scholar]
- 23.Higgins JP, Thompson SG. Quantifying heterogeneity in a meta-analysis. Stat Med. 2002;21:1539–1558. [DOI] [PubMed] [Google Scholar]
- 24.R statistical software: R Core Team. R: A Language and Environment for Statistical Computing; 2010. Accessed March 17, 2022. https://www.r-project.org/
- 25.Wylie-Rosett J, Groisman-Perelstein AE, Diamantis PM, et al. Embedding weight management into safety-net pediatric primary care: Randomized controlled trial. Int J Behav Nutr Phys Act. 2018;15(1):1–12. doi: 10.1186/s12966-017-0639-z [DOI] [PMC free article] [PubMed] [Google Scholar]
- 26.Golley RK, Magarey AM, Baur LA, Steinbeck KS, Daniels LA. Twelve-month effectiveness of a parent-led, family-focused weight-management program for prepubertal children: A randomized, controlled trial. Pediatrics. 2007;119(3):517–525. doi: 10.1542/peds.2006-1746 [DOI] [PubMed] [Google Scholar]
- 27.Brix N, Ernst A, Lauridsen LLB, et al. Childhood overweight and obesity and timing of puberty in boys and girls: Cohort and sibling-matched analyses. Int J Epidemiol. 2021;49(3):834–844. doi: 10.1093/IJE/DYAA056 [DOI] [PMC free article] [PubMed] [Google Scholar]
- 28.Busch AS, Højgaard B, Hagen CP, Teilmann G. Obesity is associated with earlier pubertal onset in boys. J Clin Endocrinol Metab. 2020;105(4):E1667–E1672. doi: 10.1210/clinem/dgz222 [DOI] [PubMed] [Google Scholar]
- 29.Lee A, Ho M, Keung VMW, Kwong ACM. Childhood obesity management shifting from health care system to school system: Intervention study of school-based weight management programme. BMC Public Health. 2014;14(1):1–10. doi: 10.1186/1471-2458-14-1128 [DOI] [PMC free article] [PubMed] [Google Scholar]
- 30.Ahmad N, Shariff ZM, Mukhtar F, Lye MS. Family-based intervention using face-to-face sessions and social media to improve Malay primary school children’s adiposity: A randomized controlled field trial of the Malaysian REDUCE programme. Nutr J. 2018;17(1):1–13. doi: 10.1186/s12937-018-0379-1 [DOI] [PMC free article] [PubMed] [Google Scholar]
- 31.Cohen TR, Hazell TJ, Vanstone CA, Rodd C, Weiler HA. A family-centered lifestyle intervention for obese six-to eight-year-old children: Results from a one-year randomized controlled trial conducted in Montreal, Canada. Can J Public Heal. 2016;107(4–5):e453–e460. doi: 10.17269/CJPH.107.5470 [DOI] [PMC free article] [PubMed] [Google Scholar]
- 32.Morell-Azanza L, Ojeda-Rodríguez A, Ochotorena-Elicegui A, et al. Changes in objectively measured physical activity after a multidisciplinary lifestyle intervention in children with abdominal obesity: A randomized control trial. BMC Pediatr. 2019;19(1):6–13. doi: 10.1186/s12887-019-1468-9 [DOI] [PMC free article] [PubMed] [Google Scholar]
- 33.Sacher PM, Kolotourou M, Chadwick PM, et al. Randomized controlled trial of the MEND program: A family-based community intervention for childhood obesty. Obesity. 2010;18(SUPPL. 1):S62–S68. doi: 10.1038/oby.2009.433 [DOI] [PubMed] [Google Scholar]
- 34.Sauder KA, Dabelea D, Callahan RB, et al. Targeting risk factors for type 2 diabetes in American Indian youth: the Tribal Turning Point pilot study. Pediatr Obes. 2018;13(5):321–329. doi: 10.1111/ijpo.12223 [DOI] [PMC free article] [PubMed] [Google Scholar]
- 35.Taylor RW, Cox A, Knight L, et al. A tailored family-based obesity intervention: A randomized trial. Pediatrics. 2015;136(2):281–289. doi: 10.1542/peds.2015-0595 [DOI] [PubMed] [Google Scholar]
- 36.Wilfley DE, Saelens BE, Stein RI, et al. Dose, content, and mediators of family-based treatment for childhood obesity a multisite randomized clinical trial. JAMA Pediatr. 2017;171(12):1151–1159. doi: 10.1001/jamapediatrics.2017.2960 [DOI] [PMC free article] [PubMed] [Google Scholar]
- 37.Kelishadi R, Zemel MB, Hashemipour M, Hosseini M, Mohammadifard N, Poursafa P. Can a dairy-rich diet be effective in long-term weight control of young children? J Am Coll Nutr. 2009;28(5):601–610. doi: 10.1080/07315724.2009.10719792 [DOI] [PubMed] [Google Scholar]
- 38.Farpour‐Lambert NJ, Martin XE, Bucher Della Torre S, et al. Effectiveness of individual and group programmes to treat obesity and reduce cardiovascular disease risk factors in pre‐pubertal children. Clin Obes. 2019;9(6):1–12. doi: 10.1111/cob.12335 [DOI] [PubMed] [Google Scholar]
- 39.Benestad B, Lekhal S, Smastuen MC, et al. Camp-based family treatment of childhood obesity: Randomised controlled trial. Arch Dis Child. 2017;102(4):303–310. doi: 10.1136/archdischild-2015-309813 [DOI] [PMC free article] [PubMed] [Google Scholar]
- 40.Johnson WG, Hinkle LK, Carr RE, et al. Dietary and exercise interventions for juvenile obesity: Long-term effect of behavioral and public health models. Obes Res. 1997;5(3):257–261. doi: 10.1002/j.1550-8528.1997.tb00300.x [DOI] [PubMed] [Google Scholar]
- 41.Kalarchian MA, Levine MD, Arslanian SA, et al. Family-based treatment of severe pediatric obesity: Randomized, controlled trial. Pediatrics. 2009;124(4):1060–1068. doi: 10.1542/peds.2008-3727 [DOI] [PMC free article] [PubMed] [Google Scholar]
- 42.Nemet D, Barkan S, Epstein Y, Friedland O, Kowen G, Eliakim A. Short- and long-term beneficial effects of a combined dietary-behavioral- physical activity intervention for the treatment of childhood obesity. Pediatrics. 2005;115(4). doi: 10.1542/peds.2004-2172 [DOI] [PubMed] [Google Scholar]
- 43.Moens E, Braet C. Training parents of overweight children in parenting skills: A 12-month evaluation. Behav Cogn Psychother. 2012;40(1):1–18. doi: 10.1017/S1352465811000403 [DOI] [PubMed] [Google Scholar]
- 44.Gerards SMPL, Dagnelie PC, Gubbels JS, et al. The effectiveness of lifestyle triple P in the Netherlands: A randomized controlled trial. PLoS One. 2015;10(4):1–18. doi: 10.1371/journal.pone.0122240 [DOI] [PMC free article] [PubMed] [Google Scholar]
- 45.Wake M, Baur LA, Gerner B, et al. Outcomes and costs of primary care surveillance and intervention for overweight or obese children: The LEAP 2 randomised controlled trial. BMJ. 2009;339(7730):1132. doi: 10.1136/bmj.b3308 [DOI] [PMC free article] [PubMed] [Google Scholar]
- 46.Janicke DM, Sallinen BJ, Perri MG, et al. Comparison of parent-only vs family-based interventions for overweight children in underserved rural settings: Outcomes from Project STORY. Arch Pediatr Adolesc Med. 2008;162(12):1119–1125. doi: 10.1001/archpedi.162.12.1119 [DOI] [PMC free article] [PubMed] [Google Scholar]
- 47.Kalavainen MP, Korppi MO, Nuutinen OM. Clinical efficacy of group-based treatment for childhood obesity compared with routinely given individual counseling. Int J Obes. 2007;31(10):1500–1508. doi: 10.1038/sj.ijo.0803628 [DOI] [PubMed] [Google Scholar]
- 48.Weigel C, Kokocinski K, Lederer P, Dötsch J, Rascher W, Knerr I. Childhood Obesity: Concept, Feasibility, and Interim Results of a Local Group-based, Long-term Treatment Program. J Nutr Educ Behav. 2008;40(6):369–373. doi: 10.1016/j.jneb.2007.07.009 [DOI] [PubMed] [Google Scholar]
- 49.Yackobovitch-Gavan M, Wolf Linhard D, Nagelberg N, et al. Intervention for childhood obesity based on parents only or parents and child compared with follow-up alone. Pediatr Obes. 2018;13(11):647–655. doi: 10.1111/ijpo.12263 [DOI] [PubMed] [Google Scholar]
- 50.Serra-Paya N, Ensenyat A, Castro-Vinuales I, et al. Effectiveness of a multi-component intervention for overweight and obese children (nereu program): A randomized controlled trial. PLoS One. 2015;10(12):1–14. doi: 10.1371/journal.pone.0144502 [DOI] [PMC free article] [PubMed] [Google Scholar]
- 51.Reinehr T, Schaefer A, Winkel K, Finne E, Toschke AM, Kolip P. An effective lifestyle intervention in overweight children: Findings from a randomized controlled trial on “ Obeldicks light.” Clin Nutr. 2010;29(3):331–336. doi: 10.1016/j.clnu.2009.12.010 [DOI] [PubMed] [Google Scholar]
- 52.Berntsen S, Mowinckel P, Carlsen KH, et al. Obese children playing towards an active lifestyle. Int J Pediatr Obes. 2010;5(1):64–71. doi: 10.3109/17477160902957166 [DOI] [PubMed] [Google Scholar]
- 53.Brennan L, Walkley J, Wilks R, Fraser SF, Greenway K. Physiological and behavioural outcomes of a randomised controlled trial of a cognitive behavioural lifestyle intervention for overweight and obese adolescents. Obes Res Clin Pract. 2013;7(1):e23–e41. doi: 10.1016/j.orcp.2012.02.010 [DOI] [PubMed] [Google Scholar]
- 54.Savoye M, Caprio S, Dziura J, et al. Reversal of early abnormalities in glucose metabolism in obese youth: Results of an intensive lifestyle randomized controlled trial. Diabetes Care. 2014;37(2):317–324. doi: 10.2337/dc13-1571 [DOI] [PMC free article] [PubMed] [Google Scholar]
- 55.Jiang JX, Xia XL, Greiner T, Lian GL, Rosenqvist U. A two year family based behaviour treatment for obese children. Arch Dis Child. 2005;90(12):1235–1238. doi: 10.1136/adc.2005.071753 [DOI] [PMC free article] [PubMed] [Google Scholar]
- 56.Vos RC, Wit JM, Pijl H, Houdijk ECAM. Long-term effect of lifestyle intervention on adiposity, metabolic parameters, inflammation and physical fitness in obese children: a randomized controlled trial. Nutr Diabetes. 2011;1(10):e9–e9. doi: 10.1038/nutd.2011.5 [DOI] [PMC free article] [PubMed] [Google Scholar]
- 57.Abraham AA, Chow WC, So HK, et al. Lifestyle intervention using an internet-based curriculum with cell phone reminders for obese Chinese teens: A randomized controlled study. PLoS One. 2015;10(5):1–16. doi: 10.1371/journal.pone.0125673 [DOI] [PMC free article] [PubMed] [Google Scholar]
- 58.Boodai SA, McColl JH, Reilly JJ. National Adolescent Treatment Trial for Obesity in Kuwait (NATTO): Project design and results of a randomised controlled trial of a good practice approach to treatment of adolescent obesity in Kuwait. Trials. 2014;15(1):1–6. doi: 10.1186/1745-6215-15-234 [DOI] [PMC free article] [PubMed] [Google Scholar]
- 59.Hofsteenge GH, Chinapaw MJM, Delemarre-van de Waal HA, Weijs PJM. Long-term effect of the Go4it group treatment for obese adolescents: A randomised controlled trial. Clin Nutr. 2014;33(3):385–391. doi: 10.1016/j.clnu.2013.06.002 [DOI] [PubMed] [Google Scholar]
- 60.Johnston CA, Tyler C, McFarlin BK, et al. Weight loss in overweight Mexican American children: A randomized, controlled trial. Pediatrics. 2007;120(6). doi: 10.1542/peds.2006-3321 [DOI] [PubMed] [Google Scholar]
- 61.Mameli C, Brunetti D, Colombo V, et al. Combined use of a wristband and a smartphone to reduce body weight in obese children: randomized controlled trial. Pediatr Obes. 2018;13(2):81–87. doi: 10.1111/ijpo.12201 [DOI] [PubMed] [Google Scholar]
- 62.Savoye M, Shaw M, Dziura J, et al. Effects of a weight management program on body composition and metabolic parameters in overweight children: A randomized controlled trial. J Am Med Assoc. 2007;297(24):2697–2704. doi: 10.1001/jama.297.24.2697 [DOI] [PubMed] [Google Scholar]
- 63.Chan DF, Nelson EA, Li AM, et al. Lifestyle intervention in obese Chinese adolescents with non-alcoholic fatty liver disease: a randomised controlled study. Hong Kong Med J = Xianggang yi xue za zhi. 2018;24(4):12–15. [PubMed] [Google Scholar]
- 64.Balagopal PB, Gidding SS, Buckloh LM, et al. Changes in circulating satiety hormones in obese children: A randomized controlled physical activity-based intervention study. Obesity. 2010;18(9):1747–1753. doi: 10.1038/oby.2009.498 [DOI] [PubMed] [Google Scholar]
- 65.Bonham MP, Dordevic AL, Ware RS, Brennan L, Truby H. Evaluation of a Commercially Delivered Weight Management Program for Adolescents. J Pediatr. 2017;185:73–80.e3. doi: 10.1016/j.jpeds.2017.01.042 [DOI] [PubMed] [Google Scholar]
- 66.Wang CL, Liang L, Fu JF, et al. Effect of lifestyle intervention on non-alcoholic fatty liver disease in Chinese obese children. World J Gastroenterol. 2008;14(10):1598–1602. doi: 10.3748/wjg.14.1598 [DOI] [PMC free article] [PubMed] [Google Scholar]
- 67.Díaz RG, Esparza-Romero J, Moya-Camarena SY, Robles-Sardín AE, Valencia ME. Lifestyle Intervention in Primary Care Settings Improves Obesity Parameters among Mexican Youth. J Am Diet Assoc. 2010;110(2):285–290. doi: 10.1016/j.jada.2009.10.042 [DOI] [PubMed] [Google Scholar]
- 68.Croker H, Viner RM, Nicholls D, et al. Family-based behavioural treatment of childhood obesity in a UK national health service setting: Randomized controlled trial. Int J Obes. 2012;36(1):16–26. doi: 10.1038/ijo.2011.182 [DOI] [PMC free article] [PubMed] [Google Scholar]
- 69.McCallum Z, Wake M, Gerner B, et al. Outcome data from the LEAP (Live, Eat and Play) trial: A randomized controlled trial of a primary care intervention for childhood overweight/mild obesity. Int J Obes. 2007;31(4):630–636. doi: 10.1038/sj.ijo.0803509 [DOI] [PubMed] [Google Scholar]
- 70.O’Connor TM, Hilmers A, Watson K, Baranowski T, Giardino AP. Feasibility of an obesity intervention for paediatric primary care targeting parenting and children: Helping HAND. Child Care Health Dev. 2013;39(1):141–149. doi: 10.1111/j.1365-2214.2011.01344.x [DOI] [PubMed] [Google Scholar]
- 71.Hughes AR, Stewart L, Chapple J, et al. Randomized, controlled trial of a best-practice individualized behavioral program for treatment of childhood overweight: Scottish childhood overweight treatment trial (SCOTT). Pediatrics. 2008;121(3). doi: 10.1542/peds.2007-1786 [DOI] [PubMed] [Google Scholar]
- 72.Boudreau ADA, Kurowski DS, Gonzalez WI, Dimond MA, Oreskovic NM. Latino families, primary care, and childhood obesity: A randomized controlled trial. Am J Prev Med. 2013;44(3 SUPPL. 3):S247–S257. doi: 10.1016/j.amepre.2012.11.026 [DOI] [PMC free article] [PubMed] [Google Scholar]
- 73.Rodearmel SJ, Wyatt HR, Stroebele N, Smith SM, Ogden LG, Hill JO. Small changes in dietary sugar and physical activity as an approach to preventing excessive weight gain: The America on the move family study. Pediatrics. 2007;120(4). doi: 10.1542/peds.2006-2927 [DOI] [PubMed] [Google Scholar]
- 74.Gillis D, Brauner M, Granot E. A community-based behavior modification intervention for childhood obesity. J Pediatr Endocrinol Metab. 2007;20(2):197–203. doi: 10.1515/JPEM.2007.20.2.197 [DOI] [PubMed] [Google Scholar]
- 75.Mitchell BM, Gutin B, Kapuku G, et al. Left ventricular structure and function in obese adolescents: relations to cardiovascular fitness, percent body fat, and visceral adiposity, and effects of physical training. Pediatrics. 2002;109(5). doi: 10.1542/peds.109.5.e73 [DOI] [PubMed] [Google Scholar]
- 76.Chulani VL, Gordon LP. Adolescent Growth and Development. Prim Care - Clin Off Pract. 2014;41(3):465–487. doi: 10.1016/j.pop.2014.05.002 [DOI] [PubMed] [Google Scholar]
- 77.Abreu AP, Kaiser UB. Pubertal development and regulation. Lancet Diabetes Endocrinol. 2016;4(3):254–264. doi: 10.1016/S2213-8587(15)00418-0 [DOI] [PMC free article] [PubMed] [Google Scholar]
- 78.Sanders RA. Adolescent psychosocial, social, and cognitive development. Pediatr Rev. 2013;34(8):354–359. doi: 10.1542/pir.34-8-354 [DOI] [PubMed] [Google Scholar]
- 79.Clayton JA. Applying the new SABV (sex as a biological variable) policy to research and clinical care. Physiol Behav. 2018;187(August 2017):2–5. doi: 10.1016/j.physbeh.2017.08.012 [DOI] [PubMed] [Google Scholar]
- 80.Crane MM, Jeffery RW, Sherwood NE. Exploring Gender Differences in a Randomized Trial of Weight Loss Maintenance. Am J Mens Health. 2017;11(2):369–375. doi: 10.1177/1557988316681221 [DOI] [PMC free article] [PubMed] [Google Scholar]
- 81.Aronica L, Rigdon J, Offringa LC, Stefanick ML, Gardner CD. Examining differences between overweight women and men in 12-month weight loss study comparing healthy low-carbohydrate vs. low-fat diets. Int J Obes. 2021;45(1):225–234. doi: 10.1038/s41366-020-00708-y [DOI] [PMC free article] [PubMed] [Google Scholar]
- 82.Trouwborst I, Goossens GH, Astrup A, Saris WHM, Blaak EE. Sexual dimorphism in body weight loss, improvements in cardiometabolic risk factors and maintenance of beneficial effects 6 months after a low-calorie diet: Results from the randomized controlled diogenes trial. Nutrients. 2021;13(5). doi: 10.3390/nu13051588 [DOI] [PMC free article] [PubMed] [Google Scholar]
- 83.Millward DJ, Truby H, Fox KR, Livingstone MBE, Macdonald IA, Tothill P. Sex differences in the composition of weight gain and loss in overweight and obese adults. Br J Nutr. 2014;111(5):933–943. doi: 10.1017/S0007114513003103 [DOI] [PubMed] [Google Scholar]
- 84.Rosenfeld CS. Sex-dependent differences in voluntary physical activity. J Neurosci Res. 2017;95(1–2):279–290. doi: 10.1002/jnr.23896 [DOI] [PMC free article] [PubMed] [Google Scholar]
- 85.Houle-Johnson SA, Kakinami L. Do sex differences in reported weight loss intentions and behaviours persist across demographic characteristics and weight status in youth? A systematic review. BMC Public Health. 2018;18(1):1–17. doi: 10.1186/s12889-018-6179-x [DOI] [PMC free article] [PubMed] [Google Scholar]
- 86.Armstrong S, Wong CA, Perrin E, Page S, Sibley L, Skinner A. Association of physical activity with income, race/ethnicity, and sex among adolescents and young adults in the United States findings from the national health and nutrition examination survey, 2007–2016. JAMA Pediatr. 2018;172(8):732–740. doi: 10.1001/jamapediatrics.2018.1273 [DOI] [PMC free article] [PubMed] [Google Scholar]
- 87.Stoner L, Beets MW, Brazendale K, Moore JB, Weaver RG. Exercise Dose and Weight Loss in Adolescents with Overweight–Obesity: A Meta-Regression. Sport Med. 2019;49(1):83–94. doi: 10.1007/s40279-018-01040-2 [DOI] [PubMed] [Google Scholar]
- 88.Deldin A, Kuk JL, Lee S. Influence of sex on the changes in regional fat and skeletal muscle mass in response to exercise training in adolescents with obesity. Child Obes. 2019;15(3):216–222. doi: 10.1089/chi.2018.0329 [DOI] [PMC free article] [PubMed] [Google Scholar]
- 89.Lee SJ, Deldin AR, White D, et al. Aerobic exercise but not resistance exercise reduces intrahepatic lipid content and visceral fat and improves insulin sensitivity in obese adolescent girls: A randomized controlled trial. Am J Physiol - Endocrinol Metab. 2013;305(10):1222–1229. doi: 10.1152/ajpendo.00285.2013 [DOI] [PMC free article] [PubMed] [Google Scholar]
- 90.Lawler M, Heary C, Nixon E. Variations in adolescents’ motivational characteristics across gender and physical activity patterns: A latent class analysis approach. BMC Public Health. 2017;17(1):1–13. doi: 10.1186/s12889-017-4677-x [DOI] [PMC free article] [PubMed] [Google Scholar]
- 91.Fryar CD, Carroll MD, Ahluwalia N, Ogden CL. Fast Food Intake Among Children and Adolescents in the United States, 2015–2018. NCHS Data Brief. 2020;(375):1–8. [PubMed] [Google Scholar]
- 92.Cooke LJ, Wardle J. Age and gender differences in children’s food preferences. Br J Nutr. 2005;93(5):741–746. doi: 10.1079/bjn20051389 [DOI] [PubMed] [Google Scholar]
- 93.Caine-Bish NL, Scheule B. Gender Differences in Food Preferences of School-Aged Children and Adolescents. J Sch Health. 2009;79(11):532–540. doi: 10.1111/j.1746-1561.2009.00445.x [DOI] [PubMed] [Google Scholar]
- 94.Rosinger A, Herrick K, Gahche J, Park S. Sugar-sweetened Beverage Consumption Among. Natl Cent Heal Stat. 2017;(271):1–8. [Google Scholar]
- 95.Keller KL, Kling SMR, Fuchs B, et al. A biopsychosocial model of sex differences in children’s eating behaviors. Nutrients. 2019;11(3). doi: 10.3390/nu11030682 [DOI] [PMC free article] [PubMed] [Google Scholar]
- 96.Shah B, Tombeau Cost K, Fuller A, Birken CS, Anderson LN. Sex and gender differences in childhood obesity: Contributing to the research agenda. BMJ Nutr Prev Heal. 2020;3(2):387–390. doi: 10.1136/bmjnph-2020-000074 [DOI] [PMC free article] [PubMed] [Google Scholar]
- 97.Kim K, Lee Y. Family-based child weight management intervention in early childhood in low-income families: A systematic review. J Child Heal Care. 2020;24(2):207–220. doi: 10.1177/1367493519847036 [DOI] [PubMed] [Google Scholar]
- 98.Gorga E, Regazzoni V, Bansilal S, et al. School and family-based interventions for promoting a healthy lifestyle among children and adolescents in Italy: A systematic review. J Cardiovasc Med. 2016;17(8):547–555. doi: 10.2459/JCM.0000000000000404 [DOI] [PubMed] [Google Scholar]
- 99.Steinbeck KS, Lister NB, Gow ML, Baur LA. Treatment of adolescent obesity. Published online 2018. doi: 10.1038/s41574-018-0002-8 [DOI] [PubMed] [Google Scholar]
- 100.Vanderwall C, Randall Clark R, Eickhoff J, Carrel AL. BMI is a poor predictor of adiposity in young overweight and obese children. BMC Pediatr. 2017;17(1). doi: 10.1186/s12887-017-0891-z [DOI] [PMC free article] [PubMed] [Google Scholar]
- 101.Paluch RA, Epstein LH, Roemmich JN. Comparison of methods to evaluate changes in relative body mass index in pediatric weight control. Am J Hum Biol. 2007;19(4):487–494. doi: 10.1002/ajhb.20608 [DOI] [PubMed] [Google Scholar]
Associated Data
This section collects any data citations, data availability statements, or supplementary materials included in this article.