Key Points
-
•
Using whole-genome sequencing and RNA-seq, we characterized the genomic landscape of 295 DS-ALL cases and identified 15 distinct subtypes.
-
•
DS-ALL exhibits marked enrichment of RAG-mediated and C/EBP gene alterations and inferior outcomes in BCR::ABL1-like CRLF2-r cases.
Visual Abstract
Abstract
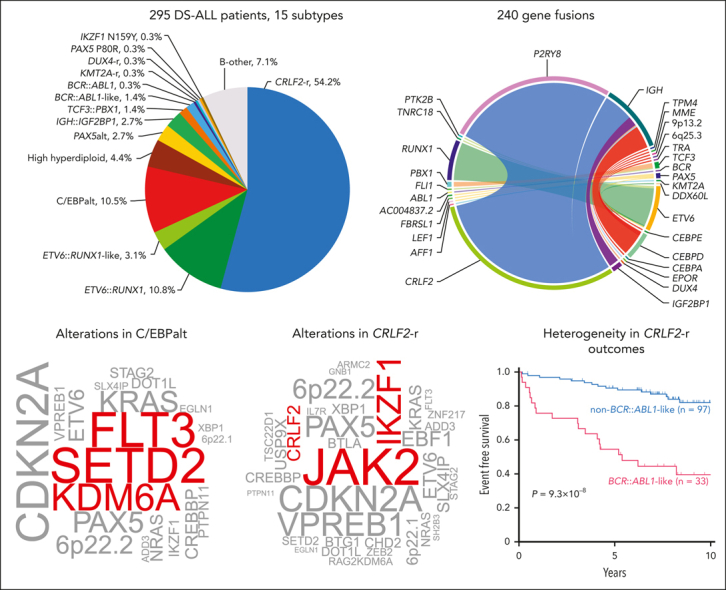
Trisomy 21, the genetic cause of Down syndrome (DS), is the most common congenital chromosomal anomaly. It is associated with a 20-fold increased risk of acute lymphoblastic leukemia (ALL) during childhood and results in distinctive leukemia biology. To comprehensively define the genomic landscape of DS-ALL, we performed whole-genome sequencing and whole-transcriptome sequencing (RNA-Seq) on 295 cases. Our integrated genomic analyses identified 15 molecular subtypes of DS-ALL, with marked enrichment of CRLF2-r, IGH::IGF2BP1, and C/EBP altered (C/EBPalt) subtypes compared with 2257 non–DS-ALL cases. We observed abnormal activation of the CEBPD, CEBPA, and CEBPE genes in 10.5% of DS-ALL cases via a variety of genomic mechanisms, including chromosomal rearrangements and noncoding mutations leading to enhancer hijacking. A total of 42.3% of C/EBP-activated DS-ALL also have concomitant FLT3 point mutations or insertions/deletions, compared with 4.1% in other subtypes. CEBPD overexpression enhanced the differentiation of mouse hematopoietic progenitor cells into pro-B cells in vitro, particularly in a DS genetic background. Notably, recombination-activating gene–mediated somatic genomic abnormalities were common in DS-ALL, accounting for a median of 27.5% of structural alterations, compared with 7.7% in non–DS-ALL. Unsupervised hierarchical clustering analyses of CRLF2-rearranged DS-ALL identified substantial heterogeneity within this group, with the BCR::ABL1-like subset linked to an inferior event-free survival, even after adjusting for known clinical risk factors. These results provide important insights into the biology of DS-ALL and point to opportunities for targeted therapy and treatment individualization.
Children with Down syndrome (DS) have a 20 times higher risk of developing acute lymphoblastic leukemia (ALL). Li et al report on comprehensive genomic and transcriptomic analyses of 295 patients with DS-ALL, identifying 15 distinct molecular subtypes, 3 of which have a much higher frequency in DS-ALL compared to ALL in children without DS. For a common specific subset of BCR::ABL1-like ALL, patients with DS have inferior outcomes to children without DS. These data highlight unexpected genomic heterogeneity and reinforce opportunities for use of targeted therapies.
Introduction
Down syndrome (DS), which results from partial or complete trisomy 21, is the most common genetic syndrome, affecting 1 in 707 live births in the United States.1 It is associated with conditions affecting multiple organ systems, including neurocognitive deficits, congenital heart defects, gastrointestinal abnormalities, and hematologic disorders. Individuals with DS have a 20-fold increased risk of developing acute lymphoblastic leukemia (ALL),2 although the molecular basis for this risk remains unclear.
Trisomy 21 has significant effects on fetal hematopoiesis, leading to increased hematopoietic stem cell frequency and a blockade in B-cell differentiation.3 Numerous lines of evidence support the proleukemogenic effect of genes on chromosome 21, including universal somatic gain of this chromosome in high hyperdiploid ALL4; and intrachromosomal amplification of chromosome 21 in 2% of ALL. Clinically, DS-ALL is associated with poorer outcomes, including a higher risk of relapse,5, 6, 7 with a survival rate that is 10% to 20% lower than in non–DS-ALL, and an increased risk of treatment-related toxicities and late effects of therapy.5, 6, 7
The genetic context of DS-ALL suggests a distinct process of leukemogenesis, and there is growing supporting evidence from both germline and somatic genomic studies of DS-ALL. In terms of germline genetic susceptibility, we reported differences in the penetrance of ALL risk loci in DS vs non–DS-ALL, with a greater magnitude of effect size, particularly for the CDKN2A locus.8 For somatic alterations, DS-ALL is most notable for a higher proportion of cases with CRLF2 rearrangements and JAK2 mutations, constituting ∼50% of DS-ALL vs only ∼7% of non–DS-ALL.9, 10, 11, 12 Other sentinel genomic alterations in non–DS-ALL (eg, ETV6::RUNX1, high hyperdiploidy) are less common in DS-ALL than in non–DS-ALL, and T-cell ALL almost never occurs in children with DS. Building upon these findings, we sought to definitively characterize the genomic landscape of DS-ALL by performing whole-genome and whole-transcriptome sequencing on a cohort of 295 DS-ALL cases compared with a reference group of 2257 non–DS-ALL cases.13 Our integrated genomic analyses systematically mapped sequence mutations, copy number alterations, and structural alterations (eg, fusion genes) and identified those enriched in DS-ALL, defining a total of 15 molecular subtypes. We investigated the functional consequences of DS-ALL–associated CEBPD alterations in a DS genetic background. Finally, we evaluated somatic genomic features for association with treatment outcomes in DS-ALL, which suggests potential strategies to individualize ALL therapy and improve survival in this high-risk population.
Methods
Patients, materials, and treatment protocols
Bone marrow or peripheral blood samples from 295 children, adolescents, and young adults (age 1-30 years; supplemental Table 1; available on Blood website) with DS-ALL were used for this study. Patients were enrolled in Children’s Oncology Group (COG) trials 9904 (ClinicalTrials.gov identifier NCT00005585), 9905 (NCT00005596), 9906 (NCT00005603), AALL0232 (NCT00075725), AALL0331 (NCT00103285), AALL08B1 (NCT01142427), AALL0932 (NCT01190930), AALL1131 (NCT02883049), AALL1731 (NCT03914625), and APEC14B1 (NCT02402244). The samples were obtained with informed consent in accordance with the Declaration of Helsinki, and this study was approved by the institutional review board at St. Jude Children’s Research Hospital and Baylor College of Medicine.
To compile a non–DS-ALL genomic data set as the reference, we used the recently published pediatric ALL genomic landscape study13 by Brady et al because 1) this is one of the largest cohorts with 2754 cases and 2) it consists of mostly cases from North America (eg, COG frontline ALL trials) and is thus comparable with the DS-ALL subjects. After removing T-ALL and DS-ALL cases, a total of 2257 patients (aged 0-30 years) were retained for comparison with DS-ALL.
Whole-genome and RNA sequencing and data processing
Whole-genome sequencing (WGS) libraries (n = 244 leukemia-germline pairs; supplemental Figure 1) were constructed using Kapa Hyperprep library preparation kit (Roche) and sequenced on the NovaSeq platform (Illumina), with a targeted coverage of 30× for germline samples and 60× for leukemic samples and a read length of 2 × 151. RNA-Seq libraries (n = 249 leukemia samples) were prepared using TruSeq stranded total RNA kit (Illumina) and sequenced using the NovaSeq platform with a read length of 2 × 101. WGS and RNA-Seq data analyses are detailed in the supplement.
Integrative subtype classification
Subtype classification (outlined in supplemental Figure 2) was performed based on gene fusion/rearrangement (CRLF2-r, ETV6::RUNX1, IGH::IGF2BP1, TCF3::PBX1, KMT2A-r, BCR::ABL1, and DUX4-r), gene expression (ETV6::RUNX1-like, BCR::ABL1-like, and PAX5alt), digital karyotyping based on RNA-Seq and/or WGS (high hyperdiploid), and somatic mutation (PAX5 P80R and IKZF1 N159Y). The CCAAT/enhancer-binding protein (C/EBP)–altered (C/EBPalt) subtype was classified by using both gene rearrangement (for CEBPD-rearranged) and gene expression analysis (for other C/EBPalt). Within the CRLF2-r subtype, BCR::ABL1-like and non–BCR::ABL1-like were classified by unsupervised hierarchical clustering, and results were compared with those obtained by supervised classification using predicted analysis of microarrays (PAM)14 or a varied number of genes in hierarchical clustering. Details of subtype calling are provided in supplemental Methods.
Mutation signature analysis
Mutational signatures were profiled by fitting single-nucleotide variant (SNV) counts per 96 trinucleotide context to the COSMIC signatures (version 3.0 and SBS86, SBS87)15,16 using the SigProfiler Matlab package.16 Signatures that appeared in >2% of the samples were included in the summary plot.
Recombination-activating gene (RAG)–mediated structural alteration analysis
The sequences adjacent to the V, D, and J gene segments of IGH, IGK, IGL, TRA, TRB, TRD, and TRG loci were extracted from GENCODE v39 coordinates, and recombination signal sequences (RSSs) were identified and compiled into probability matrices of the 2 motifs with a 12 bp or 23 bp spacer. FIMO17 was used to match the motifs to the sequences that flank ±50 bp of the 2 ends of the structural alterations. A structural alteration was considered RSS-mediated if the flanking sequences matched either of the 2 motifs with a P value <10-4.
Mice, CEBPD transduction, and single-cell RNA-Seq
B6.129S7-Dp(16Lipi-Zbtb21)1Yey/J (Dp16) and wild-type (WT) mice were purchased from The Jackson Laboratory (Bar Harbor, ME) and genotyped as previously described.18 All animal experiments were approved by the Baylor College of Medicine Institutional Animal Care and Use Committee. WT and Dp16 hematopoietic progenitor cells (HPCs) were transduced with CEBPD or control vectors and cocultured with OP9 cells for 14 days, after which single-cell RNA-Seq (scRNA-Seq) was performed. Details for transduction and scRNA-Seq are available in the supplement.
Statistical analysis
Unless otherwise stated, statistical analyses were performed using R version 4.1.1 on Windows; associations between categorical variables were tested using 2-sided Fisher exact test, and the association between a continuous variable and a categorical variable was tested using Kruskal-Wallis test (for >2 categories) or 2-sided Mann-Whitney U test (for 2 categories). Bonferroni adjustment was used to control for multiple testing with a family-wise error rate of <0.05. Event-free survival (EFS) and overall survival (OS) were evaluated using Kaplan-Meier estimator and compared using log-rank test. The standard deviation of EFS or OS was estimated using Greenwood’s methods.
Results
Subtype classification of DS-ALL
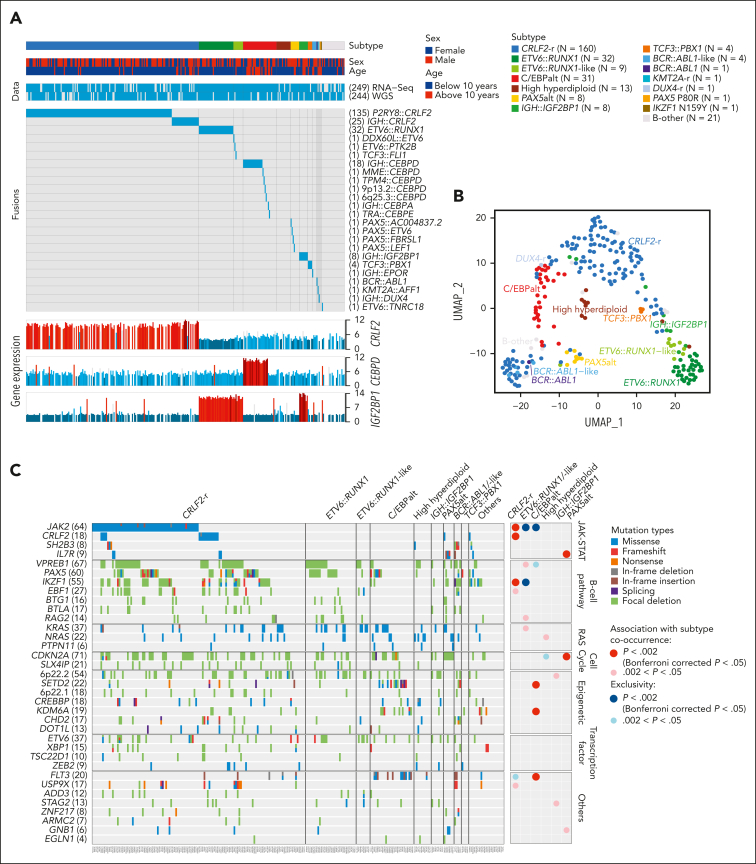
In 295 children with Down syndrome and newly diagnosed B-cell ALL (DS-ALL), we performed WGS of leukemia and germline samples (n = 244 pairs) and RNA-Seq of leukemia samples (n = 249; supplemental Figure 1). Integrated subtype classification was performed using applicable genomic profiling data based on gene expression from RNA-Seq, sequence mutations by paired WGS, along with digital karyotyping and fusion gene detection by both platforms (supplemental Figure 2). Taken together, we identified 15 molecular subtypes in DS-ALL (Figure 1A), as visualized using the uniform manifold approximation and projection tool (UMAP; Figure 1B). Inter- or intrachromosomal rearrangement of the CRLF2 gene (with IGH or P2RY8, respectively) was the most frequent genomic abnormality in DS-ALL and defined the largest molecular subtype, accounting for 54.2% of cases (n = 25 and n = 135 for IGH::CRLF2 and P2RY8::CRLF2, respectively). These structural alterations resulted in marked overexpression of CRLF2 (Figure 1A), consistent with prior reports.10,12,19 Eleven other established ALL subtypes were observed in this cohort, including ETV6::RUNX1 (10.8%; n = 32), high hyperdiploid (4.4%; n = 13), ETV6::RUNX1-like (3.1%; n = 9), PAX5alt (2.7%; n = 8), BCR::ABL1-like (1.4%; n = 4), TCF3::PBX1 (1.4%; n = 4), BCR::ABL1 (0.3%; n = 1), KMT2A-r (0.3%; n = 1), DUX4-r (0.3%; n = 1), PAX5 P80R (0.3%; n = 1), and IKZF1 N159Y (0.3%; n = 1).
Figure 1.
Transcriptomic and genomic landscape of DS-ALL. (A) Subtype classification of 295 DS-ALL cases with available RNA-Seq or paired tumor-germline WGS data. Each column represents a patient, and each row represents a feature, including sex, age, availability of data, rearrangements, and expression of CRLF2, CEBPD, and IGF2BP1. The patients are ordered according to subtypes. In 2 cases with CEBPD overexpression, chromosomal rearrangements of CEBPD locus to intergenic regions of 9p13.2 (between PAX5 and ZCCHC7) and 6q25.3 (∼380 kb upstream ARID1B) were identified. As no fusion transcript was identified by RNA-Seq, these rearrangements are denoted as 9p13.2::CEBPD and 6q25.3::CEBPD. (B) Gene expression of 249 DS-ALL cases visualized by UMAP. Top 100 genes with the highest median absolute deviation were used to generate this 2-dimensional UMAP. Subtypes are shown in different colors. (C) Genomic alterations in 244 DS-ALL cases. The cases are ordered by subtypes, as indicated above the panel. Only genes significantly altered in DS-ALL are included.
In patients with paired leukemia-germline WGS data (n = 244), we systematically examined somatic SNVs, short insertions and deletions (indels), and focal copy number alterations (CNAs). Overall, there was a median of 14 nonsynonymous SNVs/indels (range 0-164) in coding regions per patient. Using MutSigCV (for SNV/indel)20 and GISTIC2.0 (for CNA),21 a total of 35 genes were found to be significantly altered in DS-ALL (Figure 1C; supplemental Table 2). Genomic aberrations in 8 genes were significantly associated with specific subtypes (Bonferroni corrected P < .05; Figure 1C; supplemental Table 3), among which the strongest association was found for JAK2 alterations, occurring in 50.0% of CRLF2-r and completely absent in other subtypes (P = 1.6 × 10⁻²¹, corrected for multiple testing). IKZF1 alterations were also enriched in CRLF2-r DS-ALL: 31.3% compared with 12.9% in cases without CRLF2-r (P = .024, corrected for multiple testing). In addition, we observed recurrent mutations in the CRLF2 gene, occurring almost always in cases with CRLF2 rearrangements (12.5% compared with 1.7% in the rest of the cohort; P = .039; corrected for multiple testing). In the 16 CRLF2-r cases with CRLF2 point mutations, all but 1 harbored the p.F232C mutation. Because the mutant CRLF2 was preferentially expressed relative to the WT allele based on leukemia RNA-Seq, we postulate that the p.F232C mutation almost always occurs on the rearranged allele (supplemental Figure 3). KRAS and NRAS mutations occurred in 22.5% of DS-ALL cases, and the frequency did not differ significantly among cases with vs without CRLF2-r, nor among CRLF2-r cases with vs without JAK2 mutations.
IGH::IGF2BP1 rearrangements are enriched in DS-ALL
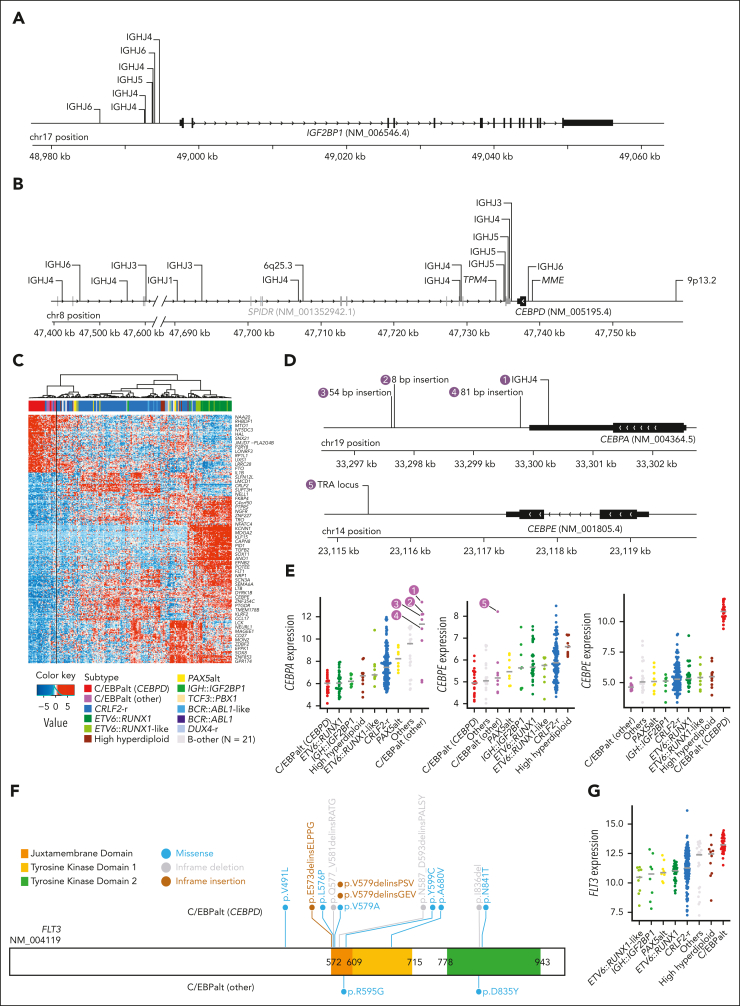
We identified IGH::IGF2BP1 rearrangements in 8 patients with DS-ALL(2.7%). In all instances, the rearrangement juxtaposed the upstream region of the IGF2BP1 gene to an IGHJ gene segment near an RSS, suggesting that the events were mediated by RAGs (Figure 2A). The rearrangements positioned IGF2BP1 in proximity to the IGH enhancer, resulting in the deregulated expression of IGF2BP1 (Figure 1A). IGF2BP1 was also highly expressed in ETV6::RUNX1 and ETV6::RUNX1-like ALL,22 because of the loss of ETV6, a transcription repressor of IGF2BP1. IGF2BP1-r did not give rise to a characteristic global expression pattern (Figure 1B).
Figure 2.
Genomics of IGH::IGF2BP1 and C/EBPalt DS-ALL. Positions and rearrangement partners of (A) IGF2BP1 and (B) CEBPD rearrangements, as identified by paired WGS data. For IGH::IGF2BP1 and IGH::CEBPD rearrangements, the specific IGH gene segments that CEBPD rearranged to are shown, all of which are IGHJ gene segments. (C) Hierarchical clustering identified 8 cases with similar gene expression signature to CEBPD-r DS-ALL, indicated as C/EBPalt (other) with purple color in the top bar denoting sample subtypes. (D) Mapping of CEBPA and CEBPE alterations in 5 C/EBPalt cases. (E) Comparison of expression of CEBPA, CEBPE, and CEBPD genes among DS-ALL subtypes. The 5 cases with CEBPA- or CEBPE-related genomic alterations in panel D are marked by numbers. (F) Lollipop plot showing the location of FLT3 alterations in C/EBPalt DS-ALL. Most of the FLT3 alterations are in the juxtamembrane domain or the second tyrosine kinase domain. (G) FLT3 is highly expressed in the C/EBPalt subtype.
Alterations of C/EBP family genes in DS-ALL
In 22 (7.5%) DS-ALL cases, we identified CEBPD rearrangements with a variety of partners, including IGH (n = 18), MME (n = 1), TPM4 (n = 1), 9p13.2 (n = 1), and 6q25.3 (n = 1). These samples were characterized by marked overexpression of the CEBPD gene (Figure 1A) and shared a distinctive gene expression signature (Figure 1B). In all cases, the CEBPD exon was preserved (Figure 2B), with 84.2% of the rearrangement break points downstream of CEBPD, mostly within the adjacent gene SPIDR. Less frequently, rearrangement occurred upstream of CEBPD (n = 3). When CEBPD was rearranged to the IGH locus (N = 15), the junctions were located near RSS, pointing to RAG-mediated recombination.
Using the top 400 differentially expressed genes between CEBPD-r ALL and other ALL subtypes, we performed hierarchical clustering and identified 8 samples that clustered in the same branch as CEBPD-r but lacked CEBPD rearrangements (Figure 2C). Interestingly, 7 of these 8 cases harbored alterations in other members of the C/EBP gene family (Figure 2D-E): six showed overexpression of CEBPA (Figure 2E), with IGH::CEBPA translocation or insertions downstream of CEBPA identified in 1 and 3 cases, respectively (Figure 2D); Of the remaining 2 cases, 1 had CEBPE overexpression driven by TRA translocation (Figure 2D), whereas the other showed no aberrant expression of C/EBP genes (Figure 2E). Notably, of all cases in this cluster with informative genetic markers at the C/EBP gene loci (eg, polymorphic variants in the coding region), we consistently observed evidence of allelic expression, pointing to noncoding regulatory elements acting in cis (supplemental Figure 4). C/EBP gene alterations were also mutually exclusive in these cases (Figure 2E), indicating overlapping effects on ALL pathogenesis. Taken together, we classified this entire cluster of 31 cases (ie, those with CEBPD-r and those clustering with them based on gene expression profile) as a single subtype named C/EBPalt because of the striking enrichment of somatic alterations affecting different members of the C/EBP gene family.
C/EBPalt ALL also exhibited a characteristic mutational landscape, with an overrepresentation of genomic abnormalities in the SETD2, KDM6A, and FLT3 genes (Figure 1C). SETD2 alterations were identified in 42.3% (n = 11) of these cases but only 5.0% (n = 11) in other subtypes (P = 2.7 × 10⁻⁵; corrected for multiple testing). KDM6A alterations, mostly in the form of focal deletions, were present in 30.8% (n = 8) of the C/EBPalt cases, compared with 5.0% (n = 11) in the rest of the cohort (P = 6.8 × 10⁻³; corrected for multiple testing). FLT3 mutations were enriched over 10-fold (42.3% vs 4.1%; P = 7.2 × 10⁻⁶, corrected for multiple testing), with nearly half being in-frame indels in the juxtamembrane domain or the second tyrosine kinase domain (Figure 2F). This is consistent with known gain-of-function FLT3 mutations in leukemia.23,24 In addition, regardless of FLT3 mutation status (supplemental Figure 5), FLT3 expression was highest in C/EBPalt DS-ALL (P = 6.7 × 10⁻¹⁴; Figure 2G).
CEBPD overexpression and trisomy 21 enhance differentiation to the pro-B stage
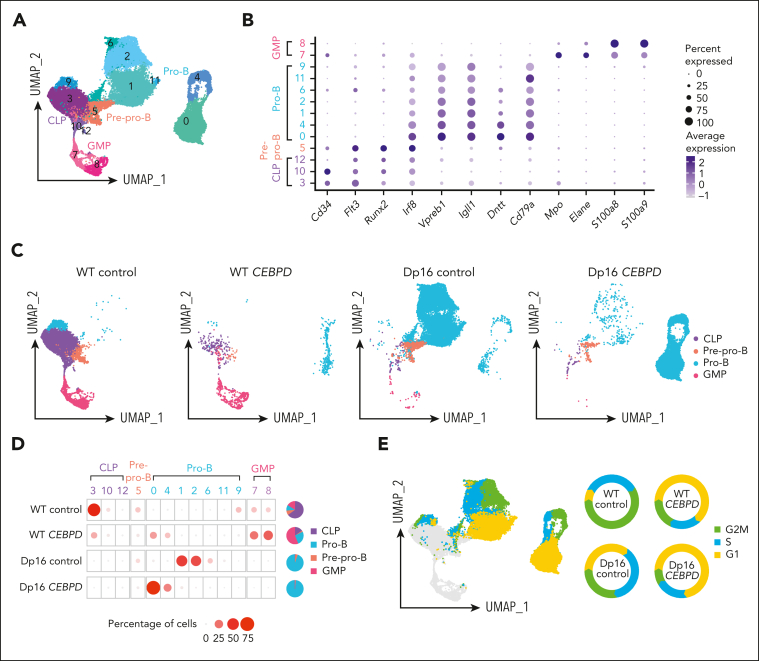
To assess the impact on hematopoiesis of the most frequent C/EBP gene rearranged, CEBPD, we performed a series of in vitro differentiation experiments using the Dp16(1)Yey (Dp16) mouse model of Down syndrome, which has triplication of ∼115 human chromosome 21 orthologues and recapitulates common DS phenotypes, and littermate control WT mice.25,26 We first transduced WT and Dp16 HPCs with CEBPD or control vectors, which were then cocultured with OP9 cells in vitro to allow differentiation along the B-lineage, and the identity of each cell population was analyzed by scRNA-Seq. After quality control, a total of 35 854 cells were retained for analysis (supplemental Table 4), which were divided into 13 clusters based on gene expression (Figure 3A). Each cluster was then assigned as common lymphoid progenitor (CLP), pre–pro-B, pro-B, or granulocyte macrophage progenitor (GMP) cells by aligning with scRNA-Seq data of defined murine hematopoietic compartments (marker genes shown in Figure 3B).27 With OP9 coculture, most cells in the WT control group demonstrated a CLP immunophenotype (64.9%). Overexpression of CEBPD in WT HPCs increased B-lineage differentiation (28.8% in WT CEBPD compared with 18.9% in WT control; Figure 3C-D) and also led to a marked increase in myeloid lineage differentiation (56.0% compared with 11.1%, respectively; Figure 3C-D). By contrast, Dp16 control HPCs predominantly differentiated into pro-B cells (94.1%), pointing to significant effects of the DS genetic context on B-cell development. CEBPD overexpression in Dp16 HPCs did not induce myeloid differentiation but instead resulted in a persistent predominance of pro-B cells (98.0%; Figure 3C-D). The marked differences across these 4 conditions suggest baseline differences in lineage differentiation propensities between Dp16 and WT HPCs and an interaction between CEBPD overexpression and DS in deregulating hematopoiesis.
Figure 3.
CEBPD overexpression and a DS genetic background contribute to differentiation to the pro-B stage demonstrated using scRNA-Seq of CEBPD and control transduced WT and Dp16 murine cells. (A) UMAP projection and clustering of cells from all 4 conditions. (B) Expression of hematopoietic differentiation marker genes assigned the 13 clusters to 4 cell types. (C) UMAP projection and cell differentiation stage of the 4 conditions. (D) The frequencies of each cell type in the clusters across the 4 conditions. (E) Cell cycle analysis of the cells and the percentages of pro-B cells in each cell cycle phase across the 4 experimental conditions.
We also evaluated the cell cycle distribution of HPC-derived pro-B cells, dividing them into cycling and noncycling pro-B cells, and noted substantial heterogeneity across the 4 conditions (Figure 3E). CEBPD overexpression resulted in an increased proportion of noncycling pro-B cells (G1 phase) in both Dp16 HPCs (increased from 34.9% to 71.9%) and WT HPCs (increased from 7.1% to 63.1%). This implies that CEBPD overexpression may promote expansion of a noncycling pro-B–stage cell population. The functional consequences and underlying mechanisms of these differential effects of CEBPD require further investigation.
Heterogeneity in CRLF2-rearranged DS-ALL
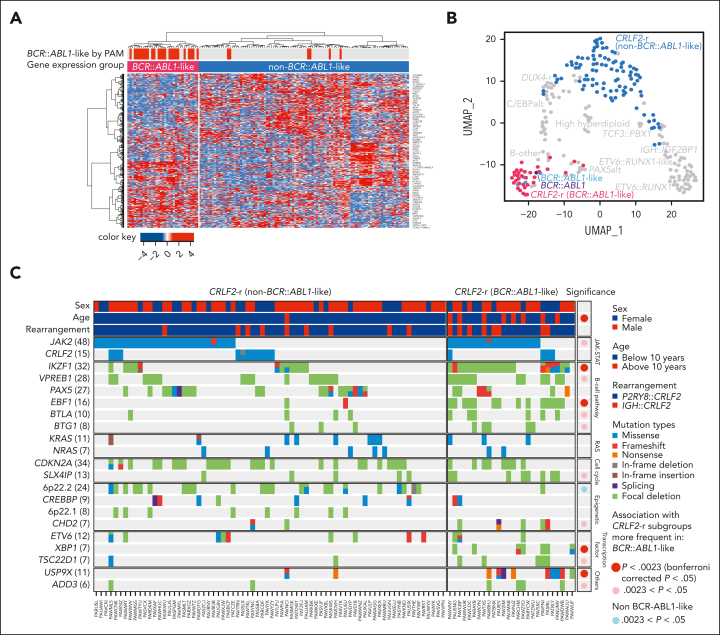
The large size of our cohort permitted additional characterization of CRLF2-r cases, the most frequent genomic subtype in DS-ALL. Unsupervised hierarchical clustering of CRLF2-r DS-ALL identified 2 subgroups with distinct gene expression profiles (Figure 4A-B). Some 25.4% of the cases (n = 33) clustered closely with BCR::ABL1 ALL and thus were classified as BCR::ABL1-like (also known as Ph-like).28,29 The remaining CRLF2-r cases (74.6%, n = 97) were classified as non–BCR::ABL1-like CRLF2-r ALL. Similar results were obtained when we varied the number of genes used in clustering (supplemental Figure 6). Both groups showed similar degrees of CRLF2 overexpression (supplemental Figure 7A). IGH::CRLF2 rearrangements were slightly more common in the BCR::ABL1-like subtype than in the non–BCR::ABL1-like subtype (24.2% vs 13.4%; P = .17; supplemental Figure 7B).
Figure 4.
Heterogeneity of CRLF2-r DS-ALL. (A) Unsupervised hierarchical clustering of 130 CRLF2-r DS-ALL samples with RNA-Seq data identified a unique group of cases with BCR::ABL1-like gene expression signatures. BCR::ABL1-like classification by PAM based on non–DS-ALL data is indicated by red bars above the heatmap. (B) Projecting the BCR::ABL1-like and non–BCR::ABL1-like CRLF2-r subtypes to UMAP shows that BCR::ABL1-like CRLF2-r cases cocluster with BCR::ABL1 and non-CRLF2-r BCR::ABL1-like, and are distinct from non–BCR::ABL1-like CRLF2-r. (C) Genomic alterations in BCR::ABL1-like and non–BCR::ABL1-like CRLF2-r subgroups. Genes altered in >6% of CRLF2-r DS-ALL are shown.
Somatic alterations in CRLF2-r ALL differed markedly between the BCR::ABL1-like and non–BCR::ABL1-like subtypes (Figure 4C; supplemental Table 5), with IKZF1 (76.9% vs 16.7%), XBP1 (26.9% vs 0%), USP9X (34.6% vs 2.8%) alterations, and EBF1 deletions (53.8% vs 2.8%) overrepresented in the former. These data suggest that BCR::ABL1-like and non–BCR::ABL1-like are distinctive subentities of CRLF2-r ALL.
Comparison with non–DS-ALL
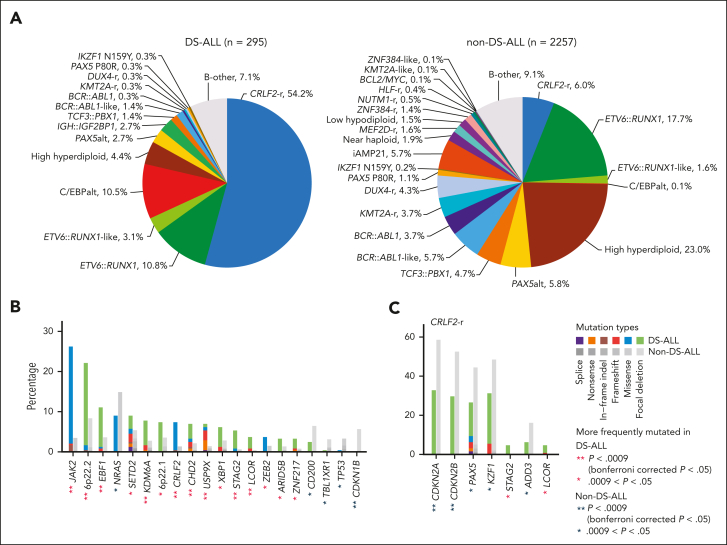
To identify genomic features unique to DS-ALL, we compiled a non–DS-ALL data set (age <30 years; hereafter referred to as non–DS-ALL) of 2257 cases using a recently published pediatric B-ALL genomic landscape study,13 to compare subtype, age, and genomic alterations. The spectrum of DS-ALL genetic subtypes was distinctly different from that of non–DS-ALL (Figure 5A). In DS-ALL, the frequency of the CRLF2-rearrangements was 9 times higher than in non–DS-ALL (54.2% vs 6.0%; P = 4.3 × 10–88; Figure 5A). Only 25.4% of DS-ALL CRLF2-r cases were classified as BCR::ABL1-like compared with 54.4% of CRLF2-r non–DS-ALL (P = 1.7 × 10⁻⁶; supplemental Figure 8A), and the P2RY8::CRLF2 intrachromosomal rearrangement was significantly more frequent in DS-ALL than the IGH translocation (P = 2.7 × 10⁻⁷; supplemental Figure 8B). We identified an additional 8 subtypes with significantly different frequencies between DS-ALL and non–DS-ALL (Bonferroni corrected P < .05; supplemental Table 6): C/EBPalt and IGH::IGF2BP1 subtypes were highly enriched in the DS-ALL cohort, whereas high hyperdiploid, BCR::ABL1-like, BCR::ABL1, KMT2A-r, DUX4-r, and iAMP21 subtypes were underrepresented in DS-ALL compared with non–DS-ALL.
Figure 5.
Comparisons between DS-ALL and non–DS-ALL. (A) Frequencies of genetic subtypes of DS-ALL and non–DS-ALL. (B-C) Comparison of the frequencies of gene alterations in DS-ALL and non–DS-ALL in (B) all the subtypes and (C) CRLF2-r only. A total of 51 genes altered in more than 3% in either DS-ALL or non–DS-ALL data are compared and only genes with nominal P < .05 are shown. Comparisons were also performed within ETV6::RUNX1 and high hyperdiploid subtypes and no gene with Bonferroni corrected P < .05 was identified.
Age at diagnosis did not differ between DS-ALL and non–DS-ALL for most subtypes except CRLF2-r (supplemental Figure 9A). Patients with DS with CRLF2-r ALL were approximately 5 years younger than patients without DS-ALL (median 3.8 vs 9.0 years; P = 6.8 × 10⁻⁹). This could be partially explained by the overrepresentation of P2RY8::CRLF2 translocations in DS-ALL, which were associated with younger age (supplemental Figure 9B). However, even after controlling for the CRLF2 rearrangement partner, DS was still independently associated with a younger age at diagnosis in CRLF2-r ALL (P = 3.7 × 10⁻⁶, supplemental Figure 8D). Within DS-ALL, IGH rearrangements were generally associated with older age (P = 9.7 × 10⁻¹¹, supplemental Figure 10).
We also compared the frequencies of recurrent mutations and CNAs in DS-ALL vs non–DS-ALL and identified 9 genes significantly overrepresented and 1 gene significantly underrepresented in DS-ALL (Bonferroni corrected P < .05; Figure 5B). However, most of these differences were driven by the differential composition of ALL subtypes. When compared within the CRLF2-r subtype, CDKN2A/B was less frequently altered in CRLF2-r DS-ALL than in non–DS-ALL (32.8% vs 58.6%; P = 7.6 × 10⁻³; corrected for multiple testing; Figure 5C).
Mutation signatures in DS-ALL
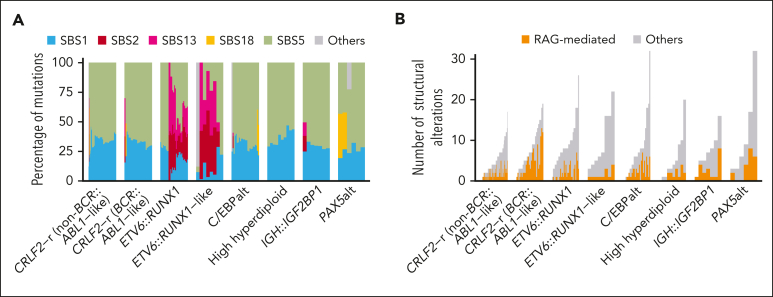
Next, we examined COSMIC mutation signatures in 244 DS-ALL cases across subtypes and identified 5 signatures present in >2% of cases: SBS1, SBS2, SBS5, SBS13, and SBS18. The clock-like signatures SBS1 and SBS5, which are ubiquitous in human cancers including non–DS-ALL,13,16 were universally present in DS-ALL, accounting for a median of 31.9% and 65.9% of the mutations, respectively (Figure 6A). SBS5 showed a positive correlation with age; patients aged ≥10 had higher percentages of this signature (P = .0091; supplemental Figure 11). SBS2 and SBS13, which are related to AID/APOBEC activity,30 were exclusively seen in the ETV6::RUNX1 and ETV6::RUNX1-like subtypes (SBS2; P = 4.4 × 10⁻²⁹ and SBS13; P = 3.6 × 10⁻³⁰; corrected for multiple testing), which are also associated with these 2 signatures in non–DS-ALL.13 By contrast, none of the DS-ALL cases harbored the ultraviolet signature SBS7, which was associated with aneuploidy and iAMP21 in non–DS-ALL.13
Figure 6.
Mutation signature of DS-ALL. (A) SNV mutation signature of DS-ALL subtypes. (B) Number of RAG-mediated structural alterations identified in DS-ALL subtypes.
In addition, we systematically mapped RAG-mediated structural alterations (defined as those with RSS motifs within 50 bp of structural alteration junctions) in both DS-ALL and non–DS-ALL. Overall, we identified a median of 1 RAG-mediated structural alteration (range, 0-13) per patient, accounting for a median of 27.5% of structural alterations. Within DS-ALL, the frequency of RSS-mediated structural alterations was strongly associated with the presence of immunoglobulin or T-cell receptor (IG/TCR) translocations (P = 7.4 × 10⁻⁵; supplemental Figure 12A). Among the DS-ALL subtypes, BCR::ABL1-like CRLF2-r had the highest frequency of RAG-mediated structural alterations (Figure 6B). When compared with non–DS-ALL, there were more RAG-mediated events in DS-ALL genomes (27.5% vs 7.7%; P = 2.1 × 10⁻¹²; supplemental Figure 12B), and this remained true when the comparison was performed within each of the following subtypes: CRLF2-r non–BCR::ABL1-like (P = .038), CRLF2-r BCR::ABL1-like (P = .0051), and high hyperdiploid (P = .028). The frequency of RAG-mediated structural alterations did not differ in CRLF2-r cases according to P2RY8 vs IGH fusion partner (supplemental Figure 12C).
Prognostic impact of DS-ALL genomic features
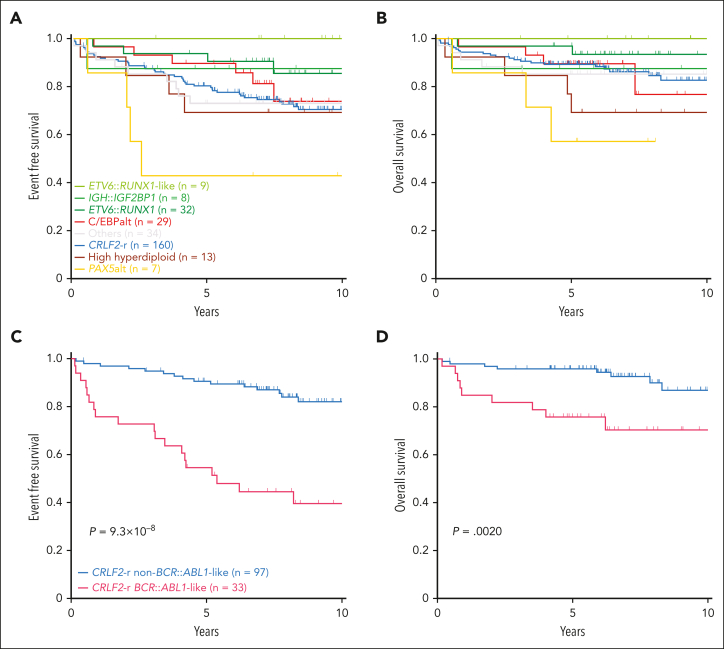
Next, we evaluated the association of DS-ALL subtypes with treatment outcomes in 292 patients with available data. Two of the subtypes enriched in DS-ALL, CRLF2-r and C/EBPalt, demonstrated intermediate outcomes (10-year EFS 70.5% ± 3.9% and 73.9% ± 9.9%; 10-year OS 82.6% ± 3.8% and 76.7% ± 12.8%, respectively; Figure 7A-B), whereas IGH::IGF2BP1 exhibited relatively favorable outcomes (EFS 87.5% ± 11.7%; OS 87.5% ± 11.7%; Figure 7A-B). More patients with C/EBPalt and IGH::IGF2BP1 subtypes that achieved minimal residual disease (MRD) negativity (defined as <0.01%) at end of induction (EOI): C/EBPalt, 87.1%; IGH::IGF2BP1, 87.5%, compared with 64.6% in CRLF2-r. Notably, in CRLF2-r DS-ALL, the BCR::ABL1-like gene expression signature was associated with markedly inferior outcomes compared with non–BCR::ABL1-like, in terms of EOI MRD negativity (30.3% vs 81.1%; P = 2.1 × 10⁻⁷), EFS (39.5% ± 8.1% vs 82.0% ± 4.4%; hazard ratio [HR] = 5.27 [2.67-10.42]; P = 9.3 × 10⁻⁸; Figure 7C) and OS (70.3% ± 8.7% vs 86.9% ± 4.8%; HR = 4.04 [1.55-10.52]; P = .0020; Figure 7D). EFS and OS did not differ significantly between P2RY8::CRLF2 and IGH::CRLF2 cases (supplemental Figure 13). In multivariate regression models of CRLF2-r cases (supplemental Table 7), BCR::ABL1-like status was independently associated with poorer EFS (P = .0020; HR = 4.32 [1.71-10.92]) after controlling for NCI risk, EOI MRD, type of CRLF2 rearrangement (IGH or P2RY8), and the presence or absence of IKZF1 deletion.
Figure 7.
Kaplan-Meier curves. Kaplan-Meier estimates of the (A) EFS and (B) OS according to major subtypes in DS-ALL. Subtypes with <5 cases are included in “Others.” Kaplan-Meier estimates of the (C) EFS and (D) OS of BCR::ABL1-like and non–BCR::ABL1-like subtypes in CRLF2-r DS-ALL.
Discussion
Here, we sought to characterize the unique biology of DS-ALL through comprehensive genomic profiling. Integrating WGS and RNA-Seq for 295 patients with DS-ALL, we identified 15 distinct subtypes. In addition to the well-known CRLF2 rearrangements that account for over half of DS-ALL, 2 other subtypes were also overrepresented in DS-ALL: IGH::IGF2BP1 and C/EBPalt, and we observed a higher level of RAG-mediated structural alterations in DS-ALL genomes. Finally, we comprehensively examined the prognostic impact of genomic features, providing insights into strategies for biology-guided treatment individualization.
Our report is the first to our knowledge to identify IGH::IGF2BP1 rearrangements in DS-ALL (2.7% of cases). Overexpression of the mRNA-binding protein IGF2BP1 plays a known role in cancers that include ETV6::RUNX1+ ALL, where IGF2BP1 has been shown to bind and stabilize ETV6::RUNX1 mRNA,31,32 but only 2 cases of overexpression mediated by IGH::IGF2BP1 rearrangements have been previously reported.33,34 Thus, the identification of 8 cases in our DS-ALL cohort is highly suggestive of association with trisomy 21. Further studies are needed to evaluate IGF2BP1 binding partners in non-ETV6::RUNX1 ALL and the basis for the increased frequency of this subtype in DS-ALL.
Another notable finding of this study is that 10.5% of DS-ALL cases harbored aberrations related to C/EBP genes, characterized by overexpression of CEBPD, CEBPA, or CEBPE. The C/EBP family of transcription factors plays a key role in myeloid differentiation and appears to have divergent roles in the pathogenesis of myeloid vs lymphoid malignancies, depending on activation or inactivation. CEBPA inactivation by a variety of mechanisms35, 36, 37 is common in acute myeloid leukemia. By contrast, IGH translocations with C/EBP genes in B-ALL result in overexpression, suggesting a gain-of-activity effect.38,39 IGH::CEBPD and ::CEBPE fusions have been previously reported as more frequent in DS-ALL in several small case series.38, 39, 40 Here, we report the identification of novel non-IGH rearrangements with C/EBP genes, particularly CEBPA (n = 6). Further studies are needed to evaluate how C/EBP overexpression is mediated in cases without IGH rearrangements and to assess for the presence of these alterations in non–DS-ALL now that they have been identified in DS-ALL. We also present in vitro evidence that CEBPD overexpression cooperates with the DS genetic background to promote differentiation to the pro-B stage, whereas it induces a GMP myeloid transcriptional signature in the WT background, similar to prior reports.41 These preliminary observations in vitro suggest a potential functional basis for the enrichment of CEBPD overexpression in DS-ALL. We postulate that overt leukemogenesis may thus require a second hit, such as mutations in SETD2, KDM6A, and FLT3, which are overrepresented in this subtype of DS-ALL. Further investigation is warranted to fully understand the mechanisms by which CEBPD affects DS-ALL pathogenesis.
Interestingly, we observed significant biological and prognostic differences between CRLF2-r subgroups based on gene expression profiles (BCR::ABL1-like vs non–BCR::ABL1-like), but not based on genetic lesions (P2RY8::CRLF2 vs IGH::CRLF2). Namely, BCR::ABL1-like CRLF2-r cases displayed significantly more RAG-mediated SVs and poorer EFS and OS. Prior reports of the prognosis associated with C/EBP alterations are difficult to extrapolate to DS-ALL because of the small numbers of cases. Our evaluation of 29 C/EBPalt cases suggested this group had intermediate outcomes similar to CRLF2-r, even with a higher EOI MRD clearance rate. It is also important to note that patients with DS-ALL in this study were enrolled on different COG trials, and therefore there was heterogeneity in the therapy received, which is a limitation of the outcome analyses. Nonetheless, these findings suggest that dedicated IGH fluorescence in situ hybridization (because of the high frequency of IGH rearrangements), screening to identify BCR::ABL1-like status, and other molecular diagnostic testing may be warranted in DS-ALL to potentially refine prognostic information and risk stratification at diagnosis.
In conclusion, we have comprehensively described the genomic landscape and categorized the taxonomy of DS-ALL, revealing a series of genomic features specific to ALL with this unique etiology. Importantly, these findings shed light on the remarkable genomic heterogeneity within DS-ALL, some of which contributes to interindividual variability in outcomes and highlights potential opportunities for targeted therapy.
Conflict-of-interest disclosure: The authors declare no competing financial interests.
Acknowledgments
The authors thank the patients and families who participated in the clinical trials included in this study for donating specimens for research and the clinicians and research staff for assistance in sample collection, processing and curation. The authors also thank Jeremy Hunt, Ting-Nien Lin, and Pam McGill from Department of Pharmacy and Pharmaceutical Sciences at St. Jude for technical support, and Yawei Hui and Yiping Fan from the Center for Applied Bioinformatics at St. Jude for their advice on genomic data analysis.
This work was supported in part by the National Institutes of Health (NIH), National Heart, Lung, and Blood Institute (X01HL145686-01), NIH National Cancer Institute (NCI) (R01CA249867, P30CA125123-14S4, U10CA98543, U10CA180886, U10CA98413, U10CA180899, U24CA114766, and U24CA196173), NIH Eunice Kennedy Shriver National Institute of Child Health and Human Development (1R03HD103908-01), Department of Defense (W81XWH-20-1-0567), St. Baldrick’s Foundation, the Lynch family, and the American Lebanese Syrian Associated Charities. This work was performed at the Single Cell Genomics Core at BCM partially supported by NIH Office of the Director shared instrument grants (S10OD023469, S10OD025240) and NIH National Eye Institute grant P30EY002520. This project was supported in part by the Genomic and RNA Profiling Core at Baylor College of Medicine with funding from the NIH Office of the Director S10 (1S10OD023469), NIH NCI (P30CA125123), and The Cancer Prevention and Research Institute of Texas (CPRIT) (RP200504) grants. This project was supported by the Cytometry and Cell Sorting Core at Baylor College of Medicine with funding from the CPRIT Core Facility Support Award (CPRIT-RP180672), the NIH NCI (CA125123), NIH (RR024574), and the assistance of Joel M. Sederstrom. Research reported in this publication was supported by the NIH National Institute of Environmental Health Sciences under Award Number P30ES030285.
The content is solely the responsibility of the authors and does not necessarily represent the official views of the National Institutes of Health.
Authorship
Contribution: P.J.L., K.R.R., and J.J.Y. conceived the study; Z.L., T.-C.C., M.D., W.Y., X.H., D.J.H., Z.C., L.S., E.F., T.C.R., S.L.S., C.G.M., J.Y., and G.W. performed data analysis; K.R.R. and J.J.Y. designed the experiments; J.J.J. and Y.L. performed experiments and analyzed the results; M.S., A.J.C., N.A.H., J.G.-F., B.L.W., M.J.B., E.A.R., S.P.H., M.L.L., P.J.L., and K.R.R. treated the patients and provisioned study materials; and all authors wrote, reviewed, and approved the manuscript.
Footnotes
∗Z.L., T.-C.C., and J.J.J. contributed equally to this study.
†K.R.R. and J.J.Y. jointly supervised this work.
The whole-genome sequencing data are available at dbGaP (https://www.ncbi.nlm.nih.gov/gap/) (accession number phs002330.v1.p1). RNA-Seq data were deposited to the European Genome-phenome Archive (EGA; https://ega-archive.org/; accession number EGAD00001009403).
The online version of this article contains a data supplement.
There is a Blood Commentary on this article in this issue.
The publication costs of this article were defrayed in part by page charge payment. Therefore, and solely to indicate this fact, this article is hereby marked “advertisement” in accordance with 18 USC section 1734.
Contributor Information
Karen R. Rabin, Email: krrabin@texaschildrens.org.
Jun J. Yang, Email: jun.yang@stjude.org.
Supplementary Material
References
- 1.Mai CT, Isenburg JL, Canfield MA, et al. National population-based estimates for major birth defects, 2010-2014. Birth Defects Res. 2019;111(18):1420–1435. doi: 10.1002/bdr2.1589. [DOI] [PMC free article] [PubMed] [Google Scholar]
- 2.Hasle H, Clemmensen IH, Mikkelsen M. Risks of leukaemia and solid tumours in individuals with Down’s syndrome. Lancet. 2000;355(9199):165–169. doi: 10.1016/S0140-6736(99)05264-2. [DOI] [PubMed] [Google Scholar]
- 3.Roy A, Cowan G, Mead AJ, et al. Perturbation of fetal liver hematopoietic stem and progenitor cell development by trisomy 21. Proc Natl Acad Sci U S A. 2012;109(43):17579–17584. doi: 10.1073/pnas.1211405109. [DOI] [PMC free article] [PubMed] [Google Scholar]
- 4.Paulsson K, Forestier E, Lilljebjorn H, et al. Genetic landscape of high hyperdiploid childhood acute lymphoblastic leukemia. Proc Natl Acad Sci U S A. 2010;107(50):21719–21724. doi: 10.1073/pnas.1006981107. [DOI] [PMC free article] [PubMed] [Google Scholar]
- 5.Buitenkamp TD, Izraeli S, Zimmermann M, et al. Acute lymphoblastic leukemia in children with Down syndrome: a retrospective analysis from the Ponte di Legno study group. Blood. 2014;123(1):70–77. doi: 10.1182/blood-2013-06-509463. [DOI] [PMC free article] [PubMed] [Google Scholar]
- 6.Patrick K, Wade R, Goulden N, et al. Outcome of Down syndrome associated acute lymphoblastic leukaemia treated on a contemporary protocol. Br J Haematol. 2014;165(4):552–555. doi: 10.1111/bjh.12739. [DOI] [PubMed] [Google Scholar]
- 7.Rabin KR, Chen Z, Devidas M, et al. Outcomes in children with Down syndrome (DS) and B-lymphoblastic leukemia (B-ALL): a Children’s Oncology Group (COG) report. J Clin Oncol. 2020;38(suppl 15):10510. [Google Scholar]
- 8.Brown AL, de Smith AJ, Gant VU, et al. Inherited genetic susceptibility to acute lymphoblastic leukemia in Down syndrome. Blood. 2019;134(15):1227–1237. doi: 10.1182/blood.2018890764. [DOI] [PMC free article] [PubMed] [Google Scholar]
- 9.Harvey RC, Mullighan CG, Chen IM, et al. Rearrangement of CRLF2 is associated with mutation of JAK kinases, alteration of IKZF1, Hispanic/Latino ethnicity, and a poor outcome in pediatric B-progenitor acute lymphoblastic leukemia. Blood. 2010;115(26):5312–5321. doi: 10.1182/blood-2009-09-245944. [DOI] [PMC free article] [PubMed] [Google Scholar]
- 10.Mullighan CG, Collins-Underwood JR, Phillips LA, et al. Rearrangement of CRLF2 in B-progenitor- and Down syndrome-associated acute lymphoblastic leukemia. Nat Genet. 2009;41(11):1243–1246. doi: 10.1038/ng.469. [DOI] [PMC free article] [PubMed] [Google Scholar]
- 11.Roberts KG, Li Y, Payne-Turner D, et al. Targetable kinase-activating lesions in Ph-like acute lymphoblastic leukemia. N Engl J Med. 2014;371(11):1005–1015. doi: 10.1056/NEJMoa1403088. [DOI] [PMC free article] [PubMed] [Google Scholar]
- 12.Hertzberg L, Vendramini E, Ganmore I, et al. Down syndrome acute lymphoblastic leukemia, a highly heterogeneous disease in which aberrant expression of CRLF2 is associated with mutated JAK2: a report from the International BFM Study Group. Blood. 2010;115(5):1006–1017. doi: 10.1182/blood-2009-08-235408. [DOI] [PubMed] [Google Scholar]
- 13.Brady S, Roberts K, Gu ZH, et al. The genomic landscape of pediatric acute lymphoblastic leukemia. Nat Genet. 2022;54(9):1376–1389. doi: 10.1038/s41588-022-01159-z. [DOI] [PMC free article] [PubMed] [Google Scholar]
- 14.Tibshirani R, Hastie T, Narasimhan B, Chu G. Diagnosis of multiple cancer types by shrunken centroids of gene expression. Proc Natl Acad Sci U S A. 2002;99(10):6567–6572. doi: 10.1073/pnas.082099299. [DOI] [PMC free article] [PubMed] [Google Scholar]
- 15.Li B, Brady SW, Ma X, et al. Therapy-induced mutations drive the genomic landscape of relapsed acute lymphoblastic leukemia. Blood. 2020;135(1):41–55. doi: 10.1182/blood.2019002220. [DOI] [PMC free article] [PubMed] [Google Scholar]
- 16.Alexandrov LB, Kim J, Haradhvala NJ, et al. The repertoire of mutational signatures in human cancer. Nature. 2020;578(7793):94–101. doi: 10.1038/s41586-020-1943-3. [DOI] [PMC free article] [PubMed] [Google Scholar]
- 17.Grant CE, Bailey TL, Noble WS. FIMO: scanning for occurrences of a given motif. Bioinformatics. 2011;27(7):1017–1018. doi: 10.1093/bioinformatics/btr064. [DOI] [PMC free article] [PubMed] [Google Scholar]
- 18.Junco JJ, Zorman B, Gant VU, Jr., et al. CRLF2 overexpression results in reduced B-cell differentiation and upregulated E2F signaling in the Dp16 mouse model of Down syndrome. Exp Hematol. 2022;110:34–38. doi: 10.1016/j.exphem.2022.03.005. [DOI] [PMC free article] [PubMed] [Google Scholar]
- 19.Russell LJ, Capasso M, Vater I, et al. Deregulated expression of cytokine receptor gene, CRLF2, is involved in lymphoid transformation in B-cell precursor acute lymphoblastic leukemia. Blood. 2009;114(13):2688–2698. doi: 10.1182/blood-2009-03-208397. [DOI] [PubMed] [Google Scholar]
- 20.Lawrence MS, Stojanov P, Polak P, et al. Mutational heterogeneity in cancer and the search for new cancer-associated genes. Nature. 2013;499(7457):214–218. doi: 10.1038/nature12213. [DOI] [PMC free article] [PubMed] [Google Scholar]
- 21.Mermel CH, Schumacher SE, Hill B, Meyerson ML, Beroukhim R, Getz G. GISTIC2.0 facilitates sensitive and confident localization of the targets of focal somatic copy-number alteration in human cancers. Genome Biol. 2011;12(4):R41. doi: 10.1186/gb-2011-12-4-r41. [DOI] [PMC free article] [PubMed] [Google Scholar]
- 22.Vijayakrishnan J, Qian M, Studd JB, et al. Identification of four novel associations for B-cell acute lymphoblastic leukaemia risk. Nat Commun. 2019;10(1):5348. doi: 10.1038/s41467-019-13069-6. [DOI] [PMC free article] [PubMed] [Google Scholar]
- 23.Gu ZH, Churchman ML, Roberts KG, et al. PAX5-driven subtypes of B-progenitor acute lymphoblastic leukemia. Nat Genet. 2019;51(2):296–307. doi: 10.1038/s41588-018-0315-5. [DOI] [PMC free article] [PubMed] [Google Scholar]
- 24.Daver N, Schlenk RF, Russell NH, Levis MJ. Targeting FLT3 mutations in AML: review of current knowledge and evidence. Leukemia. 2019;33(2):299–312. doi: 10.1038/s41375-018-0357-9. [DOI] [PMC free article] [PubMed] [Google Scholar]
- 25.Lana-Elola E, Watson-Scales SD, Fisher EM, Tybulewicz VL. Down syndrome: searching for the genetic culprits. Dis Model Mech. 2011;4(5):586–595. doi: 10.1242/dmm.008078. [DOI] [PMC free article] [PubMed] [Google Scholar]
- 26.Li Z, Yu T, Morishima M, et al. Duplication of the entire 22.9 Mb human chromosome 21 syntenic region on mouse chromosome 16 causes cardiovascular and gastrointestinal abnormalities. Hum Mol Genet. 2007;16(11):1359–1366. doi: 10.1093/hmg/ddm086. [DOI] [PubMed] [Google Scholar]
- 27.Painter MW, Davis S, Hardy RR, Mathis D, Benoist C, Immunological Genome Project Consortium Transcriptomes of the B and T lineages compared by multiplatform microarray profiling. J Immunol. 2011;186(5):3047–3057. doi: 10.4049/jimmunol.1002695. [DOI] [PMC free article] [PubMed] [Google Scholar]
- 28.Mullighan CG, Su X, Zhang J, et al. Deletion of IKZF1 and prognosis in acute lymphoblastic leukemia. N Engl J Med. 2009;360(5):470–480. doi: 10.1056/NEJMoa0808253. [DOI] [PMC free article] [PubMed] [Google Scholar]
- 29.Den Boer ML, van Slegtenhorst M, De Menezes RX, et al. A subtype of childhood acute lymphoblastic leukaemia with poor treatment outcome: a genome-wide classification study. Lancet Oncol. 2009;10(2):125–134. doi: 10.1016/S1470-2045(08)70339-5. [DOI] [PMC free article] [PubMed] [Google Scholar]
- 30.Nik-Zainal S, Alexandrov LB, Wedge DC, et al. Mutational processes molding the genomes of 21 breast cancers. Cell. 2012;149(5):979–993. doi: 10.1016/j.cell.2012.04.024. [DOI] [PMC free article] [PubMed] [Google Scholar]
- 31.Stoskus M, Vaitkeviciene G, Eidukaite A, Griskevicius L. ETV6/RUNX1 transcript is a target of RNA-binding protein IGF2BP1 in t(12;21)(p13;q22)-positive acute lymphoblastic leukemia. Blood Cells Mol Dis. 2016;57:30–34. doi: 10.1016/j.bcmd.2015.11.006. [DOI] [PubMed] [Google Scholar]
- 32.Stoskus M, Eidukaite A, Griskevicius L. Defining the significance of IGF2BP1 overexpression in t(12;21)(p13;q22)-positive leukemia REH cells. Leuk Res. 2016;47:16–21. doi: 10.1016/j.leukres.2016.05.009. [DOI] [PubMed] [Google Scholar]
- 33.Jeffries SJ, Jones L, Harrison CJ, Russell LJ. IGH@ translocations co-exist with other primary rearrangements in B-cell precursor acute lymphoblastic leukemia. Haematologica. 2014;99(8):1334–1342. doi: 10.3324/haematol.2014.103820. [DOI] [PMC free article] [PubMed] [Google Scholar]
- 34.Gu G, Sederberg MC, Drachenberg MR, South ST. IGF2BP1: a novel IGH translocation partner in B acute lymphoblastic leukemia. Cancer Genet. 2014;207(7-8):332–334. doi: 10.1016/j.cancergen.2014.07.002. [DOI] [PubMed] [Google Scholar]
- 35.Keeshan K, He Y, Wouters BJ, et al. Tribbles homolog 2 inactivates C/EBPalpha and causes acute myelogenous leukemia. Cancer Cell. 2006;10(5):401–411. doi: 10.1016/j.ccr.2006.09.012. [DOI] [PMC free article] [PubMed] [Google Scholar]
- 36.Tawana K, Wang J, Renneville A, et al. Disease evolution and outcomes in familial AML with germline CEBPA mutations. Blood. 2015;126(10):1214–1223. doi: 10.1182/blood-2015-05-647172. [DOI] [PubMed] [Google Scholar]
- 37.Taskesen E, Bullinger L, Corbacioglu A, et al. Prognostic impact, concurrent genetic mutations, and gene expression features of AML with CEBPA mutations in a cohort of 1182 cytogenetically normal AML patients: further evidence for CEBPA double mutant AML as a distinctive disease entity. Blood. 2011;117(8):2469–2475. doi: 10.1182/blood-2010-09-307280. [DOI] [PubMed] [Google Scholar]
- 38.Chapiro E, Radford-Weiss I, Cung HA, et al. Chromosomal translocations involving the IGH@ locus in B-cell precursor acute lymphoblastic leukemia: 29 new cases and a review of the literature. Cancer Genet. 2013;206(5):162–173. doi: 10.1016/j.cancergen.2013.04.004. [DOI] [PubMed] [Google Scholar]
- 39.Akasaka T, Balasas T, Russell LJ, et al. Five members of the CEBP transcription factor family are targeted by recurrent IGH translocations in B-cell precursor acute lymphoblastic leukemia (BCP-ALL) Blood. 2007;109(8):3451–3461. doi: 10.1182/blood-2006-08-041012. [DOI] [PubMed] [Google Scholar]
- 40.Messinger YH, Higgins RR, Devidas M, Hunger SP, Carroll AJ, Heerema NA. Pediatric acute lymphoblastic leukemia with a t(8;14)(q11.2;q32): B-cell disease with a high proportion of Down syndrome: a Children’s Oncology Group study. Cancer Genet. 2012;205(9):453–458. doi: 10.1016/j.cancergen.2012.07.016. [DOI] [PMC free article] [PubMed] [Google Scholar]
- 41.Cirovic B, Schonheit J, Kowenz-Leutz E, et al. C/EBP-induced transdifferentiation reveals granulocyte-macrophage precursor-like plasticity of B cells. Stem Cell Rep. 2017;8(2):346–359. doi: 10.1016/j.stemcr.2016.12.015. [DOI] [PMC free article] [PubMed] [Google Scholar]
Associated Data
This section collects any data citations, data availability statements, or supplementary materials included in this article.


