

Abstract
Pulmonary artery catheterization is a diagnostic procedure in which a catheter is inserted through a central vein and advanced toward the pulmonary artery to measure right atrial, right ventricular, and pulmonary artery pressures, estimate cardiac output, identify intracardiac shunts, and measure pulmonary vascular resistance. Hemodynamic measurements can provide a better understanding of the pathophysiology of heart failure and pulmonary hypertension, but their proper assessment and optimal use can be challenging due to differences in techniques that can lead to differences in conclusions and therapeutic management strategies. In this review, we will discuss right heart catheterization and its role in clinical practice (e.g., shunt evaluation, management of cardiogenic shock) and summarize important concerns related to measurement and interpretation.
Keywords: Right heart catheterization, cardiac output, right ventricular pressures, pulmonary artery pressures, pulmonary wedge pressure, oxygen saturations
Introduction
Patients with cardiovascular diseases frequently have complex comorbidity, and it may be difficult to determine the primary cause of their symptoms. Routine clinical assessment often leads to working diagnosis that should have implications regarding pathophysiologic changes and expected compensatory responses. It may be difficult to determine whether more detailed evaluation is warranted or useful. Pulmonary artery catheterization provides a well-established method to evaluate the hemodynamic and volume status of patients.
Pulmonary artery catheterization (Swan-Ganz or right heart catheterization [RHC]) is an invasive hemodynamic procedure that can provide direct measurement of pressures, can take blood samples from the right heart and pulmonary artery, and can calculate cardiac output (CO). The initial use of RHC began in the 1920s when a resident named Werner Forssmann performed the first RHC on a human by inserting a urethral catheter into his right atrium through the left antecubital vein [1]. This technique became safer and simpler with the Swan-Ganz catheter, which was developed in the 1970s with the idea that bedside cardiovascular function assessment after acute myocardial infarction might improve outcomes [2]. The Swan-Ganz catheter was widely used in critical care units until the late 1980s, but significant improvements in the diagnostic power and availability of noninvasive cardiac imaging, especially with echocardiography, and reports of complications in critically ill patients during catheterization [3] led to a decline in its use in the late 1990s and early 2000s.
Despite being in use for more than 50 years, the role of RHC remains uncertain, but there has been a recent increase in use after the previous downward trend [4]. Current guidelines and scientific statements provide limited recommendations regarding RHC [5]; the only class IA indication listed in any society guidelines for RHC is during the evaluation of patients for cardiac transplantation [6]. It is the gold standard for the diagnosis of pulmonary arterial hypertension and intracardiac shunts [7,8]. This review will discuss its role in clinical practice and important factors relevant to study performance and interpretation.
Role in clinical practice
During routine clinical practice, physicians, especially cardiologists and pulmonary/critical care physicians, often struggle with decisions about the best way to obtain hemodynamic data. During the RHC procedure, blood sample collection, measurement of pressures, and wave form analysis can be done. The typical pressure curves and values assessed during RHC in various physiological states are illustrated in Figure 1. This procedure is usually performed to assess filling pressures and cardiac output when the hemodynamic status is not apparent from physical examination in order to establish a more exact diagnosis and characterize the hemodynamic severity, when response to therapy is not consistent with physical examination or is suboptimal, or when other miscellaneous indications are present (Table 1). The interpretation of this information is critical in the diagnosis and management of multiple pulmonary and cardiovascular disorders [6].
Figure 1.

Typical pressure curves and values assessed during right heart catheterization within the physiological states.
Table 1.
Indications of right heart catheterization
| Indications | Example |
|---|---|
| By discretion of clinician based on clinical scenarios and physical exam | 1. Assess filling pressures and cardiac output when it is not apparent from physical examination. |
| 2. When response to therapy is not consistent with physical examination. | |
| Miscellaneous indications | 1. Cardiogenic shock with or without mechanical circulatory device in place. |
| 2. Assessment of pulmonary hypertension, and response to vasodilator therapy. | |
| 3. Intracardiac left-to-right shunt quantification. | |
| 4. Evaluation for cardiac transplantation. | |
| 5. Surveillance status post-cardiac transplant. | |
| 6. Post cardiac transplant with new or worsening symptoms suggestive of graft rejection. | |
| 7. Pre- and post-implantation assessment of left ventricular assist devices. |
The RHC procedure is usually a low risk procedure, but complications can occur and can be fatal. These can occur during venous access and include pseudoaneurysm of the common femoral vein, perforation of the right innominate vein, deep venous thrombosis, carotid artery injury, arteriovenous fistula formation, perforation of the left internal mammary artery, and right lymphatic duct injury. They also occur during catheter placement, which can cause rupture of cardiac chambers, rupture of the pulmonary artery, cardiac arrhythmias, and catheter fracture with distal embolization. These complications occur more frequently when the procedure is done at the bedside for hemodynamic monitoring without image guidance; consequently, ultrasound guidance may help to reduce venous access-related complications, and fluoroscopy can reduce catheterization-related complications [9].
To improve outcomes in patients with RHC requires careful interpretation of the hemodynamic parameters derived from the procedure, integration of these parameters into the overall clinical presentation, and the development of management plans based on this information. In addition, repeated measurements with attention to expected changes based on the ongoing management strategy are essential.
Role in shunt evaluation
The term “shunt” refers to an abnormal connection that allows blood to flow from one side of the cardiac circulation to the other. Right heart catheterization is considered the gold standard for shunt detection by measuring the intracardiac pressures and obtaining blood samples [7]. During RHC, blood samples can be drawn from various sites in the heart to measure blood oxygen levels. In addition to the diagnosis of shunts (either interatrial or interventricular), these samples can confirm that the wedge pressure is accurate (wedge saturation) and can measure mixed venous oxyhemoglobin saturation in patients with shock. The disadvantage of collecting blood samples during RHC to detect shunts is the poor sensitivity to detect small shunts, but the majority of hemodynamically significant cardiac shunts are identified [10].
Role in cardiogenic shock management
Right heart catheterization use is increasing, and studies reporting its benefit in cardiogenic shock (CS) management are also increasing. Observational data suggest that RHC guided management may improve survival in patients with CS [11-13]. Current guidelines and scientific statements suggest RHC use in the management of cardiogenic shock patients unresponsive to initial therapy or when there is diagnostic or therapeutic uncertainty [14]. The early use of RHC has been associated with a decreased incidence of acute kidney injury, length of stay, and readmission rates but has conflicting results on the survival in patients with CS [15,16]. In subgroup analyses in patients with acute myocardial infarction complicated by CS, the early use of RHC was associated with reduced mortality [17]. However, there is a lack of randomized controlled trials evaluating the use of RHC in CS, and more research is needed to analyze the safety and benefit from routine RHC in these patients.
To understand CS, it is essential to understand the pressures measured during an RHC. Direct and indirect measurements can be taken from a correctly placed right heart catheter; Table 2 lists each of these measurements and their respective normal values. The direct measurements are made in the right heart and the pulmonary artery: (1) Right-sided intracardiac pressure (right atrial mean pressure, right ventricle systolic and diastolic pressure), and (2) Pulmonary artery pressures (pulmonary artery systolic pressure, pulmonary artery diastolic pressure, mean pulmonary artery pressure). The indirect measurement is pulmonary capillary wedge pressure (PCWP), which provides an estimate of left atrial pressure, which is a surrogate for left ventricular end-diastolic pressure.
Table 2.
Direct and indirect measurements during right heart catheterization
| Measurements during right heart catheterization | Formula | Normal Range |
|---|---|---|
| Direct measurements | ||
| Right atrial pressure (RAP) | 0-6 mmHg | |
| Right ventricular systolic pressure (RVSP) | 15-25 mmHg | |
| Right ventricular diastolic pressure (RVDP) | 8-15 mmHg | |
| Pulmonary artery systolic pressure (PASP) | 15-25 mmHg | |
| Pulmonary artery diastolic pressure (PADP) | 8-15 mmHg | |
| Pulmonary capillary wedge pressure (PCWP) | 6-12 mmHg | |
| Indirect Measurements | Formula | |
| Cardiac output (CO) (per Fick) | [125 × BSA]/[Hb × 1.36 × (SaO2-SvO2)] | 4.0-8.0 L/min |
| Cardiac power output | (MAP × CO)/451 | > 0.6 |
| Mean pulmonary artery pressure (mPAP) | [PASP+(2 × PADP)]/3 | 10-20 mmHg |
| Trans-pulmonary pressure gradient (TPG) | MPAP-PCWP | < 13 mmHg |
| Diastolic pulmonary gradient (DPG) | PADP-PCWP | < 7 mmHg |
| Cardiac index (CI) | CO/BSA | 2.5-4.0 L (min*m2) |
| Stroke volume (SV) | CO/HR × 1000 | 60-100 ml/beat |
| Stroke volume index (SVI) | CI/HR × 1000 | 33-47 ml (m2*beat) |
| Systemic vascular resistance (SVR) | 80 × (MAP-RAP)/CO | 800-1200 dynes·sec/cm5 |
| Systemic vascular resistance index (SVRI) | 80 × (MAP-RAP)/CI | 1970-2390 dynes·sec/cm5/m2 |
| Pulmonary vascular resistance (PVR) | (mPAP-PCWP)/CO | < 3 WU |
| Pulmonary vascular resistance index (PVRI) | 80 × (MPAP-PCWP)/CI | 255-285 dynes·sec/cm5/m2 |
| Pulmonary artery pulsatibility index (PAPI) | (PASP-PADP)/RAP | > 0.9 |
SaO2 should be acquired by arterial blood gas measurement. SvO2 should be acquired by mixed venous gas from pulmonary artery catheter. BSA: body surface area; WU: Wood units.
With direct pressure, mixed venous oxyhemoglobin saturation (MVO2), and CO measurements, various hemodynamics ratios and indices can be calculated, which help the clinician characterize the current hemodynamic status and cardiopulmonary function and usually diagnose clinical disorders in the patient. For example, patients can have more than one disorder, and hemodynamic measurements can help determine which component has the greatest effect on the patient’s clinical status.
In CS or hypovolemic shock, systemic vascular resistance is increased as a compensatory response; this information combined with the interpretation of PCWP, CO, and mixed venous oxygen saturation (MVO2) can determine the type of shock (Table 3). In the presence of pulmonary hypertension (mean pulmonary artery pressure [MPA] > 20), the use of PCWP and pulmonary vascular resistance help define the World Health Organization Pulmonary Hypertension Groups (Table 4). The correlation of CI and PCWP with the clinical presentation (Table 5) and with the acute response to pharmacological therapy provide the foundation for modern patient management. These indices and ratios can predict ventricular dysfunction and outcomes. A PAPI ratio, defined as the [systolic pulmonary artery pressure - diastolic pulmonary artery pressure]/right atrial pressure, ≤ 0.9 predicts right ventricular failure and increased in-hospital mortality in patients with inferior myocardial infarctions [18]; A PAPI < 1.85 predicts right ventricular failure in patients with left ventricular assist devices [19]. A cardiac power output (defined as [MAP × CO]/451) < 0.6 predicts in-hospital mortality in patients with cardiogenic shock [20].
Table 3.
Classic types of shock assessment by right heart catheterization
| PCWP | CO | SVR | MVO2 | |
|---|---|---|---|---|
| Hypovolemic | Decreased | Decreased | Increased | Decreased |
| Distributive | Decreased | Increased | Decreased | Increased |
| Cardiogenic | Increased | Decreased | Increased | Decreased |
PCWP: pulmonary capillary wedge pressure; CO: cardiac output; SVR: systemic vascular resistance; MVO2: mixed venous gas.
Table 4.
Type of pulmonary hypertension assessed by comparing pulmonary capillary wedge pressure and pulmonary vascular resistance
| PCWP ≥ 15 mmHg | PCWP < 15 mmHg | |
|---|---|---|
| PVR ≥ 3 | Combined PH or longstanding PH group II | PH group I |
| PVR < 3 | PH group II | Consider high flow state |
PCWP: pulmonary capillary wedge pressure; PVR: pulmonary vascular resistance; PH: pulmonary hypertension. Pulmonary hypertension group I represents pulmonary arterial hypertensive caused by a primary disease of the pulmonary arterial vasculature. Pulmonary hypertension group II represents an elevation of pulmonary arterial vasculature pressure due to left heart disease.
Table 5.
Correlation between hemodynamics and bedside assessment
| Pulmonary Capillary Wedge Pressure | ||
|---|---|---|
| Cardiac Index | < 15 mmHg | ≥ 15 mmHg |
| ≥ 2.2 L/min/m2 | Congestion & hypoperfusion (warm and dry) | Congestion & no hypoperfusion (Warm and wet) |
| < 2.2 L/min/m2 | No congestion and hypoperfusion (cold and dry) | Congestion & hypoperfusion (cold and wet) |
Role in other complex clinical disorders
Patients with advanced cirrhosis, hepatorenal syndrome, and recent liver transplantation frequently have an abnormal hemodynamic status which is relevant to the clinical presentation and management [21]. For example, Pelayo et al. used right heart catheterization to determine the hemodynamic status of 127 patients with hepatorenal syndrome. Seventy-nine patients had elevated right atrial pressures (> 10 mmHg) and 79 patients had elevated wedge pressures (> 15 mmHg) [22]. Patients with elevated wedge pressures were managed with diuretics and had significant reductions in creatinine levels. Praktiknjo et al. evaluated the association between hemodynamic parameters, such as cardiac index, and outcomes in patients with acute on chronic liver failure. Patients with a hyperdynamic status had the highest risk for poor outcomes [23].
Patients with acute kidney injury who require acute renal replacement therapy often have hemodynamic instability [24]. Understanding the pathophysiologic mechanisms in these patients will require hemodynamic studies. Dourvis et al. did a systematic review to identify interventions to prevent hemodynamic stability during renal replacement therapy in critically ill patients [25]. This analysis suggested a change in the dialysate sodium and individualized ultrafiltration rates may reduce the risk of hemodynamic instability during renal replacement therapy.
Patients with acute hepatic diseases, especially hepatic renal syndrome, and patients with acute kidney injury requiring renal replacement therapy often have alterations in their cardiovascular status and volume status. Right heart catheterization can provide important information needed for the management of these patients. A more in-depth discussion of these clinical syndromes is beyond the scope of this particular review.
Pressure waveform by RHC and association with myocardial pathology
Right atrial tracings
During normal conditions, there are three positive components and two negative deflections in the right atrial pressure wave (Figure 2A): the “a” wave reflects atrial contraction, the “c” wave represents the closure of the tricuspid valve, the “v” wave reflects the ventricular contraction, and the “y” wave demonstrates the fall in right atrial pressure following the opening of the tricuspid valve and the initiation of the right ventricular filling. Abnormalities that can be suspected based on right atrial waves are shown in Figure 2B-F, and include tricuspid regurgitation (the presence of tall “v” waves) (Figure 2B), atrio-ventricular dissociation (the presence of giant “a” waves due to simultaneous contraction of the atria and the ventricle with a closed tricuspid valve) (Figure 2C), cardiac tamponade (the loss of “y” descent due to absence of rapid outflow from the right atrium to the right ventricle) (Figure 2D), restrictive cardiomyopathy (an exaggerated “x” and “y” descent due to rapid right ventricular filling) (Figure 2E), and atrial fibrillation (the loss of ‘a’ wave) (Figure 2F).
Figure 2.
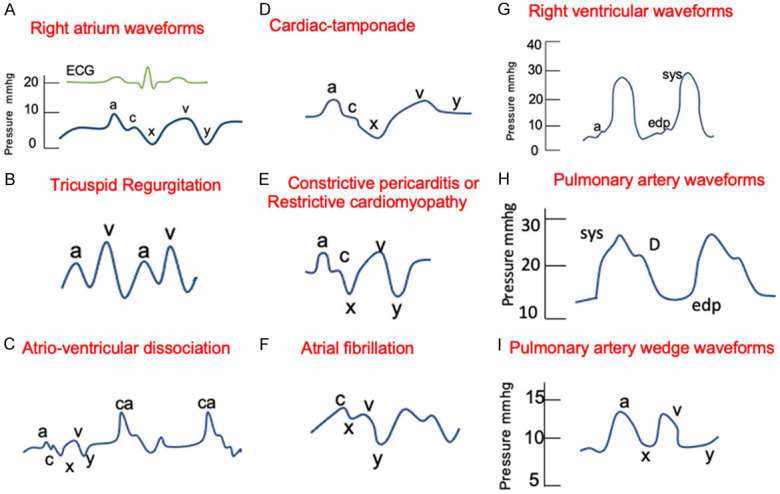
Right heart catheterization normal and abnormal pressure waveforms. A. Right atrium waveforms. “a” wave: contraction in atrial systole; “x” descent: fall in right atrial pressure (atrial diastole); “c” wave: closure of tricuspid valve; “v” wave: ventricular systole and passive atrial filling in atrial diastole; “y” descent: fall in right atrial pressure following opening of the tricuspid valve and the passive filling of the right ventricle. B. Tricuspid regurgitation. Characterized by tall “v” waves due to regurgitation of blood to the right atrium during ventricular systole. C. Atrio-ventricular dissociation. Represented by cannon (or giant) a waves that are present due to atrial contraction against a closed tricuspid valve. D. Cardiac tamponade. Characterized by the loss or flat “y” descent. E. Constrictive pericarditis or restrictive cardiomyopathy. Reflected by prominent “x” and “y” descent. F. Atrial fibrillation. Characterized due to the loss of “a” wave. G. Right ventricular waveforms. “a” wave: contraction in atrial systole correlated with bump in right ventricular tracing; sys: systolic pressure and edp: represent the end diastolic pressure. H. Pulmonary artery waveforms. Dicrotic notch (D) represents the closure of the pulmonic valve; sys: systolic pressure and edp: represent the end diastolic pressure. I. Pulmonary capillary wedge waveforms. “a” wave: atrial systole; “x” descent: atrial diastole; “c” wave: closure of mitral valve (usually not seen); “v” wave: ventricular systole and passive atrial filling; and “y” descent: atrial emptying.
Right ventricular tracings
The peak ventricular systolic pressure and the right ventricular diastolic pressure are the only two pressures typically measured from the right ventricular waveform. Ventricular systole is seen in the waveform as the prominent upstroke, and diastole is represented by a more gradual upstroke during the filling phase followed by the atrial contraction (“a” wave that is seen also in the right atrial tracing) (Figure 2G).
Pulmonary artery tracing
The pulmonary artery waveform comes from the fast flow of blood into the pulmonary artery from the right ventricle during right ventricular systole. As right ventricular ejection ends, the pressure in the pulmonary artery falls and the pulmonic valve closes, resulting in an incisura or dicrotic notch on the downslope of the pressure tracing. Pressure in the pulmonary artery continues to fall gradually and reaches the end-diastolic pulmonary artery pressure (Figure 2H).
Pulmonary capillary wedge tracings
The PCWP waveform reflects the left atrial wave but is lower and delayed due to transmission through the capillary vessels. These waveforms are similar in morphology to those of the right atrial waveforms, but the pressures are higher. The “a” wave reflects the left atrial systole, the “c” wave is the closure of the mitral valve (but it is not usually seen), the “x” wave represents the atrial diastole, the “v” wave corresponds to ventricular systole and the passive filling of left atrial, and the “y” descent reflects the ventricular diastole (Figure 2I). Any condition that raises left ventricular end diastolic pressure increases the PCWP pressure; examples include mitral stenosis, left ventricular systolic and diastolic dysfunction, volume overload, and myocardial infarction with decreased left ventricular compliance.
Performance and interpretation
Right heart catheterization should be considered the gold standard for diagnosing cardiopulmonary conditions based on hemodynamic measurements. However, RHC may not be considered the gold standard in certain situations for several reasons; these include differences in technique that lead to variability in the measurement of different parameters and disagreements over the interpretation of RHC parameter. How, then, can a RHC provide the best approach for the evaluation of cardiopulmonary disorders? First, the procedure must be performed the same way every time since variations in measurement techniques affect the hemodynamic assessment and disease classification [26]. Poor technique can introduce avoidable sources of error. Second, clinicians must decide what the data should represent, identify areas of continued uncertainty, and consider additional studies. When there is unresolved uncertainty, consultation with other experienced clinicians may clarify the situation.
To perform the test consistently, the most important considerations are the preparation before the test, set-up, performance, and quality control.
Preparation for the test and set up
Informed consent must be given by the patient and must describe all possible complications. The most common complications are hematomas in the access site, vagal reactions, pneumothoraces, and arrhythmias [9]. Fasting prior to the procedure should be avoided because it may lead to volume depletion, thus making venous access more difficult [27]. The patient must be supine, the transducers must be set at zero, leveled in the middle of the chest (at the level of the middle left atrium) [28], and lines and manifolds should be flushed to remove bubbles that can cause pressure damping.
Performance
The choice of the vascular access site depends on operator experience, the presence of cardiac devices and in-dwelling catheters, and the possible need for left heart catheterization (LHC) at the same time. In case RHC is the only procedure planned, the preferred access is either the internal jugular or antecubital vein, but in case an LHC is done concurrently, the RHC can be done on the same vascular site used for the LHC, but instead of accessing the artery, the vein should be accessed, either femoral, radial, or antecubital.
The procedure is performed under local anesthesia in the selected vascular access; no sedation is preferred, because anesthetics affect cardiac contractibility and vascular resistance. All pressure tracings must be accompanied by a simultaneous electrocardiographic tracing used for timing and analysis of waveforms. Recordings should be taken while the patient is breathing spontaneously without breath holding since this will cause Valsalva physiology and will affect the reliability of the results due to increased intrathoracic pressure. Both talking or coughing may make the measurement unreliable.
Most operators use the average of at least three measurements cardiovascular pressures, oxygen saturations, and CO to determine the final results from the study.
Quality control
Before reaching a conclusion, the possibility of the damping of pressure tracing must be evaluated (Figure 3) [29]. Figure 3A shows an example of an optimal PCWP with preserved dicrotic (see line 5) notch but minimal systolic and diastolic ringing artifact. In case it is over-damped (Figure 3B) the characteristic dicrotic notch is not seen. The most likely explanation is that the catheter tip is on the atrial or ventricular wall or there is introduction of foreign material, such as a blood clot. The catheter must then be flushed. Another scenario occurs when the pressure waveforms are under-damped (Figure 3C), also known as catheter ringing. In this situation, a dense material, such as blood or contrast, can be used to flush the catheter with careful attention not to overdamp the signal [30].
Figure 3.
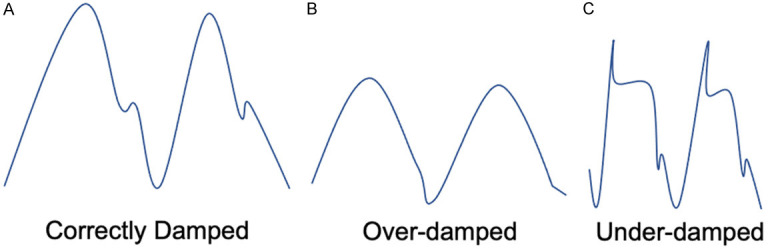
Quality control, damping of pressure tracings.
Pulmonary capillary wedge pressure definition
The PCWP is one of the most important hemodynamic measurements obtained during an RHC. The definition of PCWP is not clear; it could mean either a surrogate for LVEDP or the average pressure the pulmonary vasculature “senses” when the intrathoracic pressure is near atmospheric or the sum of the passive pressures to which the pulmonary vasculature is exposed. Classically, it is defined as a surrogate of LVEDP. To be reliable and as close as possible to the real LVEDP, an uninterrupted fluid column between the catheter tip and the left atrium must occur at a specific moment of the cardiac cycle and the respiratory cycle, i.e., at the end of diastole (or the end of the “a” wave) and the end of expiration [31]. Moreover, catheter position in West’s lung zone 3 is necessary. This zone is defined as the zone in which alveolar pressure is lower than the pulmonary arterial and pulmonary venous pressure (base of the lung), allowing pressure transmission directly from the left atrium to the wedged catheter tip. When patients are in the supine position, most of the lung is in zone 3. In addition, because blood preferentially flows to that area, the catheter tip of a balloon flotation catheter usually ends in zone 3 during its placement.
Discrepancies between LVEDP and PCWP exist and frequently occur in conditions, such as atrial fibrillation, tachycardia, mitral valve disease, and pulmonary venous compression, that cause large “v” waves [32]. In patients who have any of those conditions, and the PCWP is possibly unreliable based on the clinical assessment, direct LVEDP should be measured. If the PCWP is elevated but the accuracy is in question, oxygen saturation should be determined on a sample of blood aspirated from the catheter in the wedge position. If the PCWP oxygen saturation is < 90%, the catheter should be repositioned or direct LVEDP measurement can be considered [33].
Viray et al. studied the accuracy of PCWP pressures by obtaining blood samples for saturation during right heart catheterization after the catheter was put in the wedge position [33]. PCWP was determined using fluoroscopy and identifying the typical hemodynamic waveform. However, in 55 cases out of 110, the saturation of the blood did not reflect the pulmonary artery capillary. With 2 additional attempts, an occlusive saturation was obtained in 91% of subjects. Twenty-nine patients with a repositioned pulmonary artery catheter had a lower wedge pressure than on the initial pulmonary artery wedge pressure (20±6 versus 25±7 mmHg). This led to significant increases in pulmonary vascular resistance and to reclassification of the category of pulmonary hypertension. Therefore, this study indicates that seemingly well-positioned pulmonary artery catheters are not necessarily in the wedge position when samples are taken to measure O2 saturation. This can lead to repositioning and different hemodynamic profiles. Consequently, technique remains extremely important during this procedure.
Cardiac output measurements
The gold standard for CO measurements is the direct Fick [34,35], but this requires measuring the oxygen uptake (VO2), and few catheterization laboratories do this on a routine basis. Thus, the two most commonly used methods are the thermodilution technique and the indirect Fick, but each of these methods can have measurement errors. In the thermodilution technique, the CO is measured using a thermal registering device that measures changes in temperature distal to proximal injection of saline with known temperature and volume. The results can be inaccurate in cases with intracardiac shunts or tricuspid regurgitation [35-38], but the results are as reliable as direct Fick in cases with low CO and severe tricuspid regurgitation [35]. In the indirect Fick, the oxygen consumption is estimated, and the calculation assumes a fixed basal oxygen consumption. This may lead to errors in patients with pulmonary hypertension, heart failure, abnormal body habitus, or a critically ill state [39-42]. Accurate measurement of CO is essential for the diagnosis, management, and prediction of prognosis in different cardiopulmonary diseases, but discrepancies in CO estimates between each method described are common and can significantly affect diagnosis and outcome predictions in patients with pulmonary arterial hypertension [43]. Opotowsky et al. reported that the cardiac index measured by thermodilution predicts 90-day mortality better than the cardiac index measured by modified Fick [44], suggesting that thermodilution should be favored over indirect Fick in clinical practice.
Vasodilator responsiveness assessment
There are two clear indications for this test. First, cardiac transplant candidates with pulmonary hemodynamics suggesting vascular remodeling and unacceptable pulmonary vascular resistance at rest (defined by a PASP ≥ 50 mmHg, and either PVR > 3 or transpulmonary gradient is ≥ 15 while maintaining systolic arterial pressure [SAP] > 85 mmHg) should have a vasodilator test [42,44] Patients who underwent nitroprusside infusion testing and had a PVR ≤ 2.5 WU with a stable systemic SAP ≥ 85 mmHg had a 3-month mortality rate post heart transplantation of 3.8%. In contrast, patients with PVR > 2.5 WU after nitroprusside infusion or with PVR < 2.5 WU associated with SAP ≤ 85 mmHg had a 3-month mortality rate of 40.6% and 27.5%, respectively [45]. Second, vascular responsiveness in patients with pulmonary artery hypertension, either with idiopathic or heritable or drug-induced or anorexigenic etiology, helps predict responses to calcium channel blockers and usually predicts a better prognosis [8]. A positive response is defined as a decrease in mPAP > 10 mmHg to an absolute value of ≤ 40 mmHg, and an unchanged or increased CO [46,47]. Due to an increased risk of pulmonary edema, vasoreactivity testing is contraindicated in patients with known WHO Pulmonary Hypertension Group 2, significant left ventricular failure, severe hypertension, and possible pulmonary veno-occlusive disease [48].
Low pulmonary capillary wedge pressure: fluid challenge vs exercise test
Patients with PCWP in the normal range and suspected heart failure based on clinical evaluation and noninvasive tests (applicable mainly in patients with HFpEF, brought to the catheterization laboratory to determine if they have pulmonary arterial hypertension or left heart disease) often require more tests.
In those situations, before proceeding with advanced strategies, it is important to run a quality check to determine if the transducer is at the correct level, if the morphology of the waves (not underdamped or overdamped) is normal, and if the pressure bag is still inflated. If there is no quality failure, provocative maneuvers are suggested, because PCWP may be falsely normal or misleading due to several causes, such as diuretic use, HF on optimal medical therapy, or measurement during a fasting state [27]. Two maneuvers are well described--the exercise test and the fluid challenge. The technique, advantages, disadvantages, and interpretation of these two tests are discussed below.
Exercise during right heart catheterization
Exercise is a physiologic and clinically relevant stress on the cardiopulmonary system. Exercise RHC provides a chance to identify a different hemodynamic phenotype that reflects abnormal pulmonary vascular and/or cardiac function that may not be evident in the resting patient. The exercise provocative maneuvers may help distinguish between exercise-induced pulmonary artery hypertension versus occult WHO Pulmonary Hypertension Group 2 secondary to HFpEF. Exercise protocols vary significantly among catheterization labs but should be standardized in each lab, e.g., supine or upright cycle, ergometer, abduction and adduction movement of the upper limbs while holding weight. Dynamic exercise using stationary cycle ergometers with electronic brakes mounted on the catheterization lab table is recommended [49], and changes in heart rate compared to baseline or up to exhaustion are used to measure workload [49,50]. Both peak and immediate (first couple of seconds) post-exercise measurements provide the most valuable information, and vascular pressures rapidly recover after exercise [51].
The advantages of exercise testing include assessment of pressure during real world exertion and a more complete physiologic assessment when combined with metabolic cart measurements. The disadvantage is that the measurement of exercise hemodynamics is not possible in all laboratories; it is not clear how “real world” supine cycle ergometry is in a fasting patient, sitting in a bed with cables in the catheterization laboratory, and there is no definition for normal response. It is also not clear what type and how much exercise should be done, and it may be difficult to interpret pressure changes in some patients with wide swings in intrathoracic pressures [28,49,52]. During exercise, the PCWP increases with the increase in CO. In healthy adults, the slope of this relationship does not exceed 2 mmHg/L/minute [53,54]. Hemodynamic criteria supporting the diagnosis of exercise-induced PAH include mPAP > 30 mmHg with total pulmonary vascular resistance > 3 Wood Units (WU) at maximal exercise, especially if the peak CO is less than 10 L/min [55]. Occult HFpEF is defined as a PCWP, which is > 25 mmHg at peak physical activity. The wedge pressure may increase early and then decrease during exercise, and this is a normal response [56]. Moreover, it has been shown that 30% of patients older than 60 years can have an abnormal response even without left heart disease [57].
Fluid challenge during right heart catheterization
The physiology underlying fluid challenge tests consists of measuring an increase in pressure after volume loading, which increases both venous return to the heart and LVEDP, and can unmask HFpEF in patients with decreased LV compliance. The diagnostic relevance of a fluid challenge depends on the amount of fluid, the infusion rate, and the cutoff values [58]. A consensus exists regarding both the protocol for fluid challenge and the interpretation of the results [59]. The advantages of the fluid challenge test are that it is less technically complex and does not need specialized equipment compared to the exercise procedure, and there is an established definition for an abnormal test, which is defined as an increase of PCWP to more than 18 mmHg following the administration of 500 mL saline over 5 minutes. This is considered abnormal and indicative of LV dysfunction [60], compared to healthy individuals, who maintain a PCWP < 15 mmHg after the rapid saline infusion [61,62]. Unlike exercise, a fluid bolus had a minimal effect on heart rate and blood pressure. The disadvantage of the test is that it is less physiologic than exercise testing and gives less insight into the patient’s hemodynamic status.
Chronic pulmonary artery pressure measurements
Abraham et al. analyzed the use of the CardioMEMS Heart Sensor in the management of patients with class III heart failure [63]. This is a small sensor placed directly into a pulmonary artery and provides a daily report of pulmonary artery pressures to help guide medical management. Between September 2007 and October 2009, 550 patients were randomly assigned it into either a treatment group or control group. The baseline pulmonary artery mean pressures were approximately 29 mmHg, and the cardiac index was approximately 2.13 L/min/m2. Daily hemodynamic information was transferred to the treatment center and used for patient management. The rate of hospitalization for heart failure was significantly reduced in the treatment group; the hazard ratio was 0.67 (95% CI 0.55-0.80, P < 0.001). When the study was transition to the open access phase, hemodynamic information was made available on the control group, and this group also had a significant reduction in hospitalization. This study suggests that having information about pulmonary artery pressures can support clinical management decisions, even in non-hospitalized patients.
Recent studies evaluating outcomes in patients with cardiogenic shock managed with right heart catheters
The studies analyzing outcomes in patients with acute cardiac syndromes who had right heart catheterization have largely been observational studies. For example, Rossello et al. prospectively studied 129 patients admitted into a cardiac intensive care unit between December 2005 and May 2009 with cardiogenic shock [64]. One group of patients (83 patients, 64%) had pulmonary artery catheters inserted, and both the short-term and long-term mortality was reduced in these patients. The adjusted hazard ratio for death in the PAC group at 30 days compared to the non-PAC group was 0.55 (95% confidence interval: 0.35-0.86, P = 0.008); The estimated the number needed to treat using these catheters to prevent 1 death was 5 patients. Mortality benefit was observed in patients with non-acute coronary syndrome and shock and not in patients with acute coronary syndrome and shock. There were no deaths associated with pulmonary artery catheter complications. This was not a randomized control trial, but the clinical characteristics of the patients in the 2 groups were well matched. All decisions made in patient management were at the discretion of the treating physicians.
Garan et al. analyzed the use of pulmonary artery catheters in patients with cardiogenic shock at 8 tertiary care institutions between 2016 and 2019 [65]. Catheter use was characterized as no PAC data, incomplete PAC data, or complete PAC data prior to the initiation of mechanical circulatory support. Complete PAC data included pulmonary artery systolic pressure, pulmonary artery diastolic pressure, PCWP, pulmonary artery saturation, and right atrial pressure. The mortality rate was significantly lower in patients with complete assessment. Elevated right atrial pressures were associated with increased mortality in patients with both myocardial infarction and heart failure. An elevated wedge pressure was associated with increased mortality in patients with heart failure. This study demonstrates that complete hemodynamic characterization of patients with cardiogenic shock can improve outcomes with reduced mortality.
Ranka et al. analyzed the Nationwide Readmissions Database for patients hospitalized with cardiogenic shock between 2016 and 2017 [11]. This study included 236,156 hospitalizations with cardiogenic shock; 25,840 patients underwent right heart catheterization. These patients had more comorbidities but had lower death rates and stroke rates than patients who did not undergo catheterization. The 30-day readmission rates and death on readmission were also lower in this group. The odds ratio for lower mortality was 0.69 (95% confidence interval: 0.66-0.72). This study indicates that patients with cardiogenic shock who undergo right heart catheterization have improved outcomes. These results might suggest that hemodynamic characterization and its frequent monitoring improve clinical decision making and increase the use of supportive care, such as hemodialysis and mechanical ventilation. Consequently, these patients are likely sicker, and the hospital length of stay was longer in patients undergoing right heart catheterization.
Bertaina and colleagues did a systematic review and meta-analysis of observational studies to determine the prognostic implications of PAC monitoring in patients with cardiogenic shock [66]. They identified 6 observational studies which included 1,166,762 patients. PAC were used in 33% of these patients. There was a significant association between the pulmonary artery catheter group and reductions in short-term mortality in comparison to the group that did not undergo catheterization. After adjustment for confounders, the odds ratio was 0.71 (95% CI: 0.59-0.87, P < 0.01). The rate of complications associated with these catheters ranged from 5.0% to 9.9%. Patients who underwent cardiac catheterization were more likely to have mechanical circulatory support with an odds ratio of 1.60 (95% CI: 1.27-2.02, P < 0.01).
These studies demonstrate that the use of right heart catheters can improve outcomes in patients with cardiogenic shock. Information collected with these catheters help characterize the patient’s hemodynamic status, and all the parameters should be recorded for this analysis. Early use of the catheter on admission may help initiate more comprehensive and individualized treatment and identify patients who are going to need advanced hemodynamic management.
Conclusion
Right heart catheterization should be considered the gold standard for the diagnosis of cardiopulmonary disorders based on underlying hemodynamic parameters. The correct interpretation of these measurements is essential in critical care and pulmonary medicine and helps clinicians understand and manage cardiopulmonary diseases with abnormal intracardiac and pulmonary vascular pressures. The principles reviewed in this article will help both the cardiologist and pulmonary medicine specialist deliver the best care and improve the outcomes of these patients and will help all clinicians understand advanced testing in their patients.
Disclosure of conflict of interest
None.
References
- 1.Forssmann-Falck R. Werner Forssmann: a pioneer of cardiology. Am J Cardiol. 1997;79:651–60. doi: 10.1016/s0002-9149(96)00833-8. [DOI] [PubMed] [Google Scholar]
- 2.Swan HJ, Ganz W, Forrester J, Marcus H, Diamond G, Chonette D. Catheterization of the heart in man with use of a flow-directed balloon-tipped catheter. N Engl J Med. 1970;283:447–51. doi: 10.1056/NEJM197008272830902. [DOI] [PubMed] [Google Scholar]
- 3.Connors AF Jr, Speroff T, Dawson NV, Thomas C, Harrell FE Jr, Wagner D, Desbiens N, Goldman L, Wu AW, Califf RM, Fulkerson WJ Jr, Vidaillet H, Broste S, Bellamy P, Lynn J, Knaus WA. The effectiveness of right heart catheterization in the initial care of critically ill patients. SUPPORT Investigators. JAMA. 1996;276:889–97. doi: 10.1001/jama.276.11.889. [DOI] [PubMed] [Google Scholar]
- 4.Pandey A, Khera R, Kumar N, Golwala H, Girotra S, Fonarow GC. Use of pulmonary artery catheterization in US patients with heart failure, 2001-2012. JAMA Intern Med. 2016;176:129–32. doi: 10.1001/jamainternmed.2015.6190. [DOI] [PMC free article] [PubMed] [Google Scholar]
- 5.Saxena A, Garan AR, Kapur NK, O’Neill WW, Lindenfeld J, Pinney SP, Uriel N, Burkhoff D, Kern M. Value of hemodynamic monitoring in patients with cardiogenic shock undergoing mechanical circulatory support. Circulation. 2020;141:1184–97. doi: 10.1161/CIRCULATIONAHA.119.043080. [DOI] [PubMed] [Google Scholar]
- 6.Feldman D, Pamboukian SV, Teuteberg JJ, Birks E, Lietz K, Moore SA, Morgan JA, Arabia F, Bauman ME, Buchholz HW, Deng M, Dickstein ML, El-Banayosy A, Elliot T, Goldstein DJ, Grady KL, Jones K, Hryniewicz K, John R, Kaan A, Kusne S, Loebe M, Massicotte MP, Moazami N, Mohacsi P, Mooney M, Nelson T, Pagani F, Perry W, Potapov EV, Eduardo Rame J, Russell SD, Sorensen EN, Sun B, Strueber M, Mangi AA, Petty MG, Rogers J International Society for Heart and Lung Transplantation. The 2013 International Society for Heart and lung transplantation guidelines for mechanical circulatory support: executive summary. J Heart Lung Transplant. 2013;32:157–87. doi: 10.1016/j.healun.2012.09.013. [DOI] [PubMed] [Google Scholar]
- 7.Veeram Reddy SR, Nugent AW, Zellers TM, Dimas VV. Invasive hemodynamics of adult congenital heart disease: from shunts to coarctation. Interv Cardiol Clin. 2017;6:345–58. doi: 10.1016/j.iccl.2017.03.005. [DOI] [PubMed] [Google Scholar]
- 8.Humbert M, Kovacs G, Hoeper MM, Badagliacca R, Berger RMF, Brida M, Carlsen J, Coats AJS, Escribano-Subias P, Ferrari P, Ferreira DS, Ghofrani HA, Giannakoulas G, Kiely DG, Mayer E, Meszaros G, Nagavci B, Olsson KM, Pepke-Zaba J, Quint JK, Rådegran G, Simonneau G, Sitbon O, Tonia T, Toshner M, Vachiery JL, Vonk Noordegraaf A, Delcroix M, Rosenkranz S ESC/ERS Scientific Document Group. 2022 ESC/ERS Guidelines for the diagnosis and treatment of pulmonary hypertension. Eur Respir J. 2023;61:2200879. doi: 10.1183/13993003.00879-2022. [DOI] [PubMed] [Google Scholar]
- 9.Chen Y, Shlofmitz E, Khalid N, Bernardo NL, Ben-Dor I, Weintraub WS, Waksman R. Right heart catheterization-related complications: a review of the literature and best practices. Cardiol Rev. 2020;28:36–41. doi: 10.1097/CRD.0000000000000270. [DOI] [PubMed] [Google Scholar]
- 10.Rosenkranz S, Preston IR. Right heart catheterisation: best practice and pitfalls in pulmonary hypertension. Eur Respir Rev. 2015;24:642–52. doi: 10.1183/16000617.0062-2015. [DOI] [PMC free article] [PubMed] [Google Scholar]
- 11.Ranka S, Mastoris I, Kapur NK, Tedford RJ, Rali A, Acharya P, Weidling R, Goyal A, Sauer AJ, Gupta B, Haglund N, Gupta K, Fang JC, Lindenfeld J, Shah Z. Right heart catheterization in cardiogenic shock is associated with improved outcomes: insights from the nationwide readmissions database. J Am Heart Assoc. 2021;10:e019843. doi: 10.1161/JAHA.120.019843. [DOI] [PMC free article] [PubMed] [Google Scholar]
- 12.Tehrani BN, Truesdell AG, Sherwood MW, Desai S, Tran HA, Epps KC, Singh R, Psotka M, Shah P, Cooper LB, Rosner C, Raja A, Barnett SD, Saulino P, DeFilippi CR, Gurbel PA, Murphy CE, O’Connor CM. Standardized team-based care for cardiogenic shock. J Am Coll Cardiol. 2019;73:1659–69. doi: 10.1016/j.jacc.2018.12.084. [DOI] [PubMed] [Google Scholar]
- 13.Basir MB, Kapur NK, Patel K, Salam MA, Schreiber T, Kaki A, Hanson I, Almany S, Timmis S, Dixon S, Kolski B, Todd J, Senter S, Marso S, Lasorda D, Wilkins C, Lalonde T, Attallah A, Larkin T, Dupont A, Marshall J, Patel N, Overly T, Green M, Tehrani B, Truesdell AG, Sharma R, Akhtar Y, McRae T 3rd, O’Neill B, Finley J, Rahman A, Foster M, Askari R, Goldsweig A, Martin S, Bharadwaj A, Khuddus M, Caputo C, Korpas D, Cawich I, McAllister D, Blank N, Alraies MC, Fisher R, Khandelwal A, Alaswad K, Lemor A, Johnson T, Hacala M, O’Neill WW National Cardiogenic Shock Initiative Investigators. Improved outcomes associated with the use of shock protocols: updates from the national cardiogenic shock initiative. Catheter Cardiovasc Interv. 2019;93:1173–83. doi: 10.1002/ccd.28307. [DOI] [PubMed] [Google Scholar]
- 14.van Diepen S, Katz JN, Albert NM, Henry TD, Jacobs AK, Kapur NK, Kilic A, Menon V, Ohman EM, Sweitzer NK, Thiele H, Washam JB, Cohen MG American Heart Association Council on Clinical Cardiology; Council on Cardiovascular and Stroke Nursing; Council on Quality of Care and Outcomes Research; and Mission: Lifeline. Contemporary management of cardiogenic shock: a scientific statement from the American Heart Association. Circulation. 2017;136:e232–e68. doi: 10.1161/CIR.0000000000000525. [DOI] [PubMed] [Google Scholar]
- 15.Fratti JDDC, Paz P, Rio-Pertuz GD, Sosa EA. Outcomes of early-pulmonary artery catheter (PAC) use in cardiogenic shock. Catheter Cardiovasc Interv. 2021;97:S9–S111. [Google Scholar]
- 16.Elzanaty AM, Maraey A, Khalil M, Elsharnoby H, Nazir S, Moukarbel GV. Right heart catheterization timing and outcomes of cardiogenic shock: analysis from the national readmission database. Curr Probl Cardiol. 2022;47:101388. doi: 10.1016/j.cpcardiol.2022.101388. [DOI] [PubMed] [Google Scholar]
- 17.Fratti JDDC, Paz P, Rio-Pertuz GD, Sosa EA. Early use of pulmonary artery catheter (PAC) in acute myocardial infarction cardiogenic shock (AMICS) Catheter Cardiovasc Interv. 2021;97:S9–S111. [Google Scholar]
- 18.Korabathina R, Heffernan KS, Paruchuri V, Patel AR, Mudd JO, Prutkin JM, Orr NM, Weintraub A, Kimmelstiel CD, Kapur NK. The pulmonary artery pulsatility index identifies severe right ventricular dysfunction in acute inferior myocardial infarction. Catheter Cardiovasc Interv. 2012;80:593–600. doi: 10.1002/ccd.23309. [DOI] [PubMed] [Google Scholar]
- 19.Kang G, Ha R, Banerjee D. Pulmonary artery pulsatility index predicts right ventricular failure after left ventricular assist device implantation. J Heart Lung Transplant. 2016;35:67–73. doi: 10.1016/j.healun.2015.06.009. [DOI] [PubMed] [Google Scholar]
- 20.Fincke R, Hochman JS, Lowe AM, Menon V, Slater JN, Webb JG, LeJemtel TH, Cotter G SHOCK Investigators. Cardiac power is the strongest hemodynamic correlate of mortality in cardiogenic shock: a report from the SHOCK trial registry. J Am Coll Cardiol. 2004;44:340–8. doi: 10.1016/j.jacc.2004.03.060. [DOI] [PubMed] [Google Scholar]
- 21.Hori T, Ogura Y, Onishi Y, Kamei H, Kurata N, Kainuma M, Takahashi H, Suzuki S, Ichikawa T, Mizuno S, Aoyama T, Ishida Y, Hirai T, Hayashi T, Hasegawa K, Takeichi H, Ota A, Kodera Y, Sugimoto H, Lida T, Yagi S, Taniguchi K, Uemoto S. Systemic hemodynamics in advanced cirrhosis: concerns during perioperative period of liver transplantation. World J Hepatol. 2016;8:1047–60. doi: 10.4254/wjh.v8.i25.1047. [DOI] [PMC free article] [PubMed] [Google Scholar]
- 22.Pelayo J, Lo KB, Sultan S, Quintero E, Peterson E, Salacupa G, Zanoria MA, Guarin G, Helfman B, Sanon J, Mathew R, Yazdanyar A, Navarro V, Pressman G, Rangaswami J. Invasive hemodynamic parameters in patients with hepatorenal syndrome. Int J Cardiol Heart Vasc. 2022;42:101094. doi: 10.1016/j.ijcha.2022.101094. [DOI] [PMC free article] [PubMed] [Google Scholar]
- 23.Praktiknjo M, Monteiro S, Grandt J, Kimer N, Madsen JL, Werge MP, William P, Brol MJ, Turco L, Schierwagen R, Chang J, Klein S, Uschner FE, Welsch C, Moreau R, Schepis F, Bendtsen F, Gluud LL, Møller S, Trebicka J. Cardiodynamic state is associated with systemic inflammation and fatal acute-on-chronic liver failure. Liver Int. 2020;40:1457–66. doi: 10.1111/liv.14433. [DOI] [PubMed] [Google Scholar]
- 24.Villa G, Husain-Syed F, Saitta T, Degl’Innocenti D, Barbani F, Resta M, Castellani G, Romagnoli S. Hemodynamic instability during acute kidney injury and acute renal replacement therapy: pathophysiology and clinical implications. Blood Purif. 2021;50:729–39. doi: 10.1159/000513942. [DOI] [PubMed] [Google Scholar]
- 25.Douvris A, Malhi G, Hiremath S, McIntyre L, Silver SA, Bagshaw SM, Wald R, Ronco C, Sikora L, Weber C, Clark EG. Interventions to prevent hemodynamic instability during renal replacement therapy in critically ill patients: a systematic review. Crit Care. 2018;22:41. doi: 10.1186/s13054-018-1965-5. [DOI] [PMC free article] [PubMed] [Google Scholar]
- 26.Wright SP, Moayedi Y, Foroutan F, Agarwal S, Paradero G, Alba AC, Baumwol J, Mak S. Diastolic pressure difference to classify pulmonary hypertension in the assessment of heart transplant candidates. Circ Heart Fail. 2017;10:e004077. doi: 10.1161/CIRCHEARTFAILURE.117.004077. [DOI] [PubMed] [Google Scholar]
- 27.Pieske B, Tschöpe C, de Boer RA, Fraser AG, Anker SD, Donal E, Edelmann F, Fu M, Guazzi M, Lam CSP, Lancellotti P, Melenovsky V, Morris DA, Nagel E, Pieske-Kraigher E, Ponikowski P, Solomon SD, Vasan RS, Rutten FH, Voors AA, Ruschitzka F, Paulus WJ, Seferovic P, Filippatos G. How to diagnose heart failure with preserved ejection fraction: the HFA-PEFF diagnostic algorithm: a consensus recommendation from the Heart Failure Association (HFA) of the European Society of Cardiology (ESC) Eur J Heart Fail. 2020;22:391–412. doi: 10.1002/ejhf.1741. [DOI] [PubMed] [Google Scholar]
- 28.Kovacs G, Avian A, Pienn M, Naeije R, Olschewski H. Reading pulmonary vascular pressure tracings. How to handle the problems of zero leveling and respiratory swings. Am J Respir Crit Care Med. 2014;190:252–7. doi: 10.1164/rccm.201402-0269PP. [DOI] [PubMed] [Google Scholar]
- 29.Bootsma IT, Boerma EC, de Lange F, Scheeren TWL. The contemporary pulmonary artery catheter. Part 1: placement and waveform analysis. J Clin Monit Comput. 2022;36:5–15. doi: 10.1007/s10877-021-00662-8. [DOI] [PMC free article] [PubMed] [Google Scholar]
- 30.Maron BA, Kovacs G, Vaidya A, Bhatt DL, Nishimura RA, Mak S, Guazzi M, Tedford RJ. Cardiopulmonary hemodynamics in pulmonary hypertension and heart failure: JACC review topic of the week. J Am Coll Cardiol. 2020;76:2671–81. doi: 10.1016/j.jacc.2020.10.007. [DOI] [PMC free article] [PubMed] [Google Scholar]
- 31.Ryan JJ, Rich JD, Thiruvoipati T, Swamy R, Kim GH, Rich S. Current practice for determining pulmonary capillary wedge pressure predisposes to serious errors in the classification of patients with pulmonary hypertension. Am Heart J. 2012;163:589–94. doi: 10.1016/j.ahj.2012.01.024. [DOI] [PubMed] [Google Scholar]
- 32.Reddy YNV, El-Sabbagh A, Nishimura RA. Comparing pulmonary arterial wedge pressure and left ventricular end diastolic pressure for assessment of left-sided filling pressures. JAMA Cardiol. 2018;3:453–454. doi: 10.1001/jamacardio.2018.0318. [DOI] [PubMed] [Google Scholar]
- 33.Viray MC, Bonno EL, Gabrielle ND, Maron BA, Atkins J, Amoroso NS, Fernandes VLC, Maran A, Nielsen CD, Powers ER, Steinberg DH, Todoran TM, Di Salvo TG, Jackson GR, Houston BA, Tedford RJ. Role of pulmonary artery wedge pressure saturation during right heart catheterization: a prospective study. Circ Heart Fail. 2020;13:e007981. doi: 10.1161/CIRCHEARTFAILURE.120.007981. [DOI] [PMC free article] [PubMed] [Google Scholar]
- 34.Yazdi D, Sridaran S, Smith S, Centen C, Patel S, Wilson E, Gillon L, Kapur S, Tracy JA, Lewine K, Systrom DM Jr, MacRae CA. Noninvasive scale measurement of stroke volume and cardiac output compared with the direct fick method: a feasibility study. J Am Heart Assoc. 2021;10:e021893. doi: 10.1161/JAHA.121.021893. [DOI] [PMC free article] [PubMed] [Google Scholar]
- 35.Hoeper MM, Maier R, Tongers J, Niedermeyer J, Hohlfeld JM, Hamm M, Fabel H. Determination of cardiac output by the Fick method, thermodilution, and acetylene rebreathing in pulmonary hypertension. Am J Respir Crit Care Med. 1999;160:535–41. doi: 10.1164/ajrccm.160.2.9811062. [DOI] [PubMed] [Google Scholar]
- 36.Nishikawa T, Dohi S. Errors in the measurement of cardiac output by thermodilution. Can J Anaesth. 1993;40:142–53. doi: 10.1007/BF03011312. [DOI] [PubMed] [Google Scholar]
- 37.Hillis LD, Firth BG, Winniford MD. Analysis of factors affecting the variability of Fick versus indicator dilution measurements of cardiac output. Am J Cardiol. 1985;56:764–8. doi: 10.1016/0002-9149(85)91132-4. [DOI] [PubMed] [Google Scholar]
- 38.Cigarroa RG, Lange RA, Williams RH, Bedotto JB, Hillis LD. Underestimation of cardiac output by thermodilution in patients with tricuspid regurgitation. Am J Med. 1989;86:417–20. doi: 10.1016/0002-9343(89)90339-2. [DOI] [PubMed] [Google Scholar]
- 39.Fakler U, Pauli C, Hennig M, Sebening W, Hess J. Assumed oxygen consumption frequently results in large errors in the determination of cardiac output. J Thorac Cardiovasc Surg. 2005;130:272–6. doi: 10.1016/j.jtcvs.2005.02.048. [DOI] [PubMed] [Google Scholar]
- 40.Kendrick AH, West J, Papouchado M, Rozkovec A. Direct Fick cardiac output: are assumed values of oxygen consumption acceptable? Eur Heart J. 1988;9:337–42. doi: 10.1093/oxfordjournals.eurheartj.a062505. [DOI] [PubMed] [Google Scholar]
- 41.Narang N, Gore MO, Snell PG, Ayers CR, Lorenzo S, Carrick-Ranson G, Babb TG, Levine BD, Khera A, de Lemos JA, McGuire DK. Accuracy of estimating resting oxygen uptake and implications for hemodynamic assessment. Am J Cardiol. 2012;109:594–8. doi: 10.1016/j.amjcard.2011.10.010. [DOI] [PubMed] [Google Scholar]
- 42.Narang N, Thibodeau JT, Levine BD, Gore MO, Ayers CR, Lange RA, Cigarroa JE, Turer AT, de Lemos JA, McGuire DK. Inaccuracy of estimated resting oxygen uptake in the clinical setting. Circulation. 2014;129:203–10. doi: 10.1161/CIRCULATIONAHA.113.003334. [DOI] [PubMed] [Google Scholar]
- 43.Fares WH, Blanchard SK, Stouffer GA, Chang PP, Rosamond WD, Ford HJ, Aris RM. Thermodilution and fick cardiac outputs differ: impact on pulmonary hypertension evaluation. Can Respir J. 2012;19:261–6. doi: 10.1155/2012/261793. [DOI] [PMC free article] [PubMed] [Google Scholar]
- 44.Opotowsky AR, Hess E, Maron BA, Brittain EL, Barón AE, Maddox TM, Alshawabkeh LI, Wertheim BM, Xu M, Assad TR, Rich JD, Choudhary G, Tedford RJ. Thermodilution vs estimated fick cardiac output measurement in clinical practice: an analysis of mortality from the veterans affairs clinical assessment, reporting, and tracking (VA CART) program and vanderbilt university. JAMA Cardiol. 2017;2:1090–1099. doi: 10.1001/jamacardio.2017.2945. [DOI] [PMC free article] [PubMed] [Google Scholar]
- 45.Zakliczynski M, Zebik T, Maruszewski M, Swierad M, Zembala M. Usefulness of pulmonary hypertension reversibility test with sodium nitroprusside in stratification of early death risk after orthotopic heart transplantation. Transplant Proc. 2005;37:1346–8. doi: 10.1016/j.transproceed.2005.01.012. [DOI] [PubMed] [Google Scholar]
- 46.Tonelli AR, Alnuaimat H, Mubarak K. Pulmonary vasodilator testing and use of calcium channel blockers in pulmonary arterial hypertension. Respir Med. 2010;104:481–96. doi: 10.1016/j.rmed.2009.11.015. [DOI] [PubMed] [Google Scholar]
- 47.Simonneau G, Montani D, Celermajer DS, Denton CP, Gatzoulis MA, Krowka M, Williams PG, Souza R. Haemodynamic definitions and updated clinical classification of pulmonary hypertension. Eur Respir J. 2019;53:1801913. doi: 10.1183/13993003.01913-2018. [DOI] [PMC free article] [PubMed] [Google Scholar]
- 48.Tea I, Hussain I. Under pressure: right heart catheterization and provocative testing for diagnosing pulmonary hypertension. Methodist Debakey Cardiovasc J. 2021;17:92–100. doi: 10.14797/AFUI4711. [DOI] [PMC free article] [PubMed] [Google Scholar]
- 49.Naeije R, Saggar R, Badesch D, Rajagopalan S, Gargani L, Rischard F, Ferrara F, Marra AM, D’Alto M, Bull TM, Saggar R, Grünig E, Bossone E. Exercise-induced pulmonary hypertension: translating pathophysiological concepts into clinical practice. Chest. 2018;154:10–5. doi: 10.1016/j.chest.2018.01.022. [DOI] [PubMed] [Google Scholar]
- 50.Saggar R, Sitbon O. Hemodynamics in pulmonary arterial hypertension: current and future perspectives. Am J Cardiol. 2012;110(Suppl):9S–15S. doi: 10.1016/j.amjcard.2012.06.011. [DOI] [PubMed] [Google Scholar]
- 51.Lewis GD, Bossone E, Naeije R, Grünig E, Saggar R, Lancellotti P, Ghio S, Varga J, Rajagopalan S, Oudiz R, Rubenfire M. Pulmonary vascular hemodynamic response to exercise in cardiopulmonary diseases. Circulation. 2013;128:1470–9. doi: 10.1161/CIRCULATIONAHA.112.000667. [DOI] [PubMed] [Google Scholar]
- 52.Naeije R, Chin K. Differentiating precapillary from postcapillary pulmonary hypertension. Circulation. 2019;140:712–714. doi: 10.1161/CIRCULATIONAHA.119.040295. [DOI] [PubMed] [Google Scholar]
- 53.Esfandiari S, Wright SP, Goodman JM, Sasson Z, Mak S. Pulmonary artery wedge pressure relative to exercise work rate in older men and women. Med Sci Sports Exerc. 2017;49:1297–1304. doi: 10.1249/MSS.0000000000001227. [DOI] [PubMed] [Google Scholar]
- 54.Kovacs G, Berghold A, Scheidl S, Olschewski H. Pulmonary arterial pressure during rest and exercise in healthy subjects: a systematic review. Eur Respir J. 2009;34:888–94. doi: 10.1183/09031936.00145608. [DOI] [PubMed] [Google Scholar]
- 55.Herve P, Lau EM, Sitbon O, Savale L, Montani D, Godinas L, Lador F, Jaïs X, Parent F, Günther S, Humbert M, Simonneau G, Chemla D. Criteria for diagnosis of exercise pulmonary hypertension. Eur Respir J. 2015;46:728–37. doi: 10.1183/09031936.00021915. [DOI] [PubMed] [Google Scholar]
- 56.Wright SP, Esfandiari S, Gray T, Fuchs FC, Chelvanathan A, Chan W, Sasson Z, Granton JT, Goodman JM, Mak S. The pulmonary artery wedge pressure response to sustained exercise is time-variant in healthy adults. Heart. 2016;102:438–43. doi: 10.1136/heartjnl-2015-308592. [DOI] [PubMed] [Google Scholar]
- 57.Wolsk E, Bakkestrøm R, Thomsen JH, Balling L, Andersen MJ, Dahl JS, Hassager C, Møller JE, Gustafsson F. The influence of age on hemodynamic parameters during rest and exercise in healthy individuals. JACC Heart Fail. 2017;5:337–46. doi: 10.1016/j.jchf.2016.10.012. [DOI] [PubMed] [Google Scholar]
- 58.D’Alto M, Badesch D, Bossone E, Borlaug BA, Brittain E, Humbert M, Naeije R. A fluid challenge test for the diagnosis of occult heart failure. Chest. 2021;159:791–7. doi: 10.1016/j.chest.2020.08.019. [DOI] [PubMed] [Google Scholar]
- 59.Naeije R, Gerges M, Vachiery JL, Caravita S, Gerges C, Lang IM. Hemodynamic phenotyping of pulmonary hypertension in left heart failure. Circ Heart Fail. 2017;10:e004082. doi: 10.1161/CIRCHEARTFAILURE.117.004082. [DOI] [PubMed] [Google Scholar]
- 60.Vachiéry JL, Tedford RJ, Rosenkranz S, Palazzini M, Lang I, Guazzi M, Coghlan G, Chazova I, De Marco T. Pulmonary hypertension due to left heart disease. Eur Respir J. 2019;53:1801897. doi: 10.1183/13993003.01897-2018. [DOI] [PMC free article] [PubMed] [Google Scholar]
- 61.Fujimoto N, Borlaug BA, Lewis GD, Hastings JL, Shafer KM, Bhella PS, Carrick-Ranson G, Levine BD. Hemodynamic responses to rapid saline loading: the impact of age, sex, and heart failure. Circulation. 2013;127:55–62. doi: 10.1161/CIRCULATIONAHA.112.111302. [DOI] [PMC free article] [PubMed] [Google Scholar]
- 62.Robbins IM, Hemnes AR, Pugh ME, Brittain EL, Zhao DX, Piana RN, Fong PP, Newman JH. High prevalence of occult pulmonary venous hypertension revealed by fluid challenge in pulmonary hypertension. Circ Heart Fail. 2014;7:116–22. doi: 10.1161/CIRCHEARTFAILURE.113.000468. [DOI] [PMC free article] [PubMed] [Google Scholar]
- 63.Abraham WT, Stevenson LW, Bourge RC, Lindenfeld JA, Bauman JG, Adamson PB CHAMPION Trial Study Group. Sustained efficacy of pulmonary artery pressure to guide adjustment of chronic heart failure therapy: complete follow-up results from the CHAMPION randomised trial. Lancet. 2016;387:453–61. doi: 10.1016/S0140-6736(15)00723-0. [DOI] [PubMed] [Google Scholar]
- 64.Rossello X, Vila M, Rivas-Lasarte M, Ferrero-Gregori A, Sans-Roselló J, Duran-Cambra A, Sionis A. Impact of pulmonary artery catheter use on short- and long-term mortality in patients with cardiogenic shock. Cardiology. 2017;136:61–9. doi: 10.1159/000448110. [DOI] [PubMed] [Google Scholar]
- 65.Garan AR, Kanwar M, Thayer KL, Whitehead E, Zweck E, Hernandez-Montfort J, Mahr C, Haywood JL, Harwani NM, Wencker D, Sinha SS, Vorovich E, Abraham J, O’Neill W, Burkhoff D, Kapur NK. Complete hemodynamic profiling with pulmonary artery catheters in cardiogenic shock is associated with lower in-hospital mortality. JACC Heart Fail. 2020;8:903–13. doi: 10.1016/j.jchf.2020.08.012. [DOI] [PubMed] [Google Scholar]
- 66.Bertaina M, Galluzzo A, Rossello X, Sbarra P, Petitti E, Prever SB, Boccuzzi G, D’Ascenzo F, Frea S, Pidello S, Morici N, Sacco A, Oliva F, Valente S, De Ferrari GM, Ugo F, Rametta F, Attisani M, Zanini P, Noussan P, Iannaccone M. Prognostic implications of pulmonary artery catheter monitoring in patients with cardiogenic shock: a systematic review and meta-analysis of observational studies. J Crit Care. 2022;69:154024. doi: 10.1016/j.jcrc.2022.154024. [DOI] [PubMed] [Google Scholar]