

Key Points
Question
Does donanemab, a monoclonal antibody designed to clear brain amyloid plaque, provide clinical benefit in early symptomatic Alzheimer disease?
Findings
In this randomized clinical trial that included 1736 participants with early symptomatic Alzheimer disease and amyloid and tau pathology, the least-squares mean change in the integrated Alzheimer Disease Rating Scale score (range, 0-144; lower score indicates greater impairment) at 76 weeks was −6.02 in the donanemab group and −9.27 in the placebo group for the low/medium tau population and −10.19 in the donanemab group and −13.11 in the placebo group in the combined study population, both of which were significant differences.
Meaning
Among participants with early symptomatic Alzheimer disease and amyloid and tau pathology, donanemab treatment significantly slowed clinical progression at 76 weeks.
Abstract
Importance
There are limited efficacious treatments for Alzheimer disease.
Objective
To assess efficacy and adverse events of donanemab, an antibody designed to clear brain amyloid plaque.
Design, Setting, and Participants
Multicenter (277 medical research centers/hospitals in 8 countries), randomized, double-blind, placebo-controlled, 18-month phase 3 trial that enrolled 1736 participants with early symptomatic Alzheimer disease (mild cognitive impairment/mild dementia) with amyloid and low/medium or high tau pathology based on positron emission tomography imaging from June 2020 to November 2021 (last patient visit for primary outcome in April 2023).
Interventions
Participants were randomized in a 1:1 ratio to receive donanemab (n = 860) or placebo (n = 876) intravenously every 4 weeks for 72 weeks. Participants in the donanemab group were switched to receive placebo in a blinded manner if dose completion criteria were met.
Main Outcomes and Measures
The primary outcome was change in integrated Alzheimer Disease Rating Scale (iADRS) score from baseline to 76 weeks (range, 0-144; lower scores indicate greater impairment). There were 24 gated outcomes (primary, secondary, and exploratory), including the secondary outcome of change in the sum of boxes of the Clinical Dementia Rating Scale (CDR-SB) score (range, 0-18; higher scores indicate greater impairment). Statistical testing allocated α of .04 to testing low/medium tau population outcomes, with the remainder (.01) for combined population outcomes.
Results
Among 1736 randomized participants (mean age, 73.0 years; 996 [57.4%] women; 1182 [68.1%] with low/medium tau pathology and 552 [31.8%] with high tau pathology), 1320 (76%) completed the trial. Of the 24 gated outcomes, 23 were statistically significant. The least-squares mean (LSM) change in iADRS score at 76 weeks was −6.02 (95% CI, −7.01 to −5.03) in the donanemab group and −9.27 (95% CI, −10.23 to −8.31) in the placebo group (difference, 3.25 [95% CI, 1.88-4.62]; P < .001) in the low/medium tau population and −10.2 (95% CI, −11.22 to −9.16) with donanemab and −13.1 (95% CI, −14.10 to −12.13) with placebo (difference, 2.92 [95% CI, 1.51-4.33]; P < .001) in the combined population. LSM change in CDR-SB score at 76 weeks was 1.20 (95% CI, 1.00-1.41) with donanemab and 1.88 (95% CI, 1.68-2.08) with placebo (difference, −0.67 [95% CI, −0.95 to −0.40]; P < .001) in the low/medium tau population and 1.72 (95% CI, 1.53-1.91) with donanemab and 2.42 (95% CI, 2.24-2.60) with placebo (difference, −0.7 [95% CI, −0.95 to −0.45]; P < .001) in the combined population. Amyloid-related imaging abnormalities of edema or effusion occurred in 205 participants (24.0%; 52 symptomatic) in the donanemab group and 18 (2.1%; 0 symptomatic during study) in the placebo group and infusion-related reactions occurred in 74 participants (8.7%) with donanemab and 4 (0.5%) with placebo. Three deaths in the donanemab group and 1 in the placebo group were considered treatment related.
Conclusions and Relevance
Among participants with early symptomatic Alzheimer disease and amyloid and tau pathology, donanemab significantly slowed clinical progression at 76 weeks in those with low/medium tau and in the combined low/medium and high tau pathology population.
Trial Registration
ClinicalTrials.gov Identifier: NCT04437511
This randomized clinical trial examines the efficacy and adverse effects of donanemab, a monoclonal antibody designed to clear brain amyloid plaque, among patients with early symptomatic Alzheimer disease.
Introduction
Deposition of β-amyloid in the brain is an early event in Alzheimer disease that leads to neurofibrillary tangles composed of tau protein and other characteristic brain changes referred to as the amyloid cascade.1,2 Abnormal β-amyloid is a key pathological hallmark of Alzheimer disease defined by the 2018 National Institute on Aging and the Alzheimer’s Association Research Framework3 and is one of the major targets in Alzheimer disease research and drug development.
Over the past decade, considerable advances occurred in testing the amyloid cascade hypothesis in Alzheimer disease clinical trials. Numerous amyloid-targeting therapy trials failed to show appreciable slowing of clinical disease progression4,5,6,7; however, aducanumab, lecanemab, and donanemab recently showed promising amyloid plaque clearance, potentially benefitting patients.8,9,10
Donanemab is an immunoglobulin G1 monoclonal antibody directed against insoluble, modified, N-terminal truncated form of β-amyloid present only in brain amyloid plaques. Donanemab binds to N-terminal truncated form of β-amyloid and aids plaque removal through microglial-mediated phagocytosis.11 In the phase 2 TRAILBLAZER-ALZ trial of donanemab vs placebo, the primary outcome was met, as measured by the integrated Alzheimer Disease Rating Scale (iADRS), an integrated assessment of cognition and daily function.9 Adverse events of interest included amyloid-related imaging abnormalities and infusion-related reactions.9 To confirm and expand results from TRAILBLAZER-ALZ, we report results from TRAILBLAZER-ALZ 2, a global phase 3 randomized clinical trial that assessed donanemab efficacy and adverse events in a larger group of participants with low/medium tau pathology (the population studied in the phase 2 trial) and in a combined population including those with high tau pathology, a population hypothesized to be more difficult to treat due to more advanced disease.
Methods
Trial Conduct and Oversight
TRAILBLAZER-ALZ 2 was a 76-week, phase 3, randomized, double-blind, parallel, multicenter, placebo-controlled trial with participants screened at 277 sites in 8 countries (eTable 1 in Supplement 3). Enrollment began June 19, 2020, and ended November 5, 2021, and database lock/unblinding (double-blind phase) occurred on April 28, 2023. The trial was originally designed as a phase 2 trial but was subsequently amended to a larger phase 3 trial in February 2021 in an effort to confirm and expand the results of the previous TRAILBLAZER-ALZ trial. The trial was conducted according to the Declaration of Helsinki, the International Conference on Harmonization Good Clinical Practice Guideline, and local regulatory requirements. An independent ethics committee/institutional review board at each site approved the study protocol (Supplement 1), which is provided alongside the statistical analysis plan (Supplement 2). Participants and study partners provided written consent. An independent data and safety monitoring board provided trial oversight.
Trial Design and Participants
The trial included participants aged 60 to 85 years with early symptomatic Alzheimer disease (mild cognitive impairment [MCI]12 or Alzheimer disease with mild dementia).3 P-tau181 screening was removed in an early protocol amendment (eMethods in Supplement 3). Eligible participants had screening Mini-Mental State Examination (MMSE) scores of 20 to 28, amyloid pathology (≥37 Centiloids) assessed with 18F-florbetapir13 or 18F-florbetaben14 positron emission tomography (PET), and presence of tau pathology assessed by 18F-flortaucipir PET imaging with central image evaluation.13,15 Tau PET scans were categorized as low/medium or high tau by visual and quantitative reads as previously described16,17,18,19,20 (Supplements 1 and 2). Screening procedures also included magnetic resonance imaging (MRI), and key exclusion criteria included presence of amyloid-related imaging abnormalities of edema/effusion, more than 4 cerebral microhemorrhages, more than 1 area of superficial siderosis, and any intracerebral hemorrhage greater than 1 cm or severe white matter disease on MRI. For all eligibility criteria, see Supplement 1. Demographic information, including race and ethnicity, was collected to potentially understand any differences in disease course, treatment effects, or adverse events. The participants self-reported race and ethnicity based on fixed categories.
Randomization and Intervention
Eligible participants were randomly assigned in a 1:1 ratio (Figure 1) by a computer-generated sequence using interactive web response systems, with stratification by baseline tau categorization and enrolling sites; the randomization block size was 4. Randomized participants received either donanemab (700 mg for the first 3 doses and 1400 mg thereafter) or placebo, administered intravenously every 4 weeks for up to 72 weeks. If amyloid plaque level (assessed at 24 weeks and 52 weeks) was less than 11 Centiloids on any single PET scan or less than 25 but greater than or equal to 11 Centiloids on 2 consecutive PET scans (TRAILBLAZER-ALZ cutoffs9), donanemab was switched to placebo in a blinded procedure. Final adverse events and efficacy assessments were performed at 76 weeks. Amyloid-related imaging abnormality monitoring occurred with scheduled MRIs at 4, 12, 24, 52, and 76 weeks and unscheduled MRIs at investigator discretion. Any participant with detected amyloid-related imaging abnormalities had imaging every 4 to 6 weeks until resolution or stabilization. Amyloid-related imaging abnormality management and treatment interruption guidelines (eTable 2 in Supplement 3) depended on severity and symptoms. If infusions were held, investigators were advised to await resolution of amyloid-related imaging abnormalities of edema/effusion on radiographic imaging and stabilization of amyloid-related imaging abnormalities of microhemorrhages and hemosiderin deposits before resuming infusions. Permanent discontinuation was advised for macrohemorrhages. Investigators made final amyloid-related imaging abnormality management decisions.
Figure 1. Participant Flow in a Trial of Donanemab for Early Symptomatic Alzheimer Disease.
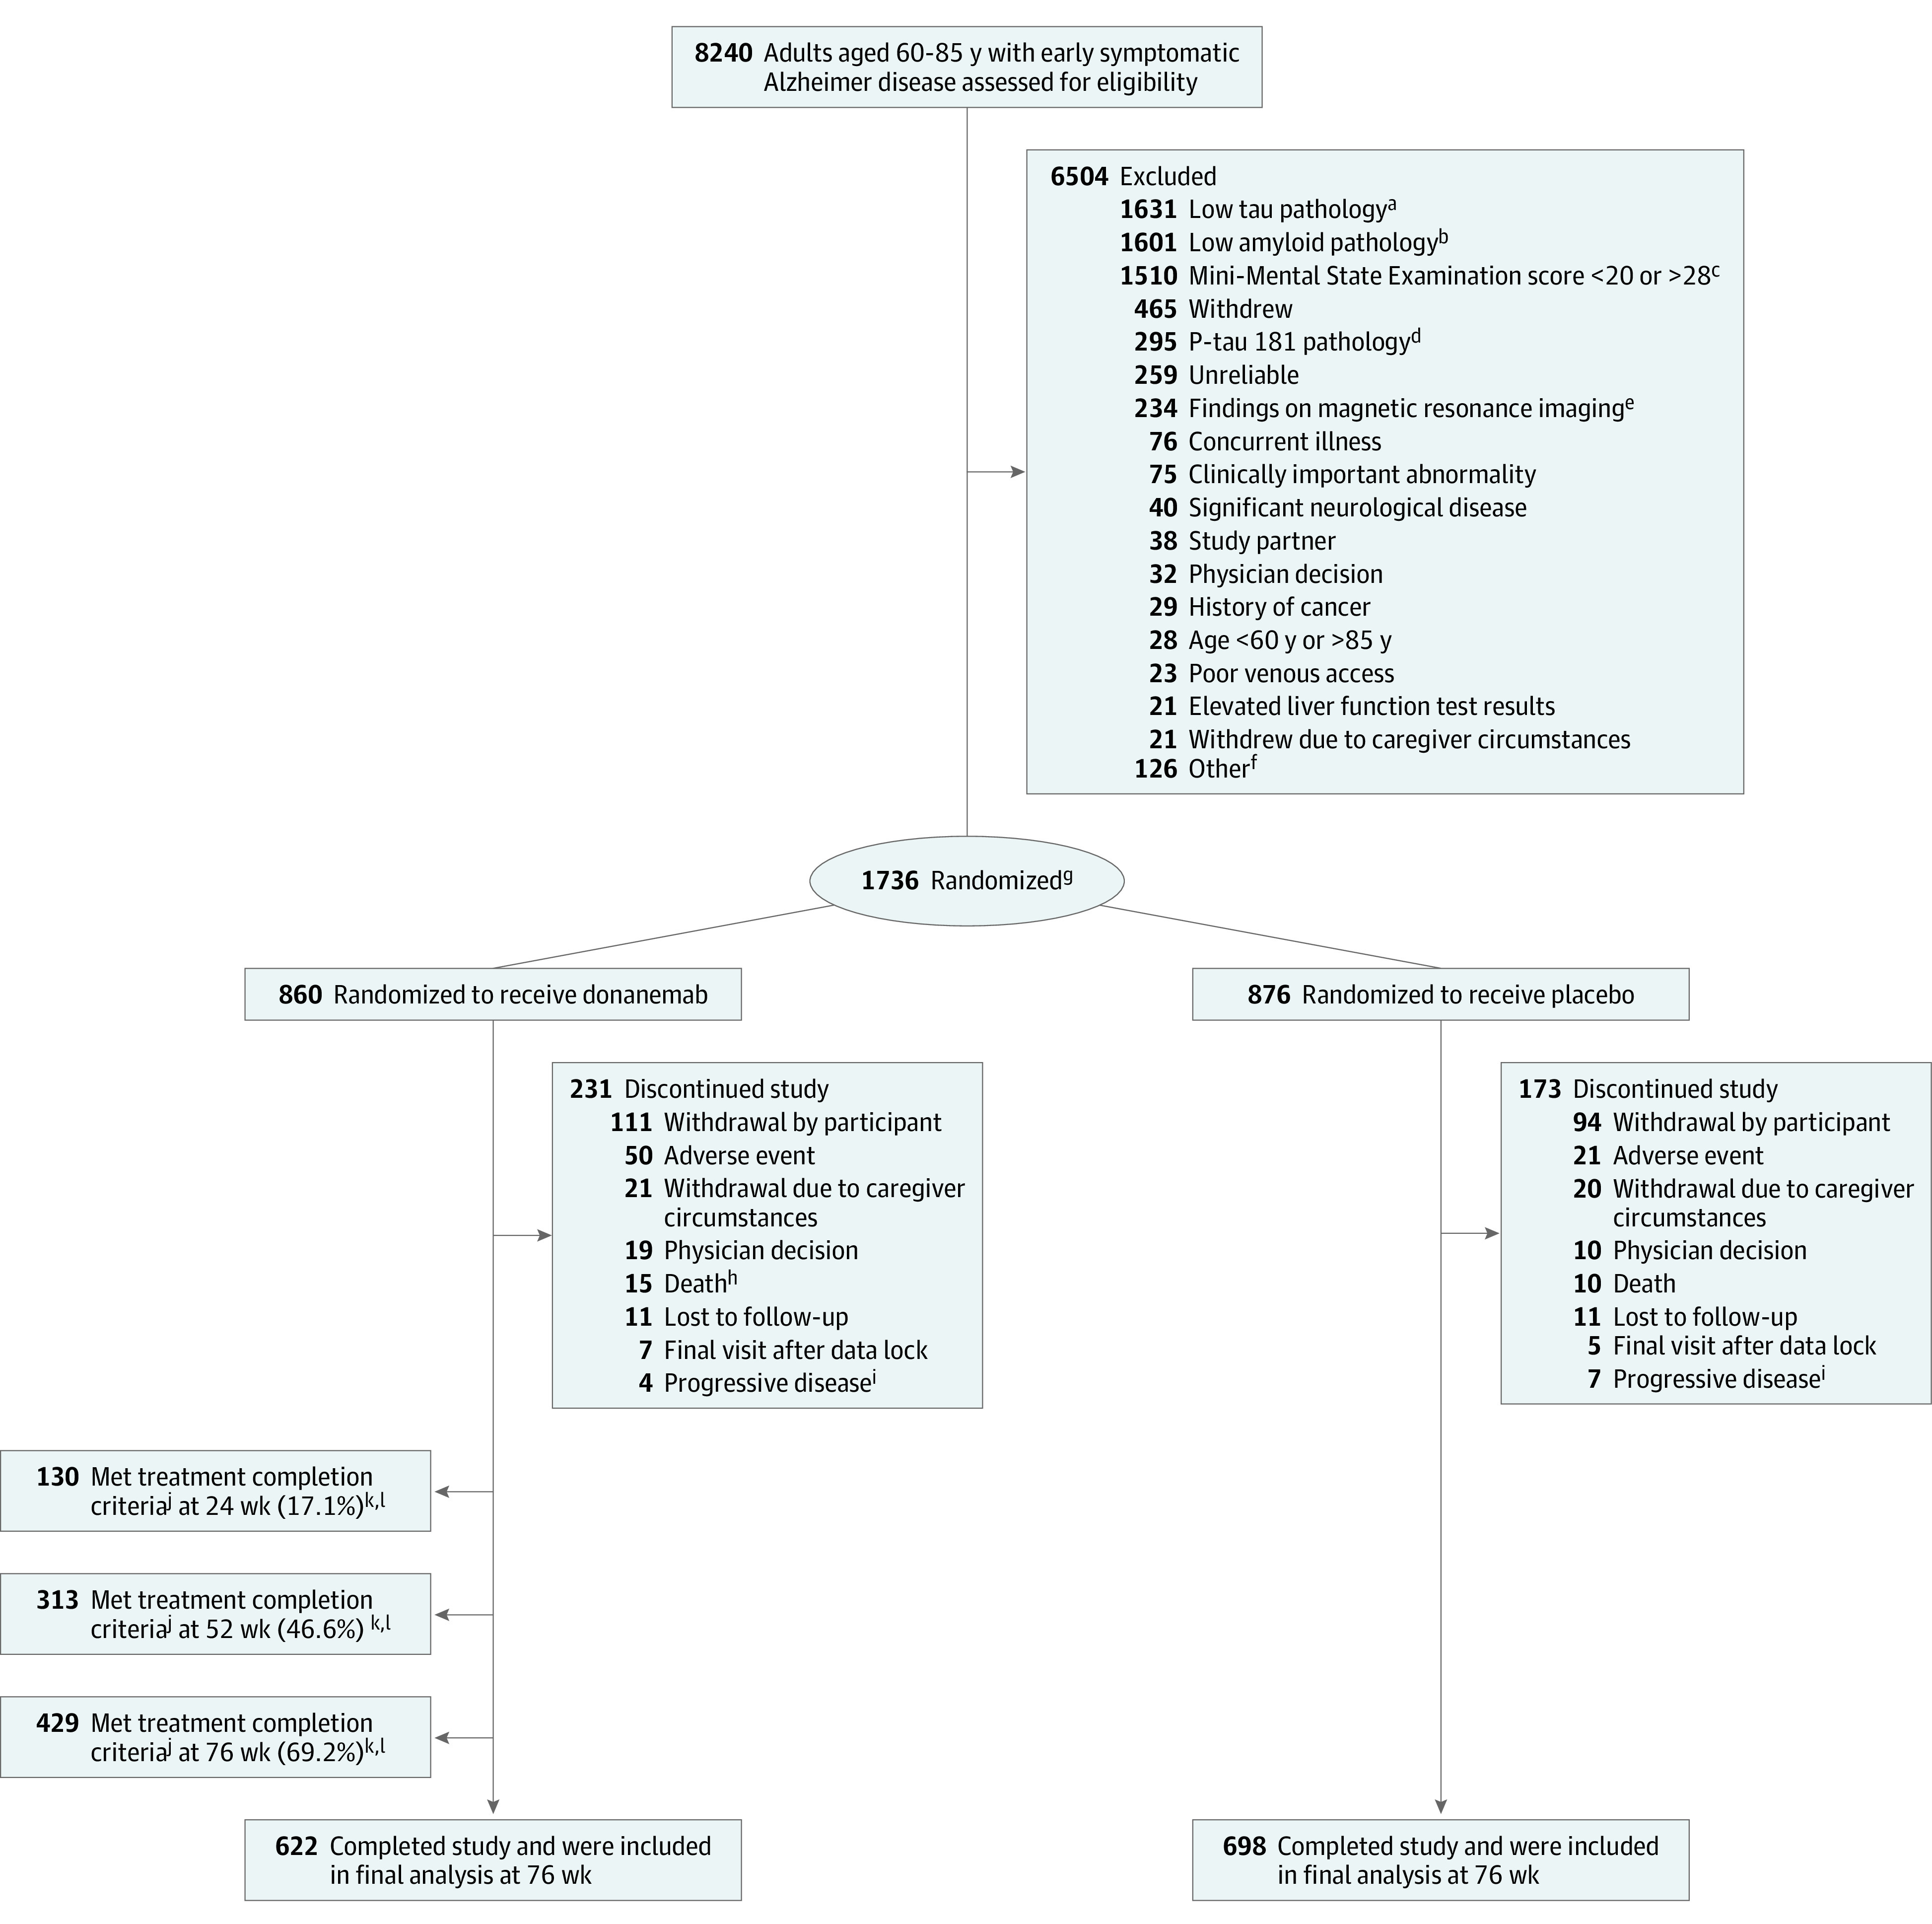
aInclusion criteria for tau pathology: low/medium or high tau indicated by standardized uptake value ratio >1.10 or positive visual read assessed by 18F-flortaucipir positron emission tomography (PET) imaging.
bInclusion criteria for amyloid pathology (≥37 Centiloids) assessed with 18F-florbetapir or 18F-florbetaben PET.
cInclusion criteria for Mini-Mental State Examination: score of 20 to 28.
dPhosphorylated tau 181 (P-tau181) screening criterion was not implemented for the entire trial duration (eMethods in Supplement 3).
eExclusion criteria for MRI include presence of amyloid-related imaging abnormalities of edema/effusion, >4 cerebral microhemorrhages, >1 area of superficial siderosis, and any intracerebral hemorrhage >1 cm or severe white matter disease.
fSummary of other screen failure can be found in eTable 3 in Supplement 3 (lists reason if ≥20 participants).
gStratified by baseline tau categorization and enrolling sites.
hOne additional death occurred after treatment completion and in the follow-up period.
iAlzheimer disease progression to a degree prompting study discontinuation, per investigator judgment.
jTreatment completion criteria: amyloid plaque level of 11 Centiloids on any single scan or 11 to <25 Centiloids on 2 consecutive scans.
kParticipants who met treatment completion criteria are included in discontinuation and completion numbers.
lPercentage calculated as No./total No. of participants with a PET scan at visit: n = 761 at 24 wk, n = 672 at 52 wk, and n = 620 at 76 wk. Corresponding number of participants and percentages for the low/medium tau population were 20.3% (n = 106) at 24 wk, 51.9% (n = 241) at 52 wk, and 73.5% (n = 321) at 76 wk.
Outcomes
The primary outcome was change in the iADRS score from baseline to 76 weeks in either the low/medium tau population or combined (low/medium and high tau) population. The iADRS is an integrated assessment of cognition and daily function from the 13-item cognitive subscale of the Alzheimer Disease Assessment Scale (ADAS-Cog13) and Alzheimer Disease Cooperative Study—Instrumental Activities of Daily Living (ADCS-iADL), measuring global disease severity across the Alzheimer disease continuum as a single summary score. The iADRS is validated and captures clinical progression from MCI due to Alzheimer disease through moderate dementia due to Alzheimer disease, and treatment effects have been demonstrated across MCI and Alzheimer disease with mild dementia.6,9,21,22,23,24,25,26,27 The possible scores on the iADRS range from 0 to 144 (lower scores indicate greater impairment), and the meaningful within-patient change (MWPC) is a change of 5 points for those with Alzheimer disease with MCI and 9 points for those with Alzheimer disease with mild dementia. The MWPC, or minimal clinically important difference (MCID) as in Supplement 1 and 2, is a threshold for outcome scores (either patient-reported or physician-measured) above which a patient or physician would consider the change meaningful.28
Prespecified secondary outcomes included changes from baseline to 76 weeks by sum of boxes of the Clinical Dementia Rating Scale (CDR-SB), the ADAS-Cog13, the ADCS-iADL, and MMSE in the low/medium tau or combined population. Amyloid plaque reduction at 76 weeks, percentage of participants reaching amyloid clearance (<24.1 Centiloids measured by amyloid PET9,29) at 24 weeks and 76 weeks, tau PET1 (frontal cortical regions) change, volumetric MRI (vMRI; whole brain, hippocampus, and ventricles) change, and adverse events were additional secondary outcomes. Supplement 1 provides a complete listing and methodology of adverse events assessments. Amyloid-related imaging abnormalities of edema/effusion, amyloid-related imaging abnormalities of microhemorrhages and hemosiderin deposits, and infusion-related reactions were adverse events of special interest because they were considered class effects or observed in previous trials.9,30,31,32 Secondary outcomes related to pharmacokinetics and antidrug antibodies were also prespecified and are planned for subsequent studies. Exploratory outcomes included change in plasma P-tau217 (C2N Diagnostics) at 76 weeks and time-based analyses: progression risk using the CDR Global score (CDR-G; progression defined as any increase from baseline in CDR-G at consecutive visits), participants with no progression at 1 year on the CDR-SB, and clinical progression delay (ie, months saved with treatment) on the iADRS and CDR-SB. Additional information about outcome measures, including score ranges and MWPCs, is provided in eMethods in Supplement 3.
Prespecified primary and secondary outcomes were controlled for multiplicity (gated) at 76 weeks (Supplement 2 and eMethods in Supplement 3) except for MMSE, changes in vMRI measurements, and adverse event assessments. Additional time points were gated for amyloid clearance and P-tau217. Nominal P values are reported for gated and nongated outcomes.
Sample Size Calculation
The trial was originally designed as a phase 2 trial with a plan to enroll 500 participants and assess CDR-SB as the primary outcome, but was subsequently amended to a phase 3 trial assessing the iADRS score as the primary outcome in February 2021 in an effort to confirm and expand the results of the TRAILBLAZER-ALZ trial. No unblinded data analysis of TRAILBLAZER-ALZ 2 was performed or used to inform design or analyses. Further details regarding major protocol or study adjustments are in eMethods in Supplement 3 and the trial protocol in Supplement 1.
Revised study sample size and power calculations were based on the primary results from the TRAILBLAZER-ALZ trial,9 where mean progression in the placebo and donanemab groups on iADRS was −10.06 and −6.86 (approximately 32% slowing of disease progression) over 76 weeks, respectively. Multiple longitudinal data sets were simulated and the natural cubic spline model with 2 degrees of freedom (NCS2) was fit to each sample to determine the power. The powering and sample size determination of the trial was based on the low/medium tau population. With a sample size of approximately 1000 randomized participants in the low/medium tau population and an assumed 30% discontinuation rate, the NCS model provided greater than 95% power to achieve statistical significance at a 2-sided α level of .05. The total planned enrollment (including both the low/medium and high tau populations) was 1800.
Statistical Analyses
Most statistical analyses were done with SAS version 9.4 (SAS Institute). Some time-based progression analyses were analyzed with R Project version 4.3.0 (R Foundation).
Efficacy Analyses
The efficacy analyses were conducted by using the evaluable efficacy population (participants with a baseline and at least 1 postbaseline efficacy measurement based on randomized treatment). A prespecified gated testing scheme33,34 was used to control for study-wise type I error rate at 2-sided α level of .05, with 80% of initial α spend (.04) for multiplicity control allocated to the low/medium tau population and 20% of initial α spend (.01) for multiplicity control allocated to the combined population (testing scheme in Supplement 2; eMethods in Supplement 3 also describes time-based analyses not described below).
NCS2 Model
Clinical outcomes (except for CDR-SB) were primarily analyzed using an NCS2 model. The protocol-specified week value for each participant was used as a continuous variable to create NCS basis functions with knot locations at 0 weeks, the median observation time, and 76 weeks. The model restricted baseline estimates to be the same for treatment and placebo groups. The baseline score and each scheduled postbaseline score were dependent variables in the model. The model’s independent variables included NCS basis expansion terms (2 terms), NCS basis expansion term × treatment interaction (2 terms), baseline age, concomitant acetylcholinesterase inhibitor and/or memantine use at baseline (yes/no), and randomization stratifying factors (pooled site and baseline tau category [baseline tau category in combined population only]). An unstructured variance covariance matrix was used to model the within-participant errors using restricted maximum likelihood. The Kenward-Roger approximation was used to estimate the denominator degrees of freedom.
Mixed Models for Repeated Measures (MMRM)
The MMRM was used to primarily assess CDR-SB, plasma P-tau217, amyloid PET, and vMRI. The analysis model used change from baseline as the dependent variable. The model was adjusted for age, baseline value, visit as a categorical variable, treatment, baseline × visit interactions, treatment × visit interactions, concomitant acetylcholinesterase inhibitor/memantine use at baseline (CDR-SB only), and randomization stratifying factors of pooled site and, for combined population only, baseline tau category. For vMRI, only age and baseline brain volumes were covariates. The covariance matrix structure used was the same as NCS. Plasma P-tau 217 value was log10-transformed to meet the normality assumption.
Both the NCS2 and MMRM use the same protocol-specified time values for each participant in the analysis; the NCS2 model makes additional parametric assumptions for the shape of the longitudinal mean structure that can lead to increased efficiency.
Slowing of Clinical Disease Progression
The percent slowing relative to placebo was calculated by dividing the least-squares mean (LSM) change from baseline treatment differences at 76 weeks by the LSM change from baseline with placebo at 76 weeks and multiplying by 100.
Analysis of Covariance (ANCOVA)
ANCOVA analysis was conducted for tau PET standardized uptake value ratio (SUVR), with change from baseline to 76 weeks as the dependent variable and covariates of baseline tau SUVR, age, and, for the combined population, tau burden.
Sensitivity and Additional Analyses
MMRM, NCS with 3 degrees of freedom model (NCS3), and bayesian disease progression model (DPM) were applied as sensitivity analyses for the primary outcome. DPM was applied to measure the proportion of disease progression in donanemab-treated participants relative to placebo-treated participants using a disease progression ratio, as previously described.35 Details on sensitivity analyses for censoring after amyloid-related imaging abnormalities or infusion-related reactions, per-protocol analysis, and analysis of study completers are in eMethods in Supplement 3. Details of subgroup analyses and time-based analyses are also described in eMethods in Supplement 3.
Cox proportional hazard models were applied to CDR-G (gated), iADRS (nongated), and CDR-SB (nongated). Progression to next clinical stage was defined as any increase in CDR-G at 2 consecutive visits from baseline. MWPC was established as an iADRS change of greater than or equal to 5 for those with Alzheimer disease with MCI and greater than or equal to 9 points for those with Alzheimer disease with mild dementia and a CDR-SB change of greater than or equal to 1 point for those with Alzheimer disease with MCI and greater than or equal to 2 points for Alzheimer disease with mild dementia at 2 consecutive visits from baseline.
Analyses of the high tau population alone (ie, not combined with the low/medium tau population) for primary and secondary outcomes was performed post hoc.
Adverse Events
Adverse events were evaluated in all participants exposed to study drug and were summarized according to event frequency by treatment assignment.
Missing Data
If less than 30% of the ADCS-iADL, 3 or fewer items of the ADAS-Cog13, or 1 box of the CDR were missing, the total score for these assessments was imputed. If more items were missing than defined, the total score at that visit was considered missing (Supplement 2). If either the ADCS-iADL or ADAS-Cog13 scores were missing, the iADRS score was considered as missing. The missing data for NCS and MMRM analyses were handled by the likelihood-based mixed-effect model and the model parameters were estimated using restricted likelihood estimation incorporating all the observed data.
Results
All presented primary, secondary, and exploratory outcomes were controlled for multiplicity (gated) in at least 1 population except for MMSE, vMRI measurements, and safety assessments. Of the 24 gated outcomes (eMethods in Supplement 3), 23 were statistically significant.
Trial Population and Baseline Characteristics
Of 8240 participants screened, 1736 were enrolled (mean age, 73.0 years; 996 [57.4%] women) and 76% completed the trial: 860 were assigned to receive donanemab and 876 were assigned to receive placebo (Figure 1). Baseline characteristics are summarized by treatment groups in both low/medium tau (n = 1182) and combined populations (n = 1736) (Table 1). As expected, the combined population had higher tau biomarkers at baseline due to the inclusion of participants with high tau pathology and showed greater impairment across baseline clinical assessments.
Table 1. Baseline Demographics and Clinical Characteristics in the Low/Medium and Combined Tau Populations.
| Characteristic | Low/medium tau | Combined tau | ||
|---|---|---|---|---|
| Donanemab (n = 588) | Placebo (n = 594) | Donanemab (n = 860) | Placebo (n = 876) | |
| Sex, No. (%) | ||||
| Women | 325 (55.3) | 321 (54.0) | 493 (57.3) | 503 (57.4) |
| Men | 263 (44.7) | 273 (46.0) | 367 (42.7) | 373 (42.6) |
| Age, mean (SD), y | 74.3 (5.7) | 74.3 (5.8) | 73.0 (6.2) | 73.0 (6.2) |
| Race, No. (%)a | ||||
| American Indian or Alaska Native | 1 (0.2) | 0 | 2 (0.2) | 0 (0.0) |
| Asian | 48 (8.2) | 38 (6.4) | 57 (6.6) | 47 (5.4) |
| Black or African American | 17 (2.9) | 17 (2.9) | 19 (2.2) | 21 (2.4) |
| White | 522 (88.8) | 539 (90.7) | 781 (90.9) | 807 (92.1) |
| Multiple | 0 | 0 | 0 | 1 (0.1) |
| Missing | 0 | 0 | 1 (0.1) | 0 |
| Race (US only), No./total No. (%)a | ||||
| American Indian or Alaska Native | 1/415 (0.2) | 0 | 2/619 (0.3) | 0 |
| Asian | 4/415 (1.0) | 2/417 (0.5) | 8/619 (1.3) | 3/632 (0.5) |
| Black or African American | 17/415 (4.1) | 13/417 (3.1) | 18/619 (2.9) | 16/632 (2.5) |
| White | 393/415 (94.7) | 402/417 (96.4) | 591/619 (95.5) | 612/632 (96.8) |
| Multiple | 0 | 0 | 0 | 1/632 (0.2) |
| Ethnicity (US only), No. (%)b | ||||
| Hispanic/Latino | 24 (5.8) | 26 (6.3) | 35 (5.7) | 36 (5.7) |
| Not Hispanic/Latino | 390 (94.2) | 390 (93.8) | 583 (94.3) | 594 (94.3) |
| Education of ≥13 y, No. (%) | 407 (69.2) | 421 (71.0) | 606 (70.5) | 637 (72.8) |
| APOE carrier, No. (%) | 421 (71.7) | 427 (72.3) | 598 (69.8) | 621 (71.2) |
| E2/E2 | 0 | 1 (0.2) | 0 | 1 (0.1) |
| E2/E3 | 10 (1.7) | 14 (2.4) | 18 (2.1) | 20 (2.3) |
| E2/E4 | 17 (2.9) | 19 (3.2) | 22 (2.6) | 25 (2.9) |
| E3/E3 | 156 (26.6) | 149 (25.2) | 241 (28.1) | 230 (26.4) |
| E3/E4 | 314 (53.5) | 308 (52.1) | 433 (50.5) | 450 (51.6) |
| E4/E4 | 90 (15.3) | 100 (16.9) | 143 (16.7) | 146 (16.7) |
| Acetylcholinesterase inhibitor/memantine use, No. (%) | 332 (56.5) | 341 (57.4) | 521 (60.6) | 538 (61.4) |
| Clinical outcomes, mean (SD)c | ||||
| iADRS score | 105.7 (13.8) | 105.5 (13.7) | 104.1 (14.3) | 103.6 (14.0) |
| CDR-SB score | 3.7 (2.1) | 3.7 (2.0) | 4.0 (2.1) | 3.9 (2.1) |
| ADAS-Cog13 score | 27.5 (8.5) | 27.8 (8.4) | 28.7 (8.8) | 29.3 (8.9) |
| ADCS-ADL score | 66.7 (8.5) | 66.9 (8.5) | 66.3 (8.6) | 66.4 (8.3) |
| ADCS-iADL score | 48.1 (7.9) | 48.4 (7.9) | 47.8 (7.9) | 47.8 (7.8) |
| MMSE scored | 23.1 (3.6) | 22.8 (3.8) | 22.4 (3.8) | 22.2 (3.9) |
| MMSE category, No. (%)e | ||||
| Mild cognitive impairment (≥27) | 115 (19.6) | 116 (19.6) | 146 (17.0) | 137 (15.7) |
| Mild Alzheimer disease (20-26) | 472 (80.3) | 477 (80.4) | 713 (82.9) | 738 (84.3) |
| Moderate Alzheimer disease (<20) | 1 (0.2) | 0 | 1 (0.1) | 0 |
| CDR-G score, No. (%) | ||||
| 0 | 2 (0.3) | 3 (0.5) | 2 (0.2) | 4 (0.5) |
| 0.5 | 382 (65.9) | 387 (65.5) | 514 (60.8) | 532 (61.2) |
| 1 | 177 (30.5) | 185 (31.3) | 304 (36.0) | 308 (35.4) |
| 2 | 19 (3.3) | 16 (2.7) | 25 (3.0) | 25 (2.9) |
| Biomarker measures, mean (SD) | ||||
| Amyloid plaque level, Centiloidf | 102.4 (34.7) | 100.9 (35.1) | 103.5 (34.5) | 101.6 (34.5) |
| Alzheimer disease signature weighted neocortical flortaucipir SUVR16,e,g | 1.21 (0.12) | 1.21 (0.13) | 1.34 (0.25) | 1.35 (0.26) |
| Plasma P-tau217, pg/mLh | 6.6 (17.7) | 5.4 (11.3) | 7.5 (18.5) | 6.8 (15.4) |
Abbreviations: ADAS-Cog13, 13-item cognitive subscale of the Alzheimer Disease Assessment Scale; ADCS-ADL, Alzheimer Disease Cooperative Study—Activities of Daily Living; ADCS-iADL, Alzheimer Disease Cooperative Study—Instrumental Activities of Daily Living; APOE, apolipoprotein E; CDR-G, Clinical Dementia Rating Global Score; CDR-SB, sum of boxes of the Clinical Dementia Rating Scale; iADRS, Integrated Alzheimer Disease Rating Scale; MMSE, Mini-Mental State Examination; P-tau217, phosphorylated tau 217; SUVR, standardized uptake value ratio.
Race data were self-reported by participants within fixed categories.
Ethnicity reporting was limited to participants in the US and Puerto Rico only; percentages were calculated using the number of participants with nonmissing data as the denominator.
See eMethods in Supplement 3 for further details on scales and their explanations. Clinical outcome ranges were as follows: ADAS-Cog13 scores range from 0 to 85, with higher scores indicating greater overall cognition deficit; ADCS-ADL scores range from 0 to 78, with lower scores indicating greater level of impairment; ADCS-iADL scores range from 0 to 59, with lower scores indicating greater impairment in daily function; CDR-G scores range from 0 (no dementia) to 3 (severe dementia); CDR-SB scores range from 0 to 18, with higher scores indicating greater clinical impairment; iADRS scores range from 0 to 144, with lower scores indicating greater impairment; and MMSE scores range from 0 to 30, with lower scores indicating greater level of impairment.
Last nonmissing MMSE score prior to or at the start of study treatment.
Based on screening data.
Assessed with 18F-florbetapir or 18F-florbetaben PET.
Assessed with 18F-flortaucipir PET. Global tau uptake was measured using a composite neocortical SUVR with white matter signal reference.36
Plasma P-tau217 denotes plasma-measured phosphorylated tau at threonine 217, a blood biomarker specific to Alzheimer disease and associated with both amyloid and tau pathology.37
Primary Outcome
In the low/medium tau population, LSM change from baseline in the iADRS score at 76 weeks was −6.02 (95% CI, −7.01 to −5.03) in the donanemab group and −9.27 (95% CI, −10.23 to −8.31) in the placebo group (difference, 3.25 [95% CI, 1.88-4.62]; P < .001), representing a 35.1% (95% CI, 19.90%-50.23%) slowing of disease progression (Figure 2, Table 2).
Figure 2. Integrated Alzheimer Disease Rating Scale (iADRS) and Sum of Boxes of the Clinical Dementia Rating Scale (CDR-SB) From Baseline to 76 Weeks.
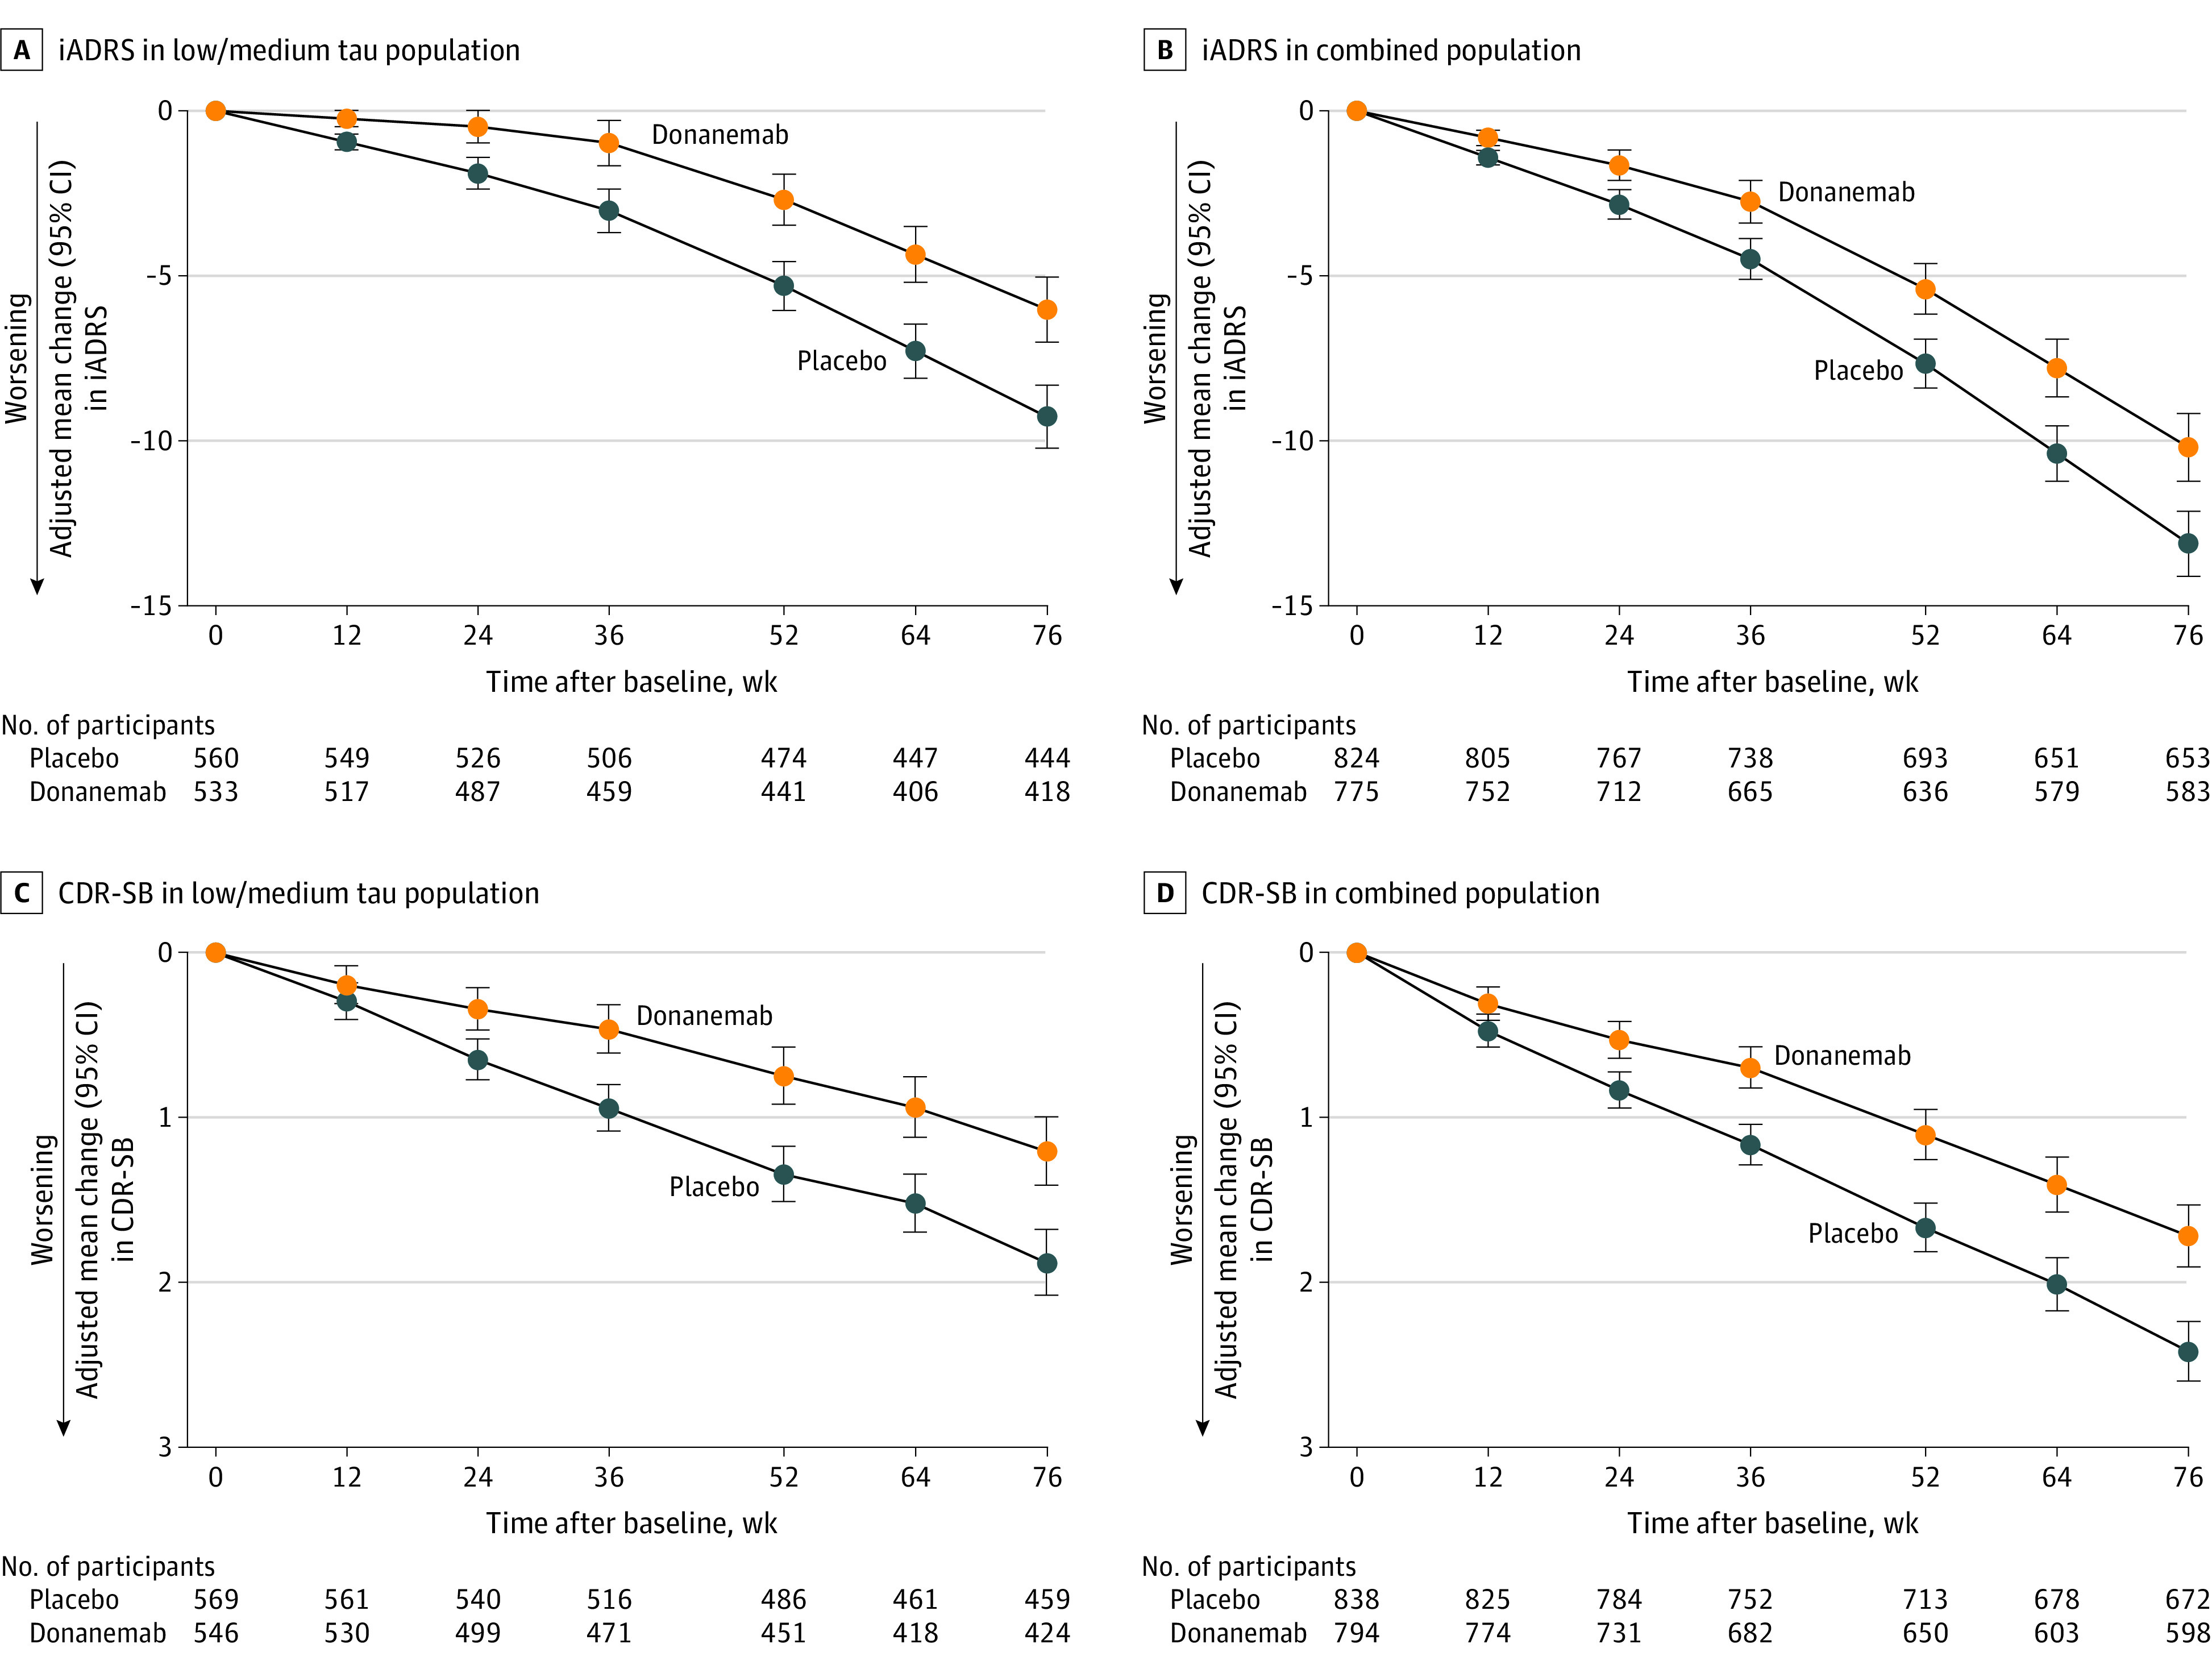
A, 35.1% slowing (95% CI, 19.90%-50.23%) of clinical progression. B, 22.3% slowing (95% CI, 11.38%-33.15%) of clinical progression. C, 36.0% slowing (95% CI, 20.76%-51.15%) of clinical progression. D, 28.9% slowing (95% CI, 18.41%-39.44%) of clinical progression. iADRS data were analyzed using the natural cubic spline model with 2 degrees of freedom (NCS2) and CDR-SB data were analyzed with mixed models for repeated measures (MMRM). For MMRM analyses, 95% CIs for least-squares mean changes were calculated with the normal approximation method. For the Alzheimer Disease Cooperative Study—Instrumental Activities of Daily Living, 13-item cognitive subscale of the Alzheimer Disease Assessment Scale, and CDR-SB clinical assessments analyzed with NCS2, see eFigure 1 (low/medium tau population) and eFigure 2 (combined population) in Supplement 3 and Table 2. For all clinical assessments analyzed with MMRM, see eFigure 3 (low/medium tau population) and 4 (combined population) in Supplement 3 and Table 2. P < .001 for all 76 week time points.
Table 2. Clinical Outcomes From Baseline to 76 Weeks in the Low/Medium Tau and Combined Populations.
| Outcomea | Group | Donanemab | Placebo | LSM difference vs placebo (95% CI) | P value vs placebo | Slowing of clinical progression, % (95% CI)b | ||||
|---|---|---|---|---|---|---|---|---|---|---|
| Mean (SD) | LSM change (95% CI) | Mean (SD) | LSM change | |||||||
| Baseline | 76 Weeks | Baseline | 76 Weeks | |||||||
| iADRS | Low/medium tau | n = 533 | n = 418 | n = 560 | n = 444 | |||||
| NCS2c | 105.92 (13.72) | 101.31 (18.23) | −6.02 (−7.01 to −5.03) | 105.95 (13.42) | 98.88 (17.95) | −9.27 (−10.23 to −8.31) | 3.25 (1.88 to 4.62) | <.001 | 35.1 (19.90 to 50.23) | |
| MMRMd | 105.92 (13.72) | 101.31 (18.23) | −5.81 (−6.90 to −4.71) | 105.95 (13.42) | 98.88 (17.96) | −9.61 (−10.67 to −8.56) | 3.80 (2.36 to 5.25) | <.001 | 39.6 (23.93 to 55.22) | |
| Combined | n = 775 | n = 583 | n = 824 | n = 653 | ||||||
| NCS2c | 104.55 (13.90) | 96.98 (20.87) | −10.19 (−11.22 to −9.16) | 103.82 (13.88) | 93.82 (20.38) | −13.11 (−14.10 to −12.13) | 2.92 (1.51 to 4.33) | <.001 | 22.3 (11.38 to 33.15) | |
| MMRMd | 104.55 (13.90) | 96.98 (20.87) | −10.19 (−11.27 to −9.11) | 103.82 (13.88) | 93.82 (20.38) | −13.22 (−14.27 to −12.18) | 3.03 (1.60 to 4.47) | <.001 | 22.9 (11.96 to 33.92) | |
| CDR-SB | Low/medium tau | n = 546 | n = 424 | n = 569 | n = 459 | |||||
| NCS2 | 3.72 (2.09) | 4.64 (2.90) | 1.16 (0.97 to 1.35) | 3.64 (1.99) | 5.13 (2.93) | 1.84 (1.65 to 2.02) | −0.68 (−0.94 to −0.42) | <.001 | 37.0 (22.26 to 51.75) | |
| MMRMc,d | 3.72 (2.09) | 4.64 (2.90) | 1.20 (1.00 to 1.41) | 3.64 (1.99) | 5.13 (2.93) | 1.88 (1.68 to 2.08) | −0.67 (−0.95 to −0.40) | <.001 | 36.0 (20.76 to 51.15) | |
| Combined | n = 794 | n = 598 | n = 838 | n = 672 | ||||||
| NCS2 | 3.92 (2.06) | 5.25 (3.21) | 1.66 (1.48 to 1.83) | 3.89 (2.03) | 5.80 (3.22) | 2.33 (2.16 to 2.50) | −0.67 (−0.92 to −0.43) | <.001 | 28.9 (18.26 to 39.53) | |
| MMRMc,d | 3.92 (2.06) | 5.25 (3.21) | 1.72 (1.53 to 1.91) | 3.89 (2.03) | 5.80 (3.22) | 2.42 (2.24 to 2.60) | −0.70 (−0.95 to −0.45) | <.001 | 28.9 (18.41 to 39.44) | |
| ADCS-iADL | Low/medium tau | n = 535 | n = 420 | n = 562 | n = 451 | |||||
| NCS2c | 48.20 (7.88) | 46.12 (10.26) | −2.76 (−3.42 to −2.10) | 48.56 (7.70) | 45.10 (9.82) | −4.59 (−5.23 to −3.95) | 1.83 (0.91 to 2.75) | <.001 | 39.9 (19.15 to 60.58) | |
| MMRMd | 48.20 (7.88) | 46.12 (10.26) | −2.66 (−3.39 to −1.94) | 48.56 (7.70) | 45.10 (9.82) | −4.66 (−5.36 to −3.96) | 2.00 (1.04 to 2.96) | <.001 | 42.9 (21.39 to 64.44) | |
| Combined | n = 780 | n = 591 | n = 826 | n = 661 | ||||||
| NCS2c | 47.96 (7.85) | 44.53 (11.06) | −4.42 (−5.05 to −3.80) | 47.98 (7.70) | 43.30 (10.61) | −6.13 (−6.72 to −5.53) | 1.70 (0.84 to 2.57) | <.001 | 27.8 (13.48 to 42.13) | |
| MMRMd | 47.96 (7.85) | 44.53 (11.06) | −4.57 (−5.24 to −3.90) | 47.98 (7.70) | 43.30 (10.61) | −6.32 (−6.97 to −5.67) | 1.75 (0.86 to 2.64) | <.001 | 27.7 (13.37 to 42.00) | |
| ADAS-Cog13 | Low/medium tau | n = 550 | n = 431 | n = 570 | n = 460 | |||||
| NCS2c | 27.41 (8.44) | 29.77 (10.65) | 3.17 (2.64 to 3.69) | 27.60 (8.21) | 31.17 (10.37) | 4.69 (4.18 to 5.20) | −1.52 (−2.25 to −0.79) | <.001 | 32.4 (16.55 to 48.35) | |
| MMRMd | 27.41 (8.44) | 29.77 (10.65) | 3.16 (2.54 to 3.77) | 27.60 (8.21) | 31.17 (10.37) | 4.88 (4.28 to 5.47) | −1.72 (−2.53 to −0.92) | <.001 | 35.3 (18.27 to 52.33) | |
| Combined | n = 797 | n = 607 | n = 841 | n = 677 | ||||||
| NCS2c | 28.53 (8.78) | 32.72 (12.44) | 5.46 (4.91 to 6.01) | 29.16 (8.85) | 34.53 (12.00) | 6.79 (6.26 to 7.32) | −1.33 (−2.09 to −0.57) | <.001 | 19.5 (8.23 to 30.83) | |
| MMRMd | 28.53 (8.78) | 32.72 (12.44) | 5.70 (5.10 to 6.30) | 29.16 (8.85) | 34.53 (12.00) | 7.05 (6.47 to 7.63) | −1.35 (−2.14 to −0.57) | <.001 | 19.2 (7.99 to 30.38) | |
| MMSE | Low/medium tau | n = 549 | n = 429 | n = 573 | n = 465 | |||||
| NCS2 | 23.11 (3.64) | 22.00 (4.90) | −1.61 (−1.89 to −1.33) | 22.88 (3.74) | 21.30 (4.82) | −2.09 (−2.36 to −1.81) | 0.48 (0.09 to 0.87) | .02 | 22.9 (4.04 to 41.84) | |
| MMRMd | 23.11 (3.64) | 22.00 (4.90) | −1.58 (−1.91 to −1.25) | 22.88 (3.74) | 21.30 (4.82) | −2.15 (−2.47 to −1.83) | 0.57 (0.13 to 1.00) | .01 | 26.4 (5.88 to 47.01) | |
| Combined | n = 796 | n = 600 | n = 841 | n = 679 | ||||||
| NCS2 | 22.52 (3.84) | 20.71 (5.52) | −2.47 (−2.73 to −2.20) | 22.20 (3.90) | 19.79 (5.51) | −2.94 (−3.20 to −2.69) | 0.47 (0.10 to 0.84) | .01 | 16.1 (3.49 to 28.67) | |
| MMRMd | 22.52 (3.84) | 20.71 (5.52) | −2.75 (−3.05 to −2.44) | 22.20 (3.90) | 19.79 (5.51) | −3.22 (−3.51 to −2.93) | 0.48 (0.08 to 0.87) | .02 | 14.8 (2.46 to 27.06) | |
Abbreviations: ADAS-Cog13, 13-item cognitive subscale of the Alzheimer Disease Assessment Scale; ADCS-iADL, Alzheimer Disease Cooperative Study—Instrumental Activities of Daily Living; CDR-SB, sum of boxes of the Clinical Dementia Rating Scale; iADRS, Integrated Alzheimer Disease Rating Scale; MMRM, mixed models for repeated measures; MMSE, Mini-Mental State Examination; NCS2, natural cubic spline with 2 degrees of freedom.
Clinical outcomes were scored as follows: ADAS-Cog13 scores range from 0 to 85, with higher scores indicating greater overall cognition deficit; ADCS-iADL range from 0 to 59, with lower scores indicating greater impairment in daily function; CDR-SB range from 0 to 18, with higher scores indicating greater clinical impairment; iADRS range from 0 to 144, with lower scores indicating greater impairment; and MMSE range from 0 to 30, with lower scores indicating greater level of impairment.
The percentage of slowing of clinical progression was calculated by dividing the least-squares mean change from baseline treatment differences at 76 weeks by the least-squares mean change from baseline with placebo at 76 weeks and multiplying by 100. The CI is estimated using the Delta method.
Gated outcome.
For MMRM analyses, 95% CIs for least-squares mean changes were calculated with the normal approximation method.
In the combined population, LSM change from baseline in the iADRS score at 76 weeks was −10.19 (95% CI, −11.22 to −9.16) in the donanemab group and −13.11 (95% CI, −14.10 to −12.13) in the placebo group (difference, 2.92 [95% CI, 1.51-4.33]; P < .001), representing a 22.3% (95% CI, 11.38%-33.15%) slowing of disease progression (Figure 2, Table 2).
Secondary Outcomes
Clinical Assessments
In the low/medium tau population, the differences between treatment groups in the LSM change from baseline at 76 weeks was −0.67 (95% CI, −0.95 to −0.40) (36.0% [95% CI, 20.76%-51.15%] slowing of clinical progression) for CDR-SB, 1.83 (95% CI, 0.91-2.75) (39.9% [95% CI, 19.15%-60.58%] slowing of clinical progression) for ADCS-iADL, and −1.52 (95% CI, −2.25 to −0.79) (32.4% [95% CI, 16.55%-48.35%] slowing of clinical progression) for ADAS-Cog13 (Figure 2, Table 2; eFigure 1 and 3 in Supplement 3).
In the combined population, the differences in the LSM change from baseline to 76 weeks between the donanemab and placebo groups were −0.70 (95% CI, −0.95 to −0.45) (28.9% [95% CI, 18.26%-39.53%] slowing of clinical progression) for CDR-SB, 1.70 (95% CI, 0.84-2.57) (27.8% [95% CI, 13.48%-42.13%] slowing of clinical progression) for ADCS-iADL, and −1.33 (95% CI, −2.09 to −0.57) (19.5% [95% CI, 8.23%-30.83%] slowing of clinical progression) for ADAS-Cog13 (Figure 2, Table 2; eFigures 2 and 4 in Supplement 3).
Amyloid PET
At 76 weeks, brain amyloid plaque level decreased by 88.0 Centiloids (95% CI, −90.20 to −85.87) with donanemab treatment and increased by 0.2 Centiloids (95% CI, −1.91 to 2.26) in the placebo group in the low/medium tau population; in the combined population, amyloid plaque level decreased by 87.0 Centiloids (95% CI, −88.90 to −85.17) with donanemab treatment and decreased by 0.67 Centiloids (95% CI, −2.45 to 1.11) in the placebo group (Figure 3A). The percentages of donanemab-treated participants in the low/medium tau population who reached amyloid clearance29,38 were 34.2% (95% CI, 30.22%-38.34%) at 24 weeks and 80.1% (95% CI, 76.12%-83.62%) at 76 weeks compared with 0.2% (95% CI, 0.03%-1.02%) at 24 weeks and 0% (95% CI, 0.00%-0.81%) at 76 weeks of placebo-treated participants. In the combined population, amyloid clearance was reached in 29.7% (95% CI, 26.56%-33.04%) of participants at 24 weeks and 76.4% (95% CI, 72.87%-79.57%) at 76 weeks of donanemab-treated participants compared with 0.2% (95% CI, 0.07%-0.90%) at 24 weeks and 0.3% (95% CI, 0.08%-1.05%) at 76 weeks of placebo-treated participants (Figure 3B).
Figure 3. Brain Amyloid, Plasma Phosphorylated Tau 217 (P-tau217), and Hazard Ratios for Risk of Disease Progression.
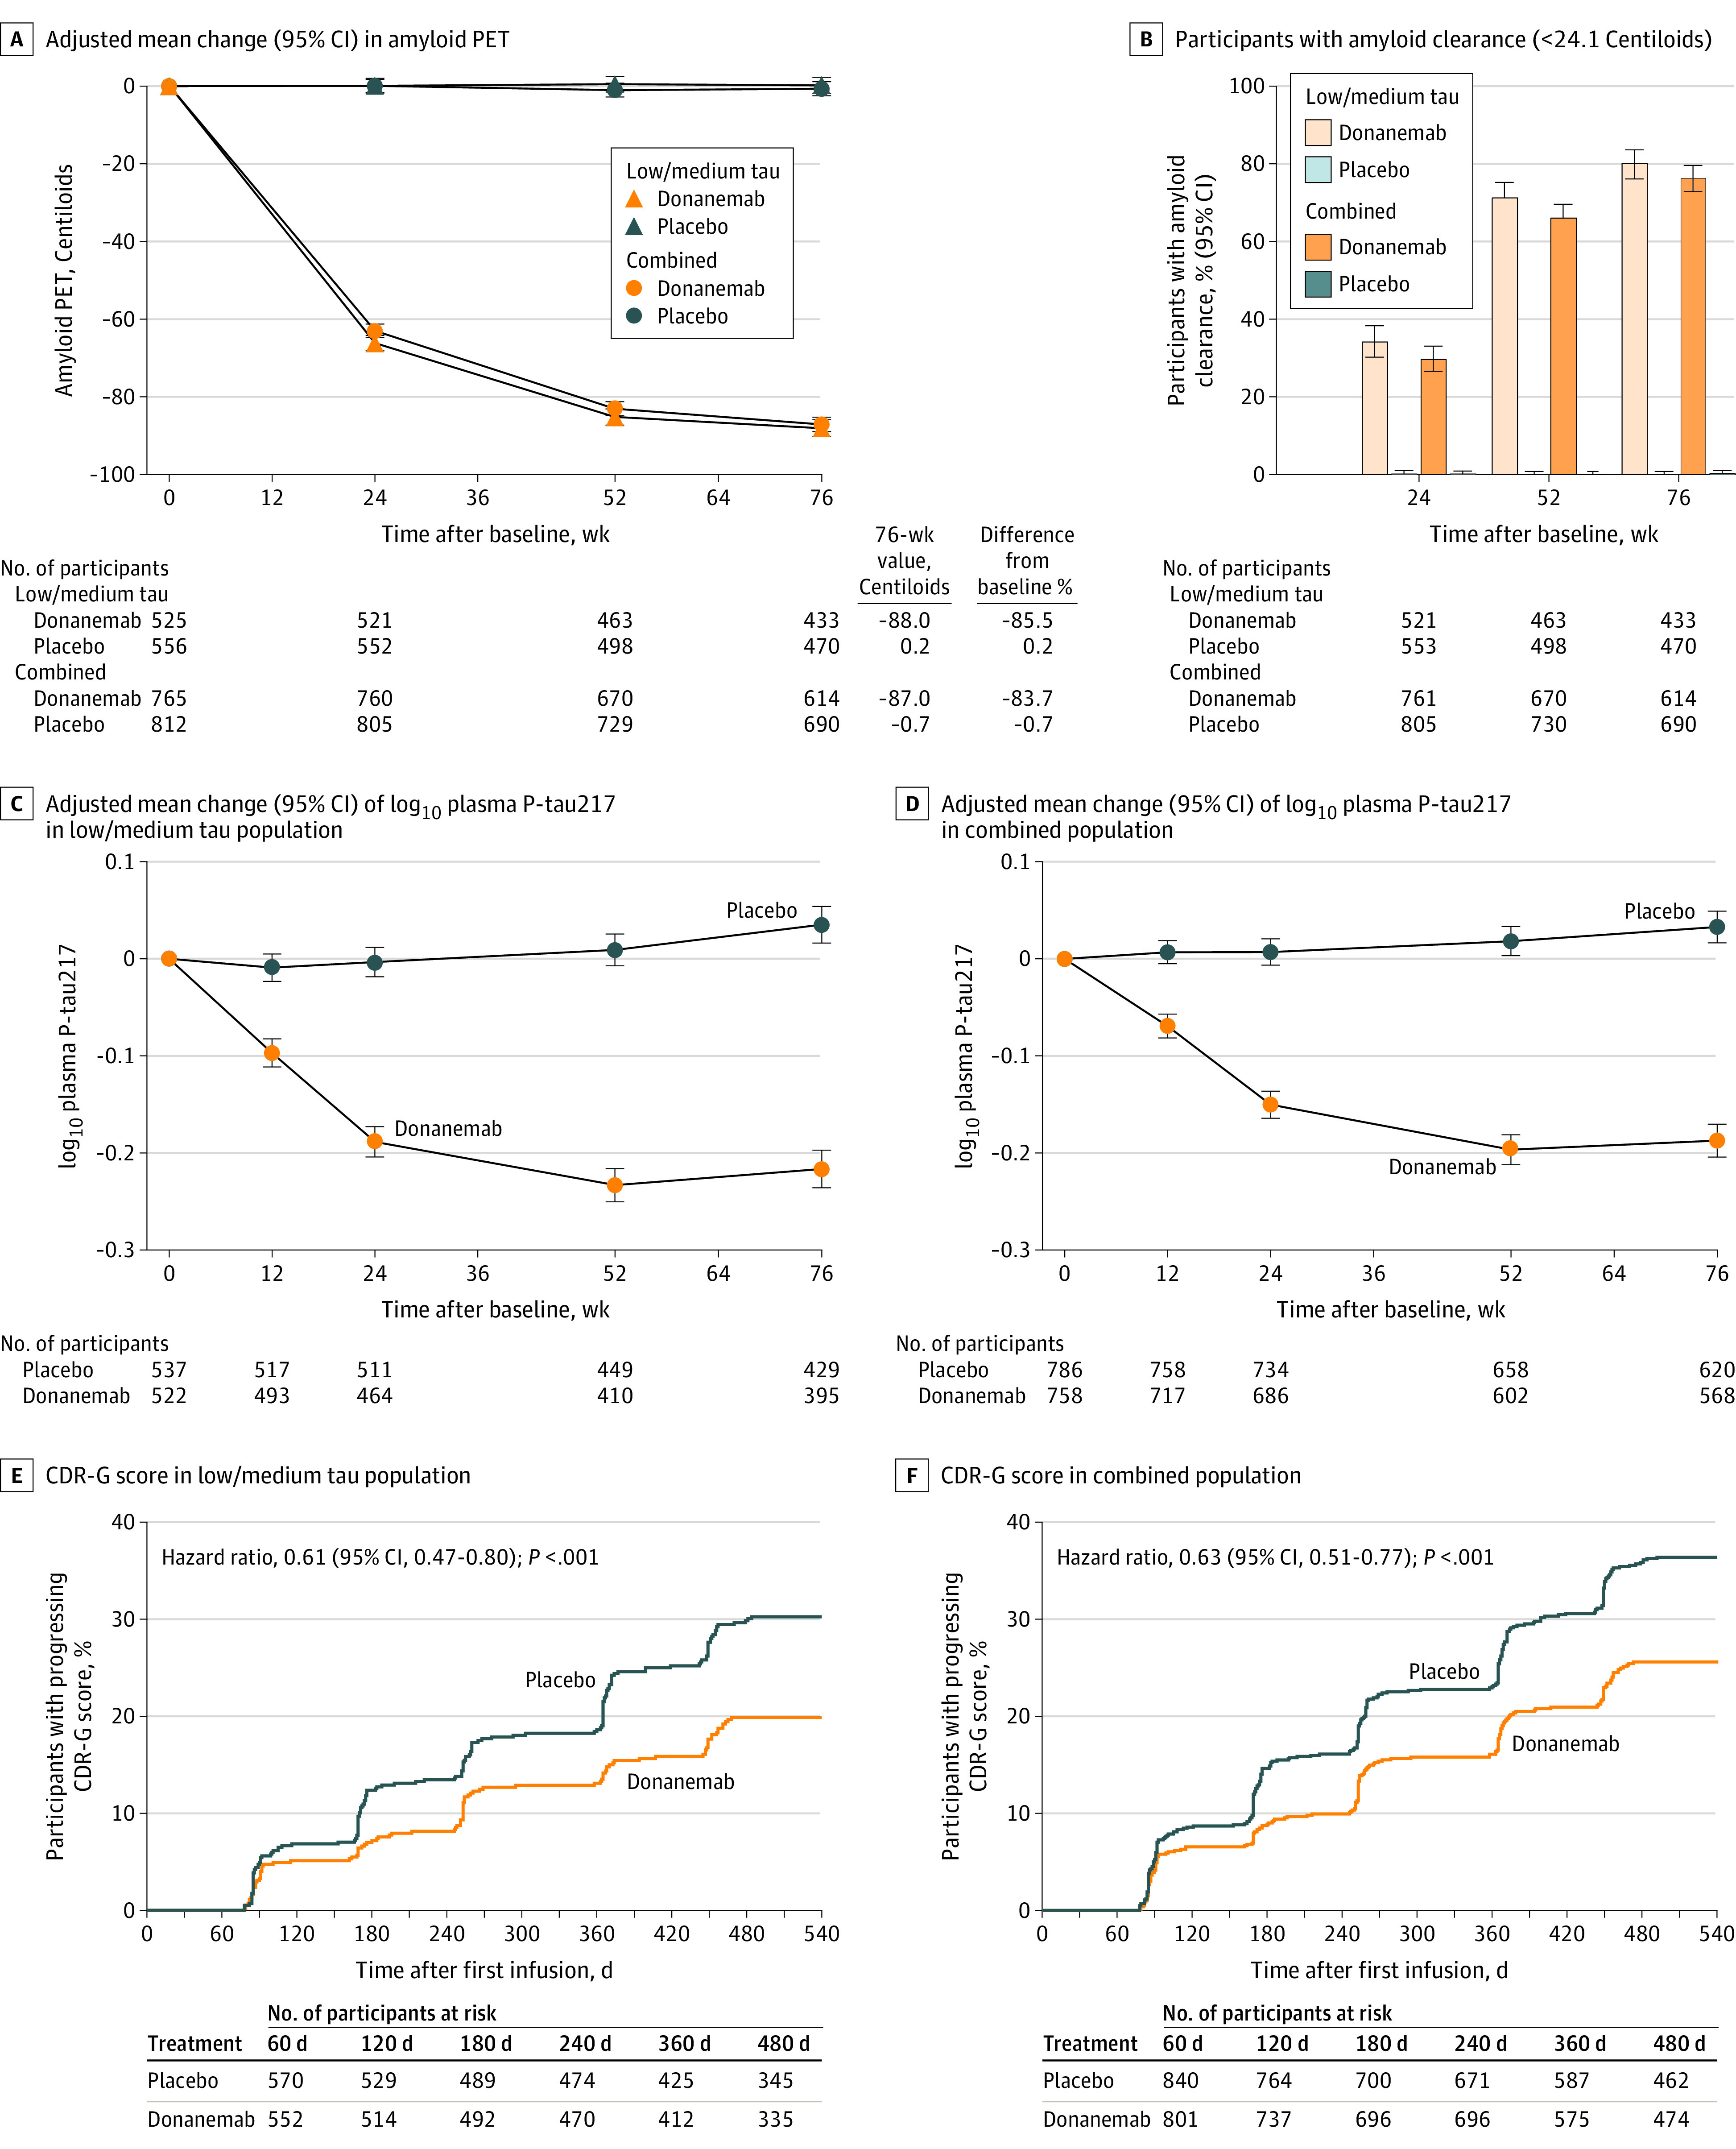
Biomarker data shown were analyzed using mixed models for repeated measures (MMRM). For MMRM analyses, 95% CIs for the least-squares mean changes were calculated with the normal approximation method. P < .001 for all time points in panels A-D. B, P value is from Fisher exact test comparing the percent amyloid negative by treatment groups at each visit. E and F, The analysis was conducted using a Cox proportional hazards model. There were 163 events among 573 participants in the placebo group and 100 events among 555 participants in the donanemab group in the low/medium tau population and 288 events among 844 participants in the placebo group and 186 events among 805 participants in the donanemab group in the combined population. CDR-G indicates Clinical Dementia Rating Global Score.
Tau PET
Evaluation of the LSM change from baseline to 76 weeks in frontal tau SUVR (cerebellar gray reference) did not show a significant difference in the low/medium tau or in the combined population (eFigure 5 in Supplement 3). The difference in LSM change in tau SUVR from placebo in the frontal lobe at 76 weeks was −0.0002 (95% CI, −0.01 to 0.01; P = .97) in the low/medium tau population and −0.0041 (95% CI, −0.01 to 0.01; P = .45) in the combined population.
Volumetric MRI
For both the low/medium tau and combined populations, at 76 weeks, vMRI (a non-gated secondary outcome) showed a greater decrease in whole brain volume, a lesser decrease in the hippocampal volume, and a greater increase in ventricular volume in the donanemab group than in the placebo group (eFigure 6 in Supplement 3).
Exploratory Outcomes
Plasma P-tau217
P-tau217 was significantly reduced from baseline with donanemab treatment compared with placebo in the low/medium tau and combined population. The difference in LSM change in tau SUVR (log10-based) vs placebo was −0.25 (95% CI, −0.28 to −0.22; P < .001) in the low/medium tau population and −0.22 (95% CI −0.24 to −0.20; P < .001) in the combined population at 76 weeks (Figure 3C and D).
Time-Based Analyses
There was a 38.6% (CDR-G hazard ratio, 0.61 [95% CI, 0.47-0.80]; P < .001) lower risk of disease progression in the low/medium tau population and a 37.4% (CDR-G hazard ratio, 0.63 [95% CI, 0.51-0.77; P < .001) lower risk of disease progression in the combined population with donanemab treatment compared with placebo over the 18-month trial (Figure 3E and F; see eFigure 7 in Supplement 3 for nongated disease progression analyses of iADRS and CDR-SB). Substantial decline in the low/medium tau population occurred in 100 (18%) donanemab-treated participants and 163 (28%) placebo-treated participants and, in the combined population, occurred in 186 (23%) donanemab-treated and 288 (34%) placebo-treated participants. In addition, in the low/medium tau population, an estimated 47% of participants were stable (showed no decline in CDR-SB from baseline) with donanemab at 1 year compared with 29% of participants receiving placebo (P < .001) (eTable 6 in Supplement 3). At 76 weeks, disease progression with donanemab treatment in the low/medium tau population was delayed by 4.36 months (95% CI, 1.87-6.85) on the iADRS and 7.53 months (95% CI, 5.69-9.36) on the CDR-SB.
Other Analyses
Sensitivity Analyses
Sensitivity analyses of the iADRS score (eFigure 8 in Supplement 3) using NCS3, MMRM, and DPM analyses, NCS2 in the completers and per protocol populations, and censoring change scores after amyloid-related imaging abnormalities edema/effusion and/or infusion-related reaction observations were consistent with the primary analysis (33.4%-39.6% slowing of clinical progression).
Subgroup Analyses
The findings as measured by iADRS and CDR-SB were generally consistent across baseline characteristic subgroups where the subgroup was sufficiently large (eFigure 9 in Supplement 3).
Post Hoc Outcomes
Analysis of the smaller (n = 552) high tau population alone (ie, not combined with the low/medium tau population) for all primary and secondary outcomes was completed post hoc. The difference between the donanemab and placebo groups in the LSM change from baseline at 76 weeks was 1.26 (95% CI, −1.77 to 4.28; P = .42) for the iADRS score and −0.69 (95% CI −1.19 to −0.20; P = .006) for the CDR-SB score. For additional assessments in the high tau population, see eTables 4, 5, and 10 and eFigures 10-13 in Supplement 3.
Adverse Events
The incidence of death was 1.9% in the donanemab group and 1.1% in the placebo group, while the incidence of serious adverse events was 17.4% in the donanemab group and 15.8% in the placebo group (Table 3). In the donanemab group, 3 participants with serious amyloid-related imaging abnormalities subsequently died (2 APOE ε4 heterozygous carriers and one noncarrier; none were prescribed anticoagulant or anti-platelet medications; one resumed treatment after resolution of severe amyloid-related imaging abnormalities edema/effusion that was accompanied by severe amyloid-related imaging abnormalities microhemorrhages and hemosiderin deposits and one had superficial siderosis at baseline) (eTable 9 in Supplement 3). Treatment-emergent adverse events were reported by 759 of 853 participants (89.0%) receiving donanemab and 718 of 874 participants (82.2%) receiving placebo. Treatment discontinuation due to adverse events was reported in 112 participants receiving donanemab and 38 participants receiving placebo. The most common adverse events that led to treatment discontinuation were infusion-related reactions, either amyloid-related imaging abnormalities edema/effusion or microhemorrhages and hemosiderin deposits, and hypersensitivity (eTable 7 in Supplement 3).
Table 3. Summary of Adverse Events (AEs) by Treatment Group.
| Event | Donanemab (n = 853)a | Placebo (n = 874)a |
|---|---|---|
| Overview of AEs, No. (%) | ||
| Deathb | 16 (1.9)c | 10 (1.1) |
| Death considered related to treatmentd | 3 (0.4) | 1 (0.1) |
| Participants with ≥1 serious AEe | 148 (17.4) | 138 (15.8) |
| Treatment discontinuations due to AEs | 112 (13.1) | 38 (4.3) |
| Study discontinuations due to AEs | 69 (8.1) | 32 (3.7) |
| Participants with ≥1 treatment-emergent AEf | 759 (89.0) | 718 (82.2) |
| Treatment-emergent AEs ≥5% incidence, No. (%) | ||
| ARIA-E | 205 (24.0) | 17 (1.9) |
| ARIA-H | 168 (19.7) | 65 (7.4) |
| COVID-19 | 136 (15.9) | 154 (17.6) |
| Headache | 119 (14.0) | 86 (9.8) |
| Fall | 114 (13.4) | 110 (12.6) |
| Infusion-related reaction | 74 (8.7) | 4 (0.5) |
| Superficial siderosis of central nervous system | 58 (6.8) | 10 (1.1) |
| Dizziness | 53 (6.2) | 48 (5.5) |
| Arthralgia | 49 (5.7) | 42 (4.8) |
| Urinary tract infection | 45 (5.3) | 59 (6.8) |
| Diarrhea | 43 (5.0) | 50 (5.7) |
| Fatigue | 42 (4.9) | 45 (5.1) |
| Overview of ARIAg | ||
| Microhemorrhage or superficial siderosis present at baseline, No. (%) | 124 (14.5) | 161 (18.4) |
| ARIA-E by APOE ε4 allele status, No./total No. (%) | ||
| Noncarrier | 40/255 (15.7) | 2/250 (0.8) |
| Heterozygous carrier | 103/452 (22.8) | 9/474 (1.9) |
| Homozygous carrier | 58/143 (40.6) | 5/146 (3.4) |
| Any ARIA, No. (%)h | 314 (36.8) | 130 (14.9) |
| ARIA-E, No. (%) | 205 (24.0) | 18 (2.1) |
| Asymptomatic | 153 (17.9) | 17 (1.9) |
| Symptomatic | 52 (6.1) | 1 (0.1)i |
| ARIA-H, No. (%) | 268 (31.4) | 119 (13.6) |
| Microhemorrhage | 229 (26.8) | 109 (12.5) |
| Superficial siderosis | 134 (15.7) | 26 (3.0) |
| Intracerebral hemorrhage >1 cm | 3 (0.4) | 2 (0.2) |
Abbreviations: APOE, apolipoprotein E; ARIA-E, amyloid-related imaging abnormalities of edema/effusions; ARIA-H, amyloid-related imaging abnormality of microhemorrhages and hemosiderin deposits; MRI, magnetic resonance imaging.
Participants may have been counted in more than 1 category; adverse events population is defined as all participants that received at least 1 infusion.
Deaths are also included under serious AEs and discontinuations due to AEs.
Includes 1 death that occurred after treatment completion and in the follow-up period.
Deaths related to donanemab occurred subsequent to ARIA and the death related to placebo occurred due to arteriosclerosis.
Definition of serious AE: results in death, is life-threatening, required inpatient hospitalization or prolongation of existing hospitalization, results in persistent disability/incapacity, or based on other medical/scientific judgment.
Definition of treatment-emergent adverse event: an untoward medical occurrence that emerges during a defined treatment period, having been absent pretreatment, or worsens relative to the pretreatment state, and does not necessarily have to have a causal relationship with this treatment.
Based on safety MRI or treatment-emergent AE cluster (after baseline); APOE4 is a known risk factor for ARIA-E.30
Based on MRI.
One placebo-treated participant had ARIA-E during the placebo-controlled period; however, the participant developed symptoms during the long-term extension period.
Either amyloid-related imaging abnormalities of edema/effusion or microhemorrhages and hemosiderin deposits occurred in 314 participants (36.8%) receiving donanemab and 130 (14.9%) receiving placebo. Amyloid-related imaging abnormalities of edema/effusion, determined via MRI, occurred in 205 participants (24.0%) in the donanemab group and in 18 (2.1%) in the placebo group. Most amyloid-related imaging abnormalities of edema/effusion events were mild to moderate (see eTable 2 in Supplement 3) (n = 188 [93.1%] in the donanemab group; n = 17 [100%] in the placebo group). Symptomatic amyloid-related imaging abnormalities of edema/effusion were reported by 52 participants (6.1%) in the donanemab group (25.4% of those with amyloid-related imaging abnormalities of edema/effusion), with 45 participants (86.5%) having symptom resolution. Most cases (57.9%) of first amyloid-related imaging abnormalities of edema/effusion occurred after receiving up to 3 donanemab infusions. Serious amyloid-related imaging abnormalities of edema/effusion (see Table 3) occurred in 13 participants (1.5%) receiving donanemab. First events of amyloid-related imaging abnormalities of edema/effusion radiographically resolved in 198 (98.0%) donanemab-treated participants and 11 (64.7%) placebo-treated participants, with a mean amyloid-related imaging abnormalities of edema/effusion resolution time of 72.4 days for those receiving donanemab and 63.5 days for those receiving placebo. Edema/effusion were numerically less common among APOE ε4 noncarriers than carriers, with higher frequency among homozygotes than heterozygotes (Table 3; further details in eTable 8 in Supplement 3).
The incidence of amyloid-related imaging abnormalities of microhemorrhages and hemosiderin deposits, determined via MRI, was higher in the donanemab group than the placebo group (268 participants [31.4%] vs 119 participants [13.6%]). Incidence of amyloid-related imaging abnormalities of microhemorrhages and hemosiderin deposits in the absence of amyloid-related imaging abnormalities of edema/effusion was not different between treatments (12.7% in the donanemab group vs 12.4% in the placebo group). The incidence of microhemorrhage and superficial siderosis was greater in the donanemab group than in the placebo group (microhemorrhage: 26.8% vs 12.5%; superficial siderosis: 15.7% vs 3.0%). Three intracerebral hemorrhages greater than 1 cm were recorded in the donanemab group and 2 were recorded in the placebo group (Table 3).
Infusion-related reactions were reported by 74 participants (8.7%) in the donanemab group and 4 (0.5%) in the placebo group. Serious infusion-related reactions or hypersensitivity occurred in 3 participants (0.4%) in the donanemab group. Most infusion-related reactions were mild to moderate and occurred during or within 30 minutes of the end of the infusion and between the second and fifth infusion (73.6%). Anaphylactic reaction occurred in 3 participants (0.4%) in the donanemab group and were considered to be mild to moderate.
Discussion
In this phase 3 trial, donanemab significantly slowed Alzheimer disease progression, based on the iADRS score, compared with placebo in the low/medium tau and combined tau populations and across secondary clinical outcomes of CDR-SB, ADAS-Cog13, and ADCS-iADL scores.
Donanemab treatment resulted in clinically meaningful benefit (considered to be >20% slowing of clinical progression39,40,41) on the iADRS and CDR-SB scales for both the low/medium tau and combined populations, regardless of statistical model. Additional support for clinical relevance is the 38.6% risk reduction of disease progression as measured on the CDR-G score and the 4.4 to 7.5 months saved over the 18-month study (low/medium tau population). Furthermore, an estimated 47% of participants receiving donanemab had no change in the CDR-SB at 1 year (no disease progression), compared with 29% of participants receiving placebo.
This trial used a definition of a MWPC28 based on any incremental change on the CDR-G scale (Alzheimer disease with MCI to mild Alzheimer disease or mild Alzheimer disease to moderate Alzheimer disease) or point changes of −5 on the iADRS and 1 on the CDR-SB for those with Alzheimer disease with MCI or −9 on the iADRS and 2 on the CDR-SB for those with Alzheimer disease with mild dementia at consecutive visits from baseline. In analyses assessing whether individual participants reached thresholds of clinically important progression over the course of the trial, donanemab resulted in significantly lower risk of meaningful change on the CDR-G as well as the prespecified nongated analyses of the iADRS and CDR-SB outcomes.
These clinical outcomes were achieved in 52% of low/medium tau participants completing donanemab treatment by 1 year, based on when a participant met amyloid clearance criteria. Limited-duration dosing was a distinct trial design feature reflecting donanemab binding specificity for amyloid plaque and implemented to decrease burden, cost, and potentially unnecessary treatments.11 Early significant changes on both brain amyloid PET scans and P-tau217 blood test results suggest opportunities for clinical monitoring of therapy. Donanemab treatment resulted in significantly reduced brain amyloid plaque in participants at all time points assessed, with 80% (low/medium tau population) and 76% (combined population) of participants achieving amyloid clearance at 76 weeks. Clearance beyond 76 weeks, and associated Alzheimer disease biomarkers levels, are currently being studied in the ongoing extension phase. The lack of response in frontal tau-PET is inconsistent with the TRAILBLAZER-ALZ phase 2 results.9,38 Additional regions have yet to be analyzed and reported. Factors resulting in this inconsistency will be examined. Changes in vMRI (including a greater decrease in whole brain volume in the donanemab group) were consistent with previous reports9,42 and would benefit from further exploration.
The general belief is that treating Alzheimer disease at the earliest disease stage is likely to result in more clinically meaningful effects.43,44 Post hoc evaluation in only high tau participants demonstrated no differences (P< .05) on the primary outcome or on most secondary clinical outcomes in donanemab-treated compared with placebo-treated participants within the 18-month trial, with the exception of CDR-SB. Compared with significant differences in the low/medium tau population, this supports the hypothesis that a greater benefit from amyloid-lowering therapies may occur when initiated at an earlier disease stage.
Similar to other amyloid-lowering drugs, and the phase 2 TRAILBLAZER-ALZ trial, amyloid-related imaging abnormalities are an associated adverse event. When amyloid-related imaging abnormalities occur, they are mostly asymptomatic and resolve in approximately 10 weeks. When symptoms occur, they are usually mild, consisting of a headache or increase in confusion, but can have more severe symptoms such as seizures. In some instances, these events can be life-threatening and result in, or lead to, death. For 1.6% of participants in the donanemab treatment group, amyloid-related imaging abnormalities led to serious outcomes, such as hospitalization, and required supportive care and/or corticosteroid use. It is also important to note that 3 deaths in TRAILBLAZER-ALZ 2 occurred after serious amyloid-related imaging abnormalities. Further evaluation of the risks associated with serious and life-threatening amyloid-related imaging abnormalities will be important to identify the best approaches for managing risks and maximizing benefit, in addition to earlier treatment of the disease when less amyloid pathology is present and, theoretically, when amyloid-related imaging abnormalities risk is lower.
Limitations
This study has several limitations. First, an inherent limitation to limited-duration dosing was variability in total donanemab doses received and/or duration of donanemab dosing. Second, data collection was for 76 weeks, limiting long-term understanding of donanemab; however, a study extension is ongoing. Third, the studied populations were primarily White (91.5%), which may limit generalizability to other populations due to a lack of racial and ethnic diversity. Fourth, although no related protocol amendments were necessary, this trial was conducted during the COVID-19 pandemic, and COVID-19 was the most commonly reported adverse event across treatment groups (see eMethods in Supplement 3). Fifth, direct comparison of results to other amyloid-targeting trials is not possible due to trial design differences such as stratification by baseline tau PET category. Sixth, amyloid-related imaging abnormality and infusion-related reaction occurrences may have caused participants and investigators to infer treatment assignment; attempts to minimize bias included blinding CDR raters to adverse event information and, based on sensitivity analyses, censoring change scores after the first observation of amyloid-related imaging abnormalities of edema/effusion and/or infusion-related reactions did not impact the results.
Conclusions
Among participants with early symptomatic Alzheimer disease and amyloid and tau pathology, donanemab significantly slowed clinical progression at 76 weeks in those with low/medium tau and in the combined low/medium and high tau pathology population.
Trial protocol
Statistical analysis plan
eMethods
Nonauthor collaborators
Data sharing statement
References
- 1.Hansson O. Biomarkers for neurodegenerative diseases. Nat Med. 2021;27(6):954-963. doi: 10.1038/s41591-021-01382-x [DOI] [PubMed] [Google Scholar]
- 2.Hardy JA, Higgins GA. Alzheimer’s disease: the amyloid cascade hypothesis. Science. 1992;256(5054):184-185. doi: 10.1126/science.1566067 [DOI] [PubMed] [Google Scholar]
- 3.Jack CR Jr, Bennett DA, Blennow K, et al. ; Contributors . NIA-AA research framework: toward a biological definition of Alzheimer’s disease. Alzheimers Dement. 2018;14(4):535-562. doi: 10.1016/j.jalz.2018.02.018 [DOI] [PMC free article] [PubMed] [Google Scholar]
- 4.Ostrowitzki S, Bittner T, Sink KM, et al. Evaluating the safety and efficacy of crenezumab vs placebo in adults with early alzheimer disease: two phase 3 randomized placebo-controlled trials. JAMA Neurol. 2022;79(11):1113-1121. doi: 10.1001/jamaneurol.2022.2909 [DOI] [PMC free article] [PubMed] [Google Scholar]
- 5.Doody RS, Thomas RG, Farlow M, et al. ; Alzheimer’s Disease Cooperative Study Steering Committee; Solanezumab Study Group . Phase 3 trials of solanezumab for mild-to-moderate Alzheimer’s disease. N Engl J Med. 2014;370(4):311-321. doi: 10.1056/NEJMoa1312889 [DOI] [PubMed] [Google Scholar]
- 6.Honig LS, Vellas B, Woodward M, et al. Trial of solanezumab for mild dementia due to alzheimer’s disease. N Engl J Med. 2018;378(4):321-330. doi: 10.1056/NEJMoa1705971 [DOI] [PubMed] [Google Scholar]
- 7.Salloway S, Farlow M, McDade E, et al. ; Dominantly Inherited Alzheimer Network–Trials Unit . A trial of gantenerumab or solanezumab in dominantly inherited Alzheimer’s disease. Nat Med. 2021;27(7):1187-1196. doi: 10.1038/s41591-021-01369-8 [DOI] [PMC free article] [PubMed] [Google Scholar]
- 8.Budd Haeberlein S, Aisen PS, Barkhof F, et al. Two randomized phase 3 studies of aducanumab in early Alzheimer’s disease. J Prev Alzheimers Dis. 2022;9(2):197-210. doi: 10.14283/jpad.2022.30 [DOI] [PubMed] [Google Scholar]
- 9.Mintun MA, Lo AC, Duggan Evans C, et al. Donanemab in early Alzheimer’s disease. N Engl J Med. 2021;384(18):1691-1704. doi: 10.1056/NEJMoa2100708 [DOI] [PubMed] [Google Scholar]
- 10.van Dyck CH, Swanson CJ, Aisen P, et al. Lecanemab in early Alzheimer’s disease. N Engl J Med. 2023;388(1):9-21. doi: 10.1056/NEJMoa2212948 [DOI] [PubMed] [Google Scholar]
- 11.Demattos RB, Lu J, Tang Y, et al. A plaque-specific antibody clears existing β-amyloid plaques in Alzheimer’s disease mice. Neuron. 2012;76(5):908-920. doi: 10.1016/j.neuron.2012.10.029 [DOI] [PubMed] [Google Scholar]
- 12.Albert MS, DeKosky ST, Dickson D, et al. The diagnosis of mild cognitive impairment due to Alzheimer’s disease: recommendations from the National Institute on Aging-Alzheimer’s Association workgroups on diagnostic guidelines for Alzheimer’s disease. Alzheimers Dement. 2011;7(3):270-279. doi: 10.1016/j.jalz.2011.03.008 [DOI] [PMC free article] [PubMed] [Google Scholar]
- 13.AmyvidTM . (Florbetapir F 18 Injection). Avid Radiopharmaceuticals, a wholly-owned subsidiary of Eli Lilly and Co. Accessed March 4, 2022. https://www.accessdata.fda.gov/drugsatfda_docs/label/2012/202008s000lbl.pdf
- 14.NEURACEQ . (florbetaben F 18 injection), for intravenous use. https://www.accessdata.fda.gov/drugsatfda_docs/label/2014/204677s000lbl.pdf
- 15.TauvidTM (flortaucipir F 18 injection). Avid Radiopharmaceuticals, a wholly-owned subsidiary of Eli Lilly and Co. Accessed March 4, 2022. https://www.accessdata.fda.gov/drugsatfda_docs/label/2020/212123s000lbl.pdf.
- 16.Devous MD Sr, Joshi AD, Navitsky M, et al. Test-retest reproducibility for the tau PET imaging agent flortaucipir F 18. J Nucl Med. 2018;59(6):937-943. doi: 10.2967/jnumed.117.200691 [DOI] [PubMed] [Google Scholar]
- 17.Fleisher AS, Pontecorvo MJ, Devous MD Sr, et al. ; A16 Study Investigators . Positron emission tomography imaging with [18F]flortaucipir and postmortem assessment of alzheimer disease neuropathologic changes. JAMA Neurol. 2020;77(7):829-839. doi: 10.1001/jamaneurol.2020.0528 [DOI] [PMC free article] [PubMed] [Google Scholar]
- 18.Irizarry MC, Fleisher AS, Hake AM, et al. P4-388: TRAILBLAZER-ALZ (NCT03367403): a phase 2 disease-modification combination therapy trial targeting multiple mechanisms of action along the amyloid pathway. Alzheimers Dement. 2018;14(7S_Part_31):P1622-P1623. doi: 10.1016/j.jalz.2018.07.212 [DOI] [Google Scholar]
- 19.Joshi AD, Pontecorvo MJ, Lu M, Skovronsky DM, Mintun MA, Devous MD Sr. A semiautomated method for quantification of F 18 Florbetapir PET images. J Nucl Med. 2015;56(11):1736-1741. doi: 10.2967/jnumed.114.153494 [DOI] [PubMed] [Google Scholar]
- 20.Pontecorvo MJ, Devous MD, Kennedy I, et al. A multicentre longitudinal study of flortaucipir (18F) in normal ageing, mild cognitive impairment and Alzheimer’s disease dementia. Brain. 2019;142(6):1723-1735. doi: 10.1093/brain/awz090 [DOI] [PMC free article] [PubMed] [Google Scholar]
- 21.Gueorguieva I, Chua L, Willis BA, Sims JR, Wessels AM. Disease progression model using the integrated Alzheimer’s Disease Rating Scale. Alzheimers Dement. Published online November 30, 2022. doi: 10.1002/alz.12876 [DOI] [PubMed] [Google Scholar]
- 22.Wessels AM, Andersen SW, Dowsett SA, Siemers ER. The Integrated Alzheimer’s Disease Rating Scale (iADRS): findings from the EXPEDITION3 trial. J Prev Alzheimers Dis. 2018;5(2):134-136. doi: 10.14283/jpad.2018.10 [DOI] [PubMed] [Google Scholar]
- 23.Wessels AM, Belger M, Johnston JA, et al. Demonstration of clinical meaningfulness of the Integrated Alzheimer’s Disease Rating Scale (iADRS): association Between Change in iADRS scores and patient and caregiver health outcomes. J Alzheimers Dis. 2022;88(2):577-588. doi: 10.3233/JAD-220303 [DOI] [PMC free article] [PubMed] [Google Scholar]
- 24.Wessels AM, Dennehy EB, Dowsett SA, Dickson SP, Hendrix SB. Meaningful clinical changes in alzheimer disease measured with the iADRS and illustrated using the donanemab TRAILBLAZER-ALZ study findings. Neurol Clin Pract. 2023;13(2):e200127. doi: 10.1212/CPJ.0000000000200127 [DOI] [PMC free article] [PubMed] [Google Scholar]
- 25.Wessels AM, Rentz DM, Case M, Lauzon S, Sims JR. Integrated Alzheimer’s Disease Rating Scale: clinically meaningful change estimates. Alzheimers Dement (N Y). 2022;8(1):e12312. doi: 10.1002/trc2.12312 [DOI] [PMC free article] [PubMed] [Google Scholar]
- 26.Wessels AM, Siemers ER, Yu P, et al. A combined measure of cognition and function for clinical trials: the Integrated Alzheimer’s Disease Rating Scale (iADRS). J Prev Alzheimers Dis. 2015;2(4):227-241. doi: 10.14283/jpad.2015.82 [DOI] [PMC free article] [PubMed] [Google Scholar]
- 27.Wessels AM, Tariot PN, Zimmer JA, et al. Efficacy and safety of lanabecestat for treatment of early and mild Alzheimer disease: the AMARANTH and DAYBREAK-ALZ randomized clinical trials. JAMA Neurol. 2020;77(2):199-209. doi: 10.1001/jamaneurol.2019.3988 [DOI] [PMC free article] [PubMed] [Google Scholar]
- 28.US Food and Drug Administration . Patient-focused drug development public workshop: incorporating clinical outcome assessments into endpoints for regulatory decision-making. December 6, 2019. Accessed July 11, 2023. https://www.fda.gov/media/132505/download
- 29.Navitsky M, Joshi AD, Kennedy I, et al. Standardization of amyloid quantitation with florbetapir standardized uptake value ratios to the Centiloid scale. Alzheimers Dement. 2018;14(12):1565-1571. doi: 10.1016/j.jalz.2018.06.1353 [DOI] [PubMed] [Google Scholar]
- 30.Barakos J, Purcell D, Suhy J, et al. Detection and management of amyloid-related imaging abnormalities in patients with Alzheimer’s disease treated with anti-amyloid beta therapy. J Prev Alzheimers Dis. 2022;9(2):211-220. doi: 10.14283/jpad.2022.21 [DOI] [PubMed] [Google Scholar]
- 31.Barakos J, Sperling R, Salloway S, et al. MR imaging features of amyloid-related imaging abnormalities. AJNR Am J Neuroradiol. 2013;34(10):1958-1965. doi: 10.3174/ajnr.A3500 [DOI] [PMC free article] [PubMed] [Google Scholar]
- 32.Doessegger L, Banholzer ML. Clinical development methodology for infusion-related reactions with monoclonal antibodies. Clin Transl Immunology. 2015;4(7):e39. doi: 10.1038/cti.2015.14 [DOI] [PMC free article] [PubMed] [Google Scholar]
- 33.Bretz F, Maurer W, Brannath W, Posch M. A graphical approach to sequentially rejective multiple test procedures. Stat Med. 2009;28(4):586-604. doi: 10.1002/sim.3495 [DOI] [PubMed] [Google Scholar]
- 34.Bretz F, Posch M, Glimm E, Klinglmueller F, Maurer W, Rohmeyer K. Graphical approaches for multiple comparison procedures using weighted Bonferroni, Simes, or parametric tests. Biom J. 2011;53(6):894-913. doi: 10.1002/bimj.201000239 [DOI] [PMC free article] [PubMed] [Google Scholar]
- 35.Holdridge KC, Yaari R, Hoban DB, Andersen S, Sims JR. Targeting amyloid β in Alzheimer’s disease: meta-analysis of low-dose solanezumab in Alzheimer’s disease with mild dementia studies. Alzheimers Dement. Published March 22, 2023. doi: 10.1002/alz.13031 [DOI] [PubMed] [Google Scholar]
- 36.Southekal S, Devous MD Sr, Kennedy I, et al. Flortaucipir F 18 quantitation using parametric estimation of reference signal intensity. J Nucl Med. 2018;59(6):944-951. doi: 10.2967/jnumed.117.200006 [DOI] [PubMed] [Google Scholar]
- 37.Salvadó G, Ossenkoppele R, Ashton NJ, et al. Specific associations between plasma biomarkers and postmortem amyloid plaque and tau tangle loads. EMBO Mol Med. 2023;15(5):e17123. doi: 10.15252/emmm.202217123 [DOI] [PMC free article] [PubMed] [Google Scholar]
- 38.Shcherbinin S, Evans CD, Lu M, et al. Association of amyloid reduction after donanemab treatment with tau pathology and clinical outcomes: the TRAILBLAZER-ALZ randomized clinical trial. JAMA Neurol. 2022;79(10):1015-1024. doi: 10.1001/jamaneurol.2022.2793 [DOI] [PMC free article] [PubMed] [Google Scholar]
- 39.Abushakra S, Porsteinsson A, Vellas B, et al. Clinical benefits of tramiprosate in Alzheimer’s disease are associated with higher number of APOE4 alleles: the “APOE4 Gene-Dose Effect”. J Prev Alzheimers Dis. 2016;3(4):219-228. doi: 10.14283/jpad.2016.115 [DOI] [PubMed] [Google Scholar]
- 40.Vellas B, Andrieu S, Sampaio C, Wilcock G; European Task Force group . Disease-modifying trials in Alzheimer’s disease: a European task force consensus. Lancet Neurol. 2007;6(1):56-62. doi: 10.1016/S1474-4422(06)70677-9 [DOI] [PubMed] [Google Scholar]
- 41.Insel PS, Weiner M, Mackin RS, et al. Determining clinically meaningful decline in preclinical Alzheimer disease. Neurology. 2019;93(4):e322-e333. doi: 10.1212/WNL.0000000000007831 [DOI] [PMC free article] [PubMed] [Google Scholar]
- 42.Alves F, Kalinowski P, Ayton S. Accelerated Brain volume loss caused by anti–β-amyloid drugs. a systematic review and meta-analysis. Neurology. 2023;100(20):e2114-e2124. doi: 10.1212/WNL.0000000000207156 [DOI] [PMC free article] [PubMed] [Google Scholar]
- 43.Aisen PS, Jimenez-Maggiora GA, Rafii MS, Walter S, Raman R. Early-stage Alzheimer disease: getting trial-ready. Nat Rev Neurol. 2022;18(7):389-399. doi: 10.1038/s41582-022-00645-6 [DOI] [PMC free article] [PubMed] [Google Scholar]
- 44.Hampel H, Au R, Mattke S, et al. Designing the next-generation clinical care pathway for Alzheimer’s disease. Nat Aging. 2022;2(8):692-703. doi: 10.1038/s43587-022-00269-x [DOI] [PMC free article] [PubMed] [Google Scholar]
Associated Data
This section collects any data citations, data availability statements, or supplementary materials included in this article.
Supplementary Materials
Trial protocol
Statistical analysis plan
eMethods
Nonauthor collaborators
Data sharing statement