

Abstract
Many chromatin-binding proteins and protein complexes that regulate transcription also bind RNA. One of these, Polycomb repressive complex 2 (PRC2), deposits the H3K27me3 mark of facultative heterochromatin and is required for stem cell differentiation. PRC2 binds RNAs broadly in vivo and in vitro. Yet, the biological importance of this RNA binding remains unsettled. Here, we tackle this question in human induced pluripotent stem cells by using multiple complementary approaches. Perturbation of RNA–PRC2 interaction by RNase A, by a chemical inhibitor of transcription or by an RNA-binding-defective mutant all disrupted PRC2 chromatin occupancy and localization genome wide. The physiological relevance of PRC2–RNA interactions is further underscored by a cardiomyocyte differentiation defect upon genetic disruption. We conclude that PRC2 requires RNA binding for chromatin localization in human pluripotent stem cells and in turn for defining cellular state.
Numerous chromatin-binding proteins that regulate gene expression have been reported to interact with and/or be regulated by RNA1–4. Understanding the functional importance and molecular mechanism of such RNA interactions has been challenging. A potentially powerful approach utilizes separation-of-function mutants of a protein that are defective in RNA interaction but retain protein complex formation, chromatin binding and enzymatic activity.
One of the most well-studied examples is the histone methyltransferase complex PRC2. Proper localization and enzymatic activity of PRC2 are essential for epigenetic repression of gene expression during embryonic development and pathogenesis5–10. The recruitment of PRC2 to specific loci has been attributed to pre-existing histone modifications, DNA sequences, nonhistone DNA-binding proteins and various RNAs (reviewed in refs. 8,11). Of these, the importance of RNA has remained controversial12. Some researchers have suggested RNAs to be important binding partners and regulators of PRC2 (refs. 12–18), but others have explained features of PRC2 recruitment and regulation without invoking RNA19–21.
Models of RNA regulation of PRC2 proposed in previous studies include recruitment to chromatin (reviewed in ref. 12), eviction from chromatin13,14,22 and inhibition of catalytic activity13,15,16. PRC2 interacts with RNA promiscuously23,24 and yet with some specificity25,26. PRC2 interacts preferably with RNA G-quadruplexes (G4s) and G-tracts (short repeats of consecutive guanines)15,25,26, and the high abundance of these motifs contributes to the overall promiscuous nature of PRC2–RNA interactions25. A recent study showed that G4 RNAs evict PRC2 from chromatin during gene activation22, but it remains an open question whether direct PRC2–RNA interaction plays any role in gene inactivation/repression.
Here, we aim to take a fresh perspective by using genetic approaches, integrated with biochemistry, multiple genome-wide RNA and DNA binding assays, and physiological assays in human pluripotent stem cells. We find that RNA-binding-defective PRC2 mutations prevent proper stem cell differentiation. Consistent with this genetic requirement for RNA, we further show that RNA is required for localization of PRC2 to chromatin—genome wide in human pluripotent stem cells.
Results
rChIP–seq demonstrates RNA requirement for PRC2 localization.
Any PRC2–chromatin interactions that are bridged or tethered by RNA should be sensitive to RNA depletion or disruption in chromatin immunoprecipitation (ChIP) assays. Thus, we adapted previously developed RNA-dependent ChIP27–30 and coupled it with deep sequencing (rChIP–seq) to discriminate between RNA-dependent and RNA-independent chromatin localization (Methods and Fig. 1a). EZH2 and SUZ12 chromatin immunoprecipitation and deep sequencing (ChIP–seq) were performed in a human induced pluripotent stem cell (iPSC) line, and RNase A was added at the immunoprecipitation step of the ChIP procedure (Fig. 1a). Importantly, cellular contents have already been cross-linked before this step, so any direct protein–chromatin interactions are expected to be unperturbed during the RNase A treatment as described31.
Fig. 1 |. RNA is essential for PRC2 chromatin occupancy.

a, Schematic design of the RNA-dependent ChIP (rChIP) experiment. RNase A is added (+RNase A) or omitted (−RNase A) at the immunoprecipitation step of the regular ChIP procedure. If a protein–chromatin interaction is dependent on RNA, RNase A treatment would degrade the RNA linkage (red strand) and release the protein (green square) from chromatin. In contrast, if the interaction is independent of RNA, RNase A would have no effect on the protein’s chromatin occupancy. b–e, Heat maps of rChIP–seq experiments for EZH2 (b), SUZ12 (c), Rpb1 (d) and TBP (e) in human iPSCs. The scale below indicates the peak center (C) and the 5 kilobases (5 K) upstream and downstream genomic regions. Intensity of the color in the heat maps represents the enrichment fold change (pulldown/input). f, Representative genomic tracks of rChIP–seq experiments. HOXB3 gene locus is shown for EZH2 and SUZ12 rChIP–seq, while c-Myc gene is shown for Rpb1 and TBP rChIP–seq. The y axis represents the enrichment fold change (pulldown/input). −RNase in blue, +RNase in red. g, Gene scatter plot for the TBP (gray) and EZH2 (red) rChIP–seq. Both x and y axes are plotted as log2(pulldown/input) of normalized counts using two independent clones in each condition (N = 4, see Methods). Top ten enriched genes in EZH2 ChIP–seq (−RNase A) are labeled. Chr, chromosome.
rChIP–seq showed a dramatic loss of PRC2 localization to chromatin upon RNase A treatment (Fig. 1b,c,g and Extended Data Fig. 1f,g,j,k). While RNase A treatment abolished a substantial amount of PRC2–chromatin interaction, there were residual interactions that indicate direct PRC2-histone/DNA contacts (Extended Data Fig. 1a). The depletion was so great that we were concerned that our RNase treatment might be interfering with the assay. We therefore tested well-established direct DNA-binding proteins—TATA binding protein (TBP) and RNA polymerase II subunit Rpb1—whose binding should not require RNA (ChIP profiles of TBP and Rpb1 validated in Extended Data Fig. 1b–e). In sharp contrast to EZH2 and SUZ12 rChIP–seq, neither TBP nor Rpb1 interactions were affected by RNase treatment (Fig. 1d,e and Extended Data Fig. 1h,i,l,m). We also confirmed that the pattern of loss was not dependent on whether enrichment was calculated as fold change (immunoprecipitation (IP)/input) or by subtraction (IP − input) (Supplementary Fig. 1).
Having found that steady-state RNA is required for PRC2–chromatin interactions, we next wanted to test whether nascent RNA was involved in tethering PRC2. We therefore treated living cells with triptolide, which depletes nascent RNA by inhibiting Pol II transcription. Briefly, iPSCs were treated with triptolide or mock for 5 h, followed by EZH2 ChIP–seq. Similarly to RNase A treatment, triptolide showed a substantial and global loss of EZH2 localization to chromatin (Extended Data Fig. 2). Similarly, a previous study has shown that another Pol II inhibitor (DRB) led to a global loss of SUZ12 ChIP signal in mouse embryonic fibroblasts17. The loss of EZH2 occupancy caused by triptolide occurred at PRC2 target genes, which was also confirmed by ChIP coupled with quantitative PCR (qPCR) (Extended Data Fig. 2c). In addition, we observed gain of EZH2 occupancy at nontargets of PRC2 (Extended Data Fig. 2d,e) as previously reported20. Overall, disruption of nascent RNA production leads to a genome-wide redistribution of PRC2—loss at its canonical targets and gain at nontargets.
RNA-binding mutant of PRC2 is a separation-of-function mutant.
The RNase A and triptolide experiments provided direct evidence for the importance of RNA in maintaining PRC2 chromatin occupancy. However, rChIP–seq experiments cannot establish the physiological significance of RNA-dependent localization of PRC2. For a direct test, we sought a separation-of-function mutant of PRC2 specifically defective in RNA binding in vivo. Previously, we identified residues on the surface of EZH2 (the catalytic subunit of PRC2) that contribute to RNA interaction, and combining mutations in two regions of EZH2 (F32A R34A D36A K39A 489–494PRKKKRtoNAAIRS; NM_004456.5:c. [229_230delinsGC;235_237delinsGCT;242 A > C;250_252delins GCC;1615_1623delinsAACGCCGCT;1625_1628delinsTCCG;1632G > C]) led to the most severe defect in RNA binding in vitro and in cultured cells26.
To test whether this ten-amino-acid mutant (MT) is a separation-of-function mutant, we used recombinant proteins to compare known functions of PRC2 between the wild type (WT) and the MT complex (Extended Data Fig. 3a). First, we quantified the defect in RNA binding by the MT complex. The MT 5-mer complex exhibited a sixfold increase in the apparent equilibrium dissociation constant (Kdapp) on a G4 RNA, which is representative of tight-binding sequences (Extended Data Fig. 3b,c). More strikingly, RNA dissociated much more quickly from MT PRC2 (30-fold increase in the dissociation rate constant (koff) for the 5-mer complex and 8-fold for the 4-mer complex lacking AEBP2; Extended Data Fig. 3d). In addition, formaldehyde RNA immunoprecipitation (fRIP2) revealed a global RNA-binding defect in vivo (Extended Data Fig. 4). Thus, both in vitro and in vivo results confirm that the MT PRC2 has a substantial but not complete defect in RNA binding.
We further tested whether known functions of PRC2 (for example, complete complex assembly, DNA and nucleosome binding, enzymatic activity) were preserved in the MT. Complex assembly was well preserved for the recombinant MT PRC2, not only among its core subunits EZH2, SUZ12, EED and RBBP4, but also with its accessory protein AEBP2 (ref. 26) (Extended Data Fig. 3b). Co-immunoprecipitation (co-IP) experiments supported the integrity of the endogenous complex in iPSCs, as the MT EZH2 interacted with other core subunits (SUZ12, EED and RBBP4) and accessory proteins (MTF2 and JARID2) similarly to the WT (Fig. 2c).
Fig. 2 |. Disruption of PRC2–RNA interaction in iPsCs leads to loss of eZH2 occupancy and H3K27me3 level on PRC2-repressed genes.

a, Schematic representations of constructing WT and MT EZH2 iPSC cell lines using CRISPR–Cas9. b, Western blot analysis of EZH2 expression and global H3K27me3 levels (cropped). β-actin loading controls are shown. Cell lysates were titrated twofold three times. Numbers below EZH2 and H3K27me3 blots are expression levels based on the intensity of the middle titration normalized to that of β-actin. c, Co-IP experiment in the WT and MT iPSCs. Wedges above lanes, twofold dilutions of cell lysate or EZH2 pulldown samples. Cropped western blots for six subunits are shown. IgG controls shown in Extended Data Fig. 5f. d, Heat maps of ChIP–seq experiments for WT and MT iPSCs. Scale below indicates the peak center (C) and 5 kb upstream and downstream genomic regions. Color intensity in heat maps represents the enrichment fold change (pulldown/input). e, EZH2 and H3K27me3 ChIP fold-change profile of NKX2–5. The y axis represents the enrichment fold change. f,g, Genome-wide localization of EZH2 (f) and H3K27me3 (g) in WT and MT iPSCs determined by ChIP–seq. Two independent clones of each genotype were compared (N = 4) by empirical Wald tests for individual genes (two-sided, see Methods). Each dot represents a gene showing the fold changes of pulldown to input in WT (x axis) and MT (y axis). Color indicates two groups of genes based on enrichment between WT and MT: gray, insignificant (multiple test-corrected (FDR) P ≥ 0.05); red, significant (FDR-adjusted P < 0.05). Dashed line of slope value = 1 would indicate no difference between WT and MT, while the solid line represents the regression (trend) generated by a generalized additive model. sgRNA, single guide RNA.
Interaction with unmethylated or CpG-methylated DNA was also tested, as recent biochemical analysis suggests that protein-free linker DNA dominates the PRC2–nucleosome interaction13. No difference in PRC2–DNA interaction was observed between the WT and MT using electrophoretic mobility shift assay (EMSA), regardless of the methylation status of the tested DNA (Extended Data Fig. 3e), and koff for the DNA was also not affected (Extended Data Fig. 3d, right). In addition, nucleosome interaction appeared unperturbed by the RNA-binding mutations (Extended Data Fig. 3f), suggesting that the MT should have similar binding to chromatin as the WT. Finally, H3K27 methylation activity on histone H3 alone, histone octamers, reconstituted mononucleosomes or native polynucleosomes was unaffected by the mutations (Extended Data Fig. 3g and Supplementary Fig. 2).
Automethylation of EZH2 (refs. 32,33) was also well preserved, even though one of the two mutated sites is only 11 amino acids from the automethylated residues of EZH2 (Extended Data Fig. 3g and Supplementary Fig. 2). In summary, the mutations substantially diminish PRC2’s ability to interact with RNA, while maintaining other functions including complex assembly, DNA interaction, nucleosome binding and histone methyltransferase activity.
RNA-binding mutant of PRC2 has decreased occupancy at target genes.
The separation-of-function mutant allowed testing of the physiological significance of PRC2–RNA interaction in vivo. To this end, we introduced the same mutations into the endogenous EZH2 locus using CRISPR–Cas9 (Fig. 2a) in the human iPSC line WTC-11 (refs. 34,35). Because genome editing can potentially introduce ‘off-target’ effects or alteration of chromatin modification, a WT EZH2 cell line was made alongside the MT EZH2 line using the same CRISPR guide RNA and clonal selection procedure, to serve as a better control than parental cells. As an additional control for possible off-target effects, two independent clones were compared for downstream analyses, and correct homozygous genome editing was verified using PCR analysis (Extended Data Fig. 5a). The edited WT and MT EZH2 protein expression levels were comparable among the cell lines (Fig. 2b). We further determined the cellular localization of this MT PRC2 by immunofluorescence and observed correct nuclear localization (Extended Data Fig. 5d,e). Moreover, global H3K27me3 levels were similar in WT and two different MT EZH2 clones (Fig. 2b, similar to in vitro results in Extended Data Fig. 3f). Additionally, we observed no physiological changes in the MT iPSC line by several metrics: (1) there were no visible changes to colony morphology; (2) the karyotype was normal; and (3) immunofluorescence analysis of several pluripotency markers (for example, SOX2, OCT4 and SSEA4) showed similar expression in WT and MT iPSC lines (Extended Data Fig. 5b–d). Finally, the PRC2 complex remains intact in the MT (Fig. 2c and Extended Data Fig. 5f).
Having determined that the MT line is physiologically similar to WT, we looked for changes in PRC2 localization and H3K27me3 distribution using ChIP–seq. In WT, EZH2 occupancy was observed at many genes and, among them, only a subset of genes including HOX genes had a strong H3K27me3 level (Extended Data Fig. 6). These results are consistent with the ‘poised and in check’ models proposed previously, where PRC2 is recruited but not active at most loci15,16,24. Interestingly, we observed defects in localization of MT EZH2 at sites that are normally highly occupied in WT cells (Fig. 2d–f and Extended Data Fig. 7a). Validation of the RNA-dependent EZH2 occupancy changes was performed by treating cells with the small molecule TMPyP4 (tetra-(N-methyl-4-pyridyl) porphyrin), which inhibits the interaction of PRC2 specifically with G4 RNA structures25. ChIP coupled with qPCR for five of the genes that had reduced EZH2 occupancy in MT compared with WT and five control genes showed that the TMPyP4 drug treatment phenocopied the MT with respect to the change of PRC2 occupancy (Extended Data Fig. 7b).
The PRC2 RNA-binding mutations also caused loss of H3K27me3 on genes with usually high levels of H3K27me3 (Extended Data Fig. 7c and Fig. 2e,g). Importantly, the decreases in EZH2 occupancy and H3K27me3 levels were highly associated; that is, the two sets of significantly affected genes substantially overlapped (overlap size: 40% of EZH2 and 91% of H3K27me3, P < 10−15 by Fisher’s exact test) (Extended Data Fig. 7d and an example shown in Fig. 2e). More specifically, genetic disruption of PRC2–RNA interaction drastically decreased EZH2 occupancy and H3K27me3 level on the chromatin loci of a group of genes that are strongly repressed by PRC2 in pluripotent stem cells. This group of genes (Supplementary Table 1) encoded differentiation-related transcription factors (for example, HOX and forkhead box (FOX)) and signaling proteins (for example, hedgehog components SHH, IHH and DHH), so the PRC2–RNA interaction is important for epigenetic repression of these genes in undifferentiated stem cells.
Collectively, these results support that genetic disruption of PRC2–RNA interaction can cause loss of PRC2 occupancy and histone methyltransferase activity on a subset of genes in human iPSCs. As described in the next section, this leads to overexpression of these genes in the MT line.
Disruption of PRC2–RNA interaction leads to defect in cardiomyocyte differentiation.
To understand whether the observed PRC2 localization defects have any effect on gene expression, we performed RNA-seq analysis of the WT and MT iPSC lines. We observed that 1,918 of 30,329 tested genes had a significant change in expression (multiple-test-corrected (FDR) P < 0.05) in the MT (Extended Data Fig. 8a). The genes that were significantly perturbed in MT cells, as assessed by EZH2 and H3K27me3 ChIP–seq, had increased expression in the MT line (Extended Data Fig. 8b). In addition, among the 1,918 genes, 10 genes showed loss of both EZH2 and H3K27me3 ChIP enrichments in MT relative to WT, and they are mostly genes encoding transcription factors, including LBX2 and FOXF2, that are important for formation of cardiac tissues36–38. Also, gene set enrichment analysis (GSEA) based on gene ontology (GO) found several top GO terms related to heart development (Extended Data Fig. 8c,d and Supplementary Table 2). Based on these findings, we hypothesized that premature expression of these cardiac genes before initiation of directed differentiation might cause defects in cardiac differentiation.
To test our hypothesis, we directed cardiomyocyte differentiation of WT and MT genome-edited iPSC lines using GSK3 and Wnt inhibitors39. While the WT cardiomyocytes exhibited widespread robust spontaneous contraction beginning at day 8 of differentiation, the MT line had only very limited and sparse areas of beating (contraction difference shown in Supplementary Videos 1–4 and Fig. 3a). Quantification of the beating area across fields in three independent differentiation experiments for two clones of each iPSC line confirmed the dramatic defect in spontaneous contraction for the MT line (Fig. 3b). The expression of a classic cardiomyocyte marker—cardiac troponin T (cTnT)—was much reduced at two time points (day 8 and day 12) of differentiation (Fig. 3c and Supplementary Figs. 3 and 4). The MT line also failed to express another cardiomyocyte marker, sarcomeric α-actinin (Fig. 3d). However, the MT line was seen to express SIX1 at a level comparable to that of the WT line, and therefore the molecular consequence of disruption of PRC2–RNA interaction is distinct from that reported for loss of the entire PRC2 complex in heart tissue40.
Fig. 3 |. PRC2–RNA interaction is essential for cardiomyocyte differentiation.

WT and MT iPSCs were differentiated into cardiomyocytes. a, Heat map depicting the time-averaged magnitude of cardiomyocyte contraction; five representative images of each clone at day 11 (red to blue, motion high to none). b, Quantification of the fraction of spontaneously beating areas at day 11. Each dot represents a time-lapse image recorded for 30 s, and images from three independent differentiation experiments are plotted. Dashed lines represent the mean values. c, Percentages of cells with positive cTnT expression quantified using flow cytometry; n = 3 biologically independent differentiation experiments, bars represent mean values and error bars represent standard deviations. d, Expression of sarcomeric α-actinin and transcription factor SIX1 at day 12 of differentiation, evaluated using immunofluorescence. e, Heat map of spontaneous contraction in the EZH2 rescue experiment at day 11. f, Quantification of the contracting areas and cTnT flow cytometry results in three biological replicates of the EZH2 rescue experiment. Bars represent mean values and error bars show the standard deviation of three biological repeats. g, RNA-seq results of WT and MT at day 12 of differentiation. Two independent clones of WT and MT each with three biological replicates (N = 12) were used for statistical significance (two-sided Wald test, see Methods). Color indicates three groups of genes based on mean TPM comparison between WT and MT: gray, insignificant (multiple test-corrected (FDR) P ≥ 0.05); orange, significant (FDR-adjusted P < 0.05) and log2(FC) < 1; red, significant (FDR-adjusted P < 0.05) and log2(FC) ≥ 1, where FC (fold change) is ratio of MT to WT in normalized read counts. h, Expression profiles of four representative cardiac genes at day 12 of differentiation: TNNT2 (encodes cTnT), NKX2–5, TTN, ACTN2 (encodes sarcomeric α-actinin). Error bars represent the standard deviation of two clones, each with three independent differentiation experiments (N = 6). P values presented in b, c, f and h were calculated by two-sided t-test (equal variance). N/A, not applicable.
The cardiomyocyte differentiation defect did not appear to be caused by a general failure of mesoderm formation, as two mesoderm markers were not significantly downregulated in the MT line on day 8 (late mesoderm) of differentiation: PDGFα, transcripts per million (TPM)WT = 147, TPMMT = 120, P = 0.83; PDGF receptor α (PDGFRα): TPMWT = 2,969, TPMMT = 3,094, P = 0.22. Expression of neural progenitor cell (NPC) markers including Nestin, SOX1 and PAX6 was indistinguishable between the WT and MT clones (Extended Data Fig. 9), providing preliminary evidence that a differentiation defect may not exist for all lineages.
Importantly, the cardiomyocyte differentiation defect of the MT iPSC line could be rescued by reintroduction of an exogenous WT EZH2 gene. Transient transfection of the WT, but not the MT, EZH2 restored the cardiomyocyte iPSC differentiation ability, indicated by analysis of area of beating cells and cTnT expression (Fig. 3e,f and Supplementary Fig. 5). Regarding the molecular details of the rescue, qPCR with reverse transcription analysis revealed that cardiac gene expression (TNNT2 and MYH6) was rescued with the exogenous WT EZH2, while the expression of a control gene (SOX2) was not altered (Extended Data Fig. 10a,b).
To further define stages of differentiation that were affected in the MT, RNA-seq was performed on day 8 and day 12 of cardiomyocyte differentiation. Cardiac genes including TTN, myosin component and TNNT2 (encodes cTnT) were generally expressed at a much lower level in the MT line, consistent with our observation that the MT line had a severe defect in cardiomyocyte differentiation (Fig. 3g,h, Extended Data Fig. 10c and Supplementary Table 3). GSEA revealed that many important pathways for cardiac differentiation were downregulated, including metabolic pathways and cardiac signaling (Extended Data Fig. 10d). Genes that lost both EZH2 occupancy and H3K27me3 level in the MT in the pluripotency state (day 0) could play key roles in the differentiation defect, as they often remained overexpressed in the MT line—in the undifferentiated state (day 0) and at days 8 and 12 of differentiation (Extended Data Fig. 10e,f). In particular, gene networks of these genes can affect cardiomyocyte differentiation; for example, HMX1 was the most overexpressed gene in the MT line (Extended Data Fig. 10e) and HMX1 has been shown to be a transcriptional antagonist of NKX2-5 (ref. 41). Indeed, upregulation of HMX1 correlates with downregulation of NKX2-5 in the MT cells on days 8 and 12 (Extended Data Fig. 10g).
We conclude that the cardiomyocyte differentiation defect is caused by changes in epigenetic silencing of several hundred genes due to failure of PRC2 to bind RNA. Overall, our rChIP–seq and genetic analyses reveal that PRC2 requires RNA for localization to chromatin, and in turn these interactions are required for the physiological function of PRC2 in cellular differentiation.
Discussion
Over the past several years it has become clear that PRC2 binds RNA42–44 with high affinity, yet promiscuously23–25. But do these PRC2–RNA interactions have biological importance? Here, we demonstrate that PRC2 requires RNA for proper localization to chromatin in human iPSCs using rChIP–seq, disrupting either steady-state RNA or nascent RNA. In contrast, direct DNA-binding proteins (for example, TBP) were not perturbed in rChIP–seq. Our findings are consistent with a previous study showing that nascent transcription is critical for PRC2 occupancy in mouse embryonic fibroblasts17.
Perhaps most importantly, we have genetically defined the importance of EZH2–RNA interactions. Specifically, our EZH2 MT still assembles active PRC2 complexes but its chromatin localization is perturbed, consistent with the rChIP–seq results. The genetically defined separation-of-function MT showed that PRC2–RNA binding is required for cellular differentiation of iPSCs into cardiomyocytes. Thus, our findings demonstrate that RNA is required for PRC2 localization and is functionally required for a key differentiation process.
Our finding that PRC2 chromatin binding is sensitive to RNase suggests that RNA forms a bridge (either a direct bridge or mediated by one or several other proteins17) between PRC2 and chromatin. RNA interaction could keep PRC2 in a temporarily inhibited state13–16 but positioned in proximity to chromatin to scan the local chromatin context45–47. The ‘RNA bridge’ is essential for the homeostasis of PRC2 localization to chromatin, and perturbation of the interaction results in a substantial loss of PRC2 occupancy at its canonical targets and a gain of PRC2 at some de novo targets. This observation can unite previous seemingly contradictory observations regarding the molecular mechanism of PRC2–RNA interactions (Fig. 4), as follows.
Fig. 4 |. A molecular scheme of RNA regulation of PRC2 activity.

Center, interactions between PRC2 and chromatin are frequently bridged by RNA (red). At this state, PRC2 is not directly bound to chromatin, and its catalytic activity is temporarily inhibited. This poised and in check state allows PRC2 to scan the chromatin context (for example, pre-existing H3K27me3) of nearby chromatin regions. Top left, multiple RNA interactions may hold several distant chromatin regions together to form long-range chromatin interactions, and potentially Polycomb bodies. Bottom left, PRC2 may dissociate from RNA and become engaged with chromatin, and PRC2 detects its allosteric activator H3K27me3. Conversely, when H3K27me3 is missing, PRC2 may be evicted from chromatin by RNA. Bottom right, PRC2–chromatin interaction may also be initiated by interaction with PRC2 accessory proteins, which are frequently DNA-binding proteins. Top right, at active gene loci which are rapidly transcribed, release of RNA could further evict and release PRC2 from chromatin.
First, during gene inactivation at PRC2’s target loci, the RNA bridge serves as an important intermediate step for PRC2 to scan the chromatin context, and it positively affects PRC2 localization to local chromatin. This is consistent with our results showing that PRC2–RNA interaction has a positive effect on PRC2 localization on its target genes. PRC2 may then dissociate from the RNA and become engaged with chromatin through interaction with nucleosome linker DNA13 and with the allosteric activator H3K27me3 (ref. 47). Second, during gene activation or at PRC2’s nontarget loci, rapidly transcribed nascent transcripts could continuously evict and further release PRC2 from local chromatin, as shown in several previous studies14,20,22. While our study provides some insight on the negative effect at nontarget genes (Extended Data Fig. 2d,e), two recent studies discovered that G4 RNA evicts PRC2 during gene activation14,22 and therefore complement our findings. Lastly, these RNA bridges may bring together remote chromatin loci to form higher-order chromatin architecture including Polycomb bodies48–50.
In summary, our findings expand previous mechanistic studies including the RNA eviction model proposed by our group and others13,14,22, and they unite many previous models via the common principle of ‘RNA bridging’. The RNA bridges provide dual roles for PRC2 activity: PRC2 recruitment during gene inactivation and eviction during gene reactivation or at PRC2’s nontarget loci.
Knowing that PRC2 requires RNA for localization across the genome, how might the RNA function? One possibility is that the RNA acts in cis to the gene to which PRC2 is recruited (Fig. 4). The RNA would then be acting stoichiometrically, with thousands of RNAs acting independently to localize thousands of PRC2 complexes to chromatin. These RNA bridges to chromatin could be nascent Pol II transcripts or bound to DNA-binding proteins. The possibility of ‘nascent RNA bridges’ is supported by our finding (Extended Data Fig. 2) and a previous study17 showing that nascent RNA contributes to PRC2 localization.
Widespread PRC2 recruitment by nascent long noncoding RNA (lncRNA) or pre-messenger RNA in cis does not discount the possibility that specific lncRNA molecules might act to localize PRC2 to specific loci in trans51. However, recruitment in trans is unlikely to predominate, because there is a stoichiometric discrepancy between the 50–100 copies of particular lncRNAs and the thousands of PRC2 localization sites across the genome. Nonetheless, substochiometric models are also possible. For example, lncRNAs such as Firre have been shown to orchestrate the higher-order organization of nuclear architecture52, which could create chromatin compartments to which PRC2 is recruited by multivalent RNA–protein interactions. These and other models will need to be tested to understand the detailed mechanisms by which RNA bridging has positive and negative effects on gene regulation and formation of nuclear bodies.
Collectively, our findings demonstrate that RNA is required for both localization and function of PRC2 in human pluripotent stem cells.
Online content
Any methods, additional references, Nature Research reporting summaries, source data, extended data, supplementary information, acknowledgements, peer review information; details of author contributions and competing interests; and statements of data and code availability are available at https://doi.org/10.1038/s41588-020-0662-x.
Methods
ChIP–seq.
iPSCs were cultured in 15-cm plates until 70–80% confluency. Media were removed and cells were washed with PBS once. Cells were then incubated with 10 ml of 1% (v/v) formaldehyde in PBS at room temperature for 10 min, and cross-linking was quenched with addition of 1 ml of 1.25 M glycine. Cells were scraped from the culture plate and washed twice in cold PBS. Cross-linked cell pellets were then stored in a −80 °C freezer. Once ready to proceed, pellets were resuspended in 500 μl of lysis buffer (50 mM Tris-Cl pH 8.1, 10 mM EDTA, 0.5% SDS, 1× protease inhibitor solution (50× solution was made by dissolving a Pierce tablet, ThermoFisher A32965, in 1 ml of ddH2O)). Cell solutions were first incubated on ice for 10 min and then sonicated for 45 min with a Bioruptor UCD-200 (Diagenode) with 30-s on and off pulses at maximum power. Chromatin samples can be reverse-cross-linked at this point to ensure the fragmentation to around 200 base pairs (bp) for each sample. Lysate was cleared by centrifugation at 16,300g for 10 min at 4 °C, and supernatant (chromatin) was collected and can be stored in a −80 °C freezer for future pulldown experiments. Chromatin samples were precleared with 50 μl of Pierce protein A/G magnetic beads (ThermoFisher 88803) in IP buffer (16.7 mM Tris-HCl pH 8.1, 1.2 mM EDTA, 167 mM NaCl, 1% Triton X-100) to reduce nonspecific binding. A portion (10 μl) of each precleared chromatin sample was used as the input sample, and 25 μl was used for pulldown with 2 μl of anti-EZH2 (Cell Signaling Technologies 5246), 2 μl of anti-SUZ12 (Cell Signaling Technologies 3737), 10 μl of anti-TBP (Santa Cruz Biotechnology sc-421), 2 μl of anti-Rpb1 (Cell Signaling Technologies 14958) or 3 μl of anti-H3K27me3 (Abcam 6002) antibody at 4 °C overnight in IP buffer. Then, 25 μl of Pierce protein A/G magnetic beads were added to the IP solution for incubation at room temperature for another 1 h. Beads can be captured with a magnetic rack and washed with 1 ml of each of the following buffers twice: (in order) LSB (20 mM Tris-Cl pH 8.0, 2 mM EDTA, 150 mM NaCl, 0.1% SDS, 1% Triton X-100), HSB (20 mM Tris-Cl pH 8.0, 2 mM EDTA, 500 mM NaCl, 0.1% SDS, 1% Triton X-100), LiCl buffer (10 mM Tris-Cl pH 8.0, 1 mM EDTA, 250 mM LiCl, 1% sodium deoxycholate, 1% NP-40 substitute (Sigma-Aldrich 74385)), TE (10 mM Tris pH 8.0, 1 mM EDTA). Chromatin was then eluted from the beads by incubation with the 120 μl of elution buffer (100 mM sodium bicarbonate, 1% SDS) for 20 min at room temperature, and input samples (total chromatin) were included beginning at this stage. To reverse the formaldehyde cross-linking, 200 mM NaCl was added and each sample was incubated at 65 °C overnight. Protein was then removed by adding 14 μl of 1 M Tris pH 6.5, 3 μl of 500 mM EDTA and 3 μl of proteinase K (ThermoFisher 25530049) and incubated at 37 °C for 60 min. DNA was extracted by phenol–chloroform–isoamyl extraction followed by ethanol precipitation, and 0.6 μl of glycogen (Roche 10901393001) was added to each sample to facilitate precipitation. DNA samples were resuspended in 20 μl of 10 mM Tris, pH 8.0 and quantified using a Qubit. Then, 2.5 ng of each sample was used for library preparation using the KAPA HyperPlus Kit (Roche/KAPA Biosystems KK8512) according to the manufacturer’s protocol, except the fragmentation step was skipped (as fragment size around 200 bp is already ideal). DNA libraries were pooled and sequenced with NextSeq 500 using a High-Output 75-cycle kit (single read, 1 × 75 bp). For the WT versus MT ChIP analysis, two clones each of WT and MT EZH2 were analyzed. Each clone was sequenced in two technical repeats.
rChIP–seq.
We adapted a standard ChIP–seq protocol (described in ‘ChIP–seq’) to add RNase A during ChIP–seq library preparation. For the RNase A-treated EZH2, SUZ12, TBP and Rpb1 rChIP–seq experiments, 5 μg ml−1 RNase A (free of DNase and protease, Thermo Scientific EN0531) was added in pulldown reactions (together with the primary antibody) of each of the two WT iPSC clones, and all of the remaining steps were performed exactly the same way as described in ‘ChIP–seq’.
ChIP–seq and rChIP–seq data analysis.
Sequencing reads were trimmed for the adapter sequence in the 3′ end by Cutadapt (v.1.12)53. The trimmed reads were mapped to the reference human genome (hg38) by BWA (v.0.7.15)54 with similar parameters as adopted by the The Encyclopedia of DNA Elements (ENCODE) consortium: ‘-q 5 -l 32 -k 2’. Only primary alignments whose mapping scores were greater than 30 were used for the downstream pipeline. The potential PCR duplicates were detected and removed by Picard MarkDuplicates (https://broadinstitute.github.io/picard/). Peaks were called by MACS2 (v.2.1.1)55 for the pooled biological replicates with the options of ‘--keep -dup all --nomodel --extsize X --bdg --broad’, where X was a fragment size estimated by SPP56: 235 bp for EZH2, 220 bp for H3K27me3, 255 bp for Rpb1 and 225 bp for TBP. The peaks were further analyzed after the so-called blacklist regions of ChIP–seq were excluded according to the ENCODE consortium (https://sites.google.com/site/anshulkundaje/projects/blacklists).
The fold change of the pulldown relative to the input was calculated at a nucleotide level using the normalized coverage generated by MACS2 for visualization in genome track and heat map. The heat map of the fold change was generated for a given cell line around the peaks identified by MACS2: (1) broad peaks were used except for TBP with narrow peaks; (2) overlapped peaks were merged across samples in comparison; (3) the peaks whose lengths were extreme (outside of 10% and 90% quantiles) were filtered; and (4) for Rpb1 and TBP, we filtered out the peaks if the distance of two peaks was close (smaller than 5 kb) to reduce bias due to local regions with dense peaks. For a given peak, the average fold change (pulldown/input) or subtraction (pulldown − input) of 1,000 tiles, binning the region of 5 kb upstream and downstream from the center of the peak, was used to generate a heat map. The meta plots of fold change around the region of 5 kb upstream and downstream of the transcription start site and the region of gene body were generated in a similar way but were depicted with a regression line using the R package ggplot2 (ref. 57). The meta plot for the transcription-start-site region was generated for all of the genes annotated in NCBI RefSeq58, while the meta plot of gene body was generated for the genes overlapped with the identified peaks in gene body.
The enrichment of genes in pulldown relative to input was evaluated by comparing the number of reads mapped to gene bodies defined in GENCODE v.27. After the technical replicates were pooled, the read counts were normalized by total number of aligned reads for the genes whose counts were greater than three in at least one sample. Then, a generalized linear model was constructed for a given gene to estimate log fold change of the normalized read counts in pulldown relative to input while adjusting for cell line variability. Specifically, the shrunken fold change was estimated by the R package DESeq2 (v.1.14.1)59 and used to generate scatter plots comparing fold changes between two conditions. The statistical significance of log fold change was calculated empirically by the R package fdrtool (v.1.2.15)60, with the input of Wald statistics calculated by DESeq2. The differential enrichment between WT and MT was calculated with an interaction term of genotype condition (WT versus MT) and library (pulldown versus input) in a regression model. In rChIP–seq, differential enrichment between RNase A–negative and RNase A–positive samples was identified in a similar way but was obtained without considering input samples, as they shared the same input.
Triptolide treatment of iPSCs.
WT iPSCs (two clones, two replicates each) grown to 80% confluency in Essential 8 flex medium on vitronectin were treated with 10 μM triptolide (Sigma-Aldrich T3652) for 5 h, after which cells were collected and cross-linked for ChIP analysis as described in ‘ChIP–seq’.
TMPyP4 treatment of iPSCs.
TMPyP4 was obtained from Santa Cruz Biotechnology (36951–72–1) and resuspended in Dulbecco’s phosphate-buffered saline (D-PBS) to make 40-mM stocks. WT iPSCs (two clones, two replicates each) were grown to ~70% coverage, treated with 20 μM TMPyP4 for 48 h and then cross-linked using 1% (v/v) formaldehyde as described in the ChIP–seq method section. The downstream ChIP experiments were performed as described in ‘ChIP–seq’ above. qPCR was performed with Applied Biosystems SYBR Select Master Mix in a Roche LightCycler 480 instrument.
Purification and biochemical characterization of PRC2 complexes.
PRC2 core 4-mer complex (4 m) and 5-mer complex with AEBP2 (5 m) were expressed in insect cells and purified as previously described25. EMSA assays for RNA-binding experiments were performed as previously described on (GGAA)10 RNA26. Fluorescence anisotropy was used to measure the off-rate of WT and MT PRC2 on RNA. First, 20 nM Alexa 488-attached (GGAA)10 RNA was preincubated with various concentrations of WT and MT PRC2 to reach binding equilibrium (binding buffer: 50 mM Tris-HCl pH 7.5 at 25 °C, 100 mM KCl, 2.5 mM MgCl2, 0.1 mM ZnCl2, 2 mM 2-mercaptoethanol, 0.1 mg ml−1 BSA, 0.1 mg ml−1 fragmented yeast transfer RNA (Sigma catalog no. R5636), 5% v/v glycerol), and then 1 μM unlabeled (GGAA)10 RNA was added to the sample with the lowest concentration of PRC2 to reach binding saturation, to measure dissociation rate of the fluorescently labeled RNA. Fluorescent polarizations were measured every minute in a 384-well plate using a Synergy 2 Multi-Mode Plate Reader (BioTek) and BioTek Gen5 software.
EMSA binding assays with methylated or unmethylated DNA were performed as previously described13, except the binding buffer was 50 mM Tris-HCl pH 7.5 at 25 °C, 100 mM KCl, 0.1 mM ZnCl2, 2 mM 2-mercaptoethanol, 0.1 mg ml−1 BSA and 5% v/v glycerol. Off-rate measurement was performed similarly to what was described in the previous paragraph for RNA, except that the binding buffer contained tenfold less KCl (10 mM).
Nucleosome reconstitution was performed similarly to what was previously described13. Briefly, 135 pmol of DNA was mixed with three ratios (0.8, 1 and 1.2) of histone octamer (108, 135 and 162 pmol, purchased from the Histone Source at Colorado State University) in a buffer containing 2 M NaCl, 6 mM Tris pH 7.5, 0.3 mM EDTA and 0.3 mM dithiothreitol. The mixture was first incubated at 37 °C for 30 min, and then the following volumes of reaction buffer (20 mM Tris pH 7.5, 1 mM EDTA, 1 mM dithiothreitol) were added in 30-min intervals: 10.8, 12, 28 and 64 μl. Nucleosome assembly quality was assessed by gel electrophoresis in a native 1% agarose TBE gel, and the best DNA/histone octamer ratio was used for downstream analysis. Nucleosome binding assays with PRC2 were performed using EMSA in binding buffer (50 mM Tris-HCl pH 7.5 at 25 °C, 100 mM KCl, 0.1 mM ZnCl2, 2 mM 2-mercaptoethanol, 0.1 mg ml−1 BSA and 5% v/v glycerol). DNA sequences for mononucleosome and trinucleosome reconstruction are shown in Supplementary Table 4.
The catalytic activities of WT and MT PRC2 were measured on the H3 subunit and on the whole histone octamer similarly to what was described earlier13. For the methyltransferase reactions, 0.6 μM 4 m PRC2, 12 μM H3 or octamer, and five concentrations (24 to 1.5 μM) of 14C-labeled S-adenosyl methionine were incubated in the reaction buffer (recipe at the end of this paragraph) for 1 h at 30 °C. For the reactions with reconstructed mononucleosomes and the native polynucleosomes (asmbio 52015), 0.6 μM 4 m PRC2, 0.6 μM mononuclesome or 70 ng μl−1 polynucleosome, and three concentrations (24, 12 and 6 μM) of 14C-labeled S-adenosyl methionine were incubated in the reaction buffer for 2 h (mononucleosome) or 8 h (polynucleosome) at 30 °C. The reactions were quenched by adding 4× NuPAGE LDS Sample Buffer (ThermoFisher NP0007) and heating at 95 °C for 5 min to stop each reaction. Each reaction was then loaded onto 4–12% Bis-Tris gel (ThermoFisher NP0322BOX). Gel electrophoresis was carried out for 48 min at 180 V at room temperature. Gels were stained by InstantBlue for an hour and de-stained with water overnight. Three sheets of Whatman 3 mm chromatography paper were put underneath the gel, and gels were scanned and then vacuum dried for 60 min at 80 °C. Dried gels were subject to phosphorimaging plates and radioactive signal was acquired with a Typhoon Trio phosphorimager (GE Healthcare). Densitometry and analysis were carried out with ImageQuant software (GE Healthcare). The reaction buffer for H3 alone was 50 mM Tris-HCl pH 8.0 at 30 °C, 100 mM KCl, 2.5 mM MgCl2, 0.1 mM ZnCl2, 2 mM 2-mercaptoethanol and 0.1 mg ml−1 BSA, 5% v/v glycerol; and for nucleosomes and histone octamer was 50 mM Tris-HCl, pH 8.5, 5 mM MgCl2 and 4 mM dithiothreitol.
CRISPR genome editing of iPSCs.
WTC-11 iPSC line was obtained from Coriell Institute (catalog no. GM25256, deposited by B. Conklin, Gladstone Institute, University of California, San Francisco). For regular culture and passaging, WTC-11 was maintained in Essential 8 Flex medium (ThermoFisher A2858501) using Vitronectin (ThermoFisher A14700) as the coating material, and the medium was changed every other day until ready for passaging. To passage the cells, 5–10 min of incubation with 0.5 mM EDTA in D-PBS after a D-PBS wash step facilitated detachment, and cells were split with 1 to 6 (up to 10) ratio into new culture dishes coated with vitronectin. Cells were cryo-preserved in Essential 8 Flex medium with 10% dimethylsulfoxide for long-term storage.
For CRISPR genome editing of the WTC-11 line, a CRISPR plasmid encoding Cas9 and the guide RNA was made by inserting the single guide RNA sequence (CAGACGAGCTGATGAAGTAA) targeting exon 2 (towards the junction with intron 2) of the EZH2 gene in pX330 (Addgene 42230 (ref. 61)). Two donor plasmids carrying either the WT or MT (NM_004456.5:c.[229_230delinsGC; 235_237delinsGCT;242 A > C;250_252delinsGCC;1615_1623delinsAACGCC GCT;1625_1628delinsTCCG;1632G > C]) EZH2 complementary DNA were made by assembling the following fragments into a previously described donor plasmid62: left homology arm (−951 to −14, relative to the ATG start codon), EZH2 cDNA, EZH2 3′ UTR (872 bp immediately after the stop codon), 3× SV40 polyadenylation sites, 1× bGH polyadenylation site, SV40 promoter, puromycin resistance ORF, T2A self-cleavage site, mCherry ORF, SV40 polyadenylation site and right homology arm (+25 to +830, relative to the ATG start codon). Then, 1.2 μg of CRISPR plasmid and an equal amount of donor plasmid were transfected to 30% confluent WTC-11 iPSC cells in a six-well plate using Lipofectamine 3000 (ThermoFisher L3000015) following the manufacturer’s instructions. To apply puromycin selection, cells were then passaged to a 10-cm plate coated with Geltrex (ThermoFisher A1413301) after 2 d; switching to Geltrex (or to Matrigel alternatively) from vitronectin is critical for survival in puromycin selection. Next, 0.5 μg ml−1 puromycin was added to the culture once cells reached 60–80% confluency, and the concentration of puromycin was lowered to 0.25 μg ml−1 after 2 d of selection. Cells were selected in the presence of 0.25 μg ml−1 puromycin for 1 week and at least 48 surviving colonies were manually picked into 24-well plates under a Nikon SMZ1500 stereoscopic microscope. When each clone reached confluency, cells were passaged and a fraction was used for genomic DNA extraction. Four primers (P1–4) were used for verification of the correct genome editing, and their sequences are listed in Supplementary Table 4. PCR products were analyzed on a 1% agarose TAE gel. Verified iPSC clones were sent to WiCell (https://www.wicell.org) for karyotyping. Two independent clones of genome-edited WT and MT iPSCs were used in subsequent experiments.
For western blot analysis, CRISPR-edited iPSCs were collected, and 1× NuPAGE LDS Sample Buffer (ThermoFisher NP0007) supplemented with Benzonase nuclease (Sigma-Aldrich E1014) to 10 U μl−1 was used for preparing samples for SDS–PAGE. Standard western blot protocol was used and antibodies for detection included: EZH2 (Cell Signaling 5246S, 1:1,000), H3K27me3 (Cell Signaling 9733S, 1:500) and β-actin (Sigma-Aldrich A5441). EZH2 co-IP analysis was performed as previously described21, and EZH2 antibody from Active Motif (39875) was used for the pulldown. IgG control pulldown was performed with mouse IgG1 (ThermoFisher 14–4714-85). Antibodies used in the western blot included: EZH2 (Cell Signaling 5246S, rabbit, 1:1,000), SUZ12 antibody (Cell Signaling Technologies 3737, rabbit, 1:1,000), EED antibody (Abcam ab4469, 1:200), RBBP4 antibody (Cell Signaling Technologies 4633, rabbit, 1:1,000), JARID2 antibody (Cell Signaling Technologies 13594, rabbit, 1:1,000) and MTF2 antibody (Proteintech 16208–1-AP, rabbit, 1:500). Secondary antibody was Peroxidase-AffiniPure Donkey Anti-Rabbit IgG (H + L) (Jackson ImmunoResearch 711–035-152). Images were captured using AlphaView software (Proteinsimple, for Fluorchem systems).
For immunofluorescence, cells grown on cover slips were fixed with 4% formaldehyde in PBS for 10 min and then permeabilized in extraction buffer (0.5% Triton X-100, 20 mM Hepes-KOH pH 7.9, 50 mM NaCl, 3 mM MgCl2, 300 mM sucrose) for 10 min. Slides were then washed with PBS + 0.1% Triton X-100 twice and blocked in ABDIL buffer (3% BSA and 0.1% Triton X-100 in PBS). Primary antibody (EZH2 antibody, Cell Signaling Technology 5246; SOX2, OCT4 and SSEA4 antibody, Cell Signaling Technology 9656; all 1:200 dilution) diluted in ABDIL buffer was then added for a 1-h incubation, and secondary antibody (anti-mouse Alexa 488, Cell Signaling Technology 4408S and anti-rabbit Alexa 647, Life Technologies; 1:500 dilution) was added after three cycles of PBS wash. After another three cycles of PBS wash, cells were mounted using ProLong Diamond Antifade Mountant (Life Technologies P36970). All images were acquired on a Deltavision Core microscope (Applied Precision) and a scientific complementary metal–oxide–semiconductor (sCMOS) camera using DeltaVision SoftWoRx software (GE Healthcare).
fRIP and deep sequencing.
The fRIP experiments were performed with three replicates for each clone and two clones for each cell line (WT or MT iPSC), and the data in Extended Data Fig. 4 incorporate all replicates with statistical analysis. A 15-cm plate of each clone of the WT and MT iPSC lines was used for the fRIP experiment. fRIP pulldown and RNA extraction were carried out as previously described26; EZH2 (Cell Signaling Technologies 5246) antibody was used to immunoprecipitate PRC2 complexes. Input and pulldown RNA samples were used for cDNA library preparation using the KAPA RNA HyperPrep Kit with RiboErase (Roche/KAPA Biosystems KK8560) following the manufacturer’s protocol. cDNA libraries were pooled and sequenced with NextSeq 500 using a High-Output 75-cycle kit (paired-end, 2 × 75 bp).
The sequencing reads were mapped to the reference human genome (hg38) by STAR with GENCODE (v27) gene annotation. We only kept the primary alignment. The potential PCR duplicates identified by Picard MarkDuplicates were removed. After pooling technical replicates, the enriched genes in pulldown relative to input were identified by using DESeq2 and fdrtools in a similar way with ChIP–seq analyses after the sequencing reads were counted in a strand-specific way for gene bodies by using featureCounts63. The standard deviation of read counts for a gene was approximately calculated as 1/mean + deviation that was calculated by DESeq2.
RNA-seq.
Total RNA was extracted from two replicates of each clone and two clones for each cell line (WT or MT) using TRIzol (Life Technologies 15596026) following the manufacturer’s protocol. cDNA libraries were made using the KAPA RNA HyperPrep Kit with RiboErase; cDNA libraries were pooled and sequenced with NextSeq 500 using a High-Output 75-cycle kit (single read, 1 × 75 bp).
The sequencing reads were mapped to the reference human genome (hg38) by STAR with GENCODE (v27) gene annotation. TPM was calculated by counting uniquely mapped reads with featureCounts63 in a strand-specific way. Differentially expressed genes between WT and MT were identified by modeling read counts by generalized linear model accounting for cell lines. The statistical calculations were done by DESeq2, which performs two-sided Wald tests for regression coefficients of interest. We filtered out genes if their read counts were not greater than 3 in any sample of comparison. GSEA was performed for the gene sets available from Gene Ontology64,65 obtained from MSigDB66. This calculation was done using the R package CAMERA67, using the statistic calculated by DESeq2 as an input of CAMERA.
Cardiomyocyte differentiation.
iPSCs were differentiated into cardiomyocytes using GSK3 inhibitor CHIR99021 and Wnt inhibitor IWP2 (GiWi protocol)39. At 4 d before induction of differentiation (day −4), iPSCs were seeded at 150,000–200,000 cells per well of a 12-well plate coated with Geltrex, in mTeSR1 medium (StemCell Technologies 85850) with 5 μM Y27632 (ROCK inhibitor), to reach a confluency of around 20%. On days −3, −2 and −1, media were replaced daily with 2 ml per well of room-temperature mTeSR1. On day 0, the cells were around 90% confluent, and media were replaced with 2 ml per well of RPMI1640 medium containing B27-insulin supplement (A1895601) and 12 μM CHIR99021. On day 1, media were replaced with 3 ml per well of RPMI1640 medium containing B27-insulin supplement (without CHIR99021). On day 3, 1.5 ml per well of the existing medium was collected from each well and mixed with 1.5 ml per well of fresh RPMI1640 medium containing B27-insulin and supplemented with 5 μM IWP2, and this conditioned medium was used to replace the remaining media in each well. On day 5, media were replaced with 3 ml per well of RPMI1640 medium containing B27-insulin supplement (without IWP2). On day 7 and every 3 d afterwards, media were replaced with 3 ml per well of RPMI1640 medium containing B27 supplement (with insulin, ThermoFisher 17504044). Spontaneously beating monolayers were generally observed from day 8, and robust spontaneous contraction normally occurred by day 12. Time-lapse images of spontaneous contraction were captured on days 8 and 11 using a Nikon N-STORM microscope with a Hamamatsu ORCA-Flash4.0 V2 C11440 camera. Contractions were quantified using MotionGUI software68.
Flow cytometry analysis was performed as previously described39. Briefly, differentiated cells were collected on day 8 and day 12 using trypsin, and then fixed in 1% formaldehyde in PBS. Cells were permeabilized with 90% methanol and blocked with PBS containing 0.5% BSA. Each sample was incubated with 1.5 μl of Alexa Fluor 647 conjugated mouse anti-cardiac Troponin T (BD 565744) or Alexa Fluor 647 conjugated mouse IgG1 κ isotype control (BD 557732). Signals were detected using BD Accuri C6 Plus flow cytometry. A minimum of 40,000 cells were analyzed for each cell sample, and the results of the IgG negative control were used for gating.
Immunofluorescence experiments were carried out as described in ‘CRISPR genome editing of iPSCs’. Day −4 iPSCs were directly seeded in 24-well glass-bottom plates for cardiomyocyte differentiation and convenience of imaging. The primary antibodies were (1) rabbit anti-SIX1 (Cell Signaling, 1:200) and (2) mouse anti-α-actinin (Abcam ab9465, 1:200 dilution).
WT and MT EZH2 rescue experiments.
Each clone of the WT and MT iPSC lines was transfected with a FLAG-EZH2 (WT or MT) expression plasmid (controlled by a CMV promoter) using the Lipofectamine Stem reagent according to the manufacturer’s protocol. A second round of transfection was performed 4 d after the initial transfection to obtain better transfection efficiency. Half of the cells were collected for western blot analysis and the other half were used for cardiomyocyte differentiation. Differentiation protocol and analysis were the same as described in ‘Cardiomyocyte differentiation’. For the qPCR with reverse transcription analysis, total RNA from day 11 cardiomyocyte samples was extracted using trizol, and cDNA was made using random hexamers (ThermoFisher N8080127) and Superscript III reverse transcriptase (ThermoFisher 18080–044). qPCR was performed using SYBR Select Master Mix (ThermoFisher 4472918) using the primer pairs listed in Supplementary Table 4.
NPC differentiation.
Differentiation was performed using the STEMdiff SMADi Neural Induction Kit (StemCell Technologies 08581) according to the manufacturer’s monolayer protocol. Briefly, at day 0 the four human iPSC clones (WT-A, WT-B, MT-A and MT-B) were plated at 2 × 10⁶ cells per well in a Geltrex-coated six-well plate with mTeSr1 medium. The medium was replaced with neural induction medium with SMADi the next day and daily medium changes were performed onwards. On day 8, cells were passaged at 1:6 radio to a new well with neural induction medium with SMADi. Immunofluorescence experiments were performed on day-8 and day-11 NPCs, using similar protocols as described in ‘CRISPR genome editing of iPSCs’ except with the following primary antibodies: anti-PAX6 (mouse, 1:200, ThermoFisher MA1109), anti-OCT4 (rabbit, 1:400, Cell Signaling Technologies 2840), anti-Nestin (mouse, 1:200, ThermoFisher MA1110) and anti-SOX1 (rabbit, 1:200, Novus Biologicals NBP2–24486SS).
Statistics and reproducibility.
In all statistical comparisons involved in sequencing experiments, P values were corrected for multiple testing by false discovery rate (FDR). The statistical significances were determined by FDR-adjusted P value cutoff of 0.05, except for differential enrichment analyses (between genotypes or treatments) that used 0.1 as a cutoff. In all sequencing experiments, two independent clones per genotype or treatment were used to check reproducibility of the associated results or to perform statistical tests.
For all other statistical comparisons in this study, P values were calculated using two-sided t-test (equal variance).
Western blot analyses in Fig. 2b,c were repeated independently three times with similar results, and the IgG control (Extended Data Fig. 5f) was performed in an additional independent experiment. Imaging analyses in Fig. 3d and Extended Data Figs. 5d,e and 9 were repeated twice in independent differentiation experiments with similar results. SDS–PAGE gel analyses of purified protein components in Extended Data Fig. 3b were repeated three times with similar results. Methylation assays in Extended Data Fig. 3g were performed independently three times with similar results. PCR analyses in Extended Data Fig. 5a were performed twice with similar results. Western blot analyses in Extended Data Fig. 10a were repeated twice with similar results.
Reporting Summary.
Further information on research design is available in the Nature Research Reporting Summary linked to this article.
Extended Data
Extended Data Fig. 1 |. rChiP-seq of TBP, Rpb1, eZH2 and suZ12 in human iPsCs.

a, Venn diagrams with number of identified peaks in EZH2 and SUZ12 ChIP-seq experiments in −RNase A and +RNase A samples. The numbers of peaks identified in either of two independent clones were merged and counted. b, Metaplot of fold change (pulldown/input) for TBP rChIP-seq in two WT clones (black: WT-A, blue: WT-B) at transcription start site (TSS) + /− 5 kb. c, Motif analysis of TBP ChIP-seq identified the A/T rich sequence of TBP binding sites. This motif (statistical significance quantified by E-value: 7.5*10−16) was found by using MEME (http://meme-suite.org/) with top 1000 peaks. d, Metaplot of Rpb1 ChIP-seq in two WT clones (black: WT-A, blue: WT-B) at transcription start site (TSS) + /− 5 kb. e, Metaplot of Rpb1 ChIP-seq in two WT clones (black: WT-A, blue: WT-B) around gene bodies [from TSS – 5 kb to transcription termination site (TTS) + 5 kb] of the genes with peaks. Every gene is length-normalized to have the same number of tiles. f–i, RNase A treatment (y-axis) was compared to control (x-axis) in terms of fold change (log scale) of genes in pulldown relative to input. Two independent clones in each condition (N = 4) were used for empirical Wald test (two-sided, see Methods). Each dot represents a gene. The red denotes the genes with significant fold changes [multiple test-corrected (FDR) p-value < 0.1] between the treatment and the control. Dashed lines, expectation for RNA-independent ChIP. j–m, heatmap comparison of minus and plus RNase A treatment in terms of fold changes in pulldown relative to input. These are the same analyses as in Fig. 1b–e but using an independent clone.
Extended Data Fig. 2 |. EZH2 ChiP with or without triptolide treatment of human iPsCs.

a, Heatmaps of EZH2 ChIP fold change (pulldown/input) without and with (columns) triptolide in two different iPSC clones (rows). Each row describes a region of 5 kb upstream and downstream from the center of a single ChIP-seq peak. b, Triptolide treatment (y-axis) was compared to wild-type/untreated control (x-axis) in terms of fold change (log scale) of genes in pulldown relative to input. Two independent clones in each condition (N = 4) were used for empirical Wald tests (two-sided, see Methods). Each dot represents a gene. The red denotes the genes with significant fold changes [FDR-adjusted p-value < 0.1] between the treatment and the wild-type control. Diagonal dashed line is the expectation for triptolide-independent EZH2 binding to chromatin. c, EZH2 ChIP-qPCR results of three PRC2 target genes upon triptolide treatment. WT and MT (RNA binding mutant) are the two CRISPR-engineered iPSC strains presented in Fig. 2. The bar represents mean value and error bar represents the standard deviation of four biological replicates (two clones, each in two independent experiments). d, Distribution of EZH2 ChIP enrichment (log2(IP/input)) at four groups of genes. These four groups are divided based on their EZH2 ChIP enrichment in control samples (WT) as evaluated by empirical Wald tests (two-sided, see Methods): Non-target group consists of the depleted genes in WT EZH2 ChIP, based on FDR-adjusted p-value<0.05 and fold change of pulldown/input<1 (N = 1139); Weak target group consists of the enriched genes in WT EZH2 ChIP, based on multiple-test corrected (FDR) p-value<0.05 and 1 < = fold change of pulldown/input <2 (N = 3183); Strong target group consists of the enriched genes in IP relative to Input based on FDR-adjusted p-value<0.05 and fold change of pulldown/input > =2 (N = 285); all the other genes comprise background group (N = 31504). e, Fold change of EZH2 occupancy (triptolide divided by WT/untreated control) at individual genes. The distribution is described by a typical box plot: the box represents the first and third quartiles of percentage distribution with the horizontal line showing the median, and whiskers indicate 10th and 90th percentiles. All comparisons against background are statistically significant by Wilcoxon rank sum test (*** indicates p < 10−15 in two-sided test). The number of genes in statistical tests is same as in d.
Extended Data Fig. 3 |. Characterization of a separation-of-function human PRC2 mutant that is specifically defective in RNA interaction.

a, (Left) The mutant contains mutations at two sites of the EZH2 subunit, indicated with stars on the cryo-EM structure of PRC2 (PDB 6c23). Dashed red line, flexible loop. (Right) Table of all tested functions of PRC2. Green check mark, no substantial change compared to wild type (WT); red cross, substantial defect for the mutant. b, Coomassie-stained SDS-PAGE gel of recombinant 5-mer PRC2 WT and MT as used for following biochemical experiments. (c–f) WT in red and MT (mutant) in blue for all curves. For all binding curves, center of the dot represents mean value and the error bar represents the standard deviation of three independent experiments. c, Equilibrium binding of PRC2 to a G-quadruplex 40-mer RNA (GGAA)10 was measured using Electrophoretic Mobility Shift Assay (EMSA). Kdapp values of WT and MT: 2 and 12 nM, p-value = 0.0007, calculated by Student’s T-test with two-tailed distribution and two-sample equal variance). First lane of gel is RNA only, no protein. Subsequent lanes have successive three-fold dilutions of PRC2 from 5 μM. d, (left) Kinetic dissociation of PRC2-(GGAA)10 RNA complex was measured using fluorescence anisotropy, with unlabeled (GGAA)10 RNA added at time 0 to trap dissociated PRC2. Dissociation rate constants (koff) for 4 m and 5 m complexes are indicated and the dissociation curves for 4 m are shown. (right) Kinetic dissociation of PRC2-(CG)30 dsDNA. e, PRC2-DNA binding was tested using EMSA on a TERT promoter DNA (48 bp) with either unmethylated (left) or methylated (right) CpG dinucleotides. f, Binding of PRC2 to mono-nucleosomes (left) or tri-nucleosomes (right) was measured using EMSA. g, Methyltransferase activities of 4 m PRC2 complexes were measured on either histone H3, the entire histone octamer, reconstituted mononucleosomes or native polynucleosomes (Amsbio 52015). Automethylation of EZH2 also quantified. For all assays, center of the dot represents mean value and error bars give standard derivation of three independent experiments.
Extended Data Fig. 4 |. In vivo binding defect of the MT eZH2 exhibited by fRiP-seq.

fRIP experiment was used to examine the RNAs associated with PRC2. EZH2 MT (y-axis) was compared to EZH2 WT control (x-axis) for RNAs in terms of enrichment score defined as fold change (log scale) of pulldown relative to input divided by standard deviation. Two independent clones were used in each genotype to calculate enrichment scores for individual genes. Each dot represents the RNA product of a gene. The significantly enriched genes in WT, determined by empirical Wald tests with two independent clones (N = 2, multiple test-corrected (FDR) p-value<0.05, see Methods) and denoted by red, are located off the dashed 45-degree line that indicates the expectation if the MT EZH2 had no effect on RNA pulldown.
Extended Data Fig. 5 |. Introduction of the separation-of-function RNA mutant did not change the undifferentiated state of the iPsCs.

a, (Left) Schematic representation of the CRISPR genome editing to construct the WT and MT iPSC strains. Locations of the primer binding sites are shown for the four primers that are used in the PCR validation. (Right) Validation of the correct integration of the donor DNA at the CRISPR guide RNA cleavage site by PCR on genomic DNA. Two clones of each strain were validated, and the expected PCR amplicon sizes of edited and unedited allele are shown in the table below the gels. Data indicate absence of unedited alleles for all WT and MT clones. DNA ladders are labeled in base pairs on the side of the image. b, Appearance of the stem cell colonies under bright field microscope. White scale bar represents 1000 μm. c, Karyotyping of two clones of each edited strain; no abnormality of the 23 pairs was observed. d, Immunofluorescence results of the CRISPR-edited clones to evaluate expression of pluripotency markers (SOX2, OCT4 and SSEA4) and EZH2. e, Zoomed-in image of d comparing subcellular localization of EZH2 in WT and MT clones. f, EZH2 co-immunoprecipitation (co-IP) experiment in each of the two clones of the WT and MT iPSCs. Western blot for EZH2, SUZ12, EED, RBBP4, JARID2 and MTF2 are shown. Note that the IgG control pulldown doesn’t precipitate any of the PRC2 subunits, and the IgG bands in these blots are lighted by the secondary antibody (anti-mouse IgG HRP).
Extended Data Fig. 6 |. ChiP-seq of eZH2 and H3K27me3 in WT iPsCs.

a, Comparison of the EZH2 ChIP (x-axis) and H3K27me3 ChIP (y-axis) in the WT iPSCs. Log2 fold changes of IP relative to input are compared for every gene with two independent clones in each ChIP-seq. Colors indicate the statistical significance determined by empirical Wald tests [multiple test-corrected (FDR) p-value<0.05 in two-sided] of log2 fold change. The number of these genes are 3231 (blue: EZH2 only), 17 (orange: H3K27me3 only), 237 (red: both) and 33920 (gray: no significance). Venn diagram is shown on the top of scatter plot. Significant association of enriched genes between EZH2 ChIP and H3K27me3 ChIP was found (Fisher-exact test, p-value < 10−15). b, An example of a red dot gene in a (note that the EZH2 and H3K27me3 peaks correlate very well). c, Two examples of blue dot genes in a (note that there are no significant H3K27me3 peaks in the region).
Extended Data Fig. 7 |. Comparison of ChiP-seq between eZH2 WT and MT, and validation of G4 RNA-PRC2 binding using TMPyP4.
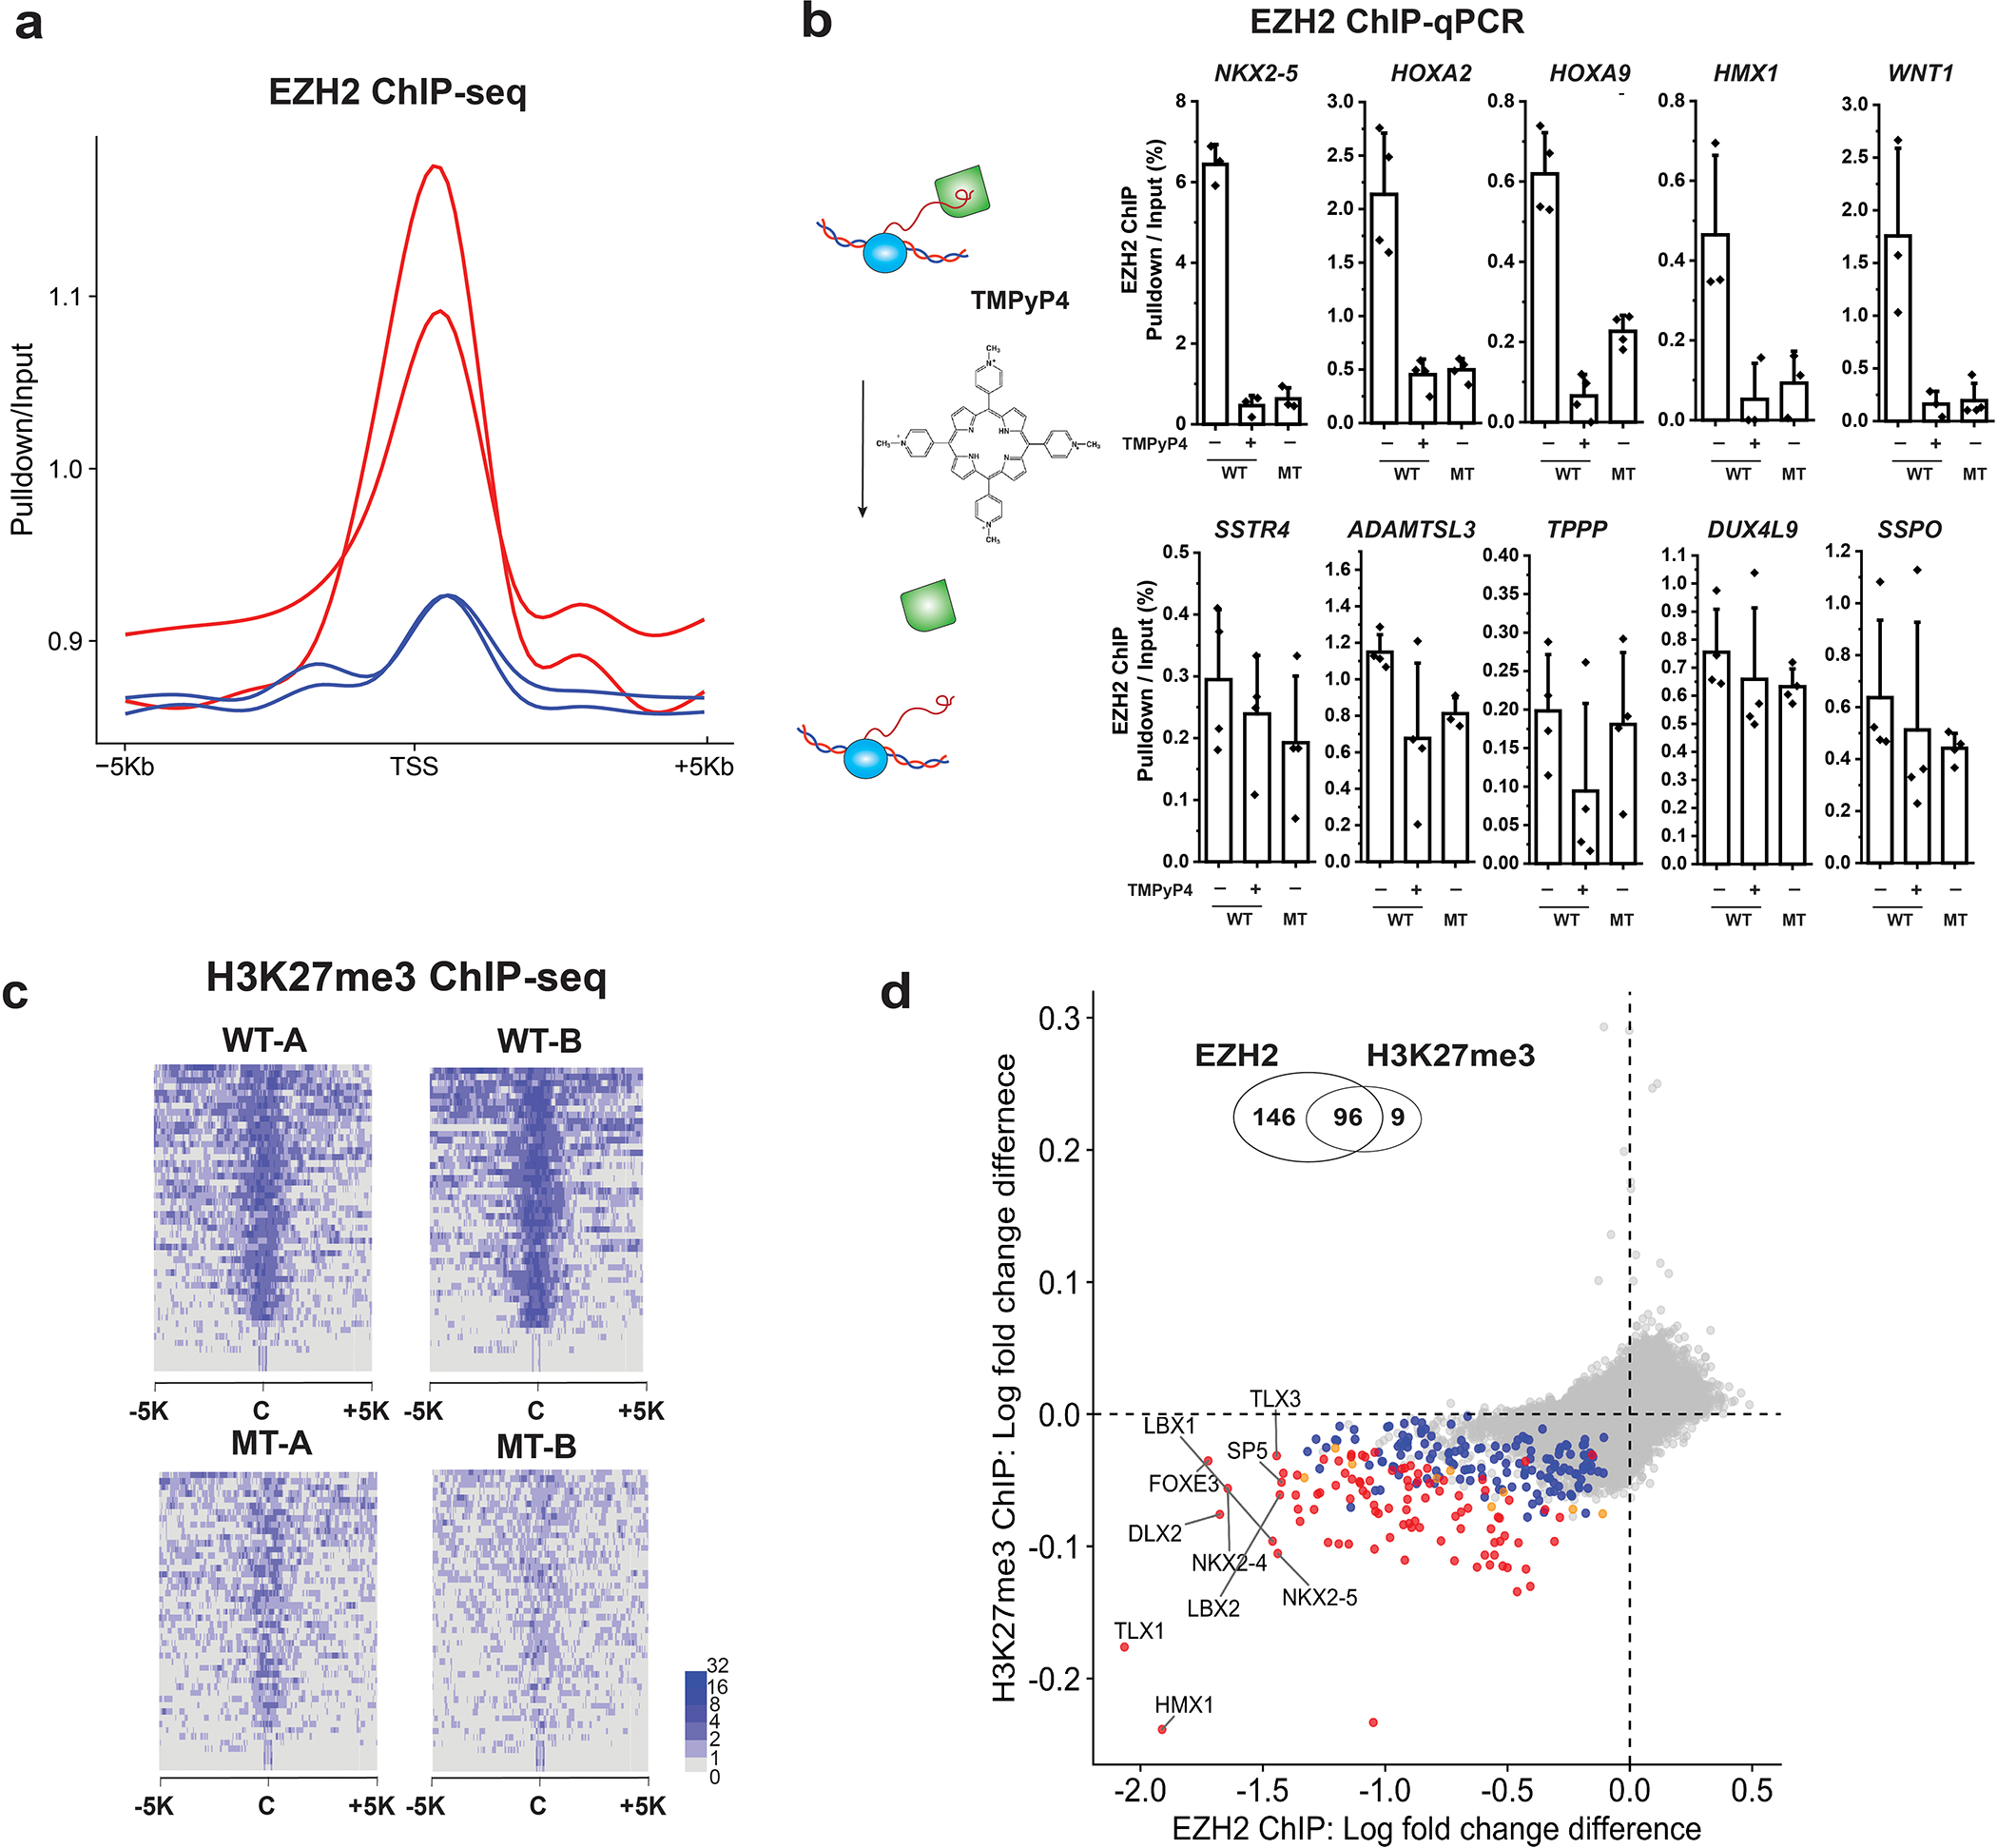
a, Fold changes of EZH2 ChIP-seq in two WT clones (red) and two MT clones (blue) at transcription start site (TSS) + /− 5 kb. b, TMPyP4 treatment phenocopies the RNA-binding defective EZH2 mutant. EZH2 ChIP-qPCR results of WT, WT with TMPyP4 treatment, and MT. Enrichment percentage (pulldown/input) plotted as the Y-axis. Five genes that had significant change of EZH2 occupancy with the mutant EZH2 are shown in the top panels, and the insignificantly changed genes are shown in the lower panels. Each point represents a replicate (N = 3 or 4 biological independent samples). The bar represents mean value and the error bars show standard deviation. c, Fold change of H3K27me3 ChIP-seq. In a heatmap, each row describes a region of 5 kb upstream and downstream from the center of a single peak. d, Comparison of the differential enrichment between WT and MT between EZH2 ChIP (x-axis) and H3K27me3 ChIP (y-axis). The differential enrichment was quantified by subtraction of log2 fold change in WT from log2 fold change in MT. Colors indicate the statistical significance [multiple test corrected (FDR) p-value<0.1 in two-sided empirical Wald test, see Methods] of differential enrichment. The number of these genes are 146 (blue: EHZ2 only), 9 (orange: H3K27me3 only), 96 (red: both) and 36946 (gray: no significance). Venn diagram is shown on the top of scatter plot. Significant overlap of differential genes was found between EZH2 ChIP and H3K27me3 ChIP (Fisher-exact test, p-value < 10−15).
Extended Data Fig. 8 |. Genome-wide gene expression changes in iPsCs caused by disruption of PRC2-RNA interaction.

a, Global gene expression change in MT relative to WT by RNA-seq. Two independent clones generating two sequencing libraries each in both WT and MT (N = 8) were used for statistical significance (two-sided Wald tests, see Methods). Each dot represents a gene where x-value is Transcripts Per Million (TPM) mean value of WT and y-value is TPM mean value of MT. Color indicates three groups of genes in comparison of mean TPM between WT and MT: gray, insignificant [multiple test-corrected (FDR) p-value > =0.05]; orange, significant (FDR-adjusted p-value<0.05) and log2(FC) < 1; red, significant (FDR-adjusted p-value<0.05) and log2(FC) > = 1, where FC (fold change) is ratio of MT to WT in normalized read counts. b, Comparison of cumulative distribution of gene expression between the two groups of genes (N is the number of genes): red, significantly perturbed genes in both EZH2 and H3K27me3 ChIP-seq (N = 51); grey, all other genes (N = 21842). The curve shifted to right (red relative to gray) indicates higher overall x-values (expression increase in MT compared to WT): p-value=0.0003714 by two-sample Kolmogorov-Smirnov test (two-sided, D = 0.29056). c, GSEA top 10 significant gene sets for differential gene expression. All of these gene sets had higher expression in MT relative to WT (Supplementary Table 2). Blue texts indicate heart-related terms. d, An example of significant term from c related to heart development: in the top panel, vertical bar with gene name indicates the location of genes in this term on the ranked score of differential expression from down-regulation to up-regulation in MT. The two regions are marked by colors for visualization indicating lower (blue) and upper (red) intervals of differential gene expression statistic/score for gene set enrichment analysis. Default values in R package limma are used for the two cut-offs. The bottom panel shows the updates of enrichment score (y-axis) along the ranked differential score (horizontal bar) in GSEA method. Differential score for a gene is a statistic calculated by DESeq2 for differential gene expression (see method).
Extended Data Fig. 9 |. Immunofluorescence staining of neuronal progenitor cell (NPC) markers (Nestin, sOX1 and PAX6) in iPsC-derived NPCs.

a, day 11 NPCs were stained with Nestin (green) and SOX1 (red). b, day 8 NPCs were stained with PAX6 (green) and OCT4 (red). OCT4 is a pluripotency marker while PAX6, Nestin and SOX1 are all NPC markers. Scale bars represent 15 μm.
Extended Data Fig. 10 |. Molecular details of the cardiomyocyte differentiation defect.

a, Western blot (cropped) shows expression levels of the transfected WT or mutant FLAG-tagged EZH2 in the rescue experiment. b, Molecular response in the rescue experiment. qRT-PCR experiments were used to compare expression of two cardiac genes (TNNT2 and MYH6) and one control gene (SOX2) in each clone rescued with each WT or MT EZH2. Three biological replicates are represented with dots. The bar represents mean value and error bar represents standard deviation. Expressions were normalized to GAPDH level. P-values calculated in Student’s T-test with two-tailed distribution and two-sample equal variance are shown on top of each bar plot. c, RNA-seq results of WT and MT strains at day 8 of differentiation. Sample size (N = 12), statistical test and color legends are exactly the same as described in Fig. 3g. d, GSEA analysis of significantly differentially-expressed genes between WT and MT in RNA-seq. e, Mean differential expression (MT/WT, expression quantified by RNA-seq) was compared across three time points [day 0 (undifferentiated), day 8 and day 12 of differentiation] for the 18 genes among the 96 genes that have significant changes in both EZH2 and H3K27me3 ChIP-seqs between WT and MT (genes denoted by red in the Extended Data Fig. 7d). These 18 genes were selected as they have significant changes in gene expression between WT and MT at any time points. Time points at which a gene is significantly differentially expressed are shown as larger triangles. f, The distribution of the 96 genes that have significant changes in both EZH2 and H3K27me3 occupancies (measured by ChIP-seq) between WT and MT (the genes denoted by red in the Extended Data Fig. 8e) in terms of mean differential expression (MT/WT, expression quantified by RNA-seq) across three differentiation time points. The distribution is described by a typical box plot: the box represents the second and third quartiles with the horizontal line showing the median, and whiskers indicate 10th and 90th percentiles (the number of detected genes, N = 51, 65, and 63 for day 0, day 8, and day 12, respectively). g, Expression levels (Mean TPM with standard error, N = 3 biological replicates for each bar) of transcription factors HMX1 and NKX2–5 at day 0, 8 and 12 of differentiation determined by RNA-seq analysis.
Supplementary Material
Acknowledgements
We thank L. Leinwand, O. Uhlenbeck, D. Youmans, T. Rowland, and Cech and Rinn laboratory members for useful discussions and technical assistance. We thank core facility directors J. Dragavon (BioFrontiers Advanced Light Microscopy Core), T. Nahreini (Biochemistry Cell Culture Facility and Flow Cytometry Shared Core; grant no. S10ODO21601), A. Scott (BioFrontiers Next Generation Sequencing Facility) and D. Timmons (BioFrontiers IT). We also thank B. Conklin (Gladstone Institute) for providing the WTC-11 iPSC cell line, J. Wheeler and J. Silver (CU-Boulder) for protocols of iPSC culture, M. Regnier (University of Washington) for advice on cardiomyocyte differentiation, N. Huebsch (Washington University in St. Louis) for providing the motion-tracking MATLAB platform/algorithm, and R. Parker and C. Decker (CU-Boulder) for access to the DeltaVision microscope. Y.L. is supported by NIH K99 award no. K99GM132546. T.R.C. is an investigator of the Howard Hughes Medical Institute (HHMI). J.L.R. is an HHMI Faculty Scholar and holds a Marvin H. Caruthers Endowed Chair for Early Career Faculty. J.L.R. and T.H. are supported by NIH P01 award no. P01GM099117.
Footnotes
Competing interests
T.R.C. is on the Merck board and is a consultant for Storm Therapeutics.
Extended data is available for this paper at https://doi.org/10.1038/s41588-020-0662-x.
Supplementary information is available for this paper at https://doi.org/10.1038/s41588-020-0662-x.
Reprints and permissions information is available at www.nature.com/reprints.
Data availability
Genomic data have been uploaded to GEO (accession GSE128135). All data, plasmids and cell lines used in the analysis are available upon request. Plasmids and cell lines are available upon request subject to a material transfer agreement (UBMTA) with the University of Colorado Boulder. Custom computational codes are available upon request as well as in GitHub (https://github.com/taeyoungh/PRC2). Gene set information for GSEA is available at https://www.gsea-msigdb.org/gsea/msigdb/index.jsp. Source data are provided with this paper.
References
- 1.Hudson WH & Ortlund EA The structure, function and evolution of proteins that bind DNA and RNA. Nat. Rev. Mol. Cell Biol. 15, 749–760 (2014). [DOI] [PMC free article] [PubMed] [Google Scholar]
- 2.Hendrickson DG, Kelley DR, Tenen D, Bernstein B & Rinn JL Widespread RNA binding by chromatin-associated proteins. Genome Biol. 17, 28 (2016). [DOI] [PMC free article] [PubMed] [Google Scholar]
- 3.Long Y, Wang X, Youmans DT & Cech TR How do lncRNAs regulate transcription? Sci. Adv. 3, eaao2110 (2017). [DOI] [PMC free article] [PubMed] [Google Scholar]
- 4.Khalil AM et al. Many human large intergenic noncoding RNAs associate with chromatin-modifying complexes and affect gene expression. Proc. Natl Acad. Sci. USA 106, 11667–11672 (2009). [DOI] [PMC free article] [PubMed] [Google Scholar]
- 5.Cao R et al. Role of histone H3 lysine 27 methylation in polycomb-group silencing. Science 298, 1039–1043 (2002). [DOI] [PubMed] [Google Scholar]
- 6.Muller J & Verrijzer P Biochemical mechanisms of gene regulation by polycomb group protein complexes. Curr. Opin. Genet. Dev. 19, 150–158 (2009). [DOI] [PubMed] [Google Scholar]
- 7.Schuettengruber B & Cavalli G Recruitment of Polycomb group complexes and their role in the dynamic regulation of cell fate choice. Development 136, 3531–3542 (2009). [DOI] [PubMed] [Google Scholar]
- 8.Margueron R & Reinberg D The Polycomb complex PRC2 and its mark in life. Nature 469, 343–349 (2011). [DOI] [PMC free article] [PubMed] [Google Scholar]
- 9.Helin K & Dhanak D Chromatin proteins and modifications as drug targets. Nature 502, 480–488 (2013). [DOI] [PubMed] [Google Scholar]
- 10.Pasini D, Bracken AP, Hansen JB, Capillo M & Helin K The polycomb group protein Suz12 is required for embryonic stem cell differentiation. Mol. Cell. Biol. 27, 3769–3779 (2007). [DOI] [PMC free article] [PubMed] [Google Scholar]
- 11.Laugesen A, Hojfeldt JW & Helin K Molecular mechanisms directing PRC2 recruitment and H3K27 methylation. Mol. Cell 74, 8–18 (2019). [DOI] [PMC free article] [PubMed] [Google Scholar]
- 12.Davidovich C & Cech TR The recruitment of chromatin modifiers by long noncoding RNAs: lessons from PRC2. RNA 21, 2007–2022 (2015). [DOI] [PMC free article] [PubMed] [Google Scholar]
- 13.Wang X et al. Molecular analysis of PRC2 recruitment to DNA in chromatin and its inhibition by RNA. Nat. Struct. Mol. Biol. 24, 1028–1038 (2017). [DOI] [PMC free article] [PubMed] [Google Scholar]
- 14.Beltran M et al. The interaction of PRC2 with RNA or chromatin is mutually antagonistic. Genome Res. 26, 896–907 (2016). [DOI] [PMC free article] [PubMed] [Google Scholar]
- 15.Kaneko S, Son J, Bonasio R, Shen SS & Reinberg D Nascent RNA interaction keeps PRC2 activity poised and in check. Genes Dev. 28, 1983–1988 (2014). [DOI] [PMC free article] [PubMed] [Google Scholar]
- 16.Cifuentes-Rojas C, Hernandez AJ, Sarma K & Lee JT Regulatory interactions between RNA and Polycomb repressive complex 2. Mol. Cell 55, 171–185 (2014). [DOI] [PMC free article] [PubMed] [Google Scholar]
- 17.Wei C et al. RBFox2 binds nascent RNA to globally regulate Polycomb complex 2 targeting in mammalian genomes. Mol. Cell 62, 875–889 (2016). [DOI] [PMC free article] [PubMed] [Google Scholar]
- 18.Guil S et al. Intronic RNAs mediate EZH2 regulation of epigenetic targets. Nat. Struct. Mol. Biol. 19, 664–670 (2012). [DOI] [PubMed] [Google Scholar]
- 19.Piunti A & Shilatifard A Epigenetic balance of gene expression by Polycomb and COMPASS families. Science 352, aad9780 (2016). [DOI] [PubMed] [Google Scholar]
- 20.Riising EM et al. Gene silencing triggers Polycomb repressive complex 2 recruitment to CpG islands genome wide. Mol. Cell 55, 347–360 (2014). [DOI] [PubMed] [Google Scholar]
- 21.Youmans DT, Schmidt JC & Cech TR Live-cell imaging reveals the dynamics of PRC2 and recruitment to chromatin by SUZ12-associated subunits. Genes Dev. 32, 794–805 (2018). [DOI] [PMC free article] [PubMed] [Google Scholar]
- 22.Beltran M et al. G-tract RNA removes Polycomb repressive complex 2 from genes. Nat. Struct. Mol. Biol. 26, 899–909 (2019). [DOI] [PMC free article] [PubMed] [Google Scholar]
- 23.Davidovich C et al. Toward a consensus on the binding specificity and promiscuity of PRC2 for RNA. Mol. Cell 57, 552–558 (2015). [DOI] [PMC free article] [PubMed] [Google Scholar]
- 24.Davidovich C, Zheng L, Goodrich KJ & Cech TR Promiscuous RNA binding by Polycomb repressive complex 2. Nat. Struct. Mol. Biol. 20, 1250–1273 (2013). [DOI] [PMC free article] [PubMed] [Google Scholar]
- 25.Wang X et al. Targeting of Polycomb repressive complex 2 to RNA by short repeats of consecutive guanines. Mol. Cell 65, 1056–1067 e5 (2017). [DOI] [PubMed] [Google Scholar]
- 26.Long Y et al. Conserved RNA-binding specificity of polycomb repressive complex 2 is achieved by dispersed amino acid patches in EZH2. eLife 6, e31558 (2017). [DOI] [PMC free article] [PubMed] [Google Scholar]
- 27.Abruzzi KC, Lacadie S & Rosbash M Biochemical analysis of TREX complex recruitment to intronless and intron-containing yeast genes. EMBO J. 23, 2620–2631 (2004). [DOI] [PMC free article] [PubMed] [Google Scholar]
- 28.Thompson PJ et al. hnRNP K coordinates transcriptional silencing by SETDB1 in embryonic stem cells. PLoS Genet. 11, e1004933 (2015). [DOI] [PMC free article] [PubMed] [Google Scholar]
- 29.Casale AM, Cappucci U, Fanti L & Piacentini L Heterochromatin protein 1 (HP1) is intrinsically required for post-transcriptional regulation of Drosophila Germline Stem Cell (GSC) maintenance. Sci. Rep. 9, 4372 (2019). [DOI] [PMC free article] [PubMed] [Google Scholar]
- 30.Bernstein E et al. Mouse polycomb proteins bind differentially to methylated histone H3 and RNA and are enriched in facultative heterochromatin. Mol. Cell Biol. 26, 2560–2569 (2006). [DOI] [PMC free article] [PubMed] [Google Scholar]
- 31.Barutcu AR, Blencowe BJ & Rinn JL Differential contribution of steady-state RNA and active transcription in chromatin organization. EMBO Rep. 20, e48068 (2019). [DOI] [PMC free article] [PubMed] [Google Scholar]
- 32.Lee CH et al. Automethylation of PRC2 promotes H3K27 methylation and is impaired in H3K27M pediatric glioma. Genes Dev. 33, 1428–1440 (2019). [DOI] [PMC free article] [PubMed] [Google Scholar]
- 33.Wang X et al. Regulation of histone methylation by automethylation of PRC2. Genes Dev. 33, 1416–1427 (2019). [DOI] [PMC free article] [PubMed] [Google Scholar]
- 34.Miyaoka Y et al. Isolation of single-base genome-edited human iPS cells without antibiotic selection. Nat. Methods 11, 291–U345 (2014). [DOI] [PMC free article] [PubMed] [Google Scholar]
- 35.Mandegar MA et al. CRISPR interference efficiently induces specific and reversible gene silencing in human iPSCs. Cell Stem Cell 18, 541–553 (2016). [DOI] [PMC free article] [PubMed] [Google Scholar]
- 36.Wang J et al. Identification of LBX2 as a novel causal gene of atrial septal defect. Int. J. Cardiol. 265, 188–194 (2018). [DOI] [PubMed] [Google Scholar]
- 37.Ochi H & Westerfield M Lbx2 regulates formation of myofibrils. BMC Dev. Biol. 9, 13 (2009). [DOI] [PMC free article] [PubMed] [Google Scholar]
- 38.Hoffmann AD et al. Foxf genes integrate tbx5 and hedgehog pathways in the second heart field for cardiac septation. PLoS Genet. 10, e1004604 (2014). [DOI] [PMC free article] [PubMed] [Google Scholar]
- 39.Lian X et al. Directed cardiomyocyte differentiation from human pluripotent stem cells by modulating Wnt/β-catenin signaling under fully defined conditions. Nat. Protoc. 8, 162–175 (2013). [DOI] [PMC free article] [PubMed] [Google Scholar]
- 40.Delgado-Olguin P et al. Epigenetic repression of cardiac progenitor gene expression by Ezh2 is required for postnatal cardiac homeostasis. Nat. Genet. 44, 343–347 (2012). [DOI] [PMC free article] [PubMed] [Google Scholar]
- 41.Amendt BA, Sutherland LB & Russo AF Transcriptional antagonism between Hmx1 and Nkx2.5 for a shared DNA-binding site. J. Biol. Chem. 274, 11635–11642 (1999). [DOI] [PubMed] [Google Scholar]
- 42.Rinn JL et al. Functional demarcation of active and silent chromatin domains in human HOX loci by noncoding RNAs. Cell 129, 1311–1323 (2007). [DOI] [PMC free article] [PubMed] [Google Scholar]
- 43.Zhao J et al. Genome-wide identification of Polycomb-associated RNAs by RIP-seq. Mol. Cell 40, 939–953 (2010). [DOI] [PMC free article] [PubMed] [Google Scholar]
- 44.Tsai MC et al. Long noncoding RNA as modular scaffold of histone modification complexes. Science 329, 689–693 (2010). [DOI] [PMC free article] [PubMed] [Google Scholar]
- 45.Yu JR, Lee CH, Oksuz O, Stafford JM & Reinberg D PRC2 is high maintenance. Genes Dev. 33, 903–935 (2019). [DOI] [PMC free article] [PubMed] [Google Scholar]
- 46.Lee CH et al. Allosteric activation dictates PRC2 activity independent of its recruitment to chromatin. Mol. Cell 70, 422–434 e6 (2018). [DOI] [PMC free article] [PubMed] [Google Scholar]
- 47.Oksuz O et al. Capturing the onset of PRC2-mediated repressive domain formation. Mol. Cell 70, 1149–1162 e5 (2018). [DOI] [PMC free article] [PubMed] [Google Scholar]
- 48.Pirrotta V Polycomb Bodies. in The Functional Nucleus (eds Bazett-Jones DP, & Dellaire G) 157–173 (Springer, 2016). [Google Scholar]
- 49.Cheutin T & Cavalli G Polycomb silencing: from linear chromatin domains to 3D chromosome folding. Curr. Opin. Genet. Dev. 25, 30–37 (2014). [DOI] [PubMed] [Google Scholar]
- 50.Schertzer MD et al. lncRNA-induced spread of Polycomb controlled by genome architecture, RNA abundance, and CpG island DNA. Mol. Cell 75, 523–537 e10 (2019). [DOI] [PMC free article] [PubMed] [Google Scholar]
- 51.Fang H et al. Trans- and cis-acting effects of the lncRNA Firre on epigenetic and structural features of the inactive X chromosome. Preprint at 10.1101/687236v1 (2019). [DOI] [PMC free article] [PubMed]
- 52.Hacisuleyman E et al. Topological organization of multichromosomal regions by the long intergenic noncoding RNA Firre. Nat. Struct. Mol. Biol. 21, 198–206 (2014). [DOI] [PMC free article] [PubMed] [Google Scholar]
References
- 53.Martin M Cutadapt removes adapter sequences from high-throughput sequencing reads. EMBnet. J. 17, 10–12 (2011). [Google Scholar]
- 54.Li H & Durbin R Fast and accurate short read alignment with Burrows–Wheeler transform. Bioinformatics 25, 1754–1760 (2009). [DOI] [PMC free article] [PubMed] [Google Scholar]
- 55.Zhang Y et al. Model-based analysis of ChIP-Seq (MACS). Genome Biol. 9, R137 (2008). [DOI] [PMC free article] [PubMed] [Google Scholar]
- 56.Kharchenko PV, Tolstorukov MY & Park PJ Design and analysis of ChIP-seq experiments for DNA-binding proteins. Nat. Biotechnol. 26, 1351–1359 (2008). [DOI] [PMC free article] [PubMed] [Google Scholar]
- 57.Wickham H Ggplot2: Elegant Graphics for Data Analysis (Springer, 2009). [Google Scholar]
- 58.O’Leary NA et al. Reference sequence (RefSeq) database at NCBI: current status, taxonomic expansion, and functional annotation. Nucleic Acids Res. 44, D733–D745 (2016). [DOI] [PMC free article] [PubMed] [Google Scholar]
- 59.Love MI, Huber W & Anders S Moderated estimation of fold change and dispersion for RNA-seq data with DESeq2. Genome Biol. 15, 550 (2014). [DOI] [PMC free article] [PubMed] [Google Scholar]
- 60.Strimmer K fdrtool: a versatile R package for estimating local and tail area-based false discovery rates. Bioinformatics 24, 1461–1462 (2008). [DOI] [PubMed] [Google Scholar]
- 61.Cong L et al. Multiplex genome engineering using CRISPR/Cas systems. Science 339, 819–823 (2013). [DOI] [PMC free article] [PubMed] [Google Scholar]
- 62.Xi LH, Schmidt JC, Zaug AJ, Ascarrunz DR & Cech TR A novel two-step genome editing strategy with CRISPR–Cas9 provides new insights into telomerase action and TERT gene expression. Genome Biol. 16, 231 (2015). [DOI] [PMC free article] [PubMed] [Google Scholar]
- 63.Liao Y, Smyth GK & Shi W featureCounts: an efficient general purpose program for assigning sequence reads to genomic features. Bioinformatics 30, 923–930 (2014). [DOI] [PubMed] [Google Scholar]
- 64.The Gene Ontology Consortium. The Gene Ontology Resource: 20 years and still GOing strong. Nucleic Acids Res. 47, D330–D338 (2019). [DOI] [PMC free article] [PubMed] [Google Scholar]
- 65.Ashburner M et al. Gene ontology: tool for the unification of biology. Nat. Genet. 25, 25–29 (2000). [DOI] [PMC free article] [PubMed] [Google Scholar]
- 66.Liberzon A et al. Molecular signatures database (MSigDB) 3.0. Bioinformatics 27, 1739–1740 (2011). [DOI] [PMC free article] [PubMed] [Google Scholar]
- 67.Wu D & Smyth GK Camera: a competitive gene set test accounting for inter-gene correlation. Nucleic Acids Res. 40, e133 (2012). [DOI] [PMC free article] [PubMed] [Google Scholar]
- 68.Huebsch N et al. Automated video-based analysis of contractility and calcium flux in human-induced pluripotent stem cell-derived cardiomyocytes cultured over different spatial scales. Tissue Eng. Part C Methods 21, 467–479 (2015). [DOI] [PMC free article] [PubMed] [Google Scholar]
Associated Data
This section collects any data citations, data availability statements, or supplementary materials included in this article.
Supplementary Materials
Data Availability Statement
Genomic data have been uploaded to GEO (accession GSE128135). All data, plasmids and cell lines used in the analysis are available upon request. Plasmids and cell lines are available upon request subject to a material transfer agreement (UBMTA) with the University of Colorado Boulder. Custom computational codes are available upon request as well as in GitHub (https://github.com/taeyoungh/PRC2). Gene set information for GSEA is available at https://www.gsea-msigdb.org/gsea/msigdb/index.jsp. Source data are provided with this paper.