

Abstract
The electronic structure and the chemical state in Am binary oxides and Am-doped UO were studied by means of X-ray absorption spectroscopy at shallow Am core (4d and 5d) edges. In particular, the Am 5f states were probed and the nature of their bonding to the oxygen states was analyzed. The interpretation of the experimental data was supported by the Anderson impurity model (AIM) calculations which took into account the full multiplet structure due to the interaction between 5f electrons as well as the interaction with the core hole. The sensitivity of the branching ratio of the Am and X-ray absorption lines to the chemical state of Am was shown using Am binary oxides as reference systems. The observed ratio for Am-doped UO suggests that at least at low Am concentrations, americium is in the Am(III) state in the UO lattice. To confirm the validity of the applied AIM approach, the analysis of the Am 4f X-ray photoelectron spectra of AmO and AmO was also performed which revealed a good agreement between experiment and calculations. As a whole, AmO can be classified as the charge-transfer compound with the 5f occupancy () equal to 5.73 electrons, while AmO is rather a Mott–Hubbard system with = 6.05.
Subject terms: Chemical physics, Excited states
Introduction
The americium oxides are the important part of the nuclear fuel cycle. In the framework of the fourth generation (GEN IV) nuclear reactor development, innovative fuel cycles are currently explored. The two main goals are an efficient use of the energy resources by recycling the major actinides together, such as U and Pu, and a decrease of the waste radiotoxicity by partitioning and transmutating the minor actinides, such as Am and Cm, as a part of the mixed-oxide (MOX) nuclear fuel. In this case, the studies of the incorporation of minor actinides in the lattice of (U,Pu)O and changes in the chemical state of actinides become important. Furthermore, the assessment of the properties of MOX as the multicomponent systems requires a comprehensive knowledge of properties of each binary oxide. The americium oxides and the MOX material with Am are considered as efficient power sources for missions into deep space1–3. That also requires detailed studies of oxide properties to help with the evaluation of their long-term performance.
From the electronic structure point of view, the character of the ground state, the strength of Coulomb interaction between the actinide 5f electrons, the actinide 5f occupancy and degree of covalency of the actinide 5f-O 2p bonds are important factors which affect both low-energy thermodynamic and high-energy optical properties of the system in question. In other words, the changes in the chemical bonding involving the actinide 5f and O 2p states have a major influence on the properties while changes in other states have not. X-ray methods, such as X-ray absorption spectroscopy (XAS) and X-ray photoelectron spectroscopy (XPS), are common tools in studies of electronic structure. Besides probing the chemical state of actinides in various systems, valuable information can be obtained about the oxygen/metal (O/M) ratio, (non)stoichiometry, and charge distribution, which are the parameters important for the fuel performance. However, due to high radioactivity of Am oxides, X-ray spectroscopic experiments are mostly conducted in the hard X-ray range where various containments for the samples can be used. The XAS measurements are usually performed at the Am ( transitions) edge4–11. In this case, the Am 6d states are probed and the information about the 5f states can be obtained only indirectly. While the chemical shift of the Am XAS spectra is commonly used to evaluate the Am oxidation state, it was also pointed out12 that the chemical shift of the spectra can be in part mimicked by a significant redistribution of the unoccupied density of states (DOS) in vicinity of the conduction band minimum. The statement was based on the high-resolution XAS data measured at the actinide ( transitions) edges of several actinide binary oxides12 which also probe the actinide 6d states.
To involve the Am 5f states into the spectroscopic process directly, the XAS experiments at the Am () or () or ( transitions) edges are necessary. It has been shown that the sensitivity of the XAS method can be significantly improved by performing the so-called high energy resolution fluorescence detected X-ray absorption (HERFD-XAS) measurements at the actinide edges13–15 in the tender X-ray range but, in particular for Am compounds, very few attempts for such analysis were made so far11,16,17. Here, we present the XAS data collected at the Am and edges of the Am oxides as a result of measurements in the soft X-ray range.
The analysis of the spectroscopic data in the framework of the Anderson impurity model (AIM)18 can help to obtain information about the character of the ground state, strength of Coulomb interaction between the Am 5f electrons, Am 5f occupancy and Am 5f-O 2p bonding. This is especially important in light of the discussion among the density-functional-theory (DFT) research groups about the value of in the Am oxides. For example, different values were claimed (varying between 4.0 eV and 7.0 eV) for the same Am oxides19–26 based on the results of DFT+U calculations. Besides the AIM interpretation of the Am and XAS data of the Am oxides, we also analyzed the Am 4f XPS spectra of AmO and AmO within the AIM framework because such a joint analysis puts tighter restrictions on the possible values of the model parameters.
Results and discussion
Figure 1 displays the measured Am XAS spectra of AmO and AmO. The spectra contain two main lines: ( transitions) at 831.0 eV for AmO and at 831.8 eV for AmO, and ( transitions) at 882.0 eV for AmO and at 882.6 eV for AmO. The intensity appearing in between the and lines represent transitions to the 7p states of americium. The higher intensity of the latter transitions for AmO can be explained by the lower electron occupancy as a result of the higher oxidation state of Am. The Am XAS spectrum of AmO reveals the chemical shift of 0.8 eV to the high energy side with respect to that of AmO, thus clearly indicating the difference in the oxidation state between the two samples. Other effects, such as e.g. crystal field splittings of the 5f shell, are too small to explain such a shift in energy. The value of the chemical shift is similar to that observed between the Am 4d XPS spectra27 of AmO and AmO.
Figure 1.
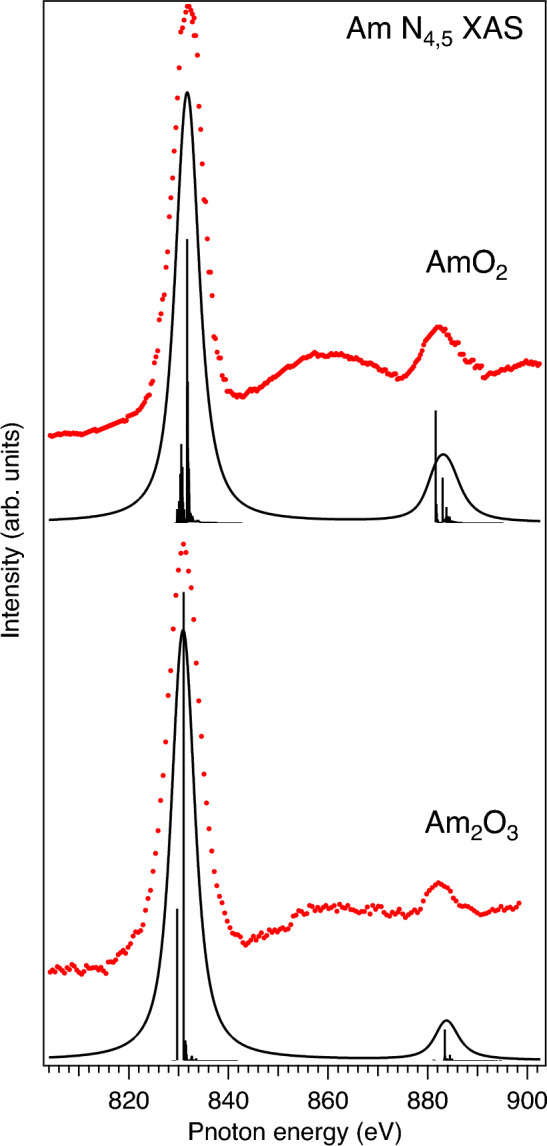
Am XAS spectra of Am oxides (red markers) compared with results of AIM calculations (solid black lines and poles).
Another distinct difference between the Am XAS spectra of AmO and AmO is the intensity ratio between the and lines. This is better illustrated in Fig. 2, where the Am XAS spectra of AmO and AmO are displayed on top of each other by aligning the Am maxima of AmO and AmO. It was argued28–30 that the branching ratio of the and lines, defined as , where I is the integrated intensity of the line, is a characteristic of the actinide oxidation state and 5f occupancy/count . A gradual decrease in the relative intensity and a corresponding increase in the branching ratio were demonstrated on going from the = 1 system to the = 6 system with reference to the nominal oxidation state/5f count. Indeed, one can see in Figs. 1 and 2 that the relative intensity is lower in the spectrum of AmO as compared to that of AmO, thus indicating the Am(III) system versus Am(IV) one.
Figure 2.

Measured and calculated Am XAS spectra of Am oxides aligned to the energy of maximum (set to zero eV).
Both the chemical shift and branching ratio of the Am XAS spectra can be used to get information on the chemical state of Am in MOX. Figure 3 compares the Am XAS spectrum of the UAmO sample with that of AmO. The maxima of the lines of both materials are found at the same photon energy, the span of the 7p background and the relative intensity appear to be similar. Therefore, in terms of the chemical shift and relative intensity, both spectra differ from that of AmO. A similarity of the UAmO and AmO spectra suggests that americium in the the UAmO sample is in the Am(III) state. That is in agreement with results of other studies of the UAmO system5–11,31 and in particular of MOX with the same doped Am concentration (x = 0.1). The substitution of U(IV) by Am(III) raises a question about the mechanism of the charge compensation. It was suggested that such a substitution leads to a creation of the U(V) fraction. However, in the O K XAS spectrum of UAmO, an appearance of the low-energy structure at 529 eV was observed32 which was attributed to a formation of the electronic holes in the O 2p band as an alternative mechanism of the charge compensation, instead of the creation of U(V).
Figure 3.
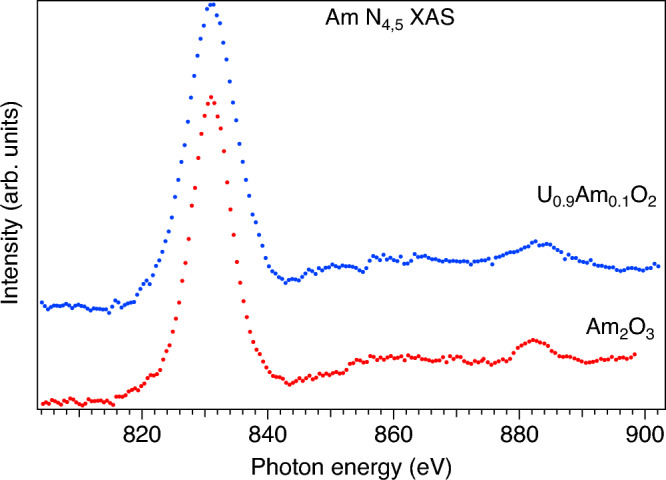
Am XAS spectra of AmO and UAmO.
The observed difference in the relative intensity ratio of the Am XAS spectra between AmO and AmO is supported by the results of the AIM calculations of these spectra. In the calculations, the ground state of AmO was described as a linear combination of the , and configurations, where stands for an electronic hole in the O 2p band. The final state of the X-ray absorption process was represented by a combination of the , and configurations. In the limit of (see the “Computational details” section), the difference between the configuration averaged energies for the ground state can be written as and , where is the Am 5f-O 2p charge-transfer energy and n is equal 5 in the AmO case. is taken as . For the final state of the XAS process, the difference between the configuration averaged energies can be defined as and .
To reproduce the experimental Am XAS spectrum of AmO, the following values of the model parameters were used in the AIM calculations: =-0.25 eV, =6.2 eV, =7.1 eV, V=0.9 eV. These values are similar to those derived by Yamazaki and Kotani33 from the AIM analysis of the Am 4f XPS spectrum of AmO. Since a combination of three configurations includes a very large number of the multiplet states, the value of N parameter was set to one for simplicity in our AmO calculations. The and integrals were scaled down to 80% of their ab-initio Hartree-Fock values calculated for the Am(IV) ion16. There is a certain consensus to apply such a level of the Slater integral reduction for compounds. The values of Wybourne’s crystal-field parameters ( = − 0.84 eV and =0.27 eV) for cubic symmetry were set to be the same as those in the Am 3d-4f RIXS calculations of AmO using the crystal-field multiplet theory16.
For AmO, the ground (final) state of the Am XAS process was described by a mixture of two configurations and ( and ) because the contribution of the configuration is expected to be small due to significantly increased . In connection with that the N parameter was set to 5 with W=2.0 eV. The other values of model parameters used in the AIM calculations for the Am XAS spectrum of AmO were =6.5 eV, =5.7 eV, =6.0 eV and V=0.7 eV. The and integrals were also reduced to 80% of their ab-initio Hartree–Fock values calculated for the Am(III) ion17. The crystal field was approximated by cubic symmetry with Wybourne’s parameters set to eV and eV. These parameter values were adopted from Ref.34 where they were derived using optical spectroscopy for Am(III) doped into the ThO lattice.
It is interesting that the calculated Am XAS spectra (Fig. 2) reproduce the observed small difference between AmO and AmO in the energy distance between the and lines which depends on the 4d spin-orbit splitting and the effect of the Am 5f-O 2p hybridization. The difference in the : intensity ratio between the Am XAS spectra of AmO and AmO seems to be somewhat larger in the calculations as compared with experiment (Fig. 2), however, it can be in part connected to some difference in the core-hole broadening of the line between AmO and AmO. For simplicity, the calculated Am XAS spectra were broadened with the -eV Lorenzian35 (besides the instrumental resolution approximated by the Gaussian), while it is expected that is somewhat larger for due to the Coster-Kronig decay and interaction with the continuum. The smaller band gap in AmO (Refs.21,24) will result in a higher rate for the Coster–Kronig decay, thus leading to a larger broadening of the line in AmO as compared to that in AmO. However, it is not easy to obtain an exact estimate for that, since the transition probability for the valence electrons involved in the Coster–Kronig process varies throughout the valence band width.
To calculate the Am XAS spectrum of AmO, the same values of the AIM parameters were used. All the physical quantities and operators related to 4d were simply replaced in the Hamiltonian with those related to 5d, so that would stand for the 5d and would be the one-electron energy of the Am(IV) 5d level. The final state of the spectroscopic process was represented by a combination of the , and configurations. It has been shown36,37 that XAS calculations at the actinide 5d edges require somewhat larger reduction of the ab-initio Hartree–Fock atomic values of the and integrals, describing the 5d–5f interaction. Therefore, in our calculations the , , integrals were scaled down to 80%, 75%, 65%, respectively, of their ab-initio values.
The experimental Am XAS spectrum of AmO displayed in Fig. 4 appears to be significantly broadened by a short Am 5d core-hole lifetime as a result of super Coster–Kronig decay and other autoionization processes and . The 5d core-hole lifetime strongly varies throughout the 5d edge38 and substantially increases when going from the pre-threshold region to the main edge. For simplicity, the low-energy region of the calculated Am XAS spectrum up to 115.0 eV was broadened with the Lorentzian with eV and the rest of the spectrum was broadened with the Fano profile with eV (the instrumental resolution was also simulated by the corresponding Gaussian). The AIM calculations reproduce the experimental spectrum fairly well (keeping in mind that a variation of the core-hole lifetime for each multiplet state was disregarded), thus supporting the choice of the model parameters and determined physical quantities based on these parameters. Note that there is some uncertainty on what function can used to fit a strongly diminishing-with-photon-energy background in the experimental spectrum in Fig. 4, therefore the background was not subtracted and left as it is.
Figure 4.
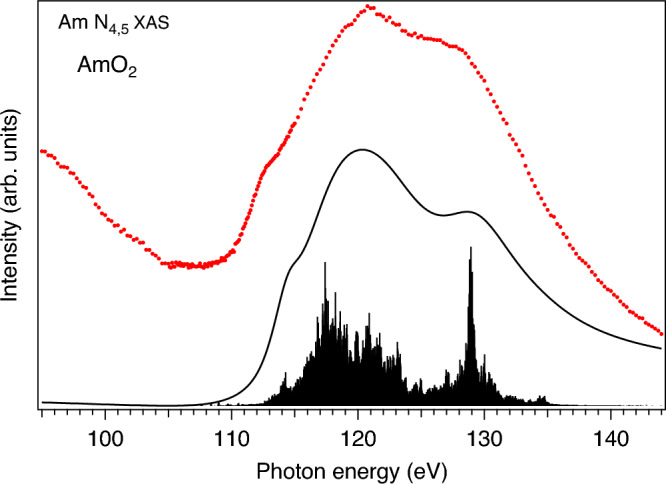
Measured (red markers) and calculated (solid black line and poles) Am XAS spectra of AmO.
The AIM calculations of the actinide core-level XPS spectra offer a even stricter test of the choice of the AIM parameters because the spectra of the actinide oxides with strong hybridization between actinide and oxygen states often reveal prominent charge-transfer satellites33,37. The energy positions of those satellites with respect to the main lines and their relative intensity allow for the more accurate determination of the values of the AIM parameters. Therefore, we performed the AIM calculations of Am 4f XPS spectra for both AmO and AmO. The results of the calculations can be compared with available experimental data. The Am 4f XPS data were reported in a few publications for AmO (Refs.27,39,40) and AmO (Refs.31,40–42).
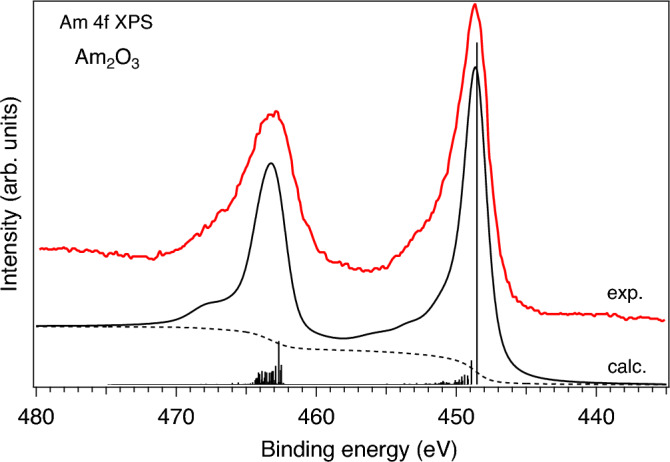
Figure 5 compares the measured and calculated Am 4f XPS spectra of AmO. The experimental spectrum was adopted from Ref.40. The AIM calculations were performed for the same values of the model parameters and the same combination of the electronic configurations in the ground state as in case of the Am and XAS calculations for AmO. For the final state of the XPS process in AmO, a mixture of the , and configurations was used. The value was set to 7.1 eV. In the limit of , the difference between the configuration averaged energies is described as and . The only difference here, within the same computational approach, from the cases of Am and XAS is the scaling amount of the ab-initio integrals, which will be discussed later.
Figure 5.

Comparison of measured (adopted from Ref.40) and calculated Am 4f XPS spectra of AmO.
The experimental Am 4f XPS of AmO in Fig. 5 contains the main and lines at around 448.2 eV and 462.3 eV, respectively, and is indeed characterized by the presence of the pronounced Am 5f-O 2p charge-transfer satellites located at 455.3 eV and 469.4 eV, respectively. In addition, the hint of another structure at 473.2 eV can be recognized in Fig. 5 while this structure is more clearly resolved in Ref.27. The AIM calculations of the Am 4f XPS spectrum of AmO reproduce the experimental structures quite well, except for the 473.2-eV structure. The latter in the calculated spectrum is located at the biding energies around 475 eV and is associated with the contribution of the configuration. Nevertheless, the energy position and the relative intensity of this structure is anticipated to be in better agreement with experiment when more electronic configurations () are included in the calculations. Due to a huge number of the involved multiplets and a high demand on the computational resources, the present calculations were limited to the current number of the electronic configurations.
Figure 6 compares the calculated Am 4f XPS spectrum of AmO to the experimental data adopted from Ref.40. Again, the AIM calculations were performed for the same values of model parameters as in case of the Am XAS calculations for AmO except for the scaling of the ab-initio integrals. The final state was described by a mixture of the and with the value equal to 6.0 eV. As a result, the observed agreement between experiment and calculations is quite good, thereby indicating the correct choice of the values for the AIM model parameters. Note, that the energy scales for the experimental Am 4f XPS of AmO and AmO were kept exactly the same as shown in Ref.40 while the corresponding calculated spectra were aligned with the experimental ones.
Figure 6.
Comparison of measured (adopted from Ref.40) and calculated Am 4f XPS spectra of AmO.
In solids, the value of the integral is expected to be significantly screened as compared to that for a free ion. In the case of the Am 4f XPS spectrum, it is clear that the conventional reduction of integrals to 80% of their ab-initio Hartree–Fock values does not fully account for such screening. Figures 7 and 8 display the results of the atomic multiplet calculations of the 4f XPS spectra for the Am(III) and Am(IV) ions, respectively, with different scaling of the integrals while the reduction of the integrals were kept to 80% of their ab-initio Hartree–Fock values. As one can see in Fig. 7, the Am(III) 4f XPS spectrum with the reduction to 80% reveals an intense structure at 459.3 eV and a double-peak line (at 464.4 eV and 466.5 eV) which are not observed in the experimental Am 4f XPS spectrum of AmO at all. A significant scaling down to 50% of their ab-initio Hartree–Fock values is required for these 4f XPS extra-structures to be significantly reduced (see Fig. 7). A similar situation was found for Am(IV) (Fig. 8). As a result of this exercise, the Am 4f XPS spectra of AmO and AmO in Figs. 5 and 6 were calculated with the 50% reduction of the integrals. Note, that in this case, the main effect comes from the scaling of , the reduction of integrals does not affect the shape of the Am 4f XPS spectrum much.
Figure 7.
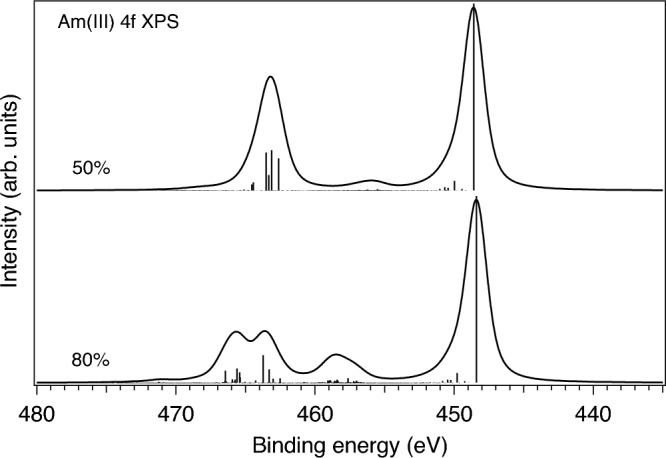
Calculated 4f XPS spectra of the Am(III) ion with the reduction of integrals to 80% and 50% of their ab-initio Hartree–Fock values, respectively.
Figure 8.
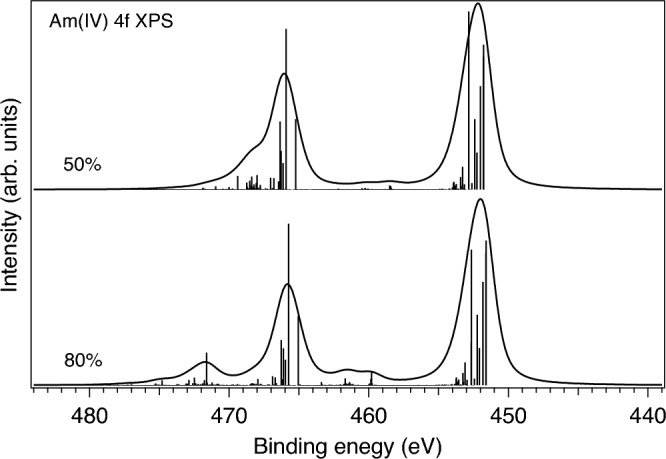
Calculated 4f XPS spectra of the Am(IV) ion with the reduction of integrals to 80% and 50% of their ab-initio Hartree–Fock values, respectively.
Conclusions
AIM calculations take into account all the important interactions to characterize chemical bonding. For AmO, the ground state in cubic symmetry is and it does not change when the Am 5f-O 2p hybridization is taken into account in the AIM calculations for AmO. Note, that a possible multipolar magnetic order20,24 was disregarded in our calculations. The contributions of the , and configurations in the ground state of AmO were calculated to be 34%, 59% and 7%, respectively. This results in 5f occupancy = 5.73 electrons and indicates a significant covalency of the Am 5f-O 2p bonds. For AmO, the contributions of the and configurations in the ground state were found to be 95% and 5%, respectively, thus leading to =6.05 electrons. Regarding the ratio43, AmO and can be classified as the charge-transfer compound while AmO is rather a Mott–Hubbard system. That means the different predominant character of the states at the valence band maximum in these oxides (O 2p character in AmO and Am 5f character in AmO) which will eventually affect the thermodynamic properties of these materials.
Methods
Experimental
One of the Am oxide samples used for measurements was fabricated by technique used to prepare radionuclide counting plates at the Lawrence Berkeley National Laboratory (LBNL; see the “Preparation of counting sources” subsection in Ref.44). The counting plate was prepared from an aqueous solution of about 2.0 mM Am-243 (better than 99.6% Am-243 by mass) in 0.1 M HCl that was delivered by micropipette techniques to an area of 4 mm area on a high purity Pt substrate (25.4 mm diameter). The aqueous droplets were allowed dry leaving a residue that was ring-shaped. This was followed by inductive heating to nearly 700 C under atmosphere to oxidize the material and fixing the material to the Pt substrate to preclude loss when placed in the UHV spectrometer chamber during the measurement. This process is expected to yield the Am oxide sesquioxide with an approximate composition of AmO (Ref.45). The counting plated was trimmed to 3 mm 3 mm around the center and mounted on the sample holder with conductive tape as described below. The Am sample taken to the Advanced Light Source (ALS) was close to 1 g of Am-243, approaching the safety limit of 200 nCi for Am-243.
The measured relative intensity ratio of the O ( transitions) and Am - ( transitions) or Am - ( transitions) lines (from low-energy-resolution overview spectra) corresponded to the AmO oxide as compared to AmO. Furthermore, the Am 5d–5f resonant inelastic X-ray scattering (RIXS) spectra at the Am 5d edge of this sample revealed the presence of a strong RIXS transition at the energy loss of 300 meV, which is characteristic for Am(III). A specially designed sample holder, which is described in Refs.38,46, was used for the AmO sample during the measurements. It is essentially a cylindrical can with slots for incoming and outgoing radiation. The sample is attached to the slab inside the can just behind the slot. Due to such a design, the sample holder served as a catch tray for material that might come loose during handling and the measurements, thus ensuring that no contamination will be left in the experimental chamber after the experiment.
The UAmO sample was prepared by a conventional powder metallurgical method. Required amounts of the depleted-uranium dioxide and (Am-241)O powders were weighed for the preparation of UAmO and mixed in a ball mill using tungsten balls. The resulting powder was pressed into a pellet at 40 MPa after adding the organic binder. To remove the organic binder, the pellet was heated at 800 C for 2.5 h in a reducing atmosphere. Sintering of the pellet was performed at 1700 C for 3 h under an Ar atmosphere containing 5% H. Both heating and cooling rates were 200 C/h. The oxygen potentials of the sintering atmosphere were adjusted by adding moisture. The prepared sample was characterized by X-ray diffraction. For X-ray spectroscopic measurements in the soft X-ray range at the synchrotron radiation laboratory, a tiny fraction of the prepared pellet was used to mount the sample in the closed source experimental system, described in Ref.47. This closed source experimental system was also used for a flake of AmO with the size of 0.3 0.3 mm. Instead of a SiN window, a diamond window with the thickness of 100 nm was installed to provide the higher X-ray transmission in the energy range of the Am 5d edge. A slight improvement to the experimental system was made to measure the drain current on the sample.
The measurements in the energy range of the Am and edges of the AmO and UAmO samples were performed at beamline 5.3.1 of the MAXlab48. The Am 4d and 5d XAS data were measured in the total electron yield (TEY) mode using the drain current on the sample. The incidence angle of the incoming photons was close to 90 to the surface of the sample. The monochromator resolution was set to 600 meV at 840 eV during measurements at the Am 4d edges and to 50 meV at 115 eV during measurements at the Am 5d edges. The Am XAS spectra of the AmO sample were recorded at beamline 7.0.1 of ALS49 of LBNL with the same energy resolution and at the same incidence angle as in measurements on AmO and UAmO. To optimize the placement of the photon beam on small samples, a camera with the zoom option was taken advantage of in both experiments at MAXlab and ALS. The camera was attached to the flange window on the analyzing chamber. To bring the Am XAS spectra measured at MAXlab and ALS to the same energy scale, the Ni XAS spectra of a Ni foil were recorded in both cases.
Note, induced radiation damage that would be higher for the Am-241 isotope may somewhat affect the Am chemical state (to a larger degree for Am(IV) oxide than for Am(III) oxide). This effect was not taken into account in calculations.
Computational details
AIM18 was used for the calculations which included the 5f and core 4d(5d) or 4f states on a single actinide ion and the O 2p states. The calculations were performed in a manner described in Refs.50–52.
The total Hamiltonian of a system can be written as
| 1 |
where , , and are one-electron energies of actinide 5f, core 4d(5d) and 4f levels and valence band, respectively, and , , , are electron creation operators at these levels with combined indexes , and to represent the spin and orbital states of the 5f, 4d(5d) and 4f and valence-band electrons, is the index of the N discrete energy levels in the O 2p band (bath states). and are the 4d(5d) and 4f core hole potentials, respectively, acting on the 5f electron. V is the hybridization term between actinide 5f states and states of the O 2p band. The is represented by the N discrete levels/bath states in the form
| 2 |
where and W are the center and width of the O 2p band, respectively. represents the electrostatic (), exchange () and spin-orbit interactions for the actinide ion and the applied crystal field16,17,53.
The isotropic XAS spectra at the Am edges were calculated using the equation
| 3 |
where and are the ground and XAS final states of the spectroscopic process with energies and , respectively. D is the operator for the optical dipole transition with the incident photon energy represented by and lifetime broadening of the final state in terms of half-width at half-maximum (HWHM).
The Am 4f XPS spectra were calculated using the following equation
| 4 |
where and are the ground and XPS final states of the spectroscopic process with energies and , respectively. is the binding energy, and is the annihilation operator of a core electron and is a lifetime broadening of the XPS final state in terms of HWHM.
The ab-initio values of Slater integrals , , , , , spin-orbit coupling constants , , and matrix elements were obtained with the TT-MULTIPLETS package which combines Cowan’s atomic multiplet program54 (based on the Hartree–Fock method with relativistic corrections) and Butler’s point-group program55, which were modified by Thole56, as well as the charge-transfer program written by Thole and Ogasawara. To compare with the experimental data, it is usually necessary to uniformly shift the calculated spectra on the photon energy scale because it is difficult to accurately reproduce the absolute energies in this type of calculations.
Acknowledgements
S.M.B acknowledges the support from the Swedish Research Council (research Grant 2017-06465). The computations and data handling were enabled by resources provided by the Swedish National Infrastructure for Computing (SNIC) at National Supercomputer Centre at Linköping University partially funded by the Swedish Research Council through grant agreement no. 2018-05973. This work was supported in part by the Director, Office of Science, Office of Basic Energy Sciences, Division of Chemical Sciences, Geosciences, and Biosciences Heavy Elements Chemistry program (DKS) of the U.S. Department of Energy at Lawrence Berkeley National Laboratory under Contract No. DE-AC02-05CH11231. This research used resources of the Advanced Light Source, a U.S. DOE Office of Science User Facility under contract No. DE-AC02-05CH11231. The Am-243 used in this work was supplied by the U.S. DOE through the transplutonium element production facilities at ORNL.
Author contributions
S.M.B. conceived, planned and conducted the experiments, performed the calculations and analyzed the results, D.K.S. planned and conducted the experiments, prepared and characterized the samples. The authors reviewed the manuscript.
Funding
Open access funding provided by Uppsala University.
Data availability
The datasets generated during and/or analysed during the current study are available from the corresponding author on reasonable request.
Competing interests
The authors declare no competing interests.
Footnotes
Publisher's note
Springer Nature remains neutral with regard to jurisdictional claims in published maps and institutional affiliations.
References
- 1.Wiss T, et al. Investigation on the use of americium oxide for space power sources: Radiation damage studies. E3S Web Conf. 2017;16:05004. doi: 10.1051/e3sconf/20171605004. [DOI] [Google Scholar]
- 2.Vigier J-F, et al. Optimization of uranium-doped americium oxide synthesis for space application. Inorg. Chem. 2018;57:4317–4327. doi: 10.1021/acs.inorgchem.7b03148. [DOI] [PubMed] [Google Scholar]
- 3.Wiss T, et al. TEM study of alpha-damaged plutonium and americium dioxides. J. Mater. Res. 2015;30:1544–1554. doi: 10.1557/jmr.2015.37. [DOI] [Google Scholar]
- 4.Nishi T, et al. Local and electronic structure of AmO and AmO with XAFS spectroscopy. J. Nucl. Mater. 2010;401:138–142. doi: 10.1016/j.jnucmat.2010.04.011. [DOI] [Google Scholar]
- 5.Prieur D, et al. Local structure and charge distribution in mixed uranium–americium oxides: Effects of oxygen potential and Am content. Inorg. Chem. 2011;50:12437–12445. doi: 10.1021/ic200910f. [DOI] [PubMed] [Google Scholar]
- 6.Vespa M, Rini M, Spino J, Vitova T, Somers J. Fabrication and characterization of (U, Am)O transmutation targets. J. Nucl. Mater. 2012;421:80–88. doi: 10.1016/j.jnucmat.2011.11.055. [DOI] [Google Scholar]
- 7.Prieur D, et al. Reactive sintering of UAmO in overstoichiometric conditions. J. Eur. Ceram. Soc. 2012;32:1585–1591. doi: 10.1016/j.jeurceramsoc.2011.12.017. [DOI] [Google Scholar]
- 8.Prieur D, et al. Comparative XRPD and XAS study of the impact of the synthesis process on the electronic and structural environments of uranium-americium mixed oxides. J. Solid State Chem. 2015;230:8–13. doi: 10.1016/j.jssc.2015.03.037. [DOI] [Google Scholar]
- 9.Lebreton F, et al. Peculiar behavior of (U, Am)O compounds for high americium contents evidenced by XRD, XAS, and Raman spectroscopy. Inorg. Chem. 2015;54:9749–9760. doi: 10.1021/acs.inorgchem.5b01357. [DOI] [PubMed] [Google Scholar]
- 10.Prieur D, et al. Melting behaviour of americium-doped uranium dioxide. J. Chem. Thermodyn. 2016;97:244–252. doi: 10.1016/j.jct.2016.02.003. [DOI] [Google Scholar]
- 11.Epifano E, et al. Extreme multi-valence states in mixed actinide oxides. Commun. Chem. 2019;2:59. doi: 10.1038/s42004-019-0161-0. [DOI] [Google Scholar]
- 12.Butorin SM, et al. Local symmetry effects in actinide 4f X-ray absorption in oxides. Anal. Chem. 2016;88:4169–4173. doi: 10.1021/acs.analchem.5b04380. [DOI] [PubMed] [Google Scholar]
- 13.Kvashnina KO, Butorin SM, Martin P, Glatzel P. Chemical state of complex uranium oxides. Phys. Rev. Lett. 2013 doi: 10.1103/PhysRevLett.111.253002. [DOI] [PubMed] [Google Scholar]
- 14.Kvashnina K, Kvashnin Y, Butorin S. Role of resonant inelastic X-ray scattering in high-resolution core-level spectroscopy of actinide materials. J. Electron Spectrosc. Relat. Phenom. 2014;194:27–36. doi: 10.1016/j.elspec.2014.01.016. [DOI] [Google Scholar]
- 15.Butorin SM, Kvashnina KO, Vegelius JR, Meyer D, Shuh DK. High-resolution X-ray absorption spectroscopy as a probe of crystal-field and covalency effects in actinide compounds. Proc. Natl. Acad. Sci. U.S.A. 2016;113:8093–8097. doi: 10.1073/pnas.1601741113. [DOI] [PMC free article] [PubMed] [Google Scholar]
- 16.Butorin SM. 3d–4f resonant inelastic X-ray scattering of actinide dioxides: Crystal-field multiplet description. Inorg. Chem. 2020;59:16251–16264. doi: 10.1021/acs.inorgchem.0c02032. [DOI] [PMC free article] [PubMed] [Google Scholar]
- 17.Butorin SM. Advanced X-ray spectroscopy of actinide trichlorides. J. Chem. Phys. 2021 doi: 10.1063/5.0062927. [DOI] [PubMed] [Google Scholar]
- 18.Anderson PW. Localized magnetic states in metals. Phys. Rev. 1961;124:41–53. doi: 10.1103/PhysRev.124.41. [DOI] [Google Scholar]
- 19.Wen X-D, et al. Effect of spin-orbit coupling on the actinide dioxides AnO (An=Th, Pa, U, Np, Pu, and Am): A screened hybrid density functional study. J. Chem. Phys. 2012 doi: 10.1063/1.4757615. [DOI] [PubMed] [Google Scholar]
- 20.Suzuki M-T, Magnani N, Oppeneer PM. Microscopic theory of the insulating electronic ground states of the actinide dioxides AnO (An = U, Np, Pu, Am, and Cm) Phys. Rev. B. 2013;88:195146. doi: 10.1103/PhysRevB.88.195146. [DOI] [Google Scholar]
- 21.Suzuki C, et al. DFT study on the electronic structure and chemical state of Americium in an (Am, U) mixed oxide. J. Phys. Chem. Solids. 2013;74:1769–1774. doi: 10.1016/j.jpcs.2013.07.006. [DOI] [Google Scholar]
- 22.Lu Y, Yang Y, Zheng F, Wang B-T, Zhang P. Electronic, mechanical, and thermodynamic properties of americium dioxide. J. Nucl. Mater. 2013;441:411–420. doi: 10.1016/j.jnucmat.2013.06.043. [DOI] [Google Scholar]
- 23.Pegg JT, Aparicio-Anglès X, Storr M, de Leeuw NH. DFT+U study of the structures and properties of the actinide dioxides. J. Nucl. Mater. 2017;492:269–278. doi: 10.1016/j.jnucmat.2017.05.025. [DOI] [Google Scholar]
- 24.Talla Noutack MS, Geneste G, Jomard G, Freyss M. First-principles investigation of the bulk properties of americium dioxide and sesquioxides. Phys. Rev. Mater. 2019 doi: 10.1103/PhysRevMaterials.3.035001. [DOI] [Google Scholar]
- 25.Chen J-L, Kaltsoyannis N. Computational study of the bulk and surface properties of minor actinide dioxides MAnO (MAn = Np, Am, and Cm); Water adsorption on stoichiometric and reduced , , and surfaces. J. Phys. Chem. C. 2019;123:15540–15550. doi: 10.1021/acs.jpcc.9b02324. [DOI] [Google Scholar]
- 26.Morée J-B, Outerovitch R, Amadon B. First-principles calculation of the Coulomb interaction parameters U and J for actinide dioxides. Phys. Rev. B. 2021;103:045113. doi: 10.1103/PhysRevB.103.045113. [DOI] [Google Scholar]
- 27.Teterin Y, et al. X-ray photoelectron spectra structure and chemical bonding in AmO. Nucl. Technol. Radiat. Prot. 2015;30:83–98. doi: 10.2298/NTRP1502083T. [DOI] [Google Scholar]
- 28.Moore KT, van der Laan G. Nature of the 5f states in actinide metals. Rev. Mod. Phys. 2009;81:235–298. doi: 10.1103/RevModPhys.81.235. [DOI] [Google Scholar]
- 29.Moore KT, van der Laan G, Haire RG, Wall MA, Schwartz AJ. Oxidation and aging in U and Pu probed by spin-orbit sum rule analysis: Indications for covalent metal-oxide bonds. Phys. Rev. B. 2006;73:033109. doi: 10.1103/PhysRevB.73.033109. [DOI] [Google Scholar]
- 30.Butorin SM, et al. X-ray spectroscopic study of chemical state in uranium carbides. J. Synchrotron. Rad. 2022;29:295–302. doi: 10.1107/S160057752101314X. [DOI] [PMC free article] [PubMed] [Google Scholar]
- 31.Mayer, K., Kanellakopoulos, B., Naegele, J. & Koch, L. On the valency state of americium in (UAm)O. J. Alloys Compd.213–214, 456–459. 10.1016/0925-8388(94)90960-1 (1994).
- 32.Kvashnina KO, Butorin SM. High-energy resolution X-ray spectroscopy at actinide M and ligand K edges: What we know, what we want to know, and what we can know. Chem. Commun. 2022;58:327–342. doi: 10.1039/D1CC04851A. [DOI] [PMC free article] [PubMed] [Google Scholar]
- 33.Yamazaki T, Kotani A. Systematic analysis of 4 f core photoemission spectra in actinide oxides. J. Phys. Soc. Jpn. 1991;60:49–52. doi: 10.1143/JPSJ.60.49. [DOI] [Google Scholar]
- 34.Hubert S, Thouvenot P, Edelstein N. Spectroscopic studies and crystal-field analyses of Am and Eu in the cubic-symmetry site of ThO. Phys. Rev. B. 1993;48:5751–5760. doi: 10.1103/PhysRevB.48.5751. [DOI] [PubMed] [Google Scholar]
- 35.Campbell J, Papp T. Widths of the atomic K-N levels. At. Data Nucl. Data Tables. 2001;77:1–56. doi: 10.1006/adnd.2000.0848. [DOI] [Google Scholar]
- 36.Ogasawara H, Kotani A, Thole BT. Calculation of magnetic X-ray dichroism in 4d and 5d absorption spectra of actinides. Phys. Rev. B. 1991;44:2169–2181. doi: 10.1103/PhysRevB.44.2169. [DOI] [PubMed] [Google Scholar]
- 37.Kotani A, Ogasawara H. Theory of core-level spectroscopy in actinide systems. Phys. B Condens. Matter. 1993;186–188:16–20. doi: 10.1016/0921-4526(93)90485-O. [DOI] [Google Scholar]
- 38.Butorin, S. M. Resonant inelastic soft X-ray scattering spectroscopy of light-actinide materials. In Actinide Nanoparticle Research. (eds. Kalmykov, S. N. & Denecke, M. A.) (Springer Berlin Heidelberg, 2011) 10.1007/978-3-642-11432-8_3.
- 39.Veal BW, Lam DJ, Diamond H, Hoekstra HR. X-ray photoelectron-spectroscopy study of oxides of the transuranium elements Np, Pu, Am, Cm, Bk, and Cf. Phys. Rev. B. 1977;15:2929–2942. doi: 10.1103/PhysRevB.15.2929. [DOI] [Google Scholar]
- 40.Nevitt, P. Photoemission studies of the light actinides. Ph.D. thesis, Cardiff University (2005).
- 41.Gouder T, Oppeneer PM, Huber F, Wastin F, Rebizant J. Photoemission study of the electronic structure of Am, AmN, AmSb, and AmO films. Phys. Rev. B. 2005;72:115122. doi: 10.1103/PhysRevB.72.115122. [DOI] [Google Scholar]
- 42.Finck N, et al. XAS signatures of Am(III) adsorbed onto magnetite and maghemite. J. Phys. Conf. Ser. 2016;712:012085. doi: 10.1088/1742-6596/712/1/012085. [DOI] [Google Scholar]
- 43.Zaanen J, Sawatzky GA, Allen JW. Band gaps and electronic structure of transition-metal compounds. Phys. Rev. Lett. 1985;55:418–421. doi: 10.1103/PhysRevLett.55.418. [DOI] [PubMed] [Google Scholar]
- 44.Moody, K. J. et al. Analytical chemistry of plutonium. In The Chemistry of the Actinide and Transactinide Elements (eds. Morss, L. R., Edelstein, N. M. & Fuger, J.) 3889–4003 (Springer Netherlands, 2010) 10.1007/978-94-007-0211-0_36.
- 45.Kvashnina KO, et al. Resonant inelastic X-ray scattering of curium oxide. Phys. Rev. B. 2007;75:115107. doi: 10.1103/PhysRevB.75.115107. [DOI] [Google Scholar]
- 46.Smiles, D. E. & Shuh, D. K. Soft X-ray synchrotron radiation studies of plutonium materials. In Plutonium Handbook, 2nd Ed, vol. 6, (eds. Clark, D. L., Geeson, D. A. & Hanrahan, J., R. J.) 2991–3007 (American Nuclear Society, 2019).
- 47.Modin A, et al. Closed source experimental system for soft X-ray spectroscopy of radioactive materials. Rev. Sci. Instrum. 2008;79:093103. doi: 10.1063/1.2991109. [DOI] [PubMed] [Google Scholar]
- 48.Denecke R, et al. Beamline I511 at MAX II, capabilities and performance. J. Electron Spectrosc. Relat. Phenom. 1999;101–103:971–977. doi: 10.1016/S0368-2048(98)00358-2. [DOI] [Google Scholar]
- 49.Warwick T, Heimann P, Mossessian D, McKinney W, Padmore H. Performance of a high resolution, high flux density SGM undulator beamline at the ALS (invited) Rev. Sci. Instrum. 1995;66:2037–2040. doi: 10.1063/1.1145789. [DOI] [Google Scholar]
- 50.Kotani A, Ogasawara H. Theory of core-level spectroscopy of rare-earth oxides. J. Electron Spectrosc. Relat. Phenom. 1992;60:257–299. doi: 10.1016/0368-2048(92)80024-3. [DOI] [Google Scholar]
- 51.Butorin SM, et al. Resonant X-ray fluorescence spectroscopy of correlated systems: A probe of charge-transfer excitations. Phys. Rev. Lett. 1996;77:574–577. doi: 10.1103/PhysRevLett.77.574. [DOI] [PubMed] [Google Scholar]
- 52.Nakazawa M, Ogasawara H, Kotani A. Theory of polarization dependence in resonant X-ray emission spectra of a uranium compound. Surf. Rev. Lett. 2002;09:1149–1153. doi: 10.1142/S0218625X02003433. [DOI] [Google Scholar]
- 53.Butorin SM, Modin A, Vegelius JR, Kvashnina KO, Shuh DK. Probing chemical bonding in uranium dioxide by means of high-resolution X-ray absorption spectroscopy. J. Phys. Chem. C. 2016;120:29397–29404. doi: 10.1021/acs.jpcc.6b09335. [DOI] [Google Scholar]
- 54.Cowan, R. D. The Theory of Atomic Structure and Spectra. No. 3 in Los Alamos Series in Basic and Applied Sciences (University of California Press, 1981).
- 55.Butler, P. H. Point Group Symmetry Applications: Methods and Tables. (Springer US, 1981). OCLC: 958528839.
- 56.Thole B, Van Der Laan G, Butler P. Spin-mixed ground state of Fe phthalocyanine and the temperature-dependent branching ratio in X-ray absorption spectroscopy. Chem. Phys. Lett. 1988;149:295–299. doi: 10.1016/0009-2614(88)85029-2. [DOI] [Google Scholar]
Associated Data
This section collects any data citations, data availability statements, or supplementary materials included in this article.
Data Availability Statement
The datasets generated during and/or analysed during the current study are available from the corresponding author on reasonable request.