

Key Points
Question
How does once-weekly insulin icodec compare with once-daily insulin degludec in glucose-lowering efficacy (hemoglobin A1c [HbA1c]) in people with insulin-naive type 2 diabetes?
Findings
In this randomized, double-masked, double-dummy trial that enrolled 588 people with type 2 diabetes, estimated mean HbA1c change from baseline to week 26 was noninferior with insulin icodec (−1.6 percentage points) compared with insulin degludec (−1.4 percentage points), with confirmed statistical superiority (estimated treatment difference, −0.2 percentage points).
Meaning
The results demonstrate the efficacy of once-weekly insulin icodec treatment in people with insulin-naive type 2 diabetes.
Abstract
Importance
Once-weekly insulin icodec could provide a simpler dosing alternative to daily basal insulin in people with type 2 diabetes.
Objective
To evaluate the efficacy and safety of once-weekly icodec vs once-daily insulin degludec in people with insulin-naive type 2 diabetes.
Design, Setting, and Participants
Randomized, double-masked, noninferiority, treat-to-target, phase 3a trial conducted from March 2021 to June 2022 at 92 sites in 11 countries in adults with type 2 diabetes treated with any noninsulin glucose-lowering agents with hemoglobin A1c (HbA1c) of 7%-11% (53-97 mmol/mol).
Interventions
Participants were randomly assigned in a 1:1 ratio to receive either once-weekly icodec and once-daily placebo (icodec group; n = 294) or once-daily degludec and once-weekly placebo (degludec group; n = 294).
Main Outcomes and Measures
The primary end point was change in HbA1c from baseline to week 26 (noninferiority margin, 0.3% percentage points). Secondary end points included change in fasting plasma glucose from baseline to week 26, mean weekly insulin dose during the last 2 weeks of treatment, body weight change from baseline to week 26, and number of level 2 (clinically significant; glucose level <54 mg/dL) and level 3 (severe; requiring external assistance for recovery) hypoglycemic episodes.
Results
Among 588 randomized participants (mean [SD] age, 58 [10] years; 219 [37%] women), 564 (96%) completed the trial. Mean HbA1c level decreased from 8.6% (observed) to 7.0% (estimated) at 26 weeks in the icodec group and from 8.5% (observed) to 7.2% (estimated) in the degludec group (estimated treatment difference [ETD], −0.2 [95% CI, −0.3 to −0.1] percentage points), confirming noninferiority (P < .001) and superiority (P = .002). There were no significant differences between the icodec and degludec groups for fasting plasma glucose change from baseline to week 26 (ETD, 0 [95% CI, −6 to 5] mg/dL; P = .90), mean weekly insulin dose during the last 2 weeks of treatment, or body weight change from baseline to week 26 (2.8 kg vs 2.3 kg; ETD, 0.46 [95% CI, −0.19 to 1.10] kg; P = .17). Combined level 2 or 3 hypoglycemia rates were numerically higher in the icodec group than the degludec group from week 0 to 31 (0.31 vs 0.15 events per patient-year exposure; P = .11) and statistically higher in the icodec group from week 0 to 26 (0.35 vs 0.12 events per patient-year exposure; P = .01).
Conclusions and Relevance
Among people with insulin-naive type 2 diabetes, once-weekly icodec demonstrated superior HbA1c reduction to once-daily degludec after 26 weeks of treatment, with no difference in weight change and a higher rate of combined level 2 or 3 hypoglycemic events in the context of less than 1 event per patient-year exposure in both groups.
Trial Registration
ClinicalTrials.gov Identifier: NCT04795531
This randomized clinical trial examines the efficacy and safety of once-weekly icodec vs once-daily insulin degludec in people with insulin-naive type 2 diabetes.
Introduction
As type 2 diabetes progresses, insulin therapy may help to optimize glycemic control.1,2 Basal insulin initiation is recommended when noninsulin glucose-lowering agents are insufficient for glycemic control.1,2
Insulin icodec is a once-weekly basal insulin that may improve treatment acceptance and adherence by reducing the number of basal insulin injections from at least 365 per year to 52 per year.3 Clinical trials have demonstrated that icodec has a long half-life of approximately 1 week, with phase 2 trials in people with type 2 diabetes demonstrating similar glycemic efficacy and safety profiles for icodec and once-daily insulin glargine U100.3,4,5,6 ONWARDS is a phase 3a clinical trial program that comprises 6 trials investigating the efficacy and safety of icodec in various clinical scenarios.7 In the ONWARDS 4 and ONWARDS 2 trials, among participants with insulin-treated type 2 diabetes, hemoglobin A1c (HbA1c) reductions were similar or better with icodec than once-daily insulin glargine U100 or insulin degludec, with no statistically significant differences in level 2 or 3 hypoglycemia rates.8,9
This study reports the results of the ONWARDS 3 trial, which assessed the efficacy and safety of once-weekly icodec vs once-daily degludec in people with insulin-naive type 2 diabetes.
Methods
Study Design and Participants
A detailed description of the ONWARDS program has been published previously.7 ONWARDS 3 was a randomized, double-masked, double-dummy, active-controlled, treat-to-target, phase 3a trial conducted between March 24, 2021, and June 23, 2022, across 92 sites in Argentina, Austria, Brazil, Canada, China, the Czech Republic, Denmark, France, Mexico, Taiwan, and the US. The trial comprised a 2-week screening period, a 26-week treatment period, and a 5-week follow-up period (eFigure 1 in Supplement 1).
Eligible participants were adults with type 2 diabetes who were insulin-naive, treated with any noninsulin glucose-lowering agents, and had HbA1c of 7.0% to 11.0% (53-97 mmol/mol); full inclusion and exclusion criteria are provided in eTable 1 in Supplement 1. The redacted protocol and statistical analysis plan are provided in Supplements 2 and 3. Data on race and ethnicity were collected based on self-reporting by participants using closed categories, with an option to specify “other” as free text; selection of multiple categories was not permitted.
Throughout, to convert glucose from mg/dL to mmol/L, multiply values by 0.0555. To convert HbA1c to mmol/mol, use the equation (10.93 × HbA1c) − 23.50.
Study Treatment
Participants were randomized in a 1:1 ratio using an interactive web-response system to receive either once-weekly icodec and once-daily placebo (icodec group) or once-daily degludec and once-weekly placebo (degludec group), with stratification by region (Asia, North America, South America, Europe) and use of sulfonylureas or glinides (yes, no) (Figure 1). Trial treatments were administered by subcutaneous injections via a pen device (PDS 290), with starting dosages of 70 U per week (icodec, 700 U/mL) or 10 U per day (degludec, 100 U/mL) (eFigure 1 in Supplement 1). Dosages were adjusted weekly using the mean of 3 daily prebreakfast self-measured blood glucose (SMBG) values, measured on the 2 days before and on the day of titration using a blood glucose meter that was factory-calibrated to display plasma-equivalent glucose values. The mean prebreakfast SMBG target range was 80 to 130 mg/dL. Basal insulin dosages were increased by 20 U per week (icodec) or 3 U per day (degludec) if the mean SMBG value was above the target or decreased by the same amounts if the lowest SMBG value was under 80 mg/dL (eTable 2 in Supplement 1). Participants were instructed to measure their prebreakfast SMBG daily from week 0 to the end of the trial and any time they experienced symptoms suggestive of hypoglycemia. Unlimited glucose strips were provided to all participants and they were encouraged to take additional SMBG measurements at any time.
Figure 1. Flow of Participants in a Trial of Once-Weekly Insulin Icodec vs Once-Daily Insulin Degludec for Type 2 Diabetes.

There were no study- or country-level important protocol deviations during the trial. There were 26 important site-level protocol deviations, 68 at the participant level in the icodec group, 70 in the degludec group (164 in total.)
aParticipants could not meet more than 1 inclusion criterion and/or meet more than 1 exclusion criterion.
bAdditional reasons for screening failure in less than 5 participants: 2 met exclusion criteria for estimated glomerular filtration rate (eGFR) <30 mL/min/1.73 m2 at screening, 2 met exclusion criteria for anticipated change in lifestyle affecting glucose control, 1 met exclusion criteria of treatment for obesity or diabetes with any drug not listed in the inclusion criteria within 90 days of screening, and 1 met exclusion criterion of anticipated change in concomitant medication known to affect weight or glucose metabolism.
cDefined as alanine transaminase ≥2.5 times the upper normal limit or bilirubin >1.5 times the upper normal limit.
dTwo participants withdrew based on investigator decision and 2 were lost to follow-up.
eRandomization was stratified according to region (Asia, North America, South America, Europe) and treatment with sulfonylureas or glinides (yes, no).
fOther reasons for discontinuation in the icodec group were participant unable to attend hospital/other appointments (n = 2), reluctance of the participant’s family because the product is not on the market (n = 1), and personal problems (n = 1). Other reasons for discontinuation in the degludec group were voluntary (n = 2), investigator decision (n = 1), and lack of adherence (n = 1).
Sulfonylureas and glinides, if used, were reduced by 50% at randomization at the investigator’s discretion. All other baseline noninsulin glucose-lowering agents were continued at the same dose throughout the trial unless safety concerns dictated otherwise.
Outcomes
The primary end point was change in HbA1c from baseline (week 0) to week 26. The estimand was the difference between icodec and degludec for this end point including all randomized participants, irrespective of trial treatment adherence or changes to noninsulin glucose-lowering background medication. Intercurrent events (>2 weeks of bolus insulin initiation, trial treatment discontinuation, or trial withdrawal) were handled by the treatment policy strategy; measurements after intercurrent events were included in the analysis. The secondary efficacy end point was change in laboratory-assessed fasting plasma glucose (FPG) from baseline to week 26.
Secondary safety end points included mean total weekly insulin dose during the last 2 weeks of treatment; change in body weight from baseline to week 26; and the number of level 2 (clinically significant; glucose level <54 mg/dL, confirmed by blood glucose meter), level 3 (severe; hypoglycemia associated with severe cognitive impairment requiring external assistance for recovery), and combined level 2 or 3 hypoglycemic episodes from baseline to week 31 (to cover the period of exposure to study treatment) and from baseline to week 26 (end of treatment period) (eFigure 1 in Supplement).
Additional prespecified assessments included the number of nocturnal level 2 or 3 hypoglycemic episodes from baseline to week 26 and to week 31, achievement of HbA1c targets (<7.0% and ≤6.5%) after 26 weeks with or without level 2 or 3 hypoglycemia in the preceding 12 weeks, and the number of adverse events (AEs) throughout the trial until week 31. Safety focus areas were medication errors, including misuse and abuse, hypersensitivity, and injection site reactions. Events adjudicated by an independent committee included acute coronary syndrome events, cerebrovascular events, heart failure, and death.
Trial Oversight
The trial was conducted in compliance with the principles of the Declaration of Helsinki and in accordance with International Conference for Harmonization Good Clinical Practice guidelines. Relevant documents, including the protocol and consent forms, were approved by institutional review boards or independent ethics committees. All participants provided written informed consent before trial entry and could withdraw their consent at any time; randomized treatment could be discontinued at the investigator’s discretion.
Statistical Analysis
Description of the statistical analyses has been published previously.7 Efficacy end points were analyzed using the full analysis set (all participants randomized) and the in-trial period. Safety end points were evaluated using the safety analysis set (all randomized participants who received ≥1 dose of trial treatment) and the treatment period, the time during which participants were exposed to treatment. Hypoglycemic episodes were analyzed for both periods. Time period definitions are provided in eTable 3 in Supplement 1.
Multiple imputation was conducted for several end points; analysis estimates from each imputed data set (n = 1000) were combined using Rubin rules (eTable 4 in Supplement). Statistical analyses used SAS version 9.4 (SAS Institute), with 2-sided hypothesis tests using a 5% significance level.
The primary hypothesis was that icodec was noninferior to degludec in the primary end point, HbA1c change from baseline to week 26. Sample size calculations identified that randomizing 580 participants would provide 90% power for declaring noninferiority with a noninferiority margin of 0.3 percentage points. Hierarchical testing (ie, an ordered testing procedure) was used to control the overall type I error at 5% (2-sided); if noninferiority was demonstrated, superiority of icodec to degludec was also tested. For the primary end point, 2-dimensional tipping point sensitivity analyses were performed evaluating the robustness of the assumptions about missing data (details are provided in eFigure 2 in Supplement 1).
Continuous end points, including the primary end point, were analyzed using a standard analysis of covariance with treatment group, region, and use of sulfonylureas or glinides (yes, no) as fixed effects and the baseline value as a covariate. Mean insulin dose was log transformed. A sensitivity analysis of the primary end point consisted of a 2-dimensional tipping point analysis for the imputed HbA1c measurements.
Categorical end points relating to hypoglycemic episode counts were analyzed using a negative binomial model with log-link function including the same fixed factors as the primary end point analysis. Owing to convergence issues, region was not included in the week 0 to week 26 analysis.
Binary assessments relating to achievement of HbA1c targets (<7.0% [<53 mmol/mol] or ≤6.5% [≤48 mmol/mol]) after 26 weeks with or without level 2 or 3 hypoglycemia were examined using logistic regression models (logit link), with baseline HbA1c as a covariate and the same fixed factors as the primary end point analysis. Other safety assessments, including AEs, were reported descriptively.
Results
Participants
Of 737 screened participants, 588 (294 in the icodec group and 294 in the degludec group) were randomized (Figure 1). All randomized participants received at least 1 dose of study treatment, except 1 participant in the icodec group. Of those exposed to treatment, 12 participants in the icodec group and 11 in the degludec group permanently discontinued treatment; 96% of participants in each group completed the week 26 visit while receiving their assigned treatment. Demographic and baseline characteristics were comparable between treatment groups, although a higher percentage of participants in the icodec than in the degludec group were receiving sodium-glucose cotransporter 2 inhibitor or glucagon-like peptide 1 receptor agonist medications (Table 1). The most common concomitant medications were metformin, sulfonylureas, and sodium-glucose cotransporter 2 inhibitors. Nine participants (3.1%) in each group had missing data with a premature discontinuation and 2 participants (0.7%) who completed treatment in the icodec group had missing data.
Table 1. Participant Demographics and Baseline Characteristics.
| Characteristic | No. (%) | |
|---|---|---|
| Once-weekly insulin icodec (n = 294) | Once-daily insulin degludec (n = 294) | |
| Men | 185 (62.9) | 184 (62.6) |
| Women | 109 (37.1) | 110 (37.4) |
| Age, mean (SD), ya | 58 (10) | 59 (10) |
| Diabetes duration, median (IQR), y | 10.5 (5.8-14.7) | 10.7 (6.3-16.1) |
| Raceb | ||
| American Indian or Alaska Native | 0 | 1 (0.9) |
| Asian | 80 (27.2) | 85 (28.9) |
| Black or African American | 9 (3.1) | 6 (2.0) |
| White | 179 (60.9) | 175 (59.5) |
| Otherc | 11 (3.7) | 11 (3.7) |
| Not reportedd | 15 (5.1) | 16 (5.4) |
| Ethnicity | ||
| Hispanic or Latino | 76 (25.9) | 88 (29.9) |
| Not Hispanic or Latino | 203 (69.0) | 190 (64.6) |
| Not reportedd | 15 (5.1) | 16 (5.4) |
| Body weight, mean (SD), kga | 85.8 (20.1) | 83.2 (18.2) |
| Body mass index, mean (SD)a | 29.9 (5.2) | 29.2 (5.1) |
| HbA1c, mean (SD), %a | 8.55 (1.11) | 8.48 (1.01) |
| HbA1c, % | ||
| <7 | 1 (0.34) | 9 (3.1) |
| ≥7 and <8 | 110 (37.4) | 97 (33.0) |
| ≥8 and <9 | 85 (28.9) | 105 (35.7) |
| ≥9 | 98 (33.3) | 83 (28.2) |
| Fasting plasma glucose, mean (SD), mg/dLa | 187 (54) | 176 (46) |
| Concomitant noninsulin glucose-lowering agent use at baseline | ||
| Metformin | 266 (90.5) | 264 (89.8) |
| Sulfonylureas | 132 (44.9) | 128 (43.5) |
| Sodium-glucose cotransporter 2 inhibitor | 119 (40.5) | 95 (32.3) |
| Dipeptidyl peptidase 4 inhibitor | 76 (25.9) | 80 (27.2) |
| Glucagon-like peptide 1 receptor agonists | 64 (21.8) | 48 (16.3) |
| Thiazolidinediones | 26 (8.8) | 19 (6.5) |
| α-Glucosidase inhibitor | 18 (6.1) | 20 (6.8) |
| Glinides | 7 (2.4) | 4 (1.4) |
| No. of noninsulin glucose-lowering agents used at baseline | ||
| 1 | 69 (23.5) | 84 (28.6) |
| 2 | 130 (44.2) | 121 (41.2) |
| ≥3 | 94 (32.0) | 88 (29.9) |
| Comorbidities of interest present in ≥5% of participantse | ||
| Hypertension | 199 (67.7) | 181 (61.6) |
| Coronary artery disease | 30 (10.2) | 29 (9.9) |
| Diabetic nephropathy | 30 (10.2) | 19 (6.5) |
| Hepatic steatosis | 28 (9.5) | 45 (15.3) |
| Peripheral venous disease | 15 (5.1) | 14 (4.8) |
| Stratification factors | ||
| Sulfonylurea or glinide use | ||
| Yes | 131 (44.6) | 128 (43.5) |
| No | 163 (55.4) | 166 (56.5) |
| Region | ||
| Asia | 72 (24.5) | 73 (24.8) |
| Europe | 71 (24.1) | 71 (24.1) |
| North America | 75 (25.5) | 74 (25.2) |
| South America | 76 (25.9) | 76 (25.9) |
SI conversion factor: To convert hemoglobin A1c (HbA1c) to mmol/mol, multiply by 10.93 and subtract 23.50; glucose to mmol/L, multiply by 0.0555.
Arithmetic mean (SD).
Data for race and ethnicity were collected based on self-reporting by participants using closed categories, with an option to specify “other” category using free text. Multiple selection of categories was not permitted.
Race reported in “other” free-text response were brown (n = 1), half blood (n = 8), West Indian (n = 1), and Western Indian (n = 1) for icodec and brown (n = 1) and half blood (n = 10) for degludec.
Collection of data on ethnicity and race was not permitted for participants from France.
Data on comorbidities were collected based on the response to the question “Has the participant had any relevant conditions/illnesses in the past or currently has any conditions/illnesses?” If yes, then a selection was made from several predefined options (eg, diabetes, kidney disease, cardiovascular disorders) or provided as a free-text response in an “other” field and further details, including date of onset and whether it was ongoing at screening (with a stop date if no longer ongoing), were to be provided.
Primary Outcome
Mean HbA1c level decreased from 8.6% (observed) to 7.0% (estimated) at 26 weeks in the icodec group (estimated change, −1.6 percentage points) and from 8.5% (observed) to 7.2% (estimated) in the degludec group (estimated change, −1.4 percentage points) (estimated treatment difference [ETD], −0.2 [95% CI, −0.3% to −0.1%] percentage points) (Table 2, Figure 2A, and Supplement 1). Based on achievement of noninferiority (P < .001), superiority was tested and confirmed (P = .002). Sensitivity analyses supported these findings (eFigure 2 in Supplement 1). Observed HbA1c level by treatment week is provided in eTable 5 in Supplement 1.
Table 2. Summary of Key Efficacy and Safety End Points.
| Outcome | Once-weekly icodec (n = 294) | Once-daily degludec (n = 294) | Estimated treatment difference in icodec vs degludec (95% CI) | P valuea | ||||
|---|---|---|---|---|---|---|---|---|
| Baseline | Week 26 | Change from baseline to week 26 | Baseline | Week 26 | Change from baseline to week 26 | |||
| Primary end point | ||||||||
| HbA1c, % | 8.6 | 7.0 | −1.6 percentage points | 8.5 | 7.2 | −1.4 percentage points | −0.2 (−0.3 to −0.1) percentage points | <.001b; .002c |
| Key secondary end points | ||||||||
| Fasting plasma glucose, mg/dL | 187 | 127 | −54 | 176 | 127 | −54 | 0 (−6 to 5) | .90 |
| Mean insulin dose from week 24 to 26, U/week | 69 | 204 | 70 | 186 | Estimated treatment ratio, 1.10 (0.98 to 1.22) | .09 | ||
| Mean body weight, kg | 85.8 | 87.3 | 2.8 | 83.2 | 86.8 | 2.3 | 0.46 (−0.19 to 1.10) | .17 |
Abbreviation: HbA1c, hemoglobin A1c.
SI conversion factors: To convert HbA1c to mmol/mol, multiply by 10.93 and subtract 23.50; glucose to mmol/L, multiply by 0.0555.
aAnalyzed using ANCOVA (analysis of covariance; continuous end points) logistic regression (binary end points with treatment region [Asia, North America, South America, Europe] and baseline use of sulfonylureas or glinides as fixed effects and the baseline value of the response as a covariate).
P value for noninferiority test of icodec compared with degludec (noninferiority confirmed [margin of 0.3 percentage points]).
P value for superiority test of icodec compared with degludec (superiority confirmed).
Figure 2. Key Efficacy and Safety Outcomes.
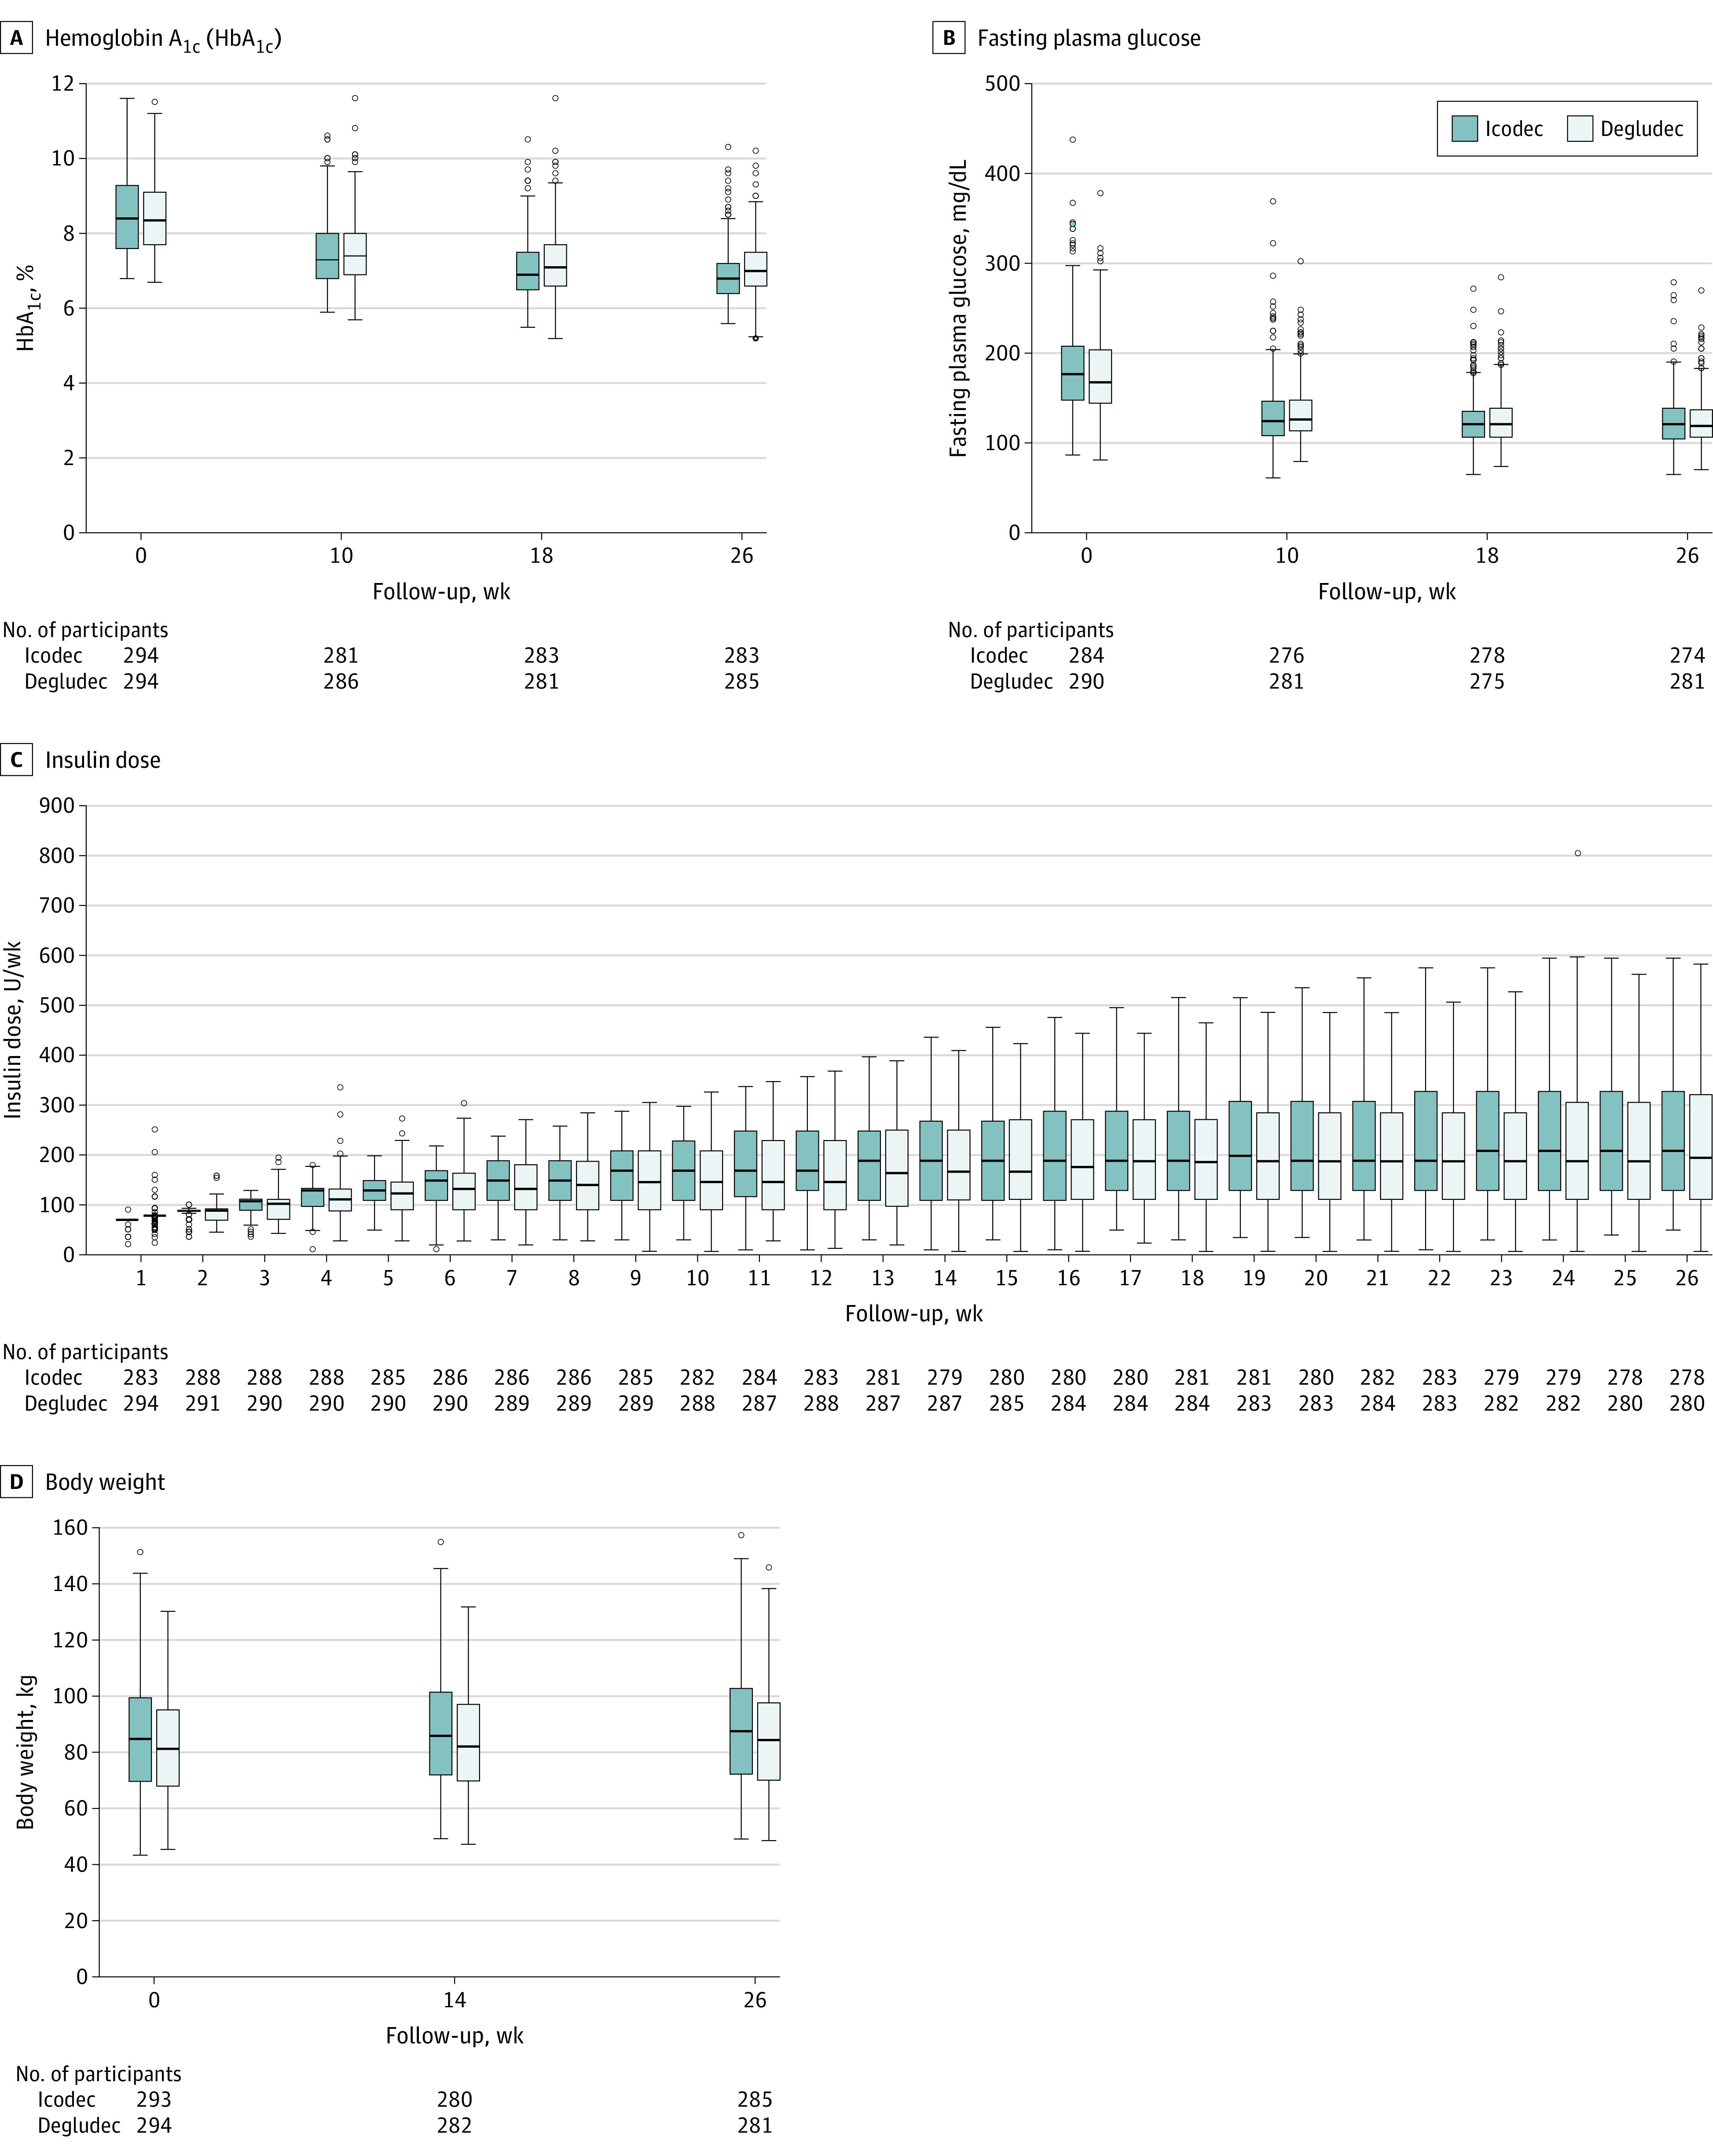
A, Observed median HbA1c from baseline over time among the full analysis set. B, Observed median fasting plasma glucose over time among the full analysis set. C, Observed median total weekly insulin dose over time among the safety analysis set, in which values are back-transformed from log-scale. D, Change in observed median body weight over time among the safety analysis set. Boxes indicate median and 1st and 3rd quartiles. Whiskers indicate minimum and maximum values within range (Q1 − 1.5 × IQR and Q3 + 1.5 × IQR). Open circles indicate outside values.
Secondary Outcomes
The estimated change in mean fasting plasma glucose from baseline to week 26 was −54 mg/dL in both treatment groups, with no statistically significant difference between treatment groups (ETD, 0 [95% CI, −6 to 5] mg/dL; P = .90) (Table 2, Figure 2B, and eFigure 4 in Supplement 1). Estimated mean weekly total insulin dosage during the last 2 weeks of treatment was 204 U per week (29 U/d) with icodec compared with 187 U per week (27 U/d) with degludec, with no statistically significant difference between treatments (estimated treatment ratio, 1.10 [95% CI, 0.98-1.22]; P = .09) (Table 2, Figure 2C, and eFigure 5 in Supplement 1). When adjusted for body weight, the mean weekly insulin dose was 2.4 U/kg with icodec and 2.2 U/kg with degludec. The difference in estimated mean body weight change from baseline to week 26 was not statistically significant when comparing icodec with degludec (2.8 kg vs 2.3 kg; ETD, 0.46 [95% CI, −0.19 to 1.10] kg; P = .17; Table 2 and Figure 2D).
Hypoglycemia data are presented in Table 3. From baseline to week 31, there were 53 episodes of level 2 hypoglycemia in 26 participants (8.9%) in the icodec group and 23 in 17 participants (5.8%) in the degludec group; there were no level 3 hypoglycemic episodes in the icodec group and 2 level 3 episodes in 2 participants in the degludec group. There were no statistically significant differences in combined level 2 or 3 hypoglycemia rates between treatments for this period, with 0.31 observed events per patient-year exposure with icodec and 0.15 observed events per patient-year exposure with degludec (estimated rate ratio, 1.82 [95% CI, 0.87-3.80]; P = .11). From baseline to week 26, there were 50 episodes of level 2 hypoglycemia in 24 participants (8.2%) in the icodec group and 17 in 13 participants (4.4%) in the degludec group, and no level 3 hypoglycemic episodes in either group. There was a statistically significant difference in combined level 2 or 3 hypoglycemia rate between treatments from baseline to week 26, with 0.35 observed events per patient-year exposure with icodec and 0.12 observed events per patient-year exposure with degludec (estimated rate ratio, 3.12 [95% CI, 1.30-7.51]; P = .01).
Table 3. Hypoglycemia and Other Adverse Events in the Safety Analysis Set.
| Once-weekly insulin icodec (n = 293) | Once-daily insulin degludec (n = 294) | Estimated rate ratio (95% CI) | P value | |||||
|---|---|---|---|---|---|---|---|---|
| Participants, No. (%) | Events | Participants, No. (%) | Events | |||||
| No. | Rate per patient-year of exposure | No. | Rate per patient-year of exposure | |||||
| Key secondary safety end points | ||||||||
| Level 2 hypoglycemic episodesa | ||||||||
| Baseline to week 31b | 26 (8.9) | 53 | 0.31 | 17 (5.8) | 23 | 0.13 | 2.09 (0.99-4.41) | .05 |
| Baseline to week 26c | 24 (8.2) | 50 | 0.35 | 13 (4.4) | 17 | 0.12 | 3.12 (1.30-7.51) | .01 |
| Level 3 hypoglycemic episodesa | ||||||||
| Baseline to week 31b | 0 | 0 | 2 (0.7) | 2 | 0.01 | |||
| Baseline to week 26c | 0 | 0 | 0 | 0 | ||||
| Level 2 or level 3 hypoglycemic episodes | ||||||||
| Baseline to week 31b | 26 (8.9) | 53 | 0.31 | 18 (6.1) | 25 | 0.15 | 1.82 (0.87-3.80) | .11 |
| Baseline to week 26c | 24 (8.2) | 50 | 0.35 | 13 (4.4) | 17 | 0.12 | 3.12 (1.30-7.51) | .01 |
| Additional safety assessments | ||||||||
| Level 1 hypoglycemic episodesa | ||||||||
| Baseline to week 31b | 91 (31.1) | 400 | 2.34 | 65 (22.1) | 185 | 1.08 | ||
| Baseline to week 26c | 84 (28.7) | 359 | 2.50 | 59 (20.1) | 159 | 1.10 | ||
| Adverse events (baseline to week 31) | 177 (60.4) | 511 | 2.99 | 167 (56.8) | 424 | 2.48 | ||
| Probably/possibly related to basal insulind | 27 (9.2) | 60 | 35.11 | 32 (10.9) | 46 | 26.88 | ||
| Severitye | ||||||||
| Mild | 159 (53.3) | 411 | 2.40 | 146 (49.7) | 351 | 2.05 | ||
| Moderate | 60 (20.5) | 86 | 0.50 | 48 (16.3) | 69 | 0.40 | ||
| Severe | 13 (4.4) | 14 | 0.08 | 4 (1.4) | 4 | 0.02 | ||
| Serious adverse eventsf,g | 15 (5.1) | 22 | 0.13 | 15 (5.1) | 18 | 0.11 | ||
| Related to basal insulin (probable/possible)d | 0 | 0 | 0 | 0 | ||||
| Injection site reactionsh | 25 (8.5) | 62 | 0.36 | 13 (4.4) | 22 | 0.13 | ||
| Seriousf | 0 | 0 | 0 | 0 | ||||
| Probably/possibly related to basal insulind | 14 (4.8) | 35 | 0.20 | 11 (3.7) | 19 | 0.11 | ||
| Probably/possibly related to placebod | 14 (4.8) | 21 | 0.12 | 3 (1.0) | 4 | 0.02 | ||
| Hypersensitivityi | 7 (2.4) | 7 | 0.04 | 13 (4.4) | 15 | 0.09 | ||
| Seriousf | 0 | 0 | 0 | 0 | ||||
| Probably/possibly related to basal insulind | 0 | 0 | 1 (0.3) | 1 | 0.01 | |||
| Medication errors, including misuse and abuse | 3 (1.0) | 3 | 0.02 | 11 (3.7) | 12 | 0.07 | ||
| Seriousf | 0 | 0 | 1 (0.3) | 1 | 0.01 | |||
| Probably/possibly related to basal insulind | 1 (0.3) | 1 | 0.01 | 2 (0.7) | 2 | 0.01 | ||
Abbreviations: PYE, patient-years of exposure (1 PYE = 365.25 days).
Level 1 hypoglycemia (alert level): plasma glucose <70 mg/dL (<3.9 mmol/L) and ≥54 mg/dL (≥3.0 mmol/L) confirmed by blood glucose meter. Level 2 (clinically significant): plasma glucose <54 mg/dL (<3.0 mmol/L) confirmed by blood glucose meter. Level 3 (severe): hypoglycemia with severe cognitive impairment requiring external assistance for recovery.
PYE: 170.90 in the icodec group and 171.13 in the degludec group.
PYE: 143.83 in the icodec group and 144.76 in the degludec group.
Relationship between treatment and event assessed by the investigator based on clinical judgement and categorized as probable, indicating a good reason and sufficient documentation to assume a causal relationship; possible, a causal relationship is conceivable and cannot be dismissed; or unlikely, most likely related to etiology other than the study treatment.
Mild adverse event is easily tolerated and provides only mild discomfort; moderate, causes sufficient discomfort and interferes with everyday activities; and severe, prevents normal everyday activities.
Must meet 1 of the accepted criteria used to define a serious adverse event (ie, life threatening, requires inpatient hospitalization or prolongation of hospitalization, results in persistent or significant disability/incapacity, is a congenital abnormality/birth defect, or can be classed as an important medical event). Suspicion of infectious agent transmission via the study treatment or risk of liver injury also included.
During the treatment period, 1 participant in the degludec group had a severe hypoglycemic event that was classified as a serious adverse event. The event was mild and the outcome was recorded as recovered or resolved.
Injection site reaction: skin problems, including signs at the injection site such as bruising, bleeding, pain and discomfort, redness, or swelling.
Hypersensitivity: local skin problems at the injection site or allergic reactions; signs of mild allergic reaction include rash, redness, hives, or itching; signs of serious allergic reaction, swelling of the throat, tongue, or face; trouble breathing; wheezing; fast heartbeat; pale and cold skin; and dizzy or weak.
Additional Analyses
Mean fasting SMBG, used for insulin dose titration but not measured as a trial end point, is shown in eFigure 6 in Supplement 1.
From baseline to week 31, the number of level 2 or 3 nocturnal hypoglycemia events were 2 events with icodec and 5 events with degludec. From baseline to week 26, the number of level 1 hypoglycemic events was 359 in 84 participants (28.7%) in the icodec group and 159 events in 59 participants (20.1%) in the degludec group. The percentage of participants estimated to have achieved HbA1c levels less than 7.0% after 26 weeks was 56.8% in the icodec group and 41.6% in the degludec group, and the percentage of participants achieving HbA1c less than 7% without level 2 or 3 hypoglycemia during the prior 12 weeks was 52.1% in the icodec group and 39.9% in the degludec group. The percentage of participants estimated to have achieved HbA1c levels less than or equal to 6.5% after 26 weeks was 31.0% in the icodec group and 19.6% in the degludec group, and the percentage of participants achieving HbA1c less than or equal to 6.5% without level 2 or 3 hypoglycemia during the prior 12 weeks was 28.3% in the icodec group and 18.7% in the degludec group (eFigure 7 in Supplement 1).
AEs
AEs were experienced by 177 participants (60.4%) receiving icodec and 167 participants (56.8%) receiving degludec (Table 3 and eTable 6 in Supplement 1). Events were mostly mild or moderate; 60 events in the icodec group and 46 in the degludec group were judged to be possibly related to basal insulin. Fifteen participants (5.1%) in each group experienced serious AEs. The most frequently reported AEs were COVID-19 (8.5% in the icodec group and 4.8% in the degludec group), influenza (5.5% in the icodec group and 3.1% in the degludec group), and diabetic retinopathy (5.1% in the icodec group and 2.0% in the degludec group). AEs relating to diabetic retinopathy or maculopathy were reported in 6.5% of participants in the icodec group and 4.1% in the degludec group (eTable 7 in Supplement 1).
Injection site reactions were experienced by 8.5% of participants receiving icodec (62 events) and 4.4% of participants receiving degludec (22 events) (Table 3). Two events in the icodec group were moderate and the rest were mild. Incidence of hypersensitivity events or medication errors (including misuse and abuse) were less than 5% in each treatment group. One event, a medication error, in the degludec group was deemed to be serious.
There were 3 confirmed adjudicated events in 3 participants in the icodec group (2 deaths and 1 ischemic stroke) and there were 2 events in 1 participant in the degludec group (1 acute myocardial infarction and 1 death). No deaths were considered to be related to trial treatment. Adjudicated causes of death were malignancy (1 participant) and undetermined death (1 participant) in the icodec group and acute myocardial infarction in the degludec group.
Discussion
In this randomized controlled trial, once-weekly icodec was demonstrated to be both noninferior and superior to once-daily degludec in HbA1c reduction in people with type 2 diabetes who had not previously used insulin therapy, although the difference in HbA1c reduction of 0.2 percentage points after 26 weeks of treatment may have marginal clinical significance. Episodes of hypoglycemia were numerically higher with icodec than degludec in the context of overall low rates in both treatment groups, with no difference in weight change. When considering treatment with icodec insulin in clinical practice, the small added glycemic benefit and convenience of the once-weekly administration should be weighed against the small absolute risk of hypoglycemia.
The observed glucose-lowering efficacy of icodec and the statistical superiority in HbA1c reduction of icodec to degludec aligns with phase 2 trial results for icodec.4,5,6 Of note, the current trial extended the findings from the double-masked, double-dummy, phase 2 trial in several ways. First, the comparator insulin in the current trial was degludec, which has a lower risk of hypoglycemia than insulin glargine U100, the phase 2 trial comparator.10,11 Second, the population studied was expanded from people using metformin, with or without dipeptidyl peptidase 4 inhibitors, to a broader population of people eligible for basal insulin initiation, including those receiving a wider range of noninsulin glucose-lowering agents.10 Third, the target glucose level used for insulin titration was aligned with current recommendations from the American Diabetes Association for preprandial targets (80-130 mg/dL), compared with the more stringent titration target of 70 to 108 mg/dL in the phase 2 trial.10
This trial demonstrated statistical superiority of icodec to degludec in HbA1c reduction from baseline to week 26. In contrast to the HbA1c reduction findings, fasting plasma glucose change at week 26 was similar in both treatment groups. Of note, prebreakfast SMBG values were similar between treatment groups, leading to comparable dose titration and total weekly insulin dose during the last 2 weeks of treatment. Further evaluation of continuous glucose monitoring data from other ONWARDS trials may clarify these findings.7
In similar treat-to-target trials of current basal insulins in people with type 2 diabetes who were insulin-naive, level 2 or 3 hypoglycemia rates were higher (0.4-6.2 events per patient-year exposure) than those observed in this trial, although the different designs of these trials should be considered.4,5,6,11,12,13,14,15 The difference in hypoglycemia is in line with the greater HbA1c reduction observed in the icodec group compared with the degludec group. Previous evidence suggests that once-weekly insulin dosing regimens are viewed positively by people with type 2 diabetes16; a study of injectable glucagon-like peptide 1 receptor agonists demonstrated that once-weekly treatments for type 2 diabetes may improve treatment adherence and persistence compared with once-daily treatments.17 As such, icodec treatment may reduce delays in insulin initiation and may improve treatment adherence and convenience, given that it would reduce basal insulin injections from at least 365 per year to only 52 per year. Another once-weekly insulin, efsitora alfa, is also in clinical development18,19,20; phase 3 studies are currently ongoing.
Icodec has a similar safety profile to degludec, a basal insulin that has a low hypoglycemia risk and is approved for use in type 2 diabetes.21,22 Observed body weight changes were modest in both groups and aligned with expected increases for participants who are insulin-naive and initiate basal insulin.23 The number of injection site reactions was numerically higher with icodec than degludec. Concern over injection site reactions has not been raised in other icodec trials to date, and this finding remains unexplained.3,4,5,6,8,9 Additionally, although the occurrence of diabetic retinopathy was higher with icodec than degludec, the absolute numerical difference was small. No difference in retinopathy events between groups has been observed in other icodec trials to date. Strengths of this study included the double-masked, double-dummy design in people with type 2 diabetes who were insulin-naive and required treatment intensification with degludec as a comparator. Sulfonylureas and glinides were continued, although reduced by 50% to reflect potential real-world icodec use. The target sample size was achieved, and trial completion rate was high, ensuring that the trial was well-powered to assess its primary end point. Finally, randomization was stratified by sulfonylurea or glinide use at baseline, and analyses were adjusted for use of these treatments.
Limitations
This trial has several limitations. First, the study had a 26-week duration and sustained effects were not studied. Second, there was the potential for selection bias owing to the number of injections; however, compared with regimens for daily basal insulin, the regimen in this trial only required 1 extra injection per week (ie, 7 once-daily and 1 once-weekly injections compared with 7 once-daily injections). Third, this trial did not collect continuous glucose monitoring data or data on patient-reported outcomes. Fourth, to allow comparison between the treatment groups, both insulins were titrated weekly; consequently, the dose adjustment frequency was not tailored to the dosing frequency of each treatment type. Fifth, the trial was powered to assess the primary outcome; therefore, any lack of statistically significant differences between groups for secondary outcomes, including hypoglycemia, do not necessarily reflect a lack of clinical effect.
Conclusions
Among people with insulin-naive type 2 diabetes, once-weekly icodec demonstrated superior HbA1c reduction to once-daily degludec after 26 weeks of treatment, with no difference in weight change and a higher rate of combined level 2 (clinically significant) or level 3 (severe) hypoglycemic events in the context of less than 1 event per patient-year exposure in both groups.
eTables and eFigures
Trial protocol
Statistical analysis plan
Data sharing statement
References
- 1.Davies MJ, Aroda VR, Collins BS, et al. Management of hyperglycemia in type 2 diabetes, 2022: a consensus report by the American Diabetes Association (ADA) and the European Association for the Study of Diabetes (EASD). Diabetes Care. 2022;45(11):2753-2786. doi: 10.2337/dci22-0034 [DOI] [PMC free article] [PubMed] [Google Scholar]
- 2.ElSayed NA, Aleppo G, Aroda VR, et al. ; on behalf of the American Diabetes Association . 9. Pharmacologic approaches to glycemic treatment: standards of care in diabetes—2023. Diabetes Care. 2023;46(suppl 1):S140-S157. doi: 10.2337/dc23-S009 [DOI] [PMC free article] [PubMed] [Google Scholar]
- 3.Nishimura E, Pridal L, Glendorf T, et al. Molecular and pharmacological characterization of insulin icodec: a new basal insulin analog designed for once-weekly dosing. BMJ Open Diabetes Res Care. 2021;9(1):e002301. doi: 10.1136/bmjdrc-2021-002301 [DOI] [PMC free article] [PubMed] [Google Scholar]
- 4.Bajaj HS, Bergenstal RM, Christoffersen A, et al. Switching to once-weekly insulin icodec versus once-daily insulin glargine U100 in type 2 diabetes inadequately controlled on daily basal insulin: a phase 2 randomized controlled trial. Diabetes Care. 2021;44(7):1586-1594. doi: 10.2337/dc20-2877 [DOI] [PMC free article] [PubMed] [Google Scholar]
- 5.Lingvay I, Buse JB, Franek E, et al. A randomized, open-label comparison of once-weekly insulin icodec titration strategies versus once-daily insulin glargine U100. Diabetes Care. 2021;44(7):1595-1603. doi: 10.2337/dc20-2878 [DOI] [PMC free article] [PubMed] [Google Scholar]
- 6.Rosenstock J, Bajaj HS, Janež A, et al. ; NN1436-4383 Investigators . Once-weekly insulin for type 2 diabetes without previous insulin treatment. N Engl J Med. 2020;383(22):2107-2116. doi: 10.1056/NEJMoa2022474 [DOI] [PubMed] [Google Scholar]
- 7.Philis-Tsimikas A, Bajaj HS, Begtrup K, et al. Rationale and design of the phase 3a development programme (ONWARDS 1-6 trials) investigating once-weekly insulin icodec in diabetes. Diabetes Obes Metab. 2023;25(2):331-341. doi: 10.1111/dom.14871 [DOI] [PMC free article] [PubMed] [Google Scholar]
- 8.Mathieu C, Ásbjörnsdóttir B, Bajaj HS, et al. Switching to once-weekly insulin icodec versus once-daily insulin glargine U100 in basal-bolus insulin-treated type 2 diabetes (ONWARDS 4): a phase 3, randomised, open-label, treat-to-target, non-inferiority trial. Lancet. 2023;401(10392):1929-1940. doi: 10.1016/S0140-6736(23)00520-2 [DOI] [PubMed] [Google Scholar]
- 9.Philis-Tsimikas A, Asong M, Franek E, et al. Switching to once-weekly insulin icodec versus once-daily insulin degludec in basal insulin-treated type 2 diabetes (ONWARDS 2): a phase 3, randomised, open label, treat-to-target trial. Lancet Diabetes Endocrinol. 2023;11(6):414-425. doi: 10.1016/S2213-8587(23)00093-1 [DOI] [PubMed] [Google Scholar]
- 10.Rosenstock J, Bergenstal RM, Blevins TC, et al. Better glycemic control and weight loss with the novel long-acting basal insulin LY2605541 compared with insulin glargine in type 1 diabetes: a randomized, crossover study. Diabetes Care. 2013;36(3):522-528. doi: 10.2337/dc12-0067 [DOI] [PMC free article] [PubMed] [Google Scholar]
- 11.Ratner RE, Gough SC, Mathieu C, et al. Hypoglycaemia risk with insulin degludec compared with insulin glargine in type 2 and type 1 diabetes: a pre-planned meta-analysis of phase 3 trials. Diabetes Obes Metab. 2013;15(2):175-184. doi: 10.1111/dom.12032 [DOI] [PMC free article] [PubMed] [Google Scholar]
- 12.Bolli GB, Riddle MC, Bergenstal RM, Wardecki M, Goyeau H, Home PD; EDITION 3 study investigators . Glycaemic control and hypoglycaemia with insulin glargine 300U/mL versus insulin glargine 100U/mL in insulin-naïve people with type 2 diabetes: 12-month results from the EDITION 3 trial. Diabetes Metab. 2017;43(4):351-358. doi: 10.1016/j.diabet.2017.04.007 [DOI] [PubMed] [Google Scholar]
- 13.Pan C, Gross JL, Yang W, et al. A multinational, randomized, open-label, treat-to-target trial comparing insulin degludec and insulin glargine in insulin-naive patients with type 2 diabetes mellitus. Drugs R D. 2016;16(2):239-249. doi: 10.1007/s40268-016-0134-z [DOI] [PMC free article] [PubMed] [Google Scholar]
- 14.Zinman B, Philis-Tsimikas A, Cariou B, et al. ; NN1250-3579 (BEGIN Once Long) Trial Investigators . Insulin degludec versus insulin glargine in insulin-naive patients with type 2 diabetes: a 1-year, randomized, treat-to-target trial (BEGIN Once Long). Diabetes Care. 2012;35(12):2464-2471. doi: 10.2337/dc12-1205 [DOI] [PMC free article] [PubMed] [Google Scholar]
- 15.Rosenstock J, Davies M, Home PD, Larsen J, Koenen C, Schernthaner G. A randomised, 52-week, treat-to-target trial comparing insulin detemir with insulin glargine when administered as add-on to glucose-lowering drugs in insulin-naive people with type 2 diabetes. Diabetologia. 2008;51(3):408-416. doi: 10.1007/s00125-007-0911-x [DOI] [PMC free article] [PubMed] [Google Scholar]
- 16.Polonsky WH, Fisher L, Hessler D, Bruhn D, Best JH. Patient perspectives on once-weekly medications for diabetes. Diabetes Obes Metab. 2011;13(2):144-149. doi: 10.1111/j.1463-1326.2010.01327.x [DOI] [PubMed] [Google Scholar]
- 17.Polonsky WH, Arora R, Faurby M, Fernandes J, Liebl A. Higher rates of persistence and adherence in patients with type 2 diabetes initiating once-weekly vs daily injectable glucagon-like peptide-1 receptor agonists in US clinical practice (STAY Study). Diabetes Ther. 2022;13(1):175-187. doi: 10.1007/s13300-021-01189-6 [DOI] [PMC free article] [PubMed] [Google Scholar]
- 18.Frias J, Chien J, Zhang Q, et al. Safety and efficacy of once-weekly basal insulin Fc in people with type 2 diabetes previously treated with basal insulin: a multicentre, open-label, randomised, phase 2 study. Lancet Diabetes Endocrinol. 2023;11(3):158-168. doi: 10.1016/S2213-8587(22)00388-6 [DOI] [PubMed] [Google Scholar]
- 19.Bue-Valleskey JM, Kazda CM, Ma C, et al. Once-weekly basal insulin fc demonstrated similar glycemic control to once-daily insulin degludec in insulin-naive patients with type 2 diabetes: a phase 2 randomized control trial. Diabetes Care. 2023;46(5):1060-1067. doi: 10.2337/dc22-2396 [DOI] [PMC free article] [PubMed] [Google Scholar]
- 20.Kazda CM, Bue-Valleskey JM, Chien J, et al. Novel once-weekly basal insulin fc achieved similar glycemic control with a safety profile comparable to insulin degludec in patients with type 1 diabetes. Diabetes Care. 2023;46(5):1052-1059. doi: 10.2337/dc22-2395 [DOI] [PMC free article] [PubMed] [Google Scholar]
- 21.Novo Nordisk A/S. Tresiba (insulin degludec injection) package insert. US Food and Drug Administration. Accessed January 18, 2023. https://www.accessdata.fda.gov/drugsatfda_docs/label/2015/203314lbl.pdf
- 22.Novo Nordisk A/S. Tresiba (insulin degludec injection) summary of product characteristics. European Medicines Agency. Accessed January 18, 2023. https://www.ema.europa.eu/en/documents/product-information/tresiba-epar-product-information_en.pdf
- 23.McFarlane SI. Insulin therapy and type 2 diabetes: management of weight gain. J Clin Hypertens (Greenwich). 2009;11(10):601-607. doi: 10.1111/j.1751-7176.2009.00063.x [DOI] [PMC free article] [PubMed] [Google Scholar]
Associated Data
This section collects any data citations, data availability statements, or supplementary materials included in this article.
Supplementary Materials
eTables and eFigures
Trial protocol
Statistical analysis plan
Data sharing statement