

Abstract
Background
Growing evidence suggests incident cardiovascular disease (CVD) may be a long‐term outcome of COVID‐19 infection, and chronic diseases, such as diabetes, may influence CVD risk associated with COVID‐19. We evaluated the postacute risk of CVD >30 days after a COVID‐19 diagnosis by diabetes status.
Methods and Results
We included adults ≥20 years old with a COVID‐19 diagnosis from March 1, 2020 through December 31, 2021 in a retrospective cohort study from the IQVIA PharMetrics Plus insurance claims database. A contemporaneous control group comprised adults without recorded diagnoses for COVID‐19 or other acute respiratory infections. Two historical control groups comprised patients with or without an acute respiratory infection. Cardiovascular outcomes included cerebrovascular disorders, dysrhythmia, inflammatory heart disease, ischemic heart disease, thrombotic disorders, other cardiac disorders, major adverse cardiovascular events, and any CVD. The total sample comprised 23 824 095 adults (mean age, 48.4 years [SD, 15.7 years]; 51.9% women; mean follow‐up, 8.5 months [SD, 5.8 months]). In multivariable Cox regression models, patients with a COVID‐19 diagnosis had a significantly greater risk of all cardiovascular outcomes compared with patients without a diagnosis of COVID‐19 (hazard ratio [HR], 1.66 [1.62–1.71], with diabetes; HR, 1.75 [1.73–1.78], without diabetes). Risk was attenuated but still significant for the majority of outcomes when comparing patients with COVID‐19 to both historical control groups.
Conclusions
In patients with COVID‐19 infection, postacute risk of incident cardiovascular outcomes is significantly higher than among controls without COVID‐19, regardless of diabetes status. Therefore, monitoring for incident CVD may be essential beyond the first 30 days after a COVID‐19 diagnosis.
Keywords: cardiovascular disease, COVID‐19, diabetes
Subject Categories: Cardiovascular Disease, Epidemiology, Risk Factors
Clinical Perspective.
What Is New?
In a population of 23 million adults, COVID‐19 diagnosis was significantly associated with a greater postacute (>30 days) risk of cardiovascular disease, among adults both with and without prevalent diabetes.
What Are the Clinical Implications?
Monitoring for incident cardiovascular disease may be needed beyond the acute phase of COVID‐19.
Nonstandard Abbreviations and Acronyms
- ARI
acute respiratory infection
Although initial research on cardiovascular disease (CVD) and COVID‐19 focused on concerns such as increased risk of near‐term severe outcomes and difficulties in disease management, 1 , 2 the focus is increasingly shifting toward long‐term consequences. Scientific literature has begun to report on long COVID, which broadly refers to the phenomenon of residual respiratory, circulatory, or neurological symptoms persisting after the acute phase of infection. 3 A few studies have investigated the potential for incident cardiometabolic disease after COVID‐19, with some studies reporting long‐term outcomes such as incident CVD and diabetes. 4 , 5 , 6 , 7 The possibility of incident CVD is of particular interest due to the frequency of cardiovascular pathology among patients with COVID‐19. 8 , 9 Moreover, due to the high prevalence of CVD among individuals with diabetes and the overlapping pathophysiology among such cardiometabolic conditions, we postulated that diabetes may exacerbate the effect of COVID‐19 on risk of incident CVD.
Cardiovascular damage and immune dysregulation during the acute phase of COVID‐19 may result in an increased risk of long‐term CVD. 6 , 10 , 11 Several mechanisms and pathways have been suggested. Direct damage to the myocardium may occur via angiotensin‐converting enzyme 2 receptors, which facilitate entry of SARS‐CoV‐2, a strain of coronavirus causing COVID‐19, into host cells. 11 , 12 Indirect damage may occur from the downregulation of angiotensin‐converting enzyme 2, which can then lead to decreased synthesis of cardioprotective peptides. 11 , 13 The loss of angiotensin‐converting enzyme 2 on vascular endothelium may lead to downstream cardiovascular events such as thrombogenesis, decreased oxygen supply, and coronary plaque destabilization. 10 , 11 Lastly, the hyperinflammatory state of the cytokine storm may result in an increase in circulating proinflammatory cytokines, resulting in cardiovascular damage. 11 , 14
Although these biologic mechanisms support the hypothesis of an increased risk of CVD after COVID‐19, few studies have empirically evaluated this hypothesis. 5 , 6 , 7 Furthermore, it is not known if the observed associations are due to direct effects of COVID‐19, indirect effects of changes in health care use or lifestyle since the beginning of the pandemic, or methodologic limitations. For example, all prior studies used electronic health records, which may not provide a comprehensive record of patients' health care use when seen in institutions that did not provide patient records. Additionally, most studies exclusively used a contemporary control group, which can result in misclassification due to undetected cases of COVID‐19. No studies to date have examined to what extent, if any, diabetes may affect the role of COVID‐19 as a risk factor for incident CVD.
We therefore used a large nationwide insurance claims database to evaluate the risk of incident CVD >30 days after COVID‐19 diagnosis among adult patients, compared with patients without a COVID‐19 diagnosis, both before and after the emergence of SARS‐CoV‐2, and in subgroups with and without prevalent diabetes.
Methods
Study Sample
The data for this study were obtained under a data use agreement that does not permit data sharing; thus, data cannot be made publicly available. Programming code can be made available to qualified researchers. We retrieved outpatient and inpatient records from the IQVIA PharMetrics Plus database (2022 Q2 data release) of adjudicated health care claims from closed (ie, complete claims data for each patient from the insurance providers), primarily commercial, health plans covering the United States. The study compared patients with COVID‐19 with 3 control groups: 1 contemporary control group of patients with neither COVID‐19 nor any acute respiratory infection (ARI), hereafter referred to as the non‐COVID‐19 group, and 2 historical control groups with or without an ARI.
Patients in the COVID‐19 group were required to have at least 1 International Classification of Diseases, Tenth Revision, Clinical Modification (ICD‐10‐CM) diagnosis code from March 1, 2020 through December 31, 2021 (B97.29 from March 2020 through April 2020 or U07.1 from April 2020). The index date was the date of first COVID‐19 diagnosis code. In the non–COVID‐19 group, patients could not have any diagnosis codes for either COVID‐19 or any ARI (Table S1) over the same time period. The index date for these patients was randomly selected to match the distribution of index dates in the COVID‐19 group to ensure a similar average follow‐up time. In the historical control group of patients with an ARI, patients were required to have at least 1 ICD‐10‐CM diagnosis code of an ARI from March 1, 2018 through December 31, 2019. The index date was the date of ARI diagnosis, or if the patient had multiple encounter dates for ARI diagnoses, randomly selected among the dates of ARI diagnoses. In the historical control group of patients without any ARI diagnoses, index dates were randomly selected to match the distribution of index dates in the COVID‐19 group to ensure a similar average follow‐up time. In both historical control groups, patients who were also in the COVID‐19 group were placed only in the COVID‐19 group. Patients were required to be at least 20 years old at the beginning of the study period for each group; patients also must have 2 years of continuous insurance enrollment before their index date to provide sufficient time to ascertain prevalent diabetes, CVD, and other comorbidities. This study was exempt from institutional review board approval and informed consent due to the use of secondary deidentified information.
Measurements
A total of 8 cardiovascular outcomes included 2 composite outcomes and 6 mutually exclusive CVD subtypes: cerebrovascular disorders (stroke, transient ischemic attack), dysrhythmia (atrial fibrillation, supraventricular arrhythmia, ventricular arrhythmias, atrial flutter), inflammatory heart disease (pericarditis, myocarditis, endocarditis), ischemic heart disease (acute ischemic heart disease, myocardial infarction, ischemic cardiomyopathy, angina), other cardiac disorders (heart failure, nonischemic cardiomyopathy, cardiac arrest, cardiogenic shock), and thrombotic disorders (pulmonary embolism, deep vein thrombosis). The 2 composite outcomes were major adverse cardiovascular events (stroke, myocardial infarction, cardiac arrest, cardiogenic shock, or pulmonary embolism) and any CVD. Outcomes were identified using the presence of at least 1 ICD‐10‐CM code.
Demographic variables included age (years) at index date, sex (men, women), private health insurance (yes, no), and US Census division (East North Central, East South Central, Middle Atlantic, Mountain, New England, Pacific, South Atlantic, West North Central, West South Central, missing). To measure overall disease burden, a Charlson Comorbidity Index score was calculated, 15 which excluded diabetes and cardiovascular conditions already included in the cardiovascular outcomes. A patient was considered to have diabetes if at least 1 inpatient or 2 outpatient ICD‐10‐CM diagnosis codes (on separate days and not >2 years apart) for diabetes (E10*, E11*, E13*) were present in the 2 years before the index date. Patients missing data on US Census division were placed into a missing category, and those missing data on sex were removed. There were no missing data for other demographic variables, and the absence of an ICD‐10‐CM diagnosis code was considered as absence of the corresponding condition.
Statistical Analysis
Multivariable Cox regression models were used to evaluate the association between COVID‐19 diagnosis and each cardiovascular outcome, by prevalent diabetes status. Follow‐up time was used as the timescale. Follow‐up time accrued beginning 30 days after the index date until the date of an incident cardiovascular outcome, the end of the last month of insurance enrollment, or the end of the study period (December 31, 2021), whichever came first. For each analysis of a specific cardiovascular outcome, patients were excluded if they had any of the conditions comprising that outcome within 2 years before their index date. For the main analysis, patients were also excluded if they developed an outcome within the first 30 days. A dichotomous covariate indicated if a patient had any other cardiovascular condition comprising other CVD outcomes within 2 years before the index date. For example, in the model assessing risk of cerebrovascular disorders, the variable would be set to 1 for a patient with an ICD‐10‐CM code for myocardial infarction in the 2 years before the index date, whereas it would be set to 0 for a patient without evidence of any prevalent CVD.
For each of the 8 outcomes, models were adjusted for demographics (age, sex), private health insurance, US Census division, Charlson Comorbidity Index score, and any prevalent cardiovascular conditions excluding the outcome. Variables were selected a priori based on those available in the data set that are known or plausible confounders. P values for the interaction term between COVID‐19 and diabetes status were estimated. Multiple secondary analyses were conducted to evaluate the robustness of study findings. In the first secondary analysis, all analyses were repeated in a subcohort comprising only patients who had continuous insurance enrollment through the end of the study period. To estimate the potential impact of COVID‐19 severity on cardiovascular outcomes, in an additional analysis, patients in the COVID‐19 group with an index date for an inpatient encounter were excluded. In another secondary analysis, patients were followed from the index date to assess the combined risk of acute (≤30 days after index date) and postacute (>30 days after index date) cardiovascular outcomes. Index dates for patients in this secondary analysis (comprising all cardiovascular outcomes from the index date) extended to December 31, 2019, whereas index dates for the primary analysis (comprising only postacute cardiovascular outcomes >30 days after the index date) extended to December 1, 2019 to allow at least 30 days of follow‐up. For all reported hazard ratios (HRs), 2‐sided P values for statistical significance were adjusted for multiple comparisons and considered statistically significant only after adjustment using the Bonferroni method (α=0.05, number of tests=48). We used SAS 9.4 (SAS Institute, Cary, NC) for all analyses.
Results
Patient Characteristics
Construction of the study sample is displayed in Figure 1. Among the 23 824 095 patients in the total sample, 1 898 635 were in the COVID‐19 group. Among control groups, 11 180 192 were in the contemporaneous non–COVID‐19 group, 6 517 019 in the historical ARI group, and 11 706 660, in the historical non‐ARI group, respectively. Across the entire sample, the mean age was 48.4 years (SD, 15.7 years), 12 361 042 (51.9%) were women, and the mean follow‐up time was 8.5 months (SD, 5.8 months). Baseline characteristics of the patients in the COVID‐19 group and 3 control groups are shown in Table 1 and Table 2, respectively. In each group, patients with prevalent diabetes were more likely to be older, men, not have private health insurance, and have a higher Charlson Comorbidity Index score. Index dates for patients in the COVID‐19 group comprised 6.1% inpatient encounters. Patients with COVID‐19 were generally similar to control groups, with a greater proportion of patients with COVID‐19 residing in the East South Central US Census division. Among patients with diabetes, those with COVID‐19 showed a greater prevalence of CVD compared with the non–COVID‐19 and non‐ARI control groups.
Figure 1. Flowchart of study sample construction.

Dates indicate the range of dates possible from the index date until the last day of follow‐up. ARI indicates acute respiratory infection; and CVD, cardiovascular disease.
Table 1.
Baseline Characteristics of Patients With a COVID‐19 Diagnosis by Prevalent Diabetes
| COVID‐19 (n=1 898 635) | ||
|---|---|---|
| Without diabetes (n=1 669 492) | With diabetes (n=229 143) | |
| Age, y, mean±SD | 45.3±14.6 | 57.5±12.6 |
| Women, n (%) | 878 128 (52.6%) | 104 239 (45.5%) |
| Private health insurance, n (%) | 1 604 704 (96.1%) | 197 676 (86.3%) |
| US Census division, n (%) | ||
| East North Central | 341 488 (20.5%) | 47 554 (20.8%) |
| East South Central | 267 846 (16.0%) | 40 185 (17.5%) |
| Middle Atlantic | 114 226 (6.8%) | 15 238 (6.7%) |
| Mountain | 60 665 (3.6%) | 8206 (3.6%) |
| New England | 70 581 (4.2%) | 7610 (3.3%) |
| Pacific | 66 761 (4.0%) | 10 728 (4.7%) |
| South Atlantic | 247 324 (14.8%) | 35 615 (15.5%) |
| West North Central | 129 917 (7.8%) | 14 963 (6.5%) |
| West South Central | 369 771 (22.2%) | 48 797 (21.3%) |
| Missing | 913 (0.1%) | 247 (0.1%) |
| Charlson score, mean±SD | 0.38±0.92 | 1.07±1.58 |
| Prevalent CVD, n (%) | ||
| Cerebrovascular disorders | 21 008 (1.3%) | 11 851 (5.2%) |
| Dysrhythmias | 67 687 (4.1%) | 27 611 (12.0%) |
| Inflammatory heart disease | 13 946 (0.8%) | 8322 (3.6%) |
| Ischemic heart disease | 16 727 (1.0%) | 12 207 (5.3%) |
| Other cardiac disorders | 30 261 (1.8%) | 25 828 (11.3%) |
| Thrombotic disorders | 26 224 (1.6%) | 10 684 (4.7%) |
| MACE* | 37 248 (2.2%) | 22 320 (9.7%) |
| Any cardiovascular outcome | 126 386 (7.6%) | 57 315 (25.0%) |
CVD indicates cardiovascular disease; and MACE, major adverse cardiovascular event.
Includes stroke, myocardial infarction, cardiac arrest, cardiogenic shock, or pulmonary embolism.
Table 2.
Baseline Characteristics of Patients Without a COVID‐19 Diagnosis by Control Group and Prevalent Diabetes
| Non–COVID‐19 (n=11 180 192) | ARI (n=6 517 019) | Non‐ARI (n=11 706 660) | ||||
|---|---|---|---|---|---|---|
| Without diabetes (n=10 170 956) | With diabetes (n=1 009 236) | Without diabetes (n=5 856 379) | With diabetes (n=660 640) | Without diabetes (n=10 695 375) | With diabetes (n=1 011 285) | |
| Age, y, mean±SD | 48.8±15.6 | 60.8±12.5 | 46.8±15.5 | 59.6±12.6 | 47.8±15.3 | 59.7±12.2 |
| Women, n (%) | 5 156 568 (50.7%) | 428 318 (42.4%) | 3 507 260 (59.9%) | 340 003 (51.5%) | 5 362 719 (50.1%) | 413 854 (40.9%) |
| Private health insurance, n (%) | 9 407 494 (92.5%) | 816 152 (80.9%) | 5 529 980 (94.4%) | 549 359 (83.2%) | 10 053 177 (94.0%) | 847 355 (83.8%) |
| US Census division, n (%) | ||||||
| East North Central | 2 269 854 (22.3%) | 221 548 (22.0%) | 1 180 165 (20.2%) | 133 051 (20.1%) | 2 558 560 (21.9%) | 2 342 847 (21.9%) |
| East South Central | 862 222 (8.5%) | 109 991 (10.9%) | 775 617 (13.2%) | 102 457 (15.5%) | 989 434 (8.5%) | 882 949 (8.3%) |
| Middle Atlantic | 1 311 169 (12.9%) | 111 630 (11.1%) | 672 042 (11.5%) | 65 801 (10.0%) | 1 497 484 (12.8%) | 1 379 071 (12.9%) |
| Mountain | 472 070 (4.6%) | 40 298 (4.0%) | 222 658 (3.8%) | 23 323 (3.5%) | 504 844 (4.3%) | 467 932 (4.4%) |
| New England | 682 636 (6.7%) | 54 397 (5.4%) | 321 426 (5.5%) | 27 268 (4.1%) | 773 450 (6.6%) | 720 046 (6.7%) |
| Pacific | 889 389 (8.7%) | 100 765 (10.0%) | 388 670 (6.6%) | 52 323 (7.9%) | 1 014 066 (8.7%) | 917 257 (8.6%) |
| South Atlantic | 1 502 727 (14.8%) | 165 963 (16.4%) | 938 727 (16.0%) | 116 134 (17.6%) | 1 831 155 (15.6%) | 1 658 325 (15.5%) |
| West North Central | 1 034 417 (10.2%) | 81 116 (8.0%) | 491 630 (8.4%) | 42 320 (6.4%) | 1 166 306 (10.0%) | 1 084 408 (10.1%) |
| West South Central | 1 135 977 (11.2%) | 121 670 (12.1%) | 860 724 (14.7%) | 97 118 (14.7%) | 1 360 427 (11.6%) | 1 232 917 (11.5%) |
| Missing | 10 495 (0.1%) | 1858 (0.2%) | 4720 (0.1%) | 845 (0.1%) | 10 934 (0.1%) | 9623 (0.1%) |
| Charlson score, mean±SD | 0.29±0.81 | 0.83±1.36 | 0.47±0.99 | 1.21±1.65 | 0.28±0.80 | 0.80±1.35 |
| Prevalent CVD, n (%) | ||||||
| Cerebrovascular disorders | 102 228 (1.0%) | 37 875 (3.8%) | 81 328 (1.4%) | 35 156 (5.3%) | 111 298 (1.0%) | 40 435 (4.0%) |
| Dysrhythmias | 355 510 (3.5%) | 97 329 (9.6%) | 252 337 (4.3%) | 87 663 (13.3%) | 341 825 (3.2%) | 92 097 (9.1%) |
| Inflammatory heart disease | 66 479 (0.7%) | 25 566 (2.5%) | 54 656 (0.9%) | 26 949 (4.1%) | 67 851 (0.6%) | 26 091 (2.6%) |
| Ischemic heart disease | 55 972 (0.6%) | 26 991 (2.7%) | 56 593 (1.0%) | 34 619 (5.2%) | 63 811 (0.6%) | 30 398 (3.0%) |
| Other cardiac disorders | 114 244 (1.1%) | 64 853 (6.4%) | 113 440 (1.9%) | 78 541 (11.9%) | 108 866 (1.0%) | 62 500 (6.2%) |
| Thrombotic disorders | 95 601 (0.9%) | 23 955 (2.4%) | 89 180 (1.5%) | 28 846 (4.4%) | 105 047 (1.0%) | 26 191 (2.6%) |
| MACE* | 142 529 (1.4%) | 56 665 (5.6%) | 124 955 (2.1%) | 60 258 (9.1%) | 153 769 (1.4%) | 60 029 (5.9%) |
| Any cardiovascular outcome | 606 968 (6.0%) | 185 509 (18.4%) | 458 044 (7.8%) | 169 368 (25.6%) | 615 241 (5.8%) | 184 394 (18.2%) |
ARI indicates acute respiratory infection; CVD, cardiovascular disease; and MACE, major adverse cardiovascular event.
Includes stroke, myocardial infarction, cardiac arrest, cardiogenic shock, or pulmonary embolism.
COVID‐19 and Incident CVD
Figure 2 displays hazard ratios from multivariable models comparing the risk of each cardiovascular outcome between the COVID‐19 group and the non–COVID‐19 contemporaneous control group. After adjustment for multiple comparisons, patients with a COVID‐19 diagnosis, with or without diabetes, were at significantly higher risk of each cardiovascular outcome, with the strongest associations representing approximately a 2‐fold increased risk of thrombotic disorders and inflammatory heart disease. For any CVD outcome, the risk was slightly lower among patients with diabetes (HR, 1.66 [95% CI, 1.62–1.71]) than among patients without diabetes (HR, 1.75 [95% CI, 1.73–1.78]), although the corresponding interaction term was not significant.
Figure 2. Postacute risk of cardiovascular disease for patients with a COVID‐19 diagnosis compared with patients without a COVID‐19 or ARI diagnosis by prevalent diabetes (n=11 503 265).
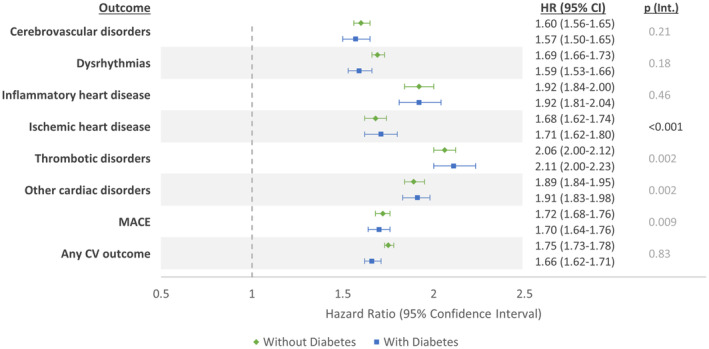
Values in gray are not statistically significant (P<0.001) after Bonferroni correction for multiple comparisons. The contemporaneous control group comprises patients with index dates from March 1, 2020 through December 1, 2021. ARI indicates acute respiratory infection; CV, cardiovascular; HR, hazard ratio; MACE, major adverse cardiovascular event; and p (Int.), P value for interaction.
In Figure 3, results are shown when comparing the COVID‐19 group with historical controls who did not have an ARI. Similar to when comparing with contemporaneous controls, after adjustment for multiple comparisons, all patients with a COVID‐19 diagnosis were at significantly higher risk of each cardiovascular outcome. However, the magnitude of hazard ratios for all outcomes were slightly smaller. There was a significantly greater risk of any cardiovascular outcome for patients with diabetes (HR, 1.48 [95% CI, 1.43–1.52]) and without diabetes (HR, 1.62 [95% CI, 1.60–1.65]).
Figure 3. Postacute risk of cardiovascular disease for patients with a COVID‐19 diagnosis compared with patients without an acute respiratory infection by prevalent diabetes (n=11 922 816).

Values in gray are not statistically significant (P<0.001) after Bonferroni correction for multiple comparisons. The control group is a historical sample of patients with index dates from March 1, 2018 through December 1, 2019. CV indicates cardiovascular; HR, hazard ratio; MACE, major adverse cardiovascular event; and p (Int.), P value for interaction.
Given the potential of ARI to convey cardiovascular risk, patients with a COVID‐19 diagnosis were also compared with a historical control group of patients with an ARI (Figure 4). After adjustment for multiple comparisons, the overall pattern of results was similar, but with more attenuated HRs than in Figure 3, resulting in nonsignificant associations among patients with diabetes for the outcomes of cerebrovascular disorders, dysrhythmias, and ischemic heart disease (displayed in gray in Figure 3). Risk of any CVD outcome remained significant for patients with (HR, 1.09 [95% CI, 1.06–1.12]) and without diabetes (HR, 1.22 [95% CI, 1.20–1.24]).
Figure 4. Postacute risk of cardiovascular disease for patients with a COVID‐19 diagnosis compared with patients with an acute respiratory infection by prevalent diabetes (n=7 631 605).

Values in gray are not statistically significant (P<0.001) after Bonferroni correction for multiple comparisons, except for those in gray. The control group is a historical sample of patients with index dates from March 1, 2018 through December 1, 2019. CV indicates cardiovascular; HR, hazard ratio; MACE, major adverse cardiovascular event; and p (Int.), P value for interaction.
For all analyses, when including only those patients with continuous insurance enrollment through the end of the study period, HRs were slightly attenuated, but did not appreciably change (Figures S1 through S3). When including outcomes within 30 days of the index date (Figures S4 through S6), HRs substantially increased, particularly for thrombotic disorders. In analyses excluding patients with COVID‐19 with index dates for inpatient encounters, HRs were slightly attenuated (Figures S7 through S9).
Discussion
In a large nationwide insurance claims database, patients with a COVID‐19 diagnosis were at greater risk of incident CVD, compared with patients without COVID‐19. The increased risk persisted when comparing with different control groups, namely, the contemporaneous non–COVID‐19 group and historical control groups with and without ARI. Findings were similar when stratified by prevalent diabetes status, suggesting that diabetes status alone likely does not contribute substantially to the increased risk of CVD.
The observed associations were strongest when comparing patients with COVID‐19 to the contemporaneous non–COVID‐19 group, and weakest when comparing to the historical control group with ARI. The findings of the latter comparison may be due to the potential for ARIs themselves to confer cardiovascular risk. 16 , 17 Prior evidence implicates acute infections in the development of acute cardiovascular events through several possible mechanisms. For example, influenza and community‐acquired pneumonia may act as an inflammatory stimulus leading to cardiac complications such as acute myocardial infarction. 16 , 17 Moreover, acute infections may lead to endothelial dysfunction, platelet activation, and vasoconstriction, consequently promoting thrombotic events. 18
The slightly larger association observed among patients without diabetes compared with those with diabetes was unexpected and may be attributed to differential loss to follow‐up from death. Survival bias may result in retention of healthier patients with diabetes in the data set, because patients with more severe or poorly managed diabetes may be more likely to die before developing a cardiovascular outcome. Because supplementary analysis that followed patients since the index date showed an attenuated difference in risk between patients with and without diabetes, patients with diabetes may be at greater risk in the first 30 days after COVID‐19 diagnosis. There may also be cardioprotective effects from pharmaceutical treatments taken by patients with diabetes. For example, angiotensin‐converting enzyme inhibitors are among the first‐line drugs recommended to treat chronic high blood pressure in patients with diabetes, and their cardioprotective effect has been described in COVID‐19–related heart failure. 19 Angiotensin‐converting enzyme inhibitors reduce the risk of CVD events by decreasing the vasoconstrictor effect of angiotensin II through the increase in vasodilatory angiotensins 1 to 7. 20 Lastly, although point estimates differed by diabetes status, the majority of corresponding P values for interaction were not significant.
Additionally, the overall results may be affected by the choice of control group, because it can be difficult in real‐world data to sample a control group that is both comparable in patterns of health care use to patients with COVID‐19 and avoids misclassification of COVID‐19 diagnosis. However, as results consistently showed, an increased risk of CVD in the COVID‐19 group compared with all 3 control groups, the choice of control group is unlikely to fully explain the significant risk among patients with COVID‐19 when comparing with all control groups.
As in the current study, previous studies in the United States reported similar findings of a significantly increased risk of incident CVD among patients with COVID‐19 compared with patients without COVID‐19. 5 , 6 , 7 , 21 A study among 587 330 discharged hospital patients in the United States found that patients hospitalized with COVID‐19, compared with hospitalized patients without COVID‐19, had a 45% higher risk of incident heart failure. 5 In another study, approximately 11 million veterans in the United States who tested positive for COVID‐19 had a higher risk for several categories of postacute CVD compared with patients who tested negative. 7 Another large study of approximately 3 million inpatients and outpatients in the United States reported similar findings. 6 Compared with these prior studies, a similar magnitude of association was observed in the current study, despite differences in data sources (all prior studies used electronic health record data rather than claims data) and methods in ascertaining COVID‐19 status (most prior studies used COVID‐19 test results rather than diagnosis codes). Prior studies also assessed incident CVD risk within different time frames, beginning the day of a positive COVID‐19 test, 21 30 days after a positive test, 6 , 7 or after recovery from hospitalization. 5 The collective evidence to date consistently suggests a greater risk of CVD after COVID‐19, including after the acute phase, potentially exacerbating the already considerable health and economic burden of CVD. 22 , 23
Limitations of this study include the use of ICD‐10‐CM diagnosis codes in a primarily outpatient sample to ascertain COVID‐19, diabetes, and CVD, which may not fully capture all patients with these conditions. Ascertaining COVID‐19 by diagnosis codes from insurance claims rather than test results may have selected more serious cases of COVID‐19, because patients with milder cases may not have sought care and may have remained undiagnosed, resulting in a potential attenuation of the estimated effect size. Similarly, misclassification of asymptomatic or undiagnosed COVID‐19 in the contemporaneous control group may have attenuated the findings. Because this is an observational study, residual confounding and control selection bias may affect results, because data on CVD risk factors (eg, socioeconomic status, race and ethnicity, lifestyle factors, disease severity, and vaccination status) were not available in the insurance claims databases. Additionally, competing risk analyses could not be conducted, because mortality data were not available, which may have resulted in an underestimation of CVD risk following COVID‐19 due to greater mortality among patients with COVID‐19 compared with controls, particularly during the early phase of the pandemic. Lastly, the patient sample may not be representative of the general US population. In particular, in this primarily privately insured sample, there was an underrepresentation of patients ≥65 years old, which may have resulted in an underestimation of CVD risk.
In this claims‐based study of 23 million adults, we found a consistent and positive association between COVID‐19 infection and increased CVD risk in the postacute phase. We also observed a seemingly lower or similar risk among patients with diabetes compared with those without diabetes. Because most outcomes assessed in this study are major cardiovascular outcomes unlikely to occur without existing pathology, COVID‐19 may have accelerated disease onset. Although indirect pathways may have contributed to CVD risk during the pandemic, such as decreased health care use, poor management of existing risk factors, or changes in lifestyle behaviors, these factors would likely have affected both patients with and without COVID‐19 and are unlikely to explain the observed results. Study findings emphasize the importance of assessing and managing CVD risk factors among patients with COVID‐19 to mitigate risk of adverse cardiovascular outcomes. Future studies may assess if any increased risk of CVD following COVID‐19 persists with longer follow‐up in the years after COVID‐19 diagnosis.
Sources of Funding
None.
Disclosures
None.
Supporting information
Table S1
Figures S1–S9
Acknowledgments
A.K.K. had full access to all of the data in the study and takes responsibility for its integrity and the data analysis. The findings and conclusions in this report are those of the authors and do not necessarily represent the official position of the Centers for Disease Control and Prevention.
Supplemental Material is available at https://www.ahajournals.org/doi/suppl/10.1161/JAHA.123.029696
This article was sent to Kolawole W. Wahab, MD, Guest Editor, for review by expert referees, editorial decision, and final disposition.
For Sources of Funding and Disclosures, see page 9.
References
- 1. Maddaloni E, D'Onofrio L, Siena A, Luordi C, Mignogna C, Amendolara R, Cavallari I, Grigioni F, Buzzetti R. Impact of cardiovascular disease on clinical outcomes in hospitalized patients with Covid‐19: a systematic review and meta‐analysis. Intern Emerg Med. 2021;16:1975–1985. doi: 10.1007/s11739-021-02804-x [DOI] [PMC free article] [PubMed] [Google Scholar]
- 2. Pina A, Castelletti S. COVID‐19 and cardiovascular disease: a global perspective. Curr Cardiol Rep. 2021;23:135. doi: 10.1007/s11886-021-01566-4 [DOI] [PMC free article] [PubMed] [Google Scholar]
- 3. Visco V, Vitale C, Rispoli A, Izzo C, Virtuoso N, Ferruzzi GJ, Santopietro M, Melfi A, Rusciano MR, Maglio A, et al. Post‐COVID‐19 syndrome: involvement and interactions between respiratory, cardiovascular and nervous systems. J Clin Med. 2022;11:11. doi: 10.3390/jcm11030524 [DOI] [PMC free article] [PubMed] [Google Scholar]
- 4. Banerjee M, Pal R, Dutta S. Risk of incident diabetes post‐COVID‐19: a systematic review and meta‐analysis. Prim Care Diabetes. 2022;16:591–593. doi: 10.1016/j.pcd.2022.05.009 [DOI] [PMC free article] [PubMed] [Google Scholar]
- 5. Salah HM, Fudim M, O'Neil ST, Manna A, Chute CG, Caughey MC. Post‐recovery COVID‐19 and incident heart failure in the National COVID Cohort Collaborative (N3C) study. Nat Commun. 2022;13:4117. doi: 10.1038/s41467-022-31834-y [DOI] [PMC free article] [PubMed] [Google Scholar]
- 6. Wang W, Wang CY, Wang SI, Wei JC. Long‐term cardiovascular outcomes in COVID‐19 survivors among non‐vaccinated population: a retrospective cohort study from the TriNetX US collaborative networks. EClinicalMedicine. 2022;53:101619. doi: 10.1016/j.eclinm.2022.101619 [DOI] [PMC free article] [PubMed] [Google Scholar]
- 7. Xie Y, Xu E, Bowe B, Al‐Aly Z. Long‐term cardiovascular outcomes of COVID‐19. Nat Med. 2022;28:583–590. doi: 10.1038/s41591-022-01689-3 [DOI] [PMC free article] [PubMed] [Google Scholar]
- 8. Omidi F, Hajikhani B, Kazemi SN, Tajbakhsh A, Riazi S, Mirsaeidi M, Ansari A, Ghanbari Boroujeni M, Khalili F, Hadadi S, et al. COVID‐19 and cardiomyopathy: a systematic review. Front Cardiovasc Med. 2021;8:695206. doi: 10.3389/fcvm.2021.695206 [DOI] [PMC free article] [PubMed] [Google Scholar]
- 9. Shah MD, Sumeh AS, Sheraz M, Kavitha MS, Venmathi Maran BA, Rodrigues KF. A mini‐review on the impact of COVID 19 on vital organs. Biomed Pharmacother. 2021;143:112158. doi: 10.1016/j.biopha.2021.112158 [DOI] [PMC free article] [PubMed] [Google Scholar]
- 10. Schoene D, Schnekenberg LG, Pallesen LP, Barlinn J, Puetz V, Barlinn K, Siepmann T. Pathophysiology of cardiac injury in COVID‐19 patients with acute ischaemic stroke: what do we know so far?‐a review of the current literature. Life (Basel). 2022;12:12. doi: 10.3390/life12010075 [DOI] [PMC free article] [PubMed] [Google Scholar]
- 11. Elseidy SA, Awad AK, Vorla M, Fatima A, Elbadawy MA, Mandal D, Mohamad T. Cardiovascular complications in the post‐acute COVID‐19 syndrome (PACS). Int J Cardiol Heart Vasc. 2022;40:101012. doi: 10.1016/j.ijcha.2022.101012 [DOI] [PMC free article] [PubMed] [Google Scholar]
- 12. Bojkova D, Wagner JUG, Shumliakivska M, Aslan GS, Saleem U, Hansen A, Luxan G, Gunther S, Pham MD, Krishnan J, et al. SARS‐CoV‐2 infects and induces cytotoxic effects in human cardiomyocytes. Cardiovasc Res. 2020;116:2207–2215. doi: 10.1093/cvr/cvaa267 [DOI] [PMC free article] [PubMed] [Google Scholar]
- 13. Patel VB, Zhong JC, Grant MB, Oudit GY. Role of the ACE2/angiotensin 1‐7 Axis of the renin‐angiotensin system in heart failure. Circ Res. 2016;118:1313–1326. doi: 10.1161/CIRCRESAHA.116.307708 [DOI] [PMC free article] [PubMed] [Google Scholar]
- 14. Chang WT, Toh HS, Liao CT, Yu WL. Cardiac involvement of COVID‐19: a comprehensive review. Am J Med Sci. 2021;361:14–22. doi: 10.1016/j.amjms.2020.10.002 [DOI] [PMC free article] [PubMed] [Google Scholar]
- 15. Charlson M, Szatrowski TP, Peterson J, Gold J. Validation of a combined comorbidity index. J Clin Epidemiol. 1994;47:1245–1251. doi: 10.1016/0895-4356(94)90129-5 [DOI] [PubMed] [Google Scholar]
- 16. Warren‐Gash C, Smeeth L, Hayward AC. Influenza as a trigger for acute myocardial infarction or death from cardiovascular disease: a systematic review. Lancet Infect Dis. 2009;9:601–610. doi: 10.1016/S1473-3099(09)70233-6 [DOI] [PubMed] [Google Scholar]
- 17. Corrales‐Medina VF, Suh KN, Rose G, Chirinos JA, Doucette S, Cameron DW, Fergusson DA. Cardiac complications in patients with community‐acquired pneumonia: a systematic review and meta‐analysis of observational studies. PLoS Med. 2011;8:e1001048. doi: 10.1371/journal.pmed.1001048 [DOI] [PMC free article] [PubMed] [Google Scholar]
- 18. Corrales‐Medina VF, Madjid M, Musher DM. Role of acute infection in triggering acute coronary syndromes. Lancet Infect Dis. 2010;10:83–92. doi: 10.1016/S1473-3099(09)70331-7 [DOI] [PubMed] [Google Scholar]
- 19. Pan M, Vasbinder A, Anderson E, Catalan T, Shadid HR, Berlin H, Padalia K, O'Hayer P, Meloche C, Azam TU, et al. Angiotensin‐converting enzyme inhibitors, angiotensin II receptor blockers, and outcomes in patients hospitalized for COVID‐19. J Am Heart Assoc. 2021;10:e023535. doi: 10.1161/JAHA.121.023535 [DOI] [PMC free article] [PubMed] [Google Scholar]
- 20. Burrell LM, Johnston CI, Tikellis C, Cooper ME. ACE2, a new regulator of the renin‐angiotensin system. Trends Endocrinol Metab. 2004;15:166–169. doi: 10.1016/j.tem.2004.03.001 [DOI] [PMC free article] [PubMed] [Google Scholar]
- 21. Tereshchenko LG, Bishop A, Fisher‐Campbell N, Levene J, Morris CC, Patel H, Beeson E, Blank JA, Bradner JN, Coblens M, et al. Risk of cardiovascular events after COVID‐19. Am J Cardiol. 2022;179:102–109. doi: 10.1016/j.amjcard.2022.06.023 [DOI] [PMC free article] [PubMed] [Google Scholar]
- 22.Global Burden of Cardiovascular Diseases Collaboration; Roth GA, Johnson CO, Abate KH, Abd‐Allah F, Ahmed M, Alam K, Alam T, Alvis‐Guzman N, Ansari H, et al. The burden of cardiovascular diseases among US states, 1990–2016. JAMA Cardiol. 2018;3:375–389. doi: 10.1001/jamacardio.2018.0385 [DOI] [PMC free article] [PubMed] [Google Scholar]
- 23. Foy AJ, Mandrola JM. Heavy heart: the economic burden of heart disease in the United States now and in the future. Prim Care. 2018;45:17–24. doi: 10.1016/j.pop.2017.11.002 [DOI] [PubMed] [Google Scholar]
Associated Data
This section collects any data citations, data availability statements, or supplementary materials included in this article.
Supplementary Materials
Table S1
Figures S1–S9