

Abstract
Background
Population growth, aging, and major alterations in epidemiologic trends inadvertently modulate the status of rheumatic heart disease (RHD) epidemiology. This investigation predicted RHD burden pattern and temporal trends to provide epidemiologic evidence.
Methods and Results
Prevalence, mortality, and disability‐adjusted life‐years data for RHD were obtained from the GBD (Global Burden of Disease) study. We performed decomposition analysis and frontier analysis to assess variations and burden in RHD from 1990 to 2019. In 2019, there were >40.50 million RHD cases worldwide, along with nearly 0.31 million RHD‐related deaths and 10.67 million years of healthy life lost to RHD. The RHD burden was commonly concentrated within lower sociodemographic index regions and countries. RHD primarily affects women (22.52 million cases in 2019), and the largest age‐specific prevalence rate was at 25 to 29 years in women and 20 to 24 years in men. Multiple reports demonstrated prominent downregulation of RHD‐related mortality and disability‐adjusted life‐years at the global, regional, and national levels. Decomposition analysis revealed that the observed improvements in RHD burden were primarily due to epidemiological alteration; however, it was negatively affected by population growth and aging. Frontier analysis revealed that the age‐standardized prevalence rates were negatively linked to sociodemographic index, whereas Somalia and Burkina Faso, with lower sociodemographic index, showed the lowest overall difference from the frontier boundaries of mortality and disability‐adjusted life‐years.
Conclusions
RHD remains a major global public health issue. Countries such as Somalia and Burkina Faso are particularly successful in managing adverse outcomes from RHD and may serve as a template for other countries.
Keywords: disability‐adjusted life‐years, Global Burden of Disease 2019, mortality, prevalence, rheumatic heart disease
Subject Categories: Rheumatic Heart Disease, Epidemiology, Aging, Mortality/Survival
Nonstandard Abbreviations and Acronyms
- AMDR
age‐matched disability‐adjusted life‐years rate
- ASMR
age‐standardized mortality rate
- ASPR
age‐standardized prevalence rate
- GBD
Global Burden of Disease
- RHD
rheumatic heart disease
- SDI
sociodemographic index
Clinical Perspective.
What Is New?
Individuals with rheumatic heart disease were primarily composed of women and concentrated among adolescents and young adults, whereas adverse outcomes were mainly concentrated among an older population.
Rheumatic heart disease burden was primarily driven by epidemiological change, negatively affected by population growth and aging, and inversely associated with development level.
What Are the Clinical Implications?
Countries such as Somalia and Burkina Faso are particularly successful in managing adverse outcomes from rheumatic heart disease given their state of development, and their policies may serve as a template for other countries.
Rheumatic heart disease (RHD) is caused by acute rheumatic fever–induced irreversible valve damage. Rheumatic fever is brought on by an aberrant immune response to group A streptococcal infections, which typically occurs during childhood and adolescence. 1 , 2 Fortunately, owing to better living conditions and penicillin discovery, RHD was almost eradicated in developed countries in the 1980s. 3 Although RHD is a fundamentally preventable disease, it carries a major burden of cardiovascular morbidity/mortality and has, to date, generated limited attention from the medical and scientific communities.
The World Heart Federation and its working group united global experts to establish a strategic goal, to reduce premature deaths from rheumatic fever and RHD by 25% in patients <25 years of age by the year 2025. 4 Despite the implementation of control programs and enhancements within health systems in numerous countries, the political commitment to addressing RHD and reducing its global burden remains limited. 5 , 6 , 7 Thus, it is appropriate to fully comprehend the present RHD burden in various regions around the world and to predict the burden trend over time. These predictions will facilitate both country‐specific and regional policymakers to establish proper maintenance of the current and future RHD burdens.
The GBD (Global Burden of Disease) study is a multinational collaboration that predicted the disease burden of individual countries around the world, and it allowed researchers to better comprehend the global RHD landscape. 8 , 9 For GBD 2015, RHD was defined as a clinical diagnosis by a physician or echocardiography, and was confirmed with data from a database of US private and public insurance claims. 10 GBD 2017 modeled deaths from RHD with a standard approach with cause of death ensemble modeling. 11 In GBD 2019, vital registration and surveillance data were used to model RHD. In addition, GBD 2019 outliered data points from International Classification of Diseases, Eighth and Ninth Revision (ICD‐8 and ICD‐9) high data points after a redistribution process, and verbal autopsy data points in Nepal and Pakistan. 8 , 9 Herein, we used the GBD data to (1) further assess the RHD burden by predicting the RHD prevalence trends, as well as mortality and disability‐adjusted life‐years (DALYs) from 1990 to 2019 at the global, regional, and national levels; (2) determine the mechanism whereby the demographic and epidemiologic drivers altered RHD burden over the examined time duration; and (3) assess the association between RHD burden and health and economic prosperity measures in any countries/territories. Our research also maintained consistent comparisons by sex and age.
Methods
The data that support the findings of this study are available from the corresponding author upon reasonable request.
Overview
The GBD 2019 report offers the most recent depiction of global trends and standards in epidemiology for a variety of injuries and diseases, following the comprehensive methods used in previous editions. 9 , 12 Specific information on RHD incidence, mortality, and DALYs was gathered freely from the GBD 2019 data (http://ghdx.healthdata.org/gbd‐results‐tool). 8 Each of these estimates was presented in terms of counts and age‐standardized prevalence rates (ASPRs) per 100 000 individuals, with a 95% uncertainty interval (95% UI) for clarity.
Estimation of Prevalence, Mortality, and DALYs
The raw data set used for model development is accessible on the GBD 2019 Data Resources website for viewing and downloading convenience. 8 DisMod‐MR 2.1, a Bayesian meta‐regression method, was used for nonfatal RHD data modeling. This technique uses disparate and limited epidemiological data to establish nonfatal outcomes 13 and adjusts data from different sources to account for variation in study methodologies, enforcing consistent epidemiological parameters. 13 , 14 The sociodemographic index (SDI) incorporated in the GBD study reflects average per capita income, cumulative fertility rates, and state‐level educational attainment. 13 A higher SDI score implies increased sociodemographic development. The SDI categorizes countries into high, high–middle, middle, middle–low, and low groups.
The age‐standardized rates applied in the GBD study conform to the standard global population. 15 The projected disease burden in GBD is represented with 95% UIs, suggesting a 95% probability for the true parameter value. These intervals account for variations and uncertainties in parameter prediction, model selection, and data compilation.
Statistical Analysis
Age‐standardized rate estimates per 100 000 individuals and counts were presented in alignment with the GBD population standard framework, with 95% UI for all projections. The ultimate predictions were calculated as the mean of 1000 iterations, with the upper and lower bounds of the 95% UI being the 97.5‐ and 2.5‐ranked values across the iterations. 8 Joinpoint trend analysis software was used to determine the average annual percentage change in RHD prevalence rate from 1990 to 2019. 16 To gain a deeper understanding of the factors causing changes in RHD prevalence between 1990 and 2019, decomposition analyses were performed by age structure, population size, and changes in epidemiology. 16 The SDI was used to determine the association between sociodemographic development and RHD burden, and a frontier analysis was performed to ascertain the lowest achievable rate of prevalence, deaths, and DALYs. Please refer to Data S1 for more detailed information on the decomposition analysis and frontier analysis conducted in this study.
Ethical Approval and Consent to Participate
Ethical approval and consent are not required because this study used publicly available secondary data that were aggregated and nonidentified.
Results
Prevalence of RHD
In this study, we obtained the publication estimates of prevalence for RHD from the GBD 2019. Between 1990 and 2019, RHD prevalence cases rose from 23.76 million (95% UI, 18.79–29.30 million) to 40.50 million (95% UI, 32.05–50.06 million) globally (Table 1). The global average annual percentage change of ASPR for RHD showed only a 0.47% (95% CI, 0.42–0.51) increase, from 451.56 (95% UI, 363.35–552.54) per 100 000 population in 1990 to 513.68 (95% UI, 405.01–636.25) per 100 000 population in 2019. The global map of ASPR and average annual percentage change for RHD at the national level is presented in Figure 1. Overall, 22.52 million (95% UI, 17.90–27.71 million) cases were reported among women in 2019, and 17.98 million (95% UI, 14.20–22.41 million) among men (Table 1). The ASPRs were 572.23 (95% UI, 450.66‐705.53) per 100 000 population in women and 455.24 (95% UI, 359.15–566.15) per 100 000 population in men in 2019. Moreover, ASPR was elevated among women, relative to men, throughout the duration of this study (Figure S1). The highest RHD peak of ASPR was evident at 25 to 29 years of age among women and at 20 to 24 years of age among men. Although the ASPR of both sexes decreased with age, it increased after 70 years of age (Figure S2).
Table 1.
Rheumatic Heart Disease–Related Prevalence Between 1990 and 2019 for Both Sexes and All Locations, With AAPC Between 1990 and 2019
| Location | 1990 | 2019 | AAPC % (95% CI) 1990–2019 | ||
|---|---|---|---|---|---|
| Cases (95% UI) | Age‐standardized prevalence per 100 000 population (95% UI) | Cases (95% UI) | Age‐standardized prevalence per 100 000 population (95% UI) | ||
| Global | 23 756 847 (18 791 683 to 29 295 709) | 451.56 (363.35 to 552.54) | 40 502 345 (32 052 904 to 50 062 426) | 513.68 (405.01 to 636.25) | 0.4664 (0.4245 to 0.5083) |
| Sex | |||||
| Women | 13 099 934 (10 421 455 to 16 035 909) | 501.56 (405.5 to 609.67) | 22 519 239 (17 895 086 to 27 713 122) | 572.23 (450.66 to 705.53) | 0.4827 (0.4453 to 0.5201) |
| Men | 10 656 912 (8 363 711 to 13 199 602) | 400.46 (321.44 to 492.36) | 17 983 106 (14 198 981 to 22 406 039) | 455.24 (359.15 to 566.15) | 0.4654 (0.4134 to 0.5173) |
| SDI | |||||
| High SDI | 840 286 (724 963 to 955 410) | 82.93 (71.82 to 93.74) | 1 298 831 (1 172 660 to 1 430 669) | 74.97 (68.09 to 82.12) | −0.3602 (−0.4618 to −0.2586) |
| High‐middle SDI | 3 363 720 (2 838 208 to 3 992 200) | 289.23 (246.15 to 342.21) | 4 340 128 (3 662 377 to 5 170 277) | 271.54 (224.52 to 329) | −0.1904 (−0.2406 to −0.1402) |
| Middle SDI | 8 671 201 (6 696 174 to 10 847 101) | 501.87 (396.81 to 624.96) | 12 571 430 (9 894 032 to 15 706 570) | 498.41 (392.05 to 624.2) | −0.0177 (−0.0632 to 0.0279) |
| Low‐middle SDI | 6 866 722 (5 292 949 to 8 602 523) | 644.37 (503.97 to 805.8) | 12 551 121 (9 661 513 to 15 788 796) | 687.61 (534.82 to 860.28) | 0.282 (0.2492 to 0.3149) |
| Low SDI | 4 000 024 (3 058 044 to 5 086 967) | 832.91 (648.55 to 1039.27) | 9 714 934 (7 435 710 to 12 350 764) | 886.93 (688 to 1106.54) | 0.2426 (0.2089 to 0.2762) |
| Region | |||||
| High‐income Asia Pacific | 98 948 (82 545 to 114 987) | 49.45 (41.49 to 57.17) | 128 659 (109 069 to 148 548) | 34.16 (29.55 to 38.97) | −1.2737 (−1.3318 to −1.2155) |
| High‐income North America | 429 691 (360 800 to 497 496) | 123.49 (104.25 to 142.4) | 723 744 (660 550 to 787 479) | 117.54 (107.71 to 127.03) | −0.1092 (−0.3243 to 0.1064) |
| Western Europe | 308 720 (267 454 to 352 889) | 55.18 (47.96 to 63) | 339 475 (288 523 to 394 434) | 39.72 (33.93 to 45.61) | −1.1502 (−1.183 to −1.1174) |
| Australasia | 13 836 (11 745 to 15 903) | 61.01 (51.93 to 70.06) | 21 390 (18 219 to 24 867) | 50.71 (42.99 to 58.59) | −0.6433 (−0.7112 to −0.5753) |
| Andean Latin America | 291 480 (221 451 to 369 731) | 793.87 (615.64 to 992.8) | 527 241 (407 025 to 656 076) | 812.15 (628.58 to 1011.81) | 0.0886 (0.0572 to 0.12) |
| Tropical Latin America | 1 385 816 (1 065 990 to 1 738 098) | 899.05 (699.28 to 1119.15) | 2 165 352 (1 688 933 to 2 683 950) | 917.15 (714.71 to 1141.65) | 0.0608 (0.0449 to 0.0767) |
| Central Latin America | 554 951 (430 294 to 691 455) | 358.19 (287.12 to 435.28) | 914 290 (720 259 to 1 122 683) | 353.88 (279.49 to 434.27) | −0.0431 (−0.0699 to −0.0164) |
| Southern Latin America | 230 635 (183 692 to 286 879) | 469.7 (374.66 to 582.67) | 336 596 (267 355 to 414 133) | 488.01 (385.13 to 603.26) | 0.1102 (0.0799 to 0.1406) |
| Caribbean | 265 099 (203 193 to 333 347) | 747.85 (581.94 to 932.43) | 379 156 (295 533 to 469 695) | 786.82 (612.48 to 977.11) | 0.1767 (0.1635 to 0.1898) |
| Central Europe | 209 526 (187 313 to 233 520) | 144.04 (129.59 to 160.06) | 171 066 (149 016 to 195 263) | 93.46 (82.24 to 105.61) | −1.4628 (−1.5234 to −1.4022) |
| Eastern Europe | 594 700 (523 998 to 677 041) | 215.61 (190.56 to 244.46) | 435 219 (376 396 to 502 434) | 135.51 (118.27 to 154.99) | −1.7063 (−1.802 to −1.6105) |
| Central Asia | 393 598 (307 056 to 491 080) | 590.89 (470.83 to 729.78) | 599 379 (468 435 to 742 531) | 623.66 (490.35 to 770.96) | 0.1859 (0.179 to 0.1927) |
| North Africa and Middle East | 1 173 033 (909 266 to 1 460 880) | 368.81 (293.17 to 455.91) | 2 474 183 (1 922 463 to 3 094 273) | 388.89 (304.75 to 483.49) | 0.1539 (0.09 to 0.218) |
| South Asia | 6 409 017 (4 920 320 to 8 087 847) | 623.88 (481.49 to 781.45) | 12 168 748 (9 299 440 to 15 368 472) | 645.12 (498.23 to 811.68) | 0.159 (−0.1508 to 0.4697) |
| Southeast Asia | 1 210 451 (955 077 to 1 503 783) | 274.88 (225.94 to 333.61) | 1 995 183 (1 608 079 to 2 455 921) | 284.89 (230.85 to 349.16) | 0.0962 (0.0586 to 0.1339) |
| East Asia | 5 673 367 (4 394 252 to 7 116 815) | 441.29 (349.9 to 549.84) | 6 155 944 (5 006 253 to 7 555 644) | 387.68 (308.67 to 477.94) | −0.444 (−0.4781 to −0.4099) |
| Oceania | 35 184 (27 316 to 45 345) | 543.08 (430.73 to 690.95) | 79 238 (62 040 to 101 486) | 587.08 (468.25 to 748.25) | 0.2689 (0.2334 to 0.3045) |
| Western Sub‐Saharan Africa | 1 402 185 (1 060 584 to 1 797 168) | 794.99 (618.33 to 1001.81) | 3 674 373 (2 770 187 to 4 722 196) | 839.55 (651.29 to 1057.38) | 0.2059 (0.1796 to 0.2323) |
| Eastern Sub‐Saharan Africa | 1 900 512 (1 438 107 to 2 441 533) | 1093.85 (849.57 to 1370.07) | 4 767 277 (3 635 371 to 6 158 953) | 1174.4 (904.04 to 1475.04) | 0.2747 (0.2184 to 0.3311) |
| Central Sub‐Saharan Africa | 612 166 (460 849 to 791 258) | 1184.76 (910.15 to 1512.89) | 1 547 129 (1 157 708 to 1 995 344) | 1195.56 (918.19 to 1511.29) | 0.0262 (0.014 to 0.0384) |
| Southern Sub‐Saharan Africa | 563 932 (430 265 to 725 818) | 1071.74 (835.28 to 1350.28) | 898 701 (689 765 to 1 145 952) | 1090.22 (844.68 to 1377.19) | 0.0714 (0.0541 to 0.0886) |
AAPC indicates average annual percent change; SDI, sociodemographic index; and UI, uncertainty interval.
Figure 1. Rheumatic heart disease–related prevalence for both sexes in 204 countries and territories.

A, The ASPR of rheumatic heart disease in 2019. B, The AAPC of rheumatic heart disease‐related prevalence between 1990 and 2019. AAPC indicates average annual percentage change; and ASPR, age‐standardized prevalence rate.
In terms of SDI, RHD prevalence cases were elevated across 5 SDI regions (Figure 2A and Figure S1), but the ASPR of RHD diminished in the high, high‐middle, and middle SDI regions (Table 1, Figure 2B). Figure 3 show the time trends of RHD prevalence by age groups. The populations experiencing RHD were older in higher SDI regions and concentrated in individuals 55 to 89 years of age in the high SDI region, but 10 to 39 years of age in the low SDI region (Figure 3A). From 1990 to 2019, the proportions of RHD prevalence increased in the population >80 years of age in the high SDI region, and were almost unchanged in the low SDI region (Figure 3B).
Figure 2. Progression of rheumatic heart disease burden between 1990 and 2019 by SDI quintile.
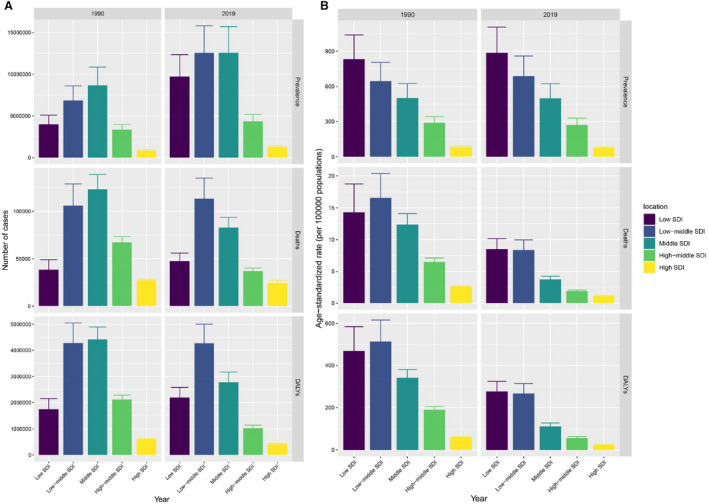
A, Prevalence, mortality, and DALYs case numbers between 1990 and 2019 in 5 SDI quintiles. B, ASPR, ASMR, and AMDR between 1990 and 2019 in 5 SDI quintiles. AMDR indicates age‐matched disability‐adjusted life–years rate; ASMR, age‐standardized mortality rate; ASPR, age‐standardized prevalence rate; DALYs, disability‐adjusted life‐years; and SDI, sociodemographic index.
Figure 3. The time trends of rheumatic heart disease burden from 1990 to 2019 by 19 age groups every 5 years in 5 SDI regions.

A, The time trends of rheumatic heart disease–related prevalence, mortality, and DALYs cases by age groups. B, The proportion change of rheumatic heart disease‐related prevalence, mortality, and DALYs cases in each age group. DALYs indicates disability‐adjusted life years; and SDI, sociodemographic index.
Decomposition Analysis of the Augmented ASPR
In all, we observed a marked rise in the global RHD ASPR, and within individual SDI quintiles, the largest frequency was in the low SDI regions, which produced the largest ASPR expansion between 1990 and 2019 (Figure 4, Table S1). Based on our analysis, the global population growth and epidemiological alterations among world populations increased the RHD burden by 70.58% and 25.37%, respectively, between 1990 and 2019 (Table S1). Sex groups showed similar trends. Much of this elevation in RHD ASPR was produced by population growth in the low (86.12%) and SDI quintiles (75.67%). In contrast, the population growth‐based contribution to enhanced RHD ASPR was relatively smaller (49.38%) in the high SDI region, where the contribution was most pronounced among the aging population (76.03%).
Figure 4. Alterations in rheumatic heart disease–related prevalence numbers based on the population‐level determinants of population growth, aging, and epidemiological alteration between 1990 and 2019 at the global level and by SDI quintile.

The black dot refers to the overall alteration induced by all 3 components. For individual components, the positive value magnitude represents a corresponding rise in prevalence numbers of rheumatic heart disease associated with the component. A negative value magnitude represents a matched reduction in prevalence numbers of rheumatic heart disease associated with the corresponding component. SDI indicates sociodemographic index.
In terms of the GBD regions, the top 3 increases in RHD ASPR were in South Asia, Eastern Sub‐Saharan Africa, and Western Sub‐Saharan Africa, and these were primarily due to population growth with 79.31%, 84.55%, and 89.95%, respectively. Alternately, the decreases in RHD ASPR were pronounced in Eastern and Central Europe, with contributions of epidemiological change of 151.36% and 226.03%, respectively. At the nation level, there were 84.31% countries/territories that exhibited positive contributions to the augmented RHD in RHD ASPR primarily due to population growth, and 15.69% with negative contributions due to the epidemiological change. The country with the main positive contribution to the RHD burden increase was India, with an overall difference of 4.31 million, followed by Nigeria and Pakistan. In addition, the top 3 countries with negative contributions were the Russian Federation, Ukraine, and Georgia.
RHD ASPR‐Based Frontier Analysis
Based on our observations, the effective difference (EF) for a specific SDI was smaller, with reduced variance, as SDI rose (Figure 5A and 5B, Table S2). The frontier ASPR trend became steady once SDI exceeded 0.48, and the alterations were almost increased once SDI exceeded 0.7 in 2019. The leading 10 countries/territories with the most EF from frontier (EF range: 1051.71–1217.54) were Uganda, Comoros, Congo (Brazzaville), Djibouti, Gabon, Angola, Zambia, Equatorial Guinea, South Africa, and Tanzania. These countries/territories displayed significantly elevated RHD ASPR, compared with other countries with similar sociodemographic conditions (Table S2). The leading 10 countries/territories with the least ASPR in terms of their location on the development spectrum, and thus the least EF (range, 0.53–8.77) were Jordan, Malta, Greece, Finland, Tunisia, Turkey, Denmark, Norway, Venezuela, and Sweden.
Figure 5. Frontier analysis involving SDI and rheumatic heart disease burden in 2019.

A and B, Frontier analysis with ASPR. C and D, Frontier analysis with ASMR. E and F, Frontier analysis with AMDR. The frontier is marked using a solid black color, and countries and territories are presented as dots. The leading 15 countries with the most EF (the highest ASPR of rheumatic heart disease gap from frontier) are marked in black. Examples of frontier countries with low SDI (<0.5) and reduced EF are marked in blue, and those with high SDI (>0.85) and relatively elevated EF for their development are marked in red. Red dots represent a reduction in rheumatic heart disease burden between 1990 and 2019. Blue dots represent a rise in rheumatic heart disease burden during the same duration of time. AMDR indicates age‐matched disability‐adjusted life‐years rate; ASMR, age‐standardized mortality rate; ASPR, age‐standardized prevalence rate; EF, effective difference; and SDI, sociodemographic index.
Mortality of RHD
Death numbers and age‐standardized mortality rates (ASMRs) of RHD were retrieved from GBD 2019 to describe the mortality trend of RHD. The total RHD‐related deaths decreased from 0.36 million (95% UI, 0.33–0.41 million) in 1990 to 0.31 million (95% UI, 0.26–0.34 million) in 2019 (Table 2, Figure S3). Additionally, ASMRs reduced from 8.94 (95% UI, 8.04–10.12) per 100 000 population in 1990 to 3.85 (95% UI, 3.29–4.29) per 100 000 population in 2019, a rate that corresponded to a −2.90% (95% CI, −2.96% to −2.84%) decrease in ASMR over our evaluation duration (Figure S3). In 2019, the ASMR increased with age in both sexes, with a steep rise after age 70 years, and a greater trend for women than men >85 years of age (Figure S2).
Table 2.
Rheumatic Heart Disease‐Related Mortality Between 1990 and 2019 for Both Sexes and All Locations, With AAPC Between 1990 and 2019
| Location | 1990 | 2019 | AAPC % (95% CI) 1990–2019 | ||
|---|---|---|---|---|---|
| Cases (95% UI) | Age‐standardized mortality per 100 000 population (95% UI) | Cases (95% UI) | Age‐standardized mortality per 100 000 population (95% UI) | ||
| Global | 362 160 (326 259 to 408 222) | 8.94 (8.04 to 10.12) | 305 651 (259 220 to 340 486) | 3.85 (3.29 to 4.29) | −2.9008 (−2.9632 to −2.8383) |
| Sex | |||||
| Women | 210 057 (185 677 to 238 266) | 9.65 (8.53 to 10.99) | 173 933 (140 652 to 208 089) | 4.06 (3.29 to 4.85) | −2.9724 (−3.0649 to −2.8799) |
| Men | 152 103 (125 111 to 184 940) | 8.19 (6.7 to 10) | 131 717 (113 445 to 159 904) | 3.62 (3.14 to 4.37) | −2.8157 (−2.9003 to −2.7311) |
| SDI | |||||
| High SDI | 27 205 (25 433 to 28 359) | 2.62 (2.45 to 2.73) | 24 621 (20 842 to 27 179) | 1.13 (0.98 to 1.24) | −2.8896 (−2.9919 to −2.7873) |
| High‐middle SDI | 67 300 (62 547 to 73 392) | 6.49 (6 to 7.1) | 36 960 (33 177 to 40 188) | 1.9 (1.7 to 2.07) | −4.3036 (−4.5582 to −4.0484) |
| Middle SDI | 123 159 (109 843 to 138 933) | 12.35 (10.91 to 14.1) | 82 948 (70 805 to 93 787) | 3.72 (3.17 to 4.23) | −4.1959 (−4.4933 to −3.8975) |
| Low‐middle SDI | 105 970 (89 332 to 129 005) | 16.55 (13.86 to 20.38) | 113 458 (85 229 to 135 030) | 8.35 (6.34 to 9.95) | −2.3177 (−2.5339 to −2.101) |
| Low SDI | 38 395 (29 963 to 48 956) | 14.28 (10.83 to 18.74) | 47 515 (39 422 to 55 974) | 8.5 (6.99 to 10.15) | −1.7761 (−1.8538 to −1.6984) |
| Region | |||||
| High‐income Asia Pacific | 3380 (3126 to 3546) | 1.92 (1.75 to 2.03) | 5107 (3839 to 5899) | 0.81 (0.64 to 0.93) | −2.9918 (−3.0871 to −2.8964) |
| High‐income North America | 8359 (7798 to 8718) | 2.34 (2.18 to 2.44) | 6787 (5932 to 7419) | 1 (0.89 to 1.09) | −2.9294 (−3.226 to −2.6318) |
| Western Europe | 17 565 (16 385 to 18 400) | 3.03 (2.82 to 3.17) | 16 187 (13 650 to 18 140) | 1.47 (1.27 to 1.63) | −2.422 (−2.599 to −2.2448) |
| Australasia | 578 (532 to 620) | 2.55 (2.34 to 2.74) | 614 (522 to 699) | 1.17 (1.01 to 1.33) | −2.6688 (−2.9569 to −2.38) |
| Andean Latin America | 748 (649 to 887) | 3.34 (2.89 to 4) | 632 (506 to 782) | 1.13 (0.9 to 1.39) | −3.787 (−4.0928 to −3.4801) |
| Tropical Latin America | 3130 (2979 to 3303) | 2.81 (2.66 to 2.98) | 2766 (2555 to 2962) | 1.15 (1.06 to 1.23) | −3.0151 (−3.2116 to −2.8182) |
| Central Latin America | 2791 (2676 to 2918) | 2.86 (2.72 to 3) | 1664 (1417 to 1923) | 0.7 (0.6 to 0.81) | −4.8383 (−5.0487 to −4.6274) |
| Southern Latin America | 2522 (2295 to 2737) | 5.89 (5.34 to 6.4) | 1858 (1536 to 2196) | 2.18 (1.81 to 2.57) | −3.3556 (−3.5731 to −3.1377) |
| Caribbean | 1424 (1149 to 1724) | 4.69 (3.81 to 5.74) | 1225 (888 to 1707) | 2.46 (1.78 to 3.44) | −2.1189 (−2.2434 to −1.9943) |
| Central Europe | 8805 (8519 to 9065) | 6.11 (5.9 to 6.3) | 2759 (2423 to 3110) | 1.3 (1.14 to 1.47) | −5.3925 (−5.6569 to −5.1273) |
| Eastern Europe | 13 647 (12 700 to 14 679) | 4.91 (4.56 to 5.28) | 4356 (3827 to 4906) | 1.32 (1.16 to 1.49) | −5.0568 (−6.0493 to −4.0538) |
| Central Asia | 3951 (3806 to 4103) | 7.27 (7 to 7.56) | 3287 (2833 to 3768) | 4.16 (3.64 to 4.69) | −1.915 (−2.0987 to −1.731) |
| North Africa and Middle East | 9881 (7779 to 13 383) | 4.5 (3.37 to 6.67) | 7397 (5899 to 9151) | 1.65 (1.35 to 2) | −3.386 (−3.5719 to −3.1997) |
| South Asia | 124 379 (102 650 to 154 024) | 20.67 (16.92 to 26.43) | 155 976 (119 891 to 187 680) | 11.18 (8.62 to 13.4) | −2.0762 (−2.3149 to −1.8369) |
| Southeast Asia | 10 568 (8996 to 12 250) | 3.67 (3.07 to 4.3) | 7771 (6687 to 8848) | 1.3 (1.11 to 1.48) | −3.4752 (−3.676 to −3.274) |
| East Asia | 135 079 (116 533 to 157 711) | 17.73 (15.24 to 20.79) | 72 401 (60 319 to 83 883) | 4.01 (3.34 to 4.63) | −5.1845 (−5.5173 to −4.8505) |
| Oceania | 817 (505 to 1252) | 20.45 (12.51 to 32.57) | 1504 (941 to 2235) | 16.06 (10.07 to 24.64) | −0.8355 (−0.9116 to −0.7593) |
| Western Sub‐Saharan Africa | 6247 (4797 to 8330) | 6.42 (4.95 to 8.54) | 5048 (4037 to 6494) | 2.42 (1.97 to 3.01) | −3.2599 (−3.3974 to −3.1222) |
| Eastern Sub‐Saharan Africa | 5018 (3936 to 6150) | 5.01 (4.03 to 6.03) | 4687 (3865 to 5569) | 2.45 (2.01 to 2.95) | −2.4192 (−2.4721 to −2.3663) |
| Central Sub‐Saharan Africa | 1830 (1291 to 2439) | 6.87 (4.82 to 9.29) | 2250 (1397 to 3631) | 3.96 (2.44 to 6.4) | −1.8898 (−1.9714 to −1.8082) |
| Southern Sub‐Saharan Africa | 1443 (1213 to 1628) | 3.94 (3.37 to 4.43) | 1374 (1155 to 1643) | 2.18 (1.86 to 2.56) | −1.8714 (−2.1029 to −1.6393) |
AAPC indicates average annual percent change; SDI, sociodemographic index; and UI, uncertainty interval.
In terms of SDI regions, the RHD‐related deaths increased in the low‐middle and low SDI regions, whereas the ASMRs decreased across all 5 regions (Table 2, Figure 2 and Figure S1). The populations experiencing RHD‐related deaths were older in the higher SDI regions, and were concentrated in populations 75 to 94 years of age in the high SDI regions, but 40 to 79 years of age in the low SDI regions (Figure 3A). From 1990 to 2019, the proportions of RHD mortality increased in the populations >85 years of age in the high SDI regions, and remained stable in the low SDI regions (Figure 3B).
Decomposition Analysis of the Decreased RHD‐Related Mortality
There was a marked global reduction in RHD mortality among each sex group between 1990 and 2019 (Figure S4, Table S3). Globally, epidemiological alteration contributed 543.85% to the decreased RHD‐related mortality burden, followed by the negative alterations of population growth (−241.47%) and aging (−202.38%) over the past 30 years. The RHD mortality reduction was most prominent in the middle SDI, then the high‐middle and high SDI regions, and it exhibited epidemiological change contributions in 356.67%, 227.57%, and 823.43%, respectively. In contrast, the RHD‐related deaths were enhanced in the low and low‐middle SDI regions, which were primarily due to population growth in 384.65% and 714.37%, respectively.
Apart from the 5 GBD regions, South Asia, high‐income Asia Pacific, Oceania, Central Sub‐Saharan Africa, and Australasia, there was a significant decrease in RHD‐related deaths among 16 GBD regions, and the largest decrease was observed in East Asia, Eastern Europe, Central Europe, Southeast Asia, North Africa, and the Middle East. The reductions of RHD‐related death within the GBD regions were primarily due to epidemiological alterations, whereas the increases were due to population growth and aging. RHD mortality was decreased in 68.63% countries/territories, and increased in 31.37%. The country with the most positive contribution to the decrease of RHD‐related death was China, with an overall difference of −62 883.8, followed by the Russian Federation, Poland, United States, and Thailand over the past 30 years. Alternately, the leading 5 countries with a negative contribution were India, Pakistan, Japan, Philippines, and Papua New Guinea.
ASMR‐Based Frontier Analysis
We observed an inverse relationship between SDI and RHD ASMR, and the EF was smaller with reduced variance as SDI rose (Figure 5C and 5D, Table S4). Overall, the RHD ASMR frontier trend became steady once SDI exceeded 0.65. Furthermore, the leading 10 countries with the least EFs from frontier were Somalia, Singapore, Guatemala, Colombia, Burkina Faso, Finland, Kuwait, El Salvador, South Korea, and Jordan (range, 0–0.05). In contrast, the leading 10 countries with the most EFs were Solomon Islands, Kiribati, Papua New Guinea, Pakistan, Vanuatu, Marshall Islands, Federated States of Micronesia, Nepal, Bhutan, and India (range, 10.97–20.22). Interestingly, ASMR in Somalia and Burkina Faso exhibited reduced overall difference from frontier with the low SDI of 0.081 and 0.257, respectively.
DALYs of RHD
DALYs of RHD described healthy life lost attributable to RHD obtained from GBD 2019. The overall RHD‐related DALYs in 1990 was 13.17 million (95% UI, 11.90–14.63 million), which reduced to 10.67 million (95% UI, 9.21–12.12 million) in 2019 (Table 3, Figure S5). The age‐matched DALY rates (AMDRs) diminished over time in both sexes, from 283.3 (95% UI, 255.92–315.25) per 100 000 population in 1990 to 132.88 (95% UI, 115.02–150.34) per 100 000 population in 2019, for both sexes combined (Figure S1). In 2019, the largest AMDR occurred in men between 85 and 89 years of age, whereas, the AMDR increased with age in women, with the highest rate in women ≥95 years of age (Figure S2).
Table 3.
Rheumatic Heart Disease–Related DALYs Between 1990 and 2019 for Both Sexes and All Locations, With AAPC
| Location | 1990 | 2019 | AAPC % (95% CI) 1990–2019 | ||
|---|---|---|---|---|---|
| Cases (95% UI) | Age‐standardized DALYs per 100 000 population (95% UI) | Cases (95% UI) | Age‐standardized DALYs per 100 000 population (95% UI) | ||
| Global | 13 168 339 (11 896 460 to 14 634 663) | 283.3 (255.92 to 315.25) | 10 673 882 (9 207 379 to 12 121 608) | 132.88 (115.02 to 150.34) | −2.6411 (−2.7351 to −2.547) |
| Sex | |||||
| Women | 7 420 707 (6 565 305 to 8 275 336) | 312.66 (276.91 to 349.79) | 5 840 425 (4 813 977 to 6 963 022) | 141.99 (117.47 to 168.62) | −2.7332 (−2.8254 to −2.6409) |
| Men | 5 747 632 (4 827 059 to 6 847 812) | 253.69 (211.75 to 303.99) | 4 833 457 (4 121 949 to 5 729 105) | 123.51 (105.78 to 145.93) | −2.4767 (−2.6859 to −2.2671) |
| SDI | |||||
| High SDI | 600 462 (575 234 to 625 971) | 59.79 (57.32 to 62.33) | 411 434 (372 564 to 448 624) | 22.83 (20.92 to 24.88) | −3.327 (−3.5016 to −3.1522) |
| High‐middle SDI | 2 113 937 (1 963 474 to 2 284 106) | 189.23 (175.68 to 204.82) | 1 021 630 (914 614 to 1 141 702) | 56.12 (49.74 to 63.59) | −4.0932 (−4.4883 to −3.6965) |
| Middle SDI | 4 421 690 (3 980 502 to 4 898 773) | 341.05 (305.6 to 380.52) | 2 773 059 (2 416 937 to 3 165 511) | 112.05 (97.74 to 127.84) | −3.8081 (−3.9807 to −3.6352) |
| Low‐middle SDI | 4 279 614 (3 616 977 to 5 051 571) | 513.47 (437.54 to 615.93) | 4 268 611 (3 371 726 to 5 010 497) | 266.56 (207.28 to 313.76) | −2.21 (−2.3867 to −2.0329) |
| Low SDI | 1 746 203 (1 412 097 to 2 152 066) | 468.56 (367.35 to 583.9) | 2 191 851 (1 819 051 to 2 580 119) | 275.5 (228.02 to 324.57) | −1.8307 (−1.9143 to −1.747) |
| Region | |||||
| High‐income Asia Pacific | 73 304 (69 883 to 76 740) | 38.12 (36.2 to 39.91) | 62 422 (51 829 to 69 511) | 13.2 (11.53 to 14.46) | −3.5991 (−3.8635 to −3.3339) |
| High‐income North America | 194 337 (183 998 to 204 865) | 57.43 (54.44 to 60.44) | 141 202 (126 973 to 157 248) | 23.79 (21.53 to 26.44) | −3.0607 (−3.3597 to −2.7608) |
| Western Europe | 352 807 (337 199 to 367 159) | 64.23 (61.56 to 66.7) | 229 976 (204 562 to 251 234) | 25.02 (22.79 to 27.15) | −3.1997 (−3.2725 to −3.1269) |
| Australasia | 13 894 (12 900 to 14 915) | 61.26 (56.89 to 65.87) | 11 475 (10 166 to 12 899) | 26.06 (23.14 to 29.22) | −2.9823 (−3.0949 to −2.8696) |
| Andean Latin America | 40 258 (33 235 to 48 582) | 131.17 (110.81 to 156.68) | 42 238 (31 307 to 56 115) | 67.4 (50.19 to 88.85) | −2.313 (−2.4608 to −2.165) |
| Tropical Latin America | 200 961 (173 005 to 236 911) | 143.31 (125.66 to 166.31) | 188 943 (147 039 to 244 654) | 79.03 (61.33 to 102.28) | −2.0353 (−2.0733 to −1.9974) |
| Central Latin America | 133 819 (122 109 to 149 329) | 106.86 (98.81 to 116.36) | 91 822 (72 936 to 116 667) | 36.38 (29.05 to 46.02) | −3.6708 (−3.8204 to −3.5209) |
| Southern Latin America | 69 219 (62 896 to 76 412) | 148.76 (135.48 to 163.39) | 46 525 (38 523 to 55 803) | 60.62 (49.8 to 73.88) | −3.0528 (−3.2108 to −2.8947) |
| Caribbean | 79 411 (63 861 to 97 311) | 234.94 (190.27 to 283.86) | 68 577 (50 937 to 90 777) | 142.02 (105.28 to 189.56) | −1.6492 (−1.7523 to −1.5459) |
| Central Europe | 261 700 (253 488 to 270 251) | 181.6 (175.91 to 187.54) | 63 338 (55 476 to 71 097) | 33.27 (29.12 to 37.55) | −5.9951 (−6.2851 to −5.7041) |
| Eastern Europe | 470 996 (434 271 to 506 432) | 172.93 (159.31 to 185.98) | 139 014 (122 226 to 156 951) | 44.73 (39.39 to 50.56) | −5.1855 (−6.1875 to −4.1729) |
| Central Asia | 184 632 (174 382 to 195 997) | 310 (293.47 to 328.01) | 147 633 (125 870 to 172 889) | 161.24 (138.56 to 187.45) | −2.3728 (−2.589 to −2.1561) |
| North Africa and Middle East | 522 703 (428 563 to 639 109) | 173.09 (139.63 to 223.62) | 379 365 (305 217 to 469 076) | 67.07 (54.15 to 82.44) | −3.2314 (−3.3629 to −3.0997) |
| South Asia | 5 095 437 (4 232 198 to 6 113 041) | 630.67 (525.16 to 772.15) | 5 755 423 (4 558 366 to 6 820 455) | 348.46 (272.37 to 412.24) | −1.9789 (−2.3701 to −1.5862) |
| Southeast Asia | 499 664 (436 562 to 570 786) | 128.46 (111.34 to 146.62) | 397 460 (338 912 to 459 405) | 58.53 (50.19 to 67.44) | −2.6648 (−2.8333 to −2.4961) |
| East Asia | 4 093 569 (3 542 008 to 4 733 994) | 423.47 (367.15 to 488.45) | 1 778 091 (1 498 955 to 2 041 204) | 94.12 (79.47 to 108.54) | −5.3135 (−5.7984 to −4.8262) |
| Oceania | 40 086 (25 677 to 58 852) | 761.25 (483.27 to 1156.12) | 74 505 (48 602 to 107 655) | 627.42 (404.06 to 918.03) | −0.6717 (−0.7652 to −0.5782) |
| Western Sub‐Saharan Africa | 312 294 (242 920 to 399 993) | 214.21 (169.38 to 274.76) | 376 692 (285 463 to 495 503) | 105.13 (82.44 to 132.56) | −2.4193 (−2.4794 to −2.3591) |
| Eastern Sub‐Saharan Africa | 330 882 (260 907 to 409 483) | 210.19 (169.74 to 254.39) | 423 969 (319 459 to 558 805) | 122.36 (96.1 to 152.73) | −1.8623 (−1.9289 to −1.7957) |
| Central Sub‐Saharan Africa | 103 931 (77 325 to 131 984) | 258.76 (193.58 to 328.86) | 155 369 (110 995 to 213 796) | 161.3 (114.77 to 227.69) | −1.6346 (−1.7016 to −1.5676) |
| Southern Sub‐Saharan Africa | 94 435 (77 376 to 112 917) | 198.71 (165.41 to 232.82) | 99 845 (78 748 to 123 988) | 128.96 (103.43 to 158.74) | −1.6075 (−1.8841 to −1.3301) |
AAPC indicates average annual percent change; DALYs, disability‐adjusted life‐years; SDI, sociodemographic index; and UI, uncertainty interval.
Similar to mortality trend, elevated SDI was correlated with reduced RHD AMDRs, with values lower than the global rate in the 3 highest SDI regions, and higher than the global rate in the 2 lowest SDI regions (Figure 3 and Figure S1). The high and low SDI regions exhibited the least and most AMDRs, with 22.83 (95% UI, 20.92–24.88) per 100 000 population and 275.50 (95% UI, 228.02–324.57) per 100 000 population, respectively, in 2019 (Table 3, Figure S5). However, the largest average annual percentage change decrease between 1990 and 2017 occurred within the high‐middle SDI region (−4.09% [95% CI, −4.49% to −3.70%]). Similar to mortality trend, the populations occurring RHD‐related health loss were older in the higher SDI regions, with the increased proportion of DALYs >80 years, and the proportion kept stable in the low SDI region (Figure 3).
Decomposition Analysis of the Reduced DALYs
Decomposition analysis revealed that epidemiological alteration demonstrated a considerable positive contribution of 379.18% to the decreased DALYs burden between 1990 and 2019. However, population growth (−192.71%) and aging (−86.48%) showed negative contributions worldwide (Table S5, Figure S6). Women contributed more to DALYs burden reduction than men, and the decomposition analysis was similar to the global results. In terms of the SDI regions, apart from the low SDI region, which had a negative DALYs decreasing effect (445 648.4 cases), all other regions showed positive contributions (Figure S6). In the 4 higher SDI regions, most of the DALYs reductions were driven by epidemiological changes. The contribution of epidemiological changes to the overall DALYs was most prominent in the low‐middle SDI region (26776.57%), followed by the middle (259.77%%), high (254.98%), and high‐middle regions (182%) (Table S5). Although aging and population growth showed negative contributions in the higher SDI regions, DALYs numbers were enhanced in the low SDI region between 1990 and 2019, with a negative epidemiological change contribution of −271.85%, and notable positive contributions via population growth (359.2%) and aging (12.65%).
The decomposition analysis of the DALYs number alterations between 1990 and 2019 in the GBD regions and at the nations level are presented in Table S5. In terms of the GBD regions, RHD DALYs decomposition revealed that the decrease was mainly brought on by epidemiological alteration, and there was an enhanced RHD DALYs burden in South Asia, Eastern Sub‐Saharan Africa, Western Sub‐Saharan Africa, Central Sub‐Saharan Africa, Oceania, Southern Sub‐Saharan Africa, and Andean Latin America, where the increased burden was affected by population growth and aging. At the nations level, the country with the main positive contribution to the RHD DALYs burden reduction was China, with an overall difference of −2.3 million, followed by the Russian Federation and Poland, whereas the top 3 countries with negative contributions were Pakistan, India, and the Philippines.
AMDR‐Based Frontier Analysis
Despite the presence of an inverse relationship between SDI and AMDR, we observed considerable heterogeneity among countries with similar SDI (Figure 5E and 5F, Table S6). In all, the AMDR exhibited a decreasing trend with a rise in SDI, and the frontier remained steady once SDI was >0.65. The frontier countries/territories with low SDI (<0.5) and reduced EFs in 2019 were Somalia, Niger, Mozambique, Burkina Faso, and Honduras. Conversely, countries/territories with higher SDI (>0.85) and relatively enhanced EFs included the United States, Germany, Belgium, San Marino, and United Arab Emirates. Moreover, the leading 10 countries/territories with the least EFs from frontier were Somalia, Burkina Faso, Colombia, Finland, Jordan, South Korea, Greece, Iceland, Singapore, and Turkey in 2019 (range, 0–2.86). In contrast, the leading 10 countries/territories with the most EFs were Solomon Islands, Kiribati, Papua New Guinea, Vanuatu, Marshall Islands, Federated States of Micronesia, Pakistan, Nauru, Tuvalu, and India (range, 327.63–751.03). Similar to the ASMR frontier analysis results, Somalia and Burkina Faso with lower SDI exhibited the least overall difference.
Please refer to Data S1 for a summary of the RHD ASPR (Table S7, Figures S7 and S8), mortality (Table S8, Figures S7 and S9), and DALYs results (Table S9, Figures S7 and S10) at the GBD regional and national levels.
Discussion
This study revealed that the RHD ASPR burden increased mildly, whereas RHD‐related ASMR and AMDR decreased significantly, from 1990 to 2019. In 2019, there were >40.50 million ASPRs, nearly 0.31 million RHD‐related ASMRs, and 10.67 million RHD‐related AMDRs worldwide. The proportion of RHD was primarily composed of women, and the ages were concentrated among adolescents and young adults. ASMR and AMDR were mainly concentrated among the older population. Moreover, the RHD burden differed in terms of the developmental and geographical status. Decomposition analysis demonstrated that the decrease in the RHD burden was primarily driven by epidemiological change; however, it was negatively affected by population growth and aging. Frontier analysis revealed that the ASPR, ASMR, and AMDR were inversely associated with SDI, although there was substantial heterogeneity among countries/territories with similar SDIs. Countries such as Somalia and Burkina Faso, with a lower SDI, showed the lowest overall difference from the frontier boundaries of mortality and DALYs.
Multiple cross‐cutting themes were obvious in our analyses. Firstly, demographic expansion (population growth and aging) negatively impacted enhancements in RHD ASPR, ASMR, and AMDR in the lower‐income regions. Secondly, the underlying epidemiologic trends (reduced ASPR, as well as RHD‐related ASMR and AMDR) dramatically affected the influence of population growth and aging in the higher‐income regions. Thirdly, although there was substantial heterogeneity among countries with similar SDIs, ASPR, ASMR, and AMDR were negatively correlated with SDI. The overall increase in ASPR of RHD is in large part driven by population growth, followed by epidemiological change and aging. Population growth was the main force of RHD burden known for high fertility and lower life expectancy, especially in lower SDI regions. 17 , 18 , 19 Our study also found that populations experiencing RHD were younger in the lower SDI regions. In high SDI nations, aging was the prominent driver with higher life expectancies, 18 which was consistent with increased proportion of RHD cases in older individuals. Higher SDI countries have greater financial resources to establish better health care systems, and thereby implement more effective and timely treatments. Although epidemiological change improved RHD burden in 3 higher SDI regions, aging and population growth counteracted those improvements. These reveal that establishing strategies to control fertility and completing health care systems to prolong lifespan should be considered in lower SDI nations. 20
Several studies analyzed the RHD burden using GBD 2019, 21 , 22 , 23 but they mainly described the global RHD landscape, and none of them performed decomposition or frontier analysis. Consistent with the reported results, the RHD disease burden was related to regional and national income levels, with a moderate elevation in ASPR, ASMR, and AMDR. Our frontier analysis revealed that multiple countries/territories at all levels of development with RHD prevalence, mortality, and DALYs were far from the frontier (with a relatively large EF from frontier). This indicates the presence of unrealized opportunities to close the RHD burden gap. Overall, the greatest positive contribution to the decline in RHD ASPR, ASMR, and AMDR was epidemiological change, whereas population growth and aging brought negative effects. The 2 most populous countries, India and China, produced the most ASPRs, ASMRs, and AMDRs in 2019, whereas developed countries in high‐income regions maintained low RHD burden. This was consistent with the results reported by Ordunez et al. 24 However, our further analysis confirmed that China's contribution to the improvement of DALYs was the largest. Interestingly, Somalia and Burkina Faso, with lower SDI, showed the lowest overall difference from the frontier boundaries of ASMRs and AMDRs. This suggested that the prevention and management of RHD in some countries/territories were effective, for example, the generation of a health care system, economic development, urbanization, and financial investment. 25 , 26 , 27 , 28 These measures can be recommended for areas with similar SDIs, particularly in low‐ and middle‐income countries.
Notably, several prior investigations revealed that RHD is predominant among women, particularly childbearing‐age women, 29 , 30 which corroborates our research conclusions. Lv et al reported that childbearing‐age women exhibited enhanced RHD burdens in lower SDI areas compared with wealthier areas. 22 According to the GBD 2019 data, we demonstrated a moderate increase in RHD ASPR, ASMR, and AMDR in low SDI regions, with population growth being the major contributing factor. We also revealed that women, not men, greatly contributed to the decline in RHD burden, and the higher SDI regions showed positive contributions, primarily due to epidemiological changes, which offset the effects of demographic alterations. Because fertility rates are generally lower in wealthy regions and higher in low‐income regions, the birth number and quality in these regions can have a substantial impact on the global population. 3 These results suggested that women of childbearing age require additional attention, and we recommend routine performance of cardiac ultrasound screening and RHD prevention.
This investigation also revealed a relatively elevated RHD ASPR among children and adolescents, as well as an enhanced ASMR and AMDR among the older population, particularly in the lower SDI regions, 23 which requires further attention. This may be coupled with inadequate education, unawareness, socioeconomic restrictions, and lack of access to medical care in remote areas for children, and in poverty‐stricken areas for older individuals. 2 , 3 Prevention policies and institutionalized planning are critical for RHD management in endemic countries. Hence, it is recommended that global resource allocation must benefit children and adolescents in low‐income areas and prevent RHD before it develops. In addition, there must be augmented RHD screening and treatment among the older population. This may aid in the prevention and early intervention of RHD in children and adolescents in lower SDI regions, as well as enhance lifespan among the older population.
GBD modeling for RHD has been changed in the past editions, which may affect burden estimation considerably. Since GBD 2015, clinical confirmation of echocardiographic assessment was added to the definition of RHD, which possibly impacts the prevalence of RHD with more thorough data sources. 8 , 10 Beginning in GBD 2017, remission from RHD was estimated in both the endemic and nonendemic regions with disease model Bayesian meta‐regression, which revealed more accurate disease burden. 11 Modeling strategy was updated with a standard cause of death ensemble modeling approach to model deaths from RHD in GBD 2017, and this continues to be applied in GBD 2019. 8 , 11 For the input data in 2019, vital registration and surveillance data were used to model RHD. 8 GBD 2019 outliered ICD‐8 and ICD‐9 BTL data points that were inconsistent with the rest of the data and created implausible time trends. It also outliered data points that were too high after the redistribution process in several age groups. In addition, GBD 2019 outliered verbal autopsy data points in Nepal and Pakistan that created an implausibly low cause fraction.
There are certain limitations to this study. First, this is a macro evaluation of the global, regional, and national epidemiological trends in RHD, and as such, it may not capture trends at the micro level. Although GBD methodology and results are regarded as state of the art, rigorous, and reliable, the accuracy of the GBD estimates is limited by the quality and availability of each country's vital registration system and a large number of undefined RHD cases in their disease registry data. For numerous countries with limited primary data, GBD estimates heavily rely on the modeling process, predictive covariates, trends from the past, or trends from neighboring countries, resulting in some uncertainty. Moreover, variability and inconsistencies in data collection and tools across countries and over time may impact geographic differences and temporal trends. In this investigation, our decomposition analysis only considered the 3 causes reported by the GBD framework; however, there may be other modulators. In our analysis of sex differences, sex is biologically/physiologically defined based on physical and physiological features. However, due to the limitation of the data set, we did not analyze the influence of gender, which refers to the socially constructed roles, behaviors, and identities of women, men, and gender‐diverse people. Sex and gender both impact disease prevalence and treatment outcome, 31 and studies with gender analysis are needed in the future.
Conclusions
In summary, RHD has a substantial global toll, although RHD‐related ASMR and AMDR have largely been reduced due to demographic and epidemiological alterations, with a marked variation among different geographic regions. RHD burden was more pronounced in regions of low SDI with subpar health system performance, where the children, adolescents, childbearing‐age women, and an older population require special attention. In regard to countries such as Somalia and Burkina Faso that are particularly successful in managing adverse outcomes from RHD given their state of development, their policies may serve as a template for other countries.
Sources of Funding
None.
Disclosures
None.
Supporting information
Acknowledgments
All authors have read and approved the final article. T.S. and Q.‐W.Z. are the corresponding authors. T.S. and R.R. were responsible for the article writing, checking, and reviewing. Q.‐W.Z. and X.L. contributed to study screening, data extraction, and analysis. Y.Z., M.T., and B.H. reviewed the article and participated in the discussion section.
This article was sent to Mahasin S. Mujahid, PhD, MS, FAHA, Associate Editor, for review by expert referees, editorial decision, and final disposition.
Supplemental Material is available at https://www.ahajournals.org/doi/suppl/10.1161/JAHA.122.028921
For Sources of Funding and Disclosures, see page 16.
Contributor Information
Qing‐Wei Zhang, Email: tingtingshu2014@gmail.com, Email: zhangqingweif@hotmail.com.
Tingting Shu, Email: tingtingshu2014@gmail.com.
References
- 1. Marijon E, Mirabel M, Celermajer DS, Jouven X. Rheumatic heart disease. Lancet. 2012;379:953–964. doi: 10.1016/S0140-6736(11)61171-9 [DOI] [PubMed] [Google Scholar]
- 2. Rothenbühler M, O'Sullivan CJ, Stortecky S, Stefanini GG, Spitzer E, Estill J, Shrestha NR, Keiser O, Jüni P, Pilgrim T. Active surveillance for rheumatic heart disease in endemic regions: a systematic review and meta‐analysis of prevalence among children and adolescents. Lancet Glob Health. 2014;2:e717–e726. doi: 10.1016/S2214-109X(14)70310-9 [DOI] [PubMed] [Google Scholar]
- 3. Marijon E, Mocumbi A, Narayanan K, Jouven X, Celermajer DS. Persisting burden and challenges of rheumatic heart disease. Eur Heart J. 2021;42:3338–3348. doi: 10.1093/eurheartj/ehab407 [DOI] [PubMed] [Google Scholar]
- 4. Remenyi B, Carapetis J, Wyber R, Taubert K, Mayosi BM. Position statement of the World Heart Federation on the prevention and control of rheumatic heart disease. Nat Rev Cardiol. 2013;10:284–292. doi: 10.1038/nrcardio.2013.34 [DOI] [PubMed] [Google Scholar]
- 5. Okello E, Beaton A. Targeted investment needed to end rheumatic heart disease in Africa. Lancet Glob Health. 2021;9:e887–e888. doi: 10.1016/S2214-109X(21)00215-1 [DOI] [PubMed] [Google Scholar]
- 6. Vervoort D, Genetu A, Kpodonu J. Policy prioritisation to address the global burden of rheumatic heart disease. Lancet Glob Health. 2021;9:e1212. doi: 10.1016/S2214-109X(21)00352-1 [DOI] [PubMed] [Google Scholar]
- 7. Kumar RK, Antunes MJ, Beaton A, Mirabel M, Nkomo VT, Okello E, Regmi PR, Reményi B, Sliwa‐Hähnle K, Zühlke LJ, et al. Contemporary diagnosis and management of rheumatic heart disease: implications for closing the gap: a scientific statement from the American Heart Association. Circulation. 2020;142:e337–e357. doi: 10.1161/CIR.0000000000000921 [DOI] [PubMed] [Google Scholar]
- 8. GBD 2019 Diseases and Injuries Collaborators . Global burden of 369 diseases and injuries in 204 countries and territories, 1990‐2019: a systematic analysis for the Global Burden of Disease Study 2019. Lancet. 2020;396:1204–1222. doi: 10.1016/S0140-6736(20)30925-9 [DOI] [PMC free article] [PubMed] [Google Scholar]
- 9. GBD 2019 Risk Factors Collaborators . Global burden of 87 risk factors in 204 countries and territories, 1990‐2019: a systematic analysis for the Global Burden of Disease Study 2019. Lancet. 2020;396:1223–1249. doi: 10.1016/S0140-6736(20)30752-2 [DOI] [PMC free article] [PubMed] [Google Scholar]
- 10. Watkins DA, Johnson CO, Colquhoun SM, Karthikeyan G, Beaton A, Bukhman G, Forouzanfar MH, Longenecker CT, Mayosi BM, Mensah GA, et al. Global, regional, and national burden of rheumatic heart disease, 1990‐2015. N Eng J Med. 2017;377:713–722. doi: 10.1056/NEJMoa1603693 [DOI] [PubMed] [Google Scholar]
- 11. GBD 2017 DALYs and HALE Collaborators . Global, regional, and national disability‐adjusted life‐years (DALYs) for 359 diseases and injuries and healthy life expectancy (HALE) for 195 countries and territories, 1990–2017: a systematic analysis for the Global Burden of Disease Study 2017. Lancet. 2018;392:1859–1922. doi: 10.1016/S0140-6736(18)32335-3 [DOI] [PMC free article] [PubMed] [Google Scholar]
- 12. Global Burden of Disease Cancer Collaboration ; Fitzmaurice C, Abate D, Abbasi N, Abbastabar H, Abd‐Allah F, Abdel‐Rahman O, Abdelalim A, Abdoli A, Abdollahpour I, et al. Global, regional, and national cancer incidence, mortality, years of life lost, years lived with disability, and disability‐adjusted life‐years for 29 cancer groups, 1990 to 2017: a systematic analysis for the Global Burden of Disease Study. JAMA Oncol. 2019;5:1749–1768. doi: 10.1001/jamaoncol.2019.2996 [DOI] [PMC free article] [PubMed] [Google Scholar]
- 13. GBD 2017 Disease and Injury Incidence and Prevalence Collaborators . Global, regional, and national incidence, prevalence, and years lived with disability for 354 diseases and injuries for 195 countries and territories, 1990‐2017: a systematic analysis for the Global Burden of Disease Study 2017. Lancet. 2018;392:1789–1858. doi: 10.1016/S0140-6736(18)32279-7 [DOI] [PMC free article] [PubMed] [Google Scholar]
- 14. GBD 2017 Gastro‐oesophageal Reflux Disease Collaborators . The global, regional, and national burden of gastro‐oesophageal reflux disease in 195 countries and territories, 1990‐2017: a systematic analysis for the Global Burden of Disease Study 2017. Lancet Gastroenterol Hepatol. 2020;5:561–581. doi: 10.1016/S2468-1253(19)30408-X [DOI] [PMC free article] [PubMed] [Google Scholar]
- 15. Golabi P, Paik JM, AlQahtani S, Younossi Y, Tuncer G, Younossi ZM. Burden of non‐alcoholic fatty liver disease in Asia, the Middle East and North Africa: data from Global Burden of Disease 2009‐2019. J Hepatol. 2021;75:795–809. doi: 10.1016/j.jhep.2021.05.022 [DOI] [PubMed] [Google Scholar]
- 16. Xie Y, Bowe B, Mokdad AH, Xian H, Yan Y, Li T, Maddukuri G, Tsai CY, Floyd T, Al‐Aly Z. Analysis of the Global Burden of Disease Study highlights the global, regional, and national trends of chronic kidney disease epidemiology from 1990 to 2016. Kidney Int. 2018;94:567–581. doi: 10.1016/j.kint.2018.04.011 [DOI] [PubMed] [Google Scholar]
- 17. Lee R, Mason A. Is low fertility really a problem? Population aging, dependency, and consumption. Science. 2014;346:229–234. doi: 10.1126/science.1250542 [DOI] [PMC free article] [PubMed] [Google Scholar]
- 18. Ezeh AC, Bongaarts J, Mberu B. Global population trends and policy options. Lancet. 2012;380:142–148. doi: 10.1016/S0140-6736(12)60696-5 [DOI] [PubMed] [Google Scholar]
- 19. Population and fertility by age and sex for 195 countries and territories, 1950–2017: a systematic analysis for the Global Burden of Disease Study 2017. Lancet. 2018;392:1995–2051. doi: 10.1016/S0140-6736(18)32278-5 [DOI] [PMC free article] [PubMed] [Google Scholar]
- 20. Musoke D, Gibson L, Mukama T, Khalil Y, Ssempebwa JC. Nottingham Trent University and Makerere University School of Public Health partnership: experiences of co‐learning and supporting the healthcare system in Uganda. Global Health. 2016;12:11. doi: 10.1186/s12992-016-0148-x [DOI] [PMC free article] [PubMed] [Google Scholar]
- 21. Ghamari SH, Abbasi‐Kangevari M, Saeedi Moghaddam S, Aminorroaya A, Rezaei N, Shobeiri P, Esfahani Z, Malekpour MR, Rezaei N, Ghanbari A, et al. Rheumatic heart disease is a neglected disease relative to its burden worldwide: findings from Global Burden of Disease 2019. J Am Heart Assoc. 2022;11:e025284. doi: 10.1161/JAHA.122.025284 [DOI] [PMC free article] [PubMed] [Google Scholar]
- 22. Lv M, Jiang S, Liao D, Lin Z, Chen H, Zhang J. Global burden of rheumatic heart disease and its association with socioeconomic development status, 1990‐2019. Eur J Prevent Cardiol. 2022;29:1425–1434. doi: 10.1093/eurjpc/zwac044 [DOI] [PubMed] [Google Scholar]
- 23. Ou Z, Yu D, Liang Y, Wu J, He H, Li Y, He W, Gao Y, Wu F, Chen Q. Global burden of rheumatic heart disease: trends from 1990 to 2019. Arthritis Res Ther. 2022;24:138. doi: 10.1186/s13075-022-02829-3 [DOI] [PMC free article] [PubMed] [Google Scholar]
- 24. Ordunez P, Martinez R, Soliz P, Giraldo G, Mujica OJ, Nordet P. Rheumatic heart disease burden, trends, and inequalities in the Americas, 1990‐2017: a population‐based study. Lancet Glob Health. 2019;7:e1388–e1397. doi: 10.1016/S2214-109X(19)30360-2 [DOI] [PubMed] [Google Scholar]
- 25. Juričič M, Truden Dobrin P, Paulin S, Seher Zupančič M, Bratina N. Health care system for children and adolescents in Slovenia. J Pediat. 2016;177s:S173–S186. doi: 10.1016/j.jpeds.2016.04.054 [DOI] [PubMed] [Google Scholar]
- 26. Angkurawaranon C, Jiraporncharoen W, Chenthanakij B, Doyle P, Nitsch D. Urbanization and non‐communicable disease in Southeast Asia: a review of current evidence. Public Health. 2014;128:886–895. doi: 10.1016/j.puhe.2014.08.003 [DOI] [PubMed] [Google Scholar]
- 27. Horwood PF, Tarantola A, Goarant C, Matsui M, Klement E, Umezaki M, Navarro S, Greenhill AR. Health challenges of the Pacific region: insights from history, geography, social determinants, genetics, and the microbiome. Front Immunol. 2019;10:2184. doi: 10.3389/fimmu.2019.02184 [DOI] [PMC free article] [PubMed] [Google Scholar]
- 28. Coffey PM, Ralph AP, Krause VL. The role of social determinants of health in the risk and prevention of group a streptococcal infection, acute rheumatic fever and rheumatic heart disease: a systematic review. PLoS Negl Trop Dis. 2018;12:e0006577. doi: 10.1371/journal.pntd.0006577 [DOI] [PMC free article] [PubMed] [Google Scholar]
- 29. Sriha Belguith A, Koubaa Abdelkafi A, El Mhamdi S, Ben Fredj M, Abroug H, Ben Salah A, Bouanene I, Hassine F, Amara A, Bhiri S, et al. Rheumatic heart disease in a developing country: incidence and trend (Monastir; Tunisia: 2000‐2013). Int J Cardiol. 2017;228:628–632. doi: 10.1016/j.ijcard.2016.11.249 [DOI] [PubMed] [Google Scholar]
- 30. Carapetis JR. The stark reality of rheumatic heart disease. Eur Heart J. 2015;36:1070–1073. doi: 10.1093/eurheartj/ehu507 [DOI] [PubMed] [Google Scholar]
- 31. Heidari S, Babor TF, De Castro P, Tort S, Curno M. Sex and gender equity in research: rationale for the SAGER guidelines and recommended use. Res Int Peer Rev. 2016;1:2. doi: 10.1186/s41073-016-0007-6 [DOI] [PMC free article] [PubMed] [Google Scholar]
- 32. Das GP. Standardization and decomposition of rates from cross‐classified data. Genus. 1994;50:171–196. [PubMed] [Google Scholar]
- 33. Chevan A, Sutherland M. Revisiting Das Gupta: refinement and extension of standardization and decomposition. Demography. 2009;46:429–449. doi: 10.1353/dem.0.0060 [DOI] [PMC free article] [PubMed] [Google Scholar]
- 34. GBD 2015 Healthcare Access and Quality Collaborators . Healthcare access and quality index based on mortality from causes amenable to personal health care in 195 countries and territories, 1990–2015: a novel analysis from the Global Burden of Disease Study 2015. Lancet. 2017;390:231–266. doi: 10.1016/S0140-6736(17)30818-8 [DOI] [PMC free article] [PubMed] [Google Scholar]
Associated Data
This section collects any data citations, data availability statements, or supplementary materials included in this article.