

Abstract
Background
In the past few decades, diabetes‐related cardiovascular mortality has been steadily declining. However, the impact of the COVID19 pandemic on this trend has not been previously defined.
Methods and Results
Diabetes‐related cardiovascular mortality data were extracted for each year between 1999 and 2020 from the Centers for Disease Control and Prevention Wide‐Ranging Online Data for Epidemiologic Research (WONDER) database. Regression analysis was used to calculate the trend in the 2 decades before the pandemic (1999–2019) and thereby estimate the excess cardiovascular mortality in 2020. There was a 29.2% fall in the diabetes‐related cardiovascular age‐adjusted mortality rate between 1999 to 2019, largely driven by a 41% decrease in ischemic heart disease deaths. In comparison to 2019, there was an overall 15.5% increase in the diabetes‐related cardiovascular age‐adjusted mortality rate in the first year of the pandemic, mainly due to a 14.1% rise in ischemic heart disease deaths. Younger patients (under 55 years) and the Black population experienced the greatest increase in diabetes‐related cardiovascular age‐adjusted mortality rate (24.0% and 25.3%, respectively). Trend analysis estimated 16 009 excess diabetes‐related cardiovascular deaths in 2020, with the majority due to ischemic heart disease (8504). Black and Hispanic or Latino populations had at least one‐fifth of their 2020 diabetes‐related cardiovascular age‐adjusted mortality rate as excess deaths (22.3% and 20.2%, respectively).
Conclusions
There was a sharp rise in diabetes‐related cardiovascular mortality during the first pandemic year. Black, Hispanic or Latino, and young people showed the largest increases in diabetes‐related cardiovascular mortality. Targeted health policies could help address the disparities observed in this analysis.
Keywords: cardiovascular mortality, COVID‐19, diabetes, ischemic heart disease, racial disparities
Subject Categories: Cardiovascular Disease, Risk Factors, Epidemiology
Nonstandard Abbreviations and Acronyms
- AAMR
age‐adjusted mortality rate
- CDC
Centers for Disease Control and Prevention
- IHD
ischemic heart disease
- WONDER
Wide‐Ranging Online Data for Epidemiologic Research
Clinical Perspective.
What Is New?
This analysis reveals an acute increase in diabetes‐related cardiovascular mortality during the first pandemic year.
Individuals who were younger, Black, and Hispanic or Latino, and people from urban areas had the greatest rise in diabetes‐related cardiovascular mortality.
What Are the Clinical Implications?
Targeted health policies could support addressing the disparities observed in this study as health care provision returns to normal.
Cardiovascular disease (CVD) affects almost one third of people with diabetes globally, and it accounts for about 50% of the mortality in this population. 1 Although the prevalence of diabetes has increased both globally and in the United States in the past few decades, CVD mortality among patients with diabetes has declined. 2 This is thought to be related to better screening for CVD, better primary and secondary prevention in people with diabetes, and better risk factor control in addition to advances in therapeutics for CVDs that particularly affect patients with diabetes. 3 The emergence of the COVID‐19 pandemic has represented an additional threat to the health of people with diabetes. Specifically, diabetes has been associated with higher COVID‐19 severity, morbidity, and in‐hospital mortality. 4
Furthermore, as a consequence of other public health measures including restricted access to routine health care services and patient reluctance to present to hospitals, non‐COVID mortality also increased in parallel with the COVID pandemic. 5 Estimates suggest more than 52 000 of the excess deaths (~13%) observed in the United States during the first year of the pandemic were non‐COVID‐19 related. 6 Prior literature has suggested that the COVID pandemic has magnified cardiovascular health disparities among adults of lower socioeconomic status and among racial and ethnic minority groups, particularly Black adults, in the United States. 7 , 8 It is unclear whether the improvements observed in reducing CVD mortality in patients with diabetes have been reversed during the COVID pandemic, and whether this has disproportionally affected different age, sex, or racial and ethnic subgroups.
Therefore, in this analysis, the Centers for Disease Control and Prevention (CDC), multiple cause of death data set was examined to gain a better understanding of the impact of the COVID pandemic on historical trends in both overall and cause‐specific diabetes‐related CVD mortality and whether specific age, sex, or racial and ethnic subgroups were disproportionally affected by any changes in CVD trends.
METHODS
Institutional review board approval and individual consent were not applicable because this analysis is based on publicly available database at a population level that does not not involve living human subjects.
Data Availability
The data that support the findings of this study are available from the corresponding author upon reasonable request.
Data Source
Developed by the CDC, the Wide‐Ranging Online Data for Epidemiologic Research (WONDER) databases provide free access to public health information and statistical research data, including mortality, through the multiple cause of death database. 9 This registry provided national, county level, population and mortality death certificate data between 1999 to 2020, excluding US nonresidents and fetal deaths. A single underlying cause of death, in addition to demographic data and up to 20 multiple causes, are included on each death certificate. The underlying cause of death is defined per the World Health Organization definition “the disease or injury which initiated the train of events leading directly to death, or the circumstances of the accident or violence which produced the fatal injury”. The conditions entered on the cause of death section of the death certificate are used to choose a single underlying cause of death, if there was more than 1, based primarily on the World Health Organization definition. The International Classification of Diseases, Tenth Revision (ICD‐10) was used to categorize the mortality causes in this database.
Study Sample
All records with CVD as the underlying cause of death (I00–I99) with diabetes (E10–E14) among the multiple cause of death were included. Similarly, mortalities with diabetes among the multiple cause of death with either ischemic heart disease (IHD; I20–I25), hypertensive disease (HTD; I10–I15), heart failure (HF; I50), or cerebrovascular disease (I60–I69) as an underlying cause of death were also included. In other words, the sample consisted of those who primarily died of CVD with diabetes contributing to their mortality. In addition, the sample was stratified by sex, age group, ethnicity, race, and urbanization status.
Race and ethnicity stratification was undertaken to examine the association of the COVID‐19 pandemic with diabetes‐related CVD mortality in these groups identifying any related disparities by race and ethnicity. Classification of racial groups was based on all the available categories from the WONDER database including American Indian or Alaskan Native, Asian or Pacific Islander, Black, and White individuals. The database does not have a mixed race or unknown race category, and no records were excluded on that basis. Only a dichotomous Hispanic or Latino origin variable was used in the ethnicity stratification analysis, which is the available classification from the database for mortality rates. All the race and ethnicity information in the WONDER database are derived from the death certificates. Unlike census's race and ethnicity information, which are self‐reported, this information is reported on death certificate by funeral directors based on either informant report, who is often a living next of kin, or in their absence, according to observation.
In order to improve the quality of this observational study, a Strengthening the Reporting of Observational Studies in Epidemiology checklist has been included in Table S1.
Outcomes
The outcomes of this analysis include (1) diabetes‐related CVD mortality rate in the 2 decades before the pandemic (1999–2019); (2) diabetes‐related CVD mortality rate in the first pandemic year (2020) compared with the year prior (2019); and (3) estimation of the excess diabetes‐related CVD mortality during the first year of the pandemic based on the projections from the prior 2 decades. Finally, (4) estimation of the excess diabetes‐related CVD mortality during the first year of the pandemic based on the projections from the decade before (2010–2019) was included as a sensitivity analysis.
Statistical Analysis
Crude mortality and the age‐adjusted mortality rates (AAMR) are presented per 100 000 population; death counts are presented as absolute values. Age adjustment was done to the 2000 US standard population since it is the most recent standard population that is available through the CDC WONDER database, and the span of the study period (1999–2020). The denominator for all mortality rates is the general population except when stratified by demographics in which the denominator would be the total population in the studied demographic group. Changes in mortality rate are presented as percentages (%).
Given that the CDC WONDER database provides aggregated data rather than individual cases, the Joinpoint Regression Program (version 4.9.1.0), from the National Cancer Institute was used to calculate the average annual percent change in AAMR and is presented as percentage with 95% CI. The average annual percent change provided a summary of the trend over the period before the pandemic that was subsequently used to estimate the projected AAMR in first year of the pandemic. Excess AAMR was estimated by comparing the projected and the actual AAMR for the first year of the pandemic. This allowed the calculation of the proportion of excess AAMR (presented as percentage) and estimation of the number of excess deaths. Death certificates with missing age or Hispanic or Latino origin were included in the overall study but excluded in their respective group analysis.
RESULTS
Baseline Characteristics
During the study period (1999 to 2020; Table 1), 1 854 384 diabetes‐related cardiovascular mortality records were identified. Of these, 53.4% were male, 54.5% were aged 75 years or above, 37.7% aged 55 to 74 years, and 7.8% aged under 55 years. 79.9% were from urban areas, 80.8% were White, 15.4% were Black, and 8.1% had Hispanic or Latino origin.
Table 1.
Characteristics of Diabetes‐Related Cardiovascular Mortality Records Between 1999 and 2020
| Main causes of death | Number of deaths | Percentage (%) |
|---|---|---|
| All cardiovascular disease | 1 854 384 | 100 |
| Ischemic heart disease | 1 094 046 | 59.0 |
| Hypertensive disease | 201 127 | 10.8 |
| Heart failure | 83 476 | 4.5 |
| Cerebrovascular disease | 253 711 | 13.7 |
| Sex | ||
| Male | 990 146 | 53.4 |
| Female | 864 238 | 46.6 |
| Age, y | ||
| <55 | 144 395 | 7.8 |
| 55–74 | 699 589 | 37.7 |
| ≥75 | 1 010 328 | 54.5 |
| Ethnicity | ||
| Hispanic or Latino | 150 772 | 8.1 |
| Not Hispanic or Latino | 1 698 263 | 91.6 |
| Race | ||
| American Indian or Alaska Native | 14 813 | 0.8 |
| Asian or Pacific Islander | 54 905 | 3.0 |
| Black | 286 367 | 15.4 |
| White | 1 498 299 | 80.8 |
| Urbanization | ||
| Urban | 1 482 397 | 79.9 |
| Rural | 371 987 | 20.1 |
Changes in Mortality Before and During the First Year of the Pandemic
Over the 2 decades before the pandemic the AAMR from diabetes‐related CVD steadily and substantially decreased (Table 2 and Figure 1). Notably, the AAMR from diabetes‐related IHD fell by 41% (from 20.2 to 11.9 per 100 000). Similarly, the AAMR declined from diabetes‐related cerebrovascular disease by 41.3% (from 4.9 to 2.9 per 100 000) and diabetes‐related HF by 9.9% (from 1.2 to 1.1 per 100 000), though to a lesser extent. There has been a 75.3% rise AAMR from diabetes‐related HTD (from 1.9 to 3.3 per 100 000) over the same period.
Table 2.
Age‐Adjusted Diabetes‐Related Cardiovascular Mortality Rate per 100 000 Population
| Main causes of death | AAMR | ||||
|---|---|---|---|---|---|
| 1999 | 2019 | Δ% 1999–2019 | 2020 | Δ% 2019–2020 | |
| All cardiovascular disease | 31.3 | 22.2 | −29.2 | 25.6 | 15.5 |
| Ischemic heart disease | 20.2 | 11.9 | −41.0 | 13.6 | 14.1 |
| Hypertensive disease | 1.9 | 3.3 | 75.3 | 4.1 | 23.4 |
| Heart failure | 1.2 | 1.1 | −9.9 | 1.2 | 13.8 |
| Cerebrovascular disease | 4.9 | 2.9 | −41.3 | 3.3 | 16.8 |
| Sex | |||||
| Male | 37.2 | 29.2 | −21.5 | 33.8 | 15.8 |
| Female | 27.1 | 16.4 | −39.2 | 18.9 | 15.0 |
| Age, y | |||||
| <55 | 2.7 | 2.8 | 4.5 | 3.5 | 24.0 |
| 55–74 | 74.5 | 50.4 | −32.4 | 58.9 | 16.8 |
| ≥75 | 294.8 | 202.7 | −31.2 | 229.4 | 13.2 |
| Ethnicity | |||||
| Hispanic or Latino | 38.4 | 23.2 | −39.6 | 28.3 | 22.2 |
| Not Hispanic or Latino | 30.9 | 22.1 | −28.6 | 25.3 | 14.9 |
| Race | |||||
| American Indian or Alaska Native | 36.5 | 24.7 | −32.5 | 28.5 | 15.4 |
| Asian or Pacific Islander | 28.4 | 16.7 | −41.2 | 20.0 | 19.6 |
| Black | 51.1 | 33.2 | −35.0 | 41.6 | 25.3 |
| White | 29.4 | 21.0 | −28.5 | 23.8 | 13.2 |
| Urbanization | |||||
| Urban | 30.9 | 21.1 | −31.8 | 24.5 | 16.4 |
| Rural | 33.1 | 27.7 | −16.2 | 31.1 | 12.2 |
AAMR indicates age‐adjusted mortality rate; and Δ%, change percentage.
Figure 1. Trend of diabetes‐related cardiovascular age‐adjusted mortality rate by cause of death per 100 000 population.

AAMR indicates age‐adjusted mortality rate; CeVD, cerebrovascular disease; HF, heart failure; HTD, hypertensive disease; and IHD, ischemic heart disease.
The decreasing trend in diabetes‐related cardiovascular AAMR between 1999 and 2019 was generally consistent across the racial groups, sex, and urbanization status (Figures 2, 3, 4). However, although a similar trend was seen in the 55 to 74 and ≥75‐year age groups, it is notable that in those under 55 years the AAMR increased by 4.5% (from 2.7 to 2.8 per 100 000) (Figure 5; Table 2).
Figure 2. Trend of diabetes‐related cardiovascular age‐adjusted mortality rate by race per 100 000 population.

AAMR indicates age‐adjusted mortality rate.
Figure 3. Trend of diabetes‐related cardiovascular age‐adjusted mortality rate by sex per 100 000 population.

AAMR indicates age‐adjusted mortality rate.
Figure 4. Trend of diabetes‐related cardiovascular age‐adjusted mortality rate by urbanization status per 100 000 population.

AAMR indicates age‐adjusted mortality rate.
Figure 5. Trend of diabetes‐related cardiovascular age‐adjusted mortality rate (AAMR) by age group per 100 000 population.

In comparison to 2019, the diabetes‐related cardiovascular AAMR during the first year of the pandemic (2020) increased by 15.5% (from 22.2 to 25.6 per 100 000). This was largely due to a 14.1% increase in IHD deaths (from 11.9 to 13.6 per 100 000) (Table 2). Similarly, a rise in AAMR due to HTD (23.4%, from 3.3 to 4.1 per 100 000), HF (13.8%, from 1.1 to 1.2 per 100 000), and cerebrovascular disease (16.8%, from 2.9 to 3.3 per 100 000) was observed. The increase in diabetes‐related CVD AAMR was comparable by sex (15.8% for men and 15.0% for women) but heterogeneous in other demographic categories. Those aged <55 years experienced the highest increase of 24% (from 2.8 to 3.5 per 100 000), followed by those in the 55 to 74 years age group (16.8%), and ≥75 years group (13.2%). In each of these age groups IHD accounted for more than half of the diabetes‐related cardiovascular AAMR in 2020 (Table 3). Those with Hispanic or Latino origin had the highest rise in diabetes‐related CVD AAMR (22.2%) compared with non‐Hispanic and non‐Latino people (14.9%). Although there was an increase in diabetes‐related CVD AAMR among White individuals (13.2%), the rise was much more pronounced in racial minority groups: 25.3% increase in Black individuals (from 33.2 to 41.6 per 100 000), followed by Asian and Pacific Islander (19.6%), and American Indian and Alaska Native (15.4%) populations. There was a greater increase in urban populations (16.4%) than rural (12.2%).
Table 3.
Age‐Adjusted Diabetes‐Related Cardiovascular Mortality Rate per 100 000 Population in 2020, Stratified by Age Group and Cause of Death
| Age group | Ischemic heart disease | Hypertensive disease | Heart failure | Cerebrovascular disease | All cardiovascular disease |
|---|---|---|---|---|---|
| <55 y | 1.8 | 0.8 | 0.1 | 0.3 | 3.5 |
| 55–74 y | 33.5 | 9.8 | 2.4 | 6.3 | 58.9 |
| ≥75 y | 117.1 | 33.1 | 12.9 | 35.6 | 229.4 |
The crude diabetes‐related cardiovascular mortality rates and number of deaths in 1999, 2019, and 2020 with their respective changes in mortality proportions are presented in Tables 4 and 5.
Table 4.
Crude Diabetes‐Related Cardiovascular Mortality Rate per 100 000 Population
| Main causes of death | Crude mortality rate | ||||
|---|---|---|---|---|---|
| 1999 | 2019 | Δ% 1999–2019 | 2020 | Δ% 2019–2020 | |
| All cardiovascular disease | 30.7 | 27.7 | −9.8 | 32.4 | 17.0 |
| Ischemic heart disease | 19.8 | 14.9 | −24.6 | 17.3 | 15.8 |
| Hypertensive disease | 1.9 | 4.2 | 124.9 | 5.2 | 24.3 |
| Heart failure | 1.2 | 1.4 | 15.3 | 1.6 | 16.2 |
| Cerebrovascular disease | 4.8 | 3.6 | −25.0 | 4.2 | 17.9 |
| Sex | |||||
| Male | 30.0 | 32.6 | 8.4 | 38.3 | 17.7 |
| Female | 31.3 | 22.9 | −26.7 | 26.6 | 16.0 |
| Age, y | |||||
| <55 | 2.6 | 2.8 | 7.3 | 3.4 | 22.1 |
| 55–74 | 74.9 | 50.2 | −33.0 | 59.0 | 17.6 |
| ≥75 | 294.2 | 209.1 | −28.9 | 235.7 | 12.7 |
| Ethnicity | |||||
| Hispanic or Latino | 15.1 | 14.7 | −2.5 | 18.5 | 25.9 |
| Not Hispanic or Latino | 32.7 | 30.5 | −6.8 | 35.4 | 16.1 |
| Race | |||||
| American Indian or Alaska Native | 16.2 | 19.1 | 17.7 | 22.4 | 17.3 |
| Asian or Pacific Islander | 15.4 | 15.8 | 2.5 | 19.4 | 22.7 |
| Black | 33.5 | 30.1 | −10.1 | 38.3 | 27.4 |
| White | 31.2 | 28.4 | −8.8 | 32.6 | 14.8 |
| Urbanization | |||||
| Urban | 29.2 | 25.6 | −12.2 | 30.2 | 17.9 |
| Rural | 38.4 | 40.3 | 4.8 | 45.6 | 13.4 |
Δ% indicates change percentage.
Table 5.
Numbers of Diabetes‐Related Cardiovascular Deaths
| Main causes of death | Number of deaths | ||||
|---|---|---|---|---|---|
| 1999 | 2019 | Δ% 1999–2019 | 2020 | Δ% 2019–2020 | |
| All cardiovascular disease | 85 547 | 90 804 | 6.1 | 106 616 | 17.4 |
| Ischemic heart disease | 55 179 | 48 956 | −11.3 | 56 882 | 16.2 |
| Hypertensive disease | 5169 | 13 653 | 164.1 | 17 045 | 24.8 |
| Heart failure | 3288 | 4462 | 35.7 | 5222 | 17.0 |
| Cerebrovascular disease | 13 278 | 11 732 | −11.6 | 13 866 | 18.2 |
| Sex | |||||
| Male | 41 086 | 52 635 | 28.1 | 62 190 | 18.2 |
| Female | 44 461 | 38 169 | −14.2 | 44 426 | 16.4 |
| Age, y | |||||
| <55 | 5745 | 6490 | 13.0 | 7915 | 22.0 |
| 55–74 | 31 618 | 37 115 | 17.4 | 44 234 | 19.2 |
| ≥75 | 48 181 | 47 194 | −2.0 | 54 462 | 15.4 |
| Ethnicity | |||||
| Hispanic or Latino | 5115 | 8906 | 74.1 | 11 350 | 27.4 |
| Not Hispanic or Latino | 80 177 | 81 647 | 1.8 | 94 951 | 16.3 |
| Race | |||||
| American Indian or Alaska Native | 459 | 912 | 98.7 | 1095 | 20.1 |
| Asian or Pacific Islander | 1749 | 3445 | 97.0 | 4344 | 26.1 |
| Black | 12 102 | 14 017 | 15.8 | 18 079 | 29.0 |
| White | 71 237 | 72 430 | 1.7 | 83 098 | 14.7 |
| Urbanization | |||||
| Urban | 68 411 | 72 258 | 5.6 | 85 610 | 18.5 |
| Rural | 17 136 | 18 546 | 8.2 | 21 006 | 13.3 |
Δ% indicates change percentage.
Estimated Excess Mortality in 2020 (2‐Decades Model)
Yearly AAMR data from 1999 to 2019 were used to model the estimated average annual percent change in order to generate a projection for the expected AAMR in 2020 in various demographic groups (Table 6). This model estimated 16 009 excess diabetes‐related cardiovascular deaths in 2020. More than half of them were due to IHD (8504), followed by HTD (3038), cerebrovascular disease (2046), and HF (493) (Figure 6). Excess mortality among men accounted for the majority (9216 versus 6956 deaths). The largest portion of excess deaths was among the ≥75‐year age group (7398 deaths), followed by the 55‐ to 74‐year age group (7178), and the <55‐year age group (1564). The results for other demographics in this estimate of excess deaths are shown in Table 6.
Table 6.
Projected Excess Diabetes‐Related Cardiovascular Age‐Adjusted Mortality Rate per 100 000 Population Based on 1999 to 2019 Trend
| Main causes of death | AAPC 1999–2019 [95% CI] | 2020 | ||||
|---|---|---|---|---|---|---|
| Projected AAMR | Actual AAMR | Estimated excess AAMR | % Excess AAMR* | Estimated excess deaths | ||
| All cardiovascular disease | −2.0 [−2.2, −1.7] | 21.8 | 25.6 | 3.8 | 15.0 | 16 009 |
| Ischemic heart disease | −2.8 [−3.0, −2.6] | 11.6 | 13.6 | 2.0 | 15.0 | 8504 |
| Hypertensive disease | 2.1 [1.7, 2.6] | 3.4 | 4.1 | 0.7 | 17.8 | 3038 |
| Heart failure | −1.2 [−1.8, −0.7] | 1.1 | 1.2 | 0.1 | 9.4 | 493 |
| Cerebrovascular disease | −3.0 [−3.5, −2.6] | 2.8 | 3.3 | 0.5 | 14.8 | 2046 |
| Sex | ||||||
| Male | −1.4 [−1.7, −1.1] | 28.8 | 33.8 | 5.0 | 14.8 | 9216 |
| Female | −2.8 [−3.0, −2.5] | 15.9 | 18.9 | 3.0 | 15.7 | 6956 |
| Age, y | ||||||
| <55 | 0.3 [0.1, 0.4] | 2.8 | 3.5 | 0.7 | 19.8 | 1564 |
| 55–74 | −2.1 [−2.4, −1.7] | 49.3 | 58.9 | 9.6 | 16.2 | 7178 |
| ≥75 | −2.2 [−2.5, −2.0] | 198.2 | 229.4 | 31.2 | 13.6 | 7398 |
| Ethnicity | ||||||
| Hispanic or Latino | −2.6 [−2.9, −2.3] | 22.6 | 28.3 | 5.7 | 20.2 | 2287 |
| Not Hispanic or Latino | −2.0 [−2.2, −1.7] | 21.7 | 25.3 | 3.6 | 14.4 | 13 668 |
| Race | ||||||
| American Indian or Alaska Native | −1.7 [−2.1, −1.4] | 24.3 | 28.5 | 4.2 | 14.8 | 162 |
| Asian or Pacific Islander | −2.8 [−3.1, −2.4] | 16.2 | 20.0 | 3.8 | 18.8 | 818 |
| Black | −2.6 [−2.9, −2.3] | 32.3 | 41.6 | 9.3 | 22.3 | 4026 |
| White | −1.9 [−2.2, −1.6] | 20.6 | 23.8 | 3.2 | 13.4 | 11 169 |
| Urbanization | ||||||
| Urban | −2.1 [−2.4, −1.8] | 20.7 | 24.5 | 3.8 | 15.7 | 13 429 |
| Rural | −1.3 [−1.6, −1.0] | 27.3 | 31.1 | 3.8 | 12.1 | 2540 |
AAMR indicates age‐adjusted mortality rate; and AAPC, average annual percent change.
Percentage of excess AAMR out of the actual 2020 AAMR.
Figure 6. Estimated excess number of diabetes‐related cardiovascular deaths in 2020.
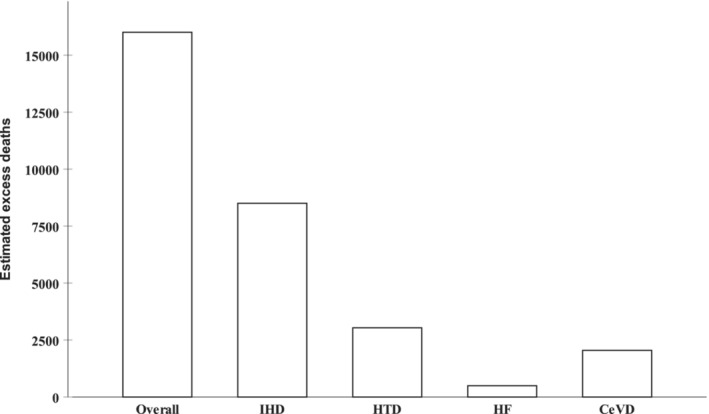
CeVD indicates cerebrovascular disease; HF, heart failure; HTD, hypertensive disease; and IHD, ischemic heart disease.
Estimating the proportion of excess AAMR out of the actual 2020 AAMR allows analysis of the impact of the first pandemic year on each demographic group/cause of death independent of their distribution in the population and these results are shown in detail in Table 6 and Figure 7.
Figure 7. Percentage of excess diabetes‐related cardiovascular age‐adjusted mortality rate (AAMR) out of the actual 2020 AAMR by age group and race.

Estimated Excess Mortality in 2020 (1‐Decade Model)
Using the yearly AAMR data from the decade proceeding the pandemic (2010–2019) to model the estimated average annual percent change was conducted as sensitivity analysis to account for a more recent trend in diabetes‐related CVD mortality (Table 7). The results were broadly similar to those generated from the 2 decades modeling with estimated 14 715 excess diabetes‐related cardiovascular deaths in 2020. More than half of these were due to IHD (7956), followed by HTD (2859), cerebrovascular disease (1803), and HF (378). The distribution of excess deaths generally followed the population demographics as seen in the 2 decades model.
Table 7.
Projected Excess Diabetes‐Related Cardiovascular Age‐Adjusted Mortality Rate per 100 000 Population Based on 2010 to 2019 Trend
| Main causes of death | AAPC 2010–2019 (95% CI) | 2020 | |||
|---|---|---|---|---|---|
| Projected AAMR | Estimated excess AAMR | % Excess AAMR* | Estimated excess deaths | ||
| All cardiovascular disease | −0.6 (−1.0 to −0.1) | 22.1 | 3.5 | 13.8 | 14 715 |
| Ischemic heart disease | −1.7 (−2.1 to −1.4) | 11.7 | 1.9 | 14.0 | 7956 |
| Hypertensive disease | 3.4 (2.2 to 4.5) | 3.4 | 0.7 | 16.8 | 2859 |
| Heart failure | 1.2 (0.3 to 2.0) | 1.1 | 0.1 | 7.2 | 378 |
| Cerebrovascular disease | −1.0 (−1.7 to −0.3) | 2.9 | 0.4 | 13.0 | 1803 |
| Sex | |||||
| Male | −0.1 (−0.6 to 0.3) | 29.2 | 4.6 | 13.7 | 8517 |
| Female | −1.4 (−1.9 to −0.8) | 16.2 | 2.7 | 14.4 | 6416 |
| Age, y | |||||
| <55 | 0.7 (0.2 to 1.1) | 2.8 | 0.7 | 19.4 | 1539 |
| 55–74 | −0.2 (−0.6 to 0.3) | 50.3 | 8.6 | 14.6 | 6459 |
| ≥75 | −1.1 (−1.7 to −0.5) | 200.5 | 28.9 | 12.6 | 6868 |
| Ethnicity | |||||
| Hispanic or Latino | −1.4 (−2.1 to −0.7) | 22.9 | 5.4 | 19.2 | 2176 |
| Not Hispanic or Latino | −0.5 (−1.0 to −0.1) | 22.0 | 3.3 | 13.1 | 12 424 |
| Race | |||||
| American Indian or Alaska Native | −0.2 (−1.1 to 0.6) | 24.7 | 3.8 | 13.5 | 148 |
| Asian or Pacific Islander | −1.2 (−2.0 to −0.4) | 16.5 | 3.5 | 17.5 | 760 |
| Black | −1.5 (−2.0 to −0.9) | 32.7 | 8.9 | 21.4 | 3867 |
| White | −0.5 (−1.0 to −0.0) | 20.9 | 2.9 | 12.2 | 10 143 |
| Urbanization | |||||
| Urban | −0.8 (−1.3 to −0.3) | 20.9 | 3.6 | 14.6 | 12 470 |
| Rural | 0.3 (−0.3 to 0.8) | 27.8 | 3.3 | 10.7 | 2240 |
AAMR indicates age‐adjusted mortality rate; AAPC, average annual percent change.
Percentage of excess AAMR out of the actual 2020 AAMR.
DISCUSSION
There are several important findings from this study of diabetes‐related cardiovascular mortality. First, the steady decline in diabetes‐related cardiovascular AAMR between 1999 to 2019 has been partially reversed during the first year of the pandemic. Second, in 2020 there was a 14.1% rise in IHD AAMR compared with the previous 12 months. Third, there has been more than 16 000 excess lives lost during the first year of the pandemic due to diabetes‐related CVD. Fourth, those <55 years of age were the most affected, with almost one fifth of the 2020 diabetes‐related cardiovascular deaths in this age group being in excess. Fifth, race and ethnic minority groups, especially Black individuals and those in urban areas had the highest increases in mortality.
Our observation that the first year of the COVID‐19 pandemic was associated with an excess of diabetes‐related CVD deaths is unsurprising, given that diabetes is a condition associated with hypercoagulability, chronic vascular inflammation, and atherosclerotic disease. 10 People with diabetes are known to be more susceptible to a severe course of COVID‐19, and the intense inflammatory response induced, often exacerbated by steroid treatment, tends to exacerbate hyperglycemia, a known predictor of poor outcome if left unchecked. 10 , 11 In addition, the presence of CVD has been recognized as independent strong predictor of COVID‐19 severity and mortality. 12 Furthermore, in people hospitalized with COVID‐19, cardiovascular complications and mortality affect just under half of patients with the highest risk among Black and South Asian populations. 13
It is important to recognize that diabetes has a bidirectional relationship with COVID‐19 infection and CVD, as these conditions can also increase the risk of developing diabetes. Coronavirus can directly damage pancreatic beta cells, impairing insulin secretion, resulting in acute diabetes, and indirectly increase target tissues insulin resistance through the associated hyperinflammation and steroids treatment. 10 , 14 Similarly, CVD particularly in the form of HF, which is associated with increased insulin resistance and double the risk of developing diabetes. 15 , 16 , 17
The heightened CVD risk is probably related to the high inflammatory burden that is associated with COVID‐19 that can lead to broad range of cardiac sequelae such as myocardial injury, myocarditis, HF, vascular inflammation, arrhythmias, sudden cardiac arrest, thrombosis, and coronary arterial plaque rupture leading to acute myocardial infarction. 18 , 19 Thus, although our observation of excess mortality is to be expected, the novelty of the current analysis lies in its absolute quantification of the extent of the (direct and indirect) impact of the COVID‐19 pandemic in this population.
With CVD and diabetes being the commonest comorbidities encountered in patients with COVID‐19, 20 The current findings in this US population are consistent with the COVID‐19 mortality studies seen among populations with diabetes in Europe. A nationwide observation study from 53 French centers that included 1317 patients with diabetes found the that the presence of CVD, in the form of macrovascular diabetes complications, was independently associated with more than double the risk of death in at 7 days (odds ratio [OR], 2.54 [95% CI, 1.44–4.50]). 21 Likewise, a population‐based study in England assessed the risk factors for dying with COVID‐19 among around 3 million patients with diabetes and revealed double the risk of death in patients with previous stroke (hazard ratio [HR], 2.02 [95% CI, 1.88–2.17], for type 2 diabetes), HF (HR, 2.09 [95% CI, 1.99–2.21], for type 2 diabetes), and to a lesser extent, prior myocardial infarction diagnosis (HR, 1.11 [95% CI, 1.00–1.23], for type 2 diabetes). 22 In fact, more than half the COVID‐19 related mortality in this study occurred in patients with CVD or renal impairment. A similar analysis found higher in‐hospital mortality with COVID‐19 among patients with diabetes when associated with cerebrovascular disease (OR, 2.23 [95% CI, 2.16–2.31]), HF (OR, 2.23 [95% CI, 2.15–2.31]), and coronary heart disease (OR, 1.32 [95% CI, 1.28–1.36]). 23
The current analysis demonstrates that some demographic groups had disproportionately greater increases in diabetes‐related CVD mortality, a finding that is consistent with previous literature. Thus, Barron et al showed that when compared with people >70 years of age, those <70 years had a much higher relative risk for COVID‐19 mortality linked to the presence of diabetes (younger versus older: OR, 6.39 versus 2.81, for type 1 diabetes; OR, 3.74 versus 1.79 for type 2 diabetes). 23 The greatest increase in mortality observed in those <55 years of age in the current analysis may be related to the potentially higher portion of patients ineligible for state supported health insurance and to a higher proportion of type 1 diabetes and young onset type 2 diabetes, in this age group. These 2 forms of diabetes are known to have unfavorable cardiovascular risk profile that was likely augmented by the disruption to routine diabetes care during the pandemic. 24 , 25 Similarly, although not limited to patients with diabetes, a US‐based population study, using weekly death counts by cause in 2020, found a higher excess non‐COVID mortality among non‐Hispanic younger age groups. 6 In the same analysis, 70% of the excess non‐COVID mortality was accounted for by Black and or Hispanic groups. COVID‐19 has also been previously linked to increased mortality risk in England among Black (HR, 1.48 [95% CI, 1.29–1.69]) and South Asian people (HR, 1.45 [95% CI, 1.32–1.58]). 26 Furthermore, among the population with diabetes, race and ethnic minority populations were associated with higher COVID‐19 mortality risk and this was exaggerated further in those who were also <70 years of age (HR, 2.25 [95% CI, 1.93–2.64], among Black patients <70 years old with type 2 diabetes). 22 Likewise, the risk of in‐hospital COVID‐19 mortality among the population with diabetes in England was higher in Black compared with White patients (OR, 2.76 versus 1.97). 23 These ethnic and racial disparities observed may well be related to already existing adverse factors that were worsened by the pandemic, such as the inferior quality of care, health care access and use, and unconscious bias with underrepresentation of these group among health care providers. 27 , 28 , 29
Similarly to the current study, rural populations have been reported to have much lower COVID‐19 mortality rates (9 per 100 000 population) compared with metropolitan areas (20.92 per 100 000 population) in a USAFacts database study. 30 However, subsequent extended studies with data related to 2021 demonstrated a 36% higher COVID‐19 mortality rate in rural areas. 31 This has stimulated speculation that the initially lower excess mortality in rural, compared with urban, populations may simply reflect slower spread of the infection, delaying the wave of mortality, rather than preventing it. The heavier impact of the first year of the pandemic on diabetes‐related CVD mortality in urban areas (rather than rural areas) in the current analysis is likely a representation of this initial slower disease spread in rural America, especially given the established demographic differences and existing health disadvantages faced by rural communities, especially when it comes to cardiovascular health. 32 , 33 , 34
The disruption of access to acute health services during the pandemic is likely to have made an important contribution to the excess diabetes‐related CVD mortality described in the current population during the first year of the pandemic. 35 , 36 Thus, although there is no reason to speculate that people with diabetes would have had worse access to acute services than those without diabetes, the availability of interventional therapies for IHD, in particular, is likely to be highly relevant to the current analysis findings, especially when diabetes is associated with silent myocardial infarction and a likely delayed presentation. 37 , 38 For example, the delivery of primary percutaneous coronary intervention for ST‐segment–elevation myocardial infarction did significantly reduce during the first year of the pandemic as reported in the ISACS STEMI COVID 19 Registry. 39 These finding can be reflected in the US health system, with a study by Fox et al revealing a rising in‐hospital mortality (OR, 1.36 [95% CI, 1.15–1.60]) from myocardial infarction during the pandemic, which was particularly worse in patients with ST‐segment–elevation myocardial infarction (OR, 2.57 [95% CI, 2.24–2.96]), in whom the delivery of percutaneous coronary intervention is much more time‐sensitive, compared with the pre‐COVID‐19 dates. 40
The management of longer‐term chronic conditions such as diabetes has been affected by the pandemic. Several studies have shown poorer glycemic control in patients with diabetes during the pandemic in the United States. 41 , 42 Ledford et al described an 8% increase in mean hemoglobin A1clevels at the beginning of the pandemic compared with 2019 values. 43 Furthermore, other studies have reported a 66% decline in the measurement of hemoglobin A1c levels, which is known to be associated with worse glycemic control and less monitoring/treatment of other cardiovascular risk factors leading to poorer risk factor control. 44 Blood pressure control has been shown to be significantly worse among the population with diabetes during the first year of the pandemic with significantly lower antihypertensive medications prescribed, 45 , 46 which along with the negative impact on other cardiovascular risk factors, and the “Infodemic” especially in relation to angiotensin pathway medications, 47 may well have affected CVD mortality in this population.
This study has some limitations. First, as with all registry‐based studies, the precision of this analysis is contingent on the accuracy of the data entered into the death certificates, which makes it susceptible to coding errors, incomplete information, and changes in coding practices for diabetes. Second, the level and distribution of comorbidities and prescribing across the demographics groups is unknown. Third, the COVID diagnosis status of patients in this study is not identified and therefore the proportion of excess deaths as a direct result from the infection compared with an indirect effect via disruption of health care provision is not known. Fourth, the absence of a comparator group without diabetes. Fifth, data from 2021 were not available at the time of this analysis and therefore could not be included. Sixth, stratification of the results in the Hispanic or Latino population by race was not performed as part of this analysis. Finally, sensitivity analysis by the type of diabetes was not performed to avoid suppressed results from the CDC WONDER database.
Conclusions
In conclusion, this analysis demonstrates a sharp rise in diabetes‐related CVD mortality during the first pandemic year, an observation that partially reverses a steady decline in diabetes‐related CVD mortality rates for the preceding 2 decades. The effect was more marked in younger age groups, racial and ethnic minority groups, and urban populations. Targeted health policies should be implemented as health services return to normal operation following the pandemic to reduce these disparities. These could be in the form of improved health care access, medical costs support, improving unconscious bias training of health care professionals, legislation to fight health care misinformation in social media, raising public awareness through targeted health promoting and disease prevention campaigns, encouraging them to seek medical help, driving health care recruitment in these disadvantaged groups, and national health care funding policies requiring providers to monitor and rectify any disparities in their services, in addition to funding high‐quality research centers focused on eliminating these disparities in health care.
Sources of Funding
None.
Disclosures
N.C. reports research grants: Boston Scientific, Heartflow, Beckman Coulter, Haemonetics; speaker fees/consultancy: Boston Scientific, Abbott Laboratories, Edwards Lifesciences; travel sponsorship: Medtronic, biosensors, Edwards Lifesciences, Abbott Laboratories. K.K. reports being Chair of the Ethnicity Subgroup of the UK Scientific Advisory Group for Emergencies (SAGE) and member of SAGE. The remaining authors have no disclosures to report.
Supporting information
Table S1
Acknowledgments
H.B.: methodology, formal analysis, visualization, writing‐ original draft preparation, writing‐ reviewing and editing, validation, data interpretation; O.K.: methodology, formal analysis, validation, writing‐ reviewing and editing, data interpretation; K.K.: writing‐ reviewing and editing, data interpretation; L.Y.S.: writing, reviewing, editing, data interpretation; M.K.R.: writing, reviewing, editing, data interpretation; N.W.S.C.: writing, reviewing, editing, data interpretation; N.C.: supervision, resources, writing, reviewing, editing, data interpretation; M.M.: supervision, conceptualization, methodology, resources, project administration, validation, writing, reviewing, editing, data interpretation. H.B. and O.K. are the guarantors of this work and, as such, had full access to all the data in the study and take responsibility for the integrity of the data and the accuracy of the data analysis.
This article was sent to Mahasin S. Mujahid, PhD, MS, FAHA, Associate Editor, for review by expert referees, editorial decision, and final disposition.
Supplemental Material is available at https://www.ahajournals.org/doi/suppl/10.1161/JAHA.122.028896
For Sources of Funding and Disclosures, see page 13.
References
- 1. Einarson TR, Acs A, Ludwig C, Panton UH. Prevalence of cardiovascular disease in type 2 diabetes: a systematic literature review of scientific evidence from across the world in 2007–2017. Cardiovasc Diabetol. 2018;17:83. doi: 10.1186/s12933-018-0728-6 [DOI] [PMC free article] [PubMed] [Google Scholar]
- 2. Rodriguez F, Blum MR, Falasinnu T, Hastings KG, Hu J, Cullen MR, Palaniappan LP. Diabetes‐attributable mortality in the United States from 2003 to 2016 using a multiple‐cause‐of‐death approach. Diabetes Res Clin Pract. 2019;148:169–178. doi: 10.1016/j.diabres.2019.01.015 [DOI] [PubMed] [Google Scholar]
- 3. Htay T, Soe K, Lopez‐Perez A, Doan AH, Romagosa MA, Aung K. Mortality and cardiovascular disease in type 1 and type 2 diabetes. Curr Cardiol Rep. 2019;21:45. doi: 10.1007/s11886-019-1133-9 [DOI] [PubMed] [Google Scholar]
- 4. Kaminska H, Szarpak L, Kosior D, Wieczorek W, Szarpak A, Al‐Jeabory M, Gawel W, Gasecka A, Jaguszewski MJ, Jarosz‐Chobot P. Impact of diabetes mellitus on in‐hospital mortality in adult patients with COVID‐19: a systematic review and meta‐analysis. Acta Diabetol. 2021;58:1101–1110. doi: 10.1007/s00592-021-01701-1 [DOI] [PMC free article] [PubMed] [Google Scholar]
- 5. Seidu S, Kunutsor SK, Cos X, Khunti K. Indirect impact of the COVID‐19 pandemic on hospitalisations for cardiometabolic conditions and their management: a systematic review. Prim Care Diabetes. 2021;15:653–681. doi: 10.1016/j.pcd.2021.05.011 [DOI] [PMC free article] [PubMed] [Google Scholar]
- 6. Cronin CJ, Evans WN. Excess mortality from COVID and non‐COVID causes in minority populations. Proc Natl Acad Sci USA. 2021;118:118. doi: 10.1073/pnas.2101386118 [DOI] [PMC free article] [PubMed] [Google Scholar]
- 7. Grosicki GJ, Bunsawat K, Jeong S, Robinson AT. Racial and ethnic disparities in cardiometabolic disease and COVID‐19 outcomes in White, Black/African American, and Latinx populations: social determinants of health. Prog Cardiovasc Dis. 2022;71:4–10. doi: 10.1016/j.pcad.2022.04.004 [DOI] [PMC free article] [PubMed] [Google Scholar]
- 8. Russo RG, Li Y, Ðoàn LN, Ali SH, Siscovick D, Kwon SC, Yi SS. COVID‐19, social determinants of health, and opportunities for preventing cardiovascular disease: a conceptual framework. J Am Heart Assoc. 2021;10:e022721. doi: 10.1161/JAHA.121.022721 [DOI] [PMC free article] [PubMed] [Google Scholar]
- 9. CDC WONDER: multiple cause of death 1999–2020. Centers for Disease Control and Prevention. 2021. Accessed August 1, 2022. http://wonder.cdc.gov/mcd‐icd10.html [Google Scholar]
- 10. Landstra CP, de Koning EJP. COVID‐19 and diabetes: understanding the interrelationship and risks for a severe course. Front Endocrinol (Lausanne). 2021;12:649525. doi: 10.3389/fendo.2021.649525 [DOI] [PMC free article] [PubMed] [Google Scholar]
- 11. Bode B, Garrett V, Messler J, McFarland R, Crowe J, Booth R, Klonoff DC. Glycemic characteristics and clinical outcomes of COVID‐19 patients hospitalized in the United States. J Diabetes Sci Technol. 2020;14:813–821. doi: 10.1177/1932296820924469 [DOI] [PMC free article] [PubMed] [Google Scholar]
- 12. Zheng Z, Peng F, Xu B, Zhao J, Liu H, Peng J, Li Q, Jiang C, Zhou Y, Liu S, et al. Risk factors of critical & mortal COVID‐19 cases: a systematic literature review and meta‐analysis. J Infect. 2020;81:e16–e25. doi: 10.1016/j.jinf.2020.04.021 [DOI] [PMC free article] [PubMed] [Google Scholar]
- 13. Norris T, Razieh C, Zaccardi F, Yates T, Islam N, Gillies CL, Chudasama YV, Rowlands AV, Davies MJ, McCann GP, et al. Impact of cardiometabolic multimorbidity and ethnicity on cardiovascular/renal complications in patients with COVID‐19. Heart. 2022;108:1200–1208. doi: 10.1136/heartjnl-2021-320047 [DOI] [PMC free article] [PubMed] [Google Scholar]
- 14. Yang JK, Lin SS, Ji XJ, Guo LM. Binding of SARS coronavirus to its receptor damages islets and causes acute diabetes. Acta Diabetol. 2010;47:193–199. doi: 10.1007/s00592-009-0109-4 [DOI] [PMC free article] [PubMed] [Google Scholar]
- 15. Low Wang CC, Hess CN, Hiatt WR, Goldfine AB. Clinical update: cardiovascular disease in diabetes mellitus: atherosclerotic cardiovascular disease and heart failure in type 2 diabetes mellitus—mechanisms, management, and clinical considerations. Circulation. 2016;133:2459–2502. doi: 10.1161/CIRCULATIONAHA.116.022194 [DOI] [PMC free article] [PubMed] [Google Scholar]
- 16. Guglin M, Lynch K, Krischer J. Heart failure as a risk factor for diabetes mellitus. Cardiology. 2014;129:84–92. doi: 10.1159/000363282 [DOI] [PubMed] [Google Scholar]
- 17. Campbell P, Krim S, Ventura H. The bi‐directional impact of two chronic illnesses: heart failure and diabetes—a review of the epidemiology and outcomes. Card Fail Rev. 2015;1:8–10. doi: 10.15420/cfr.2015.01.01.8 [DOI] [PMC free article] [PubMed] [Google Scholar]
- 18. Madjid M, Safavi‐Naeini P, Solomon SD, Vardeny O. Potential effects of coronaviruses on the cardiovascular system: a review. JAMA Cardiol. 2020;5:831–840. doi: 10.1001/jamacardio.2020.1286 [DOI] [PubMed] [Google Scholar]
- 19. Stefanini GG, Montorfano M, Trabattoni D, Andreini D, Ferrante G, Ancona M, Metra M, Curello S, Maffeo D, Pero G, et al. ST‐elevation myocardial infarction in patients with COVID‐19: clinical and angiographic outcomes. Circulation. 2020;141:2113–2116. doi: 10.1161/CIRCULATIONAHA.120.047525 [DOI] [PMC free article] [PubMed] [Google Scholar]
- 20. Chudasama YV, Zaccardi F, Gillies CL, Razieh C, Yates T, Kloecker DE, Rowlands AV, Davies MJ, Islam N, Seidu S, et al. Patterns of multimorbidity and risk of severe SARS‐CoV‐2 infection: an observational study in the U.K. BMC Infect Dis. 2021;21:908. doi: 10.1186/s12879-021-06600-y [DOI] [PMC free article] [PubMed] [Google Scholar]
- 21. Cariou B, Hadjadj S, Wargny M, Pichelin M, Al‐Salameh A, Allix I, Amadou C, Arnault G, Baudoux F, Bauduceau B, et al. Phenotypic characteristics and prognosis of inpatients with COVID‐19 and diabetes: the CORONADO study. Diabetologia. 2020;63:1500–1515. doi: 10.1007/s00125-020-05180-x [DOI] [PMC free article] [PubMed] [Google Scholar]
- 22. Holman N, Knighton P, Kar P, O'Keefe J, Curley M, Weaver A, Barron E, Bakhai C, Khunti K, Wareham NJ, et al. Risk factors for COVID‐19‐related mortality in people with type 1 and type 2 diabetes in England: a population‐based cohort study. Lancet Diabetes Endocrinol. 2020;8:823–833. doi: 10.1016/S2213-8587(20)30271-0 [DOI] [PMC free article] [PubMed] [Google Scholar]
- 23. Barron E, Bakhai C, Kar P, Weaver A, Bradley D, Ismail H, Knighton P, Holman N, Khunti K, Sattar N, et al. Associations of type 1 and type 2 diabetes with COVID‐19‐related mortality in England: a whole‐population study. Lancet Diabetes Endocrinol. 2020;8:813–822. doi: 10.1016/S2213-8587(20)30272-2 [DOI] [PMC free article] [PubMed] [Google Scholar]
- 24. Orchard TJ. Cardiovascular disease in type 1 diabetes: a continuing challenge. Lancet Diabetes Endocrinol. 2021;9:548–549. doi: 10.1016/S2213-8587(21)00190-X [DOI] [PubMed] [Google Scholar]
- 25. Constantino MI, Molyneaux L, Limacher‐Gisler F, Al‐Saeed A, Luo C, Wu T, Twigg SM, Yue DK, Wong J. Long‐term complications and mortality in young‐onset diabetes: type 2 diabetes is more hazardous and lethal than type 1 diabetes. Diabetes Care. 2013;36:3863–3869. doi: 10.2337/dc12-2455 [DOI] [PMC free article] [PubMed] [Google Scholar]
- 26. Williamson EJ, Walker AJ, Bhaskaran K, Bacon S, Bates C, Morton CE, Curtis HJ, Mehrkar A, Evans D, Inglesby P, et al. Factors associated with COVID‐19‐related death using OpenSAFELY. Nature. 2020;584:430–436. doi: 10.1038/s41586-020-2521-4 [DOI] [PMC free article] [PubMed] [Google Scholar]
- 27. Canedo JR, Miller ST, Schlundt D, Fadden MK, Sanderson M. Racial/ethnic disparities in diabetes quality of care: the role of healthcare access and socioeconomic status. J Racial Ethn Health Disparities. 2018;5:7–14. doi: 10.1007/s40615-016-0335-8 [DOI] [PMC free article] [PubMed] [Google Scholar]
- 28. Manuel JI. Racial/ethnic and gender disparities in health care use and access. Health Serv Res. 2018;53:1407–1429. doi: 10.1111/1475-6773.12705 [DOI] [PMC free article] [PubMed] [Google Scholar]
- 29. Marcelin JR, Siraj DS, Victor R, Kotadia S, Maldonado YA. The impact of unconscious bias in healthcare: how to recognize and mitigate it. J Infect Dis. 2019;220:S62–S73. doi: 10.1093/infdis/jiz214 [DOI] [PubMed] [Google Scholar]
- 30. Karim SA, Chen HF. Deaths from COVID‐19 in rural, micropolitan, and metropolitan areas: a county‐level comparison. J Rural Health. 2021;37:124–132. doi: 10.1111/jrh.12533 [DOI] [PubMed] [Google Scholar]
- 31. Anzalone AJ, Horswell R, Hendricks BM, Chu S, Hillegass WB, Beasley WH, Harper JR, Kimble W, Rosen CJ, Miele L, et al. Higher hospitalization and mortality rates among SARS‐CoV‐2‐infected persons in rural America. J Rural Health. 2023;39:39–54. doi: 10.1111/jrh.12689 [DOI] [PMC free article] [PubMed] [Google Scholar]
- 32. Harrington RA, Califf RM, Balamurugan A, Brown N, Benjamin RM, Braund WE, Hipp J, Konig M, Sanchez E, Joynt Maddox KE. Call to action: rural health: a presidential advisory from the American Heart Association and American Stroke Association. Circulation. 2020;141:e615–e644. doi: 10.1161/CIR.0000000000000753 [DOI] [PubMed] [Google Scholar]
- 33. Bashar H, Matetić A, Curzen N, Mamas MA. Invasive management and in‐hospital outcomes of myocardial infarction patients in rural versus urban hospitals in the United States. Cardiovasc Revasc Med. 2023;46:3–9. doi: 10.1016/j.carrev.2022.08.023 [DOI] [PubMed] [Google Scholar]
- 34. Sun LY, Tu JV, Sherrard H, Rodger N, Coutinho T, Turek M, Chan E, Tulloch H, McDonnell L, Mielniczuk LM. Sex‐specific trends in incidence and mortality for urban and rural ambulatory patients with heart failure in eastern Ontario from 1994 to 2013. J Card Fail. 2018;24:568–574. doi: 10.1016/j.cardfail.2018.07.465 [DOI] [PubMed] [Google Scholar]
- 35. Zhu D, Ozaki A, Virani SS. Disease‐specific excess mortality during the COVID‐19 pandemic: an analysis of weekly US death data for 2020. Am J Public Health. 2021;111:1518–1522. doi: 10.2105/AJPH.2021.306315 [DOI] [PMC free article] [PubMed] [Google Scholar]
- 36. Chew NWS, Ow ZGW, Teo VXY, Heng RRY, Ng CH, Lee CH, Low AF, Chan MY, Yeo TC, Tan HC, et al. The global effect of the COVID‐19 pandemic on STEMI care: a systematic review and meta‐analysis. Can J Cardiol. 2021;37:1450–1459. doi: 10.1016/j.cjca.2021.04.003 [DOI] [PMC free article] [PubMed] [Google Scholar]
- 37. Ängerud KH, Thylén I, Sederholm Lawesson S, Eliasson M, Näslund U, Brulin C; Group SS . Symptoms and delay times during myocardial infarction in 694 patients with and without diabetes; an explorative cross‐sectional study. BMC Cardiovasc Disord. 2016;16:108. doi: 10.1186/s12872-016-0282-7 [DOI] [PMC free article] [PubMed] [Google Scholar]
- 38. Stacey RB, Hall ME, Leaverton PE, Schocken DD, Zgibor J. Relation of glycemic status with unrecognized MI and the subsequent risk of mortality: the Jackson Heart Study. Am J Prev Cardiol. 2022;11:100348. doi: 10.1016/j.ajpc.2022.100348 [DOI] [PMC free article] [PubMed] [Google Scholar]
- 39. De Luca G, Cercek M, Jensen LO, Vavlukis M, Calmac L, Johnson T, Roura I, Ferrer G, Ganyukov V, Wojakowski W, et al. Impact of COVID‐19 pandemic and diabetes on mechanical reperfusion in patients with STEMI: insights from the ISACS STEMI COVID 19 registry. Cardiovasc Diabetol. 2020;19:215. doi: 10.1186/s12933-020-01196-0 [DOI] [PMC free article] [PubMed] [Google Scholar]
- 40. Fox DK, Waken RJ, Johnson DY, Hammond G, Yu J, Fanous E, Maddox TM, Joynt Maddox KE. Impact of the COVID‐19 pandemic on patients without COVID‐19 with acute myocardial infarction and heart failure. J Am Heart Assoc. 2022;11:e022625. doi: 10.1161/JAHA.121.022625 [DOI] [PMC free article] [PubMed] [Google Scholar]
- 41. Felix HC, Andersen JA, Willis DE, Malhis JR, Selig JP, McElfish PA. Control of type 2 diabetes mellitus during the COVID‐19 pandemic. Prim Care Diabetes. 2021;15:786–792. doi: 10.1016/j.pcd.2021.06.012 [DOI] [PMC free article] [PubMed] [Google Scholar]
- 42. Sharma A, Greene DN, Chambliss AB, Farnsworth CW, French D, Herman DS, Kavsak PA, Merrill AE, Margaret Lo SY, Lyon ME, et al. The effect of the Covid‐19 shutdown on glycemic testing and control. Clin Chim Acta. 2021;519:148–152. doi: 10.1016/j.cca.2021.04.018 [DOI] [PMC free article] [PubMed] [Google Scholar]
- 43. Ledford CJW, Roberts C, Whisenant E, Walters C, Akamiro K, Butler J, Ali A, Seehusen DA. Quantifying worsened glycemic control during the COVID‐19 pandemic. J Am Board Fam Med. 2021;34:S192–S195. doi: 10.3122/jabfm.2021.S1.200446 [DOI] [PubMed] [Google Scholar]
- 44. Fragala MS, Kaufman HW, Meigs JB, Niles JK, McPhaul MJ. Consequences of the COVID‐19 pandemic: reduced hemoglobin A1c diabetes monitoring. Popul Health Manag. 2021;24:8–9. doi: 10.1089/pop.2020.0134 [DOI] [PMC free article] [PubMed] [Google Scholar]
- 45. Patel MR, Zhang G, Leung C, Song PXK, Heisler M, Choe HM, Mehdipanah R, Shi X, Resnicow K, Rajaee G, et al. Impacts of the COVID‐19 pandemic on unmet social needs, self‐care, and outcomes among people with diabetes and poor glycemic control. Prim Care Diabetes. 2022;16:57–64. doi: 10.1016/j.pcd.2021.10.004 [DOI] [PMC free article] [PubMed] [Google Scholar]
- 46. Carr MJ, Wright AK, Leelarathna L, Thabit H, Milne N, Kanumilli N, Ashcroft DM, Rutter MK. Impact of COVID‐19 restrictions on diabetes health checks and prescribing for people with type 2 diabetes: a UK‐wide cohort study involving 618 161 people in primary care. BMJ Qual Saf. 2022;31:503–514. doi: 10.1136/bmjqs-2021-013613 [DOI] [PMC free article] [PubMed] [Google Scholar]
- 47. Lau D, McAlister FA. Implications of the COVID‐19 pandemic for cardiovascular disease and risk‐factor management. Can J Cardiol. 2021;37:722–732. doi: 10.1016/j.cjca.2020.11.001 [DOI] [PMC free article] [PubMed] [Google Scholar]
Associated Data
This section collects any data citations, data availability statements, or supplementary materials included in this article.
Supplementary Materials
Table S1
Data Availability Statement
The data that support the findings of this study are available from the corresponding author upon reasonable request.