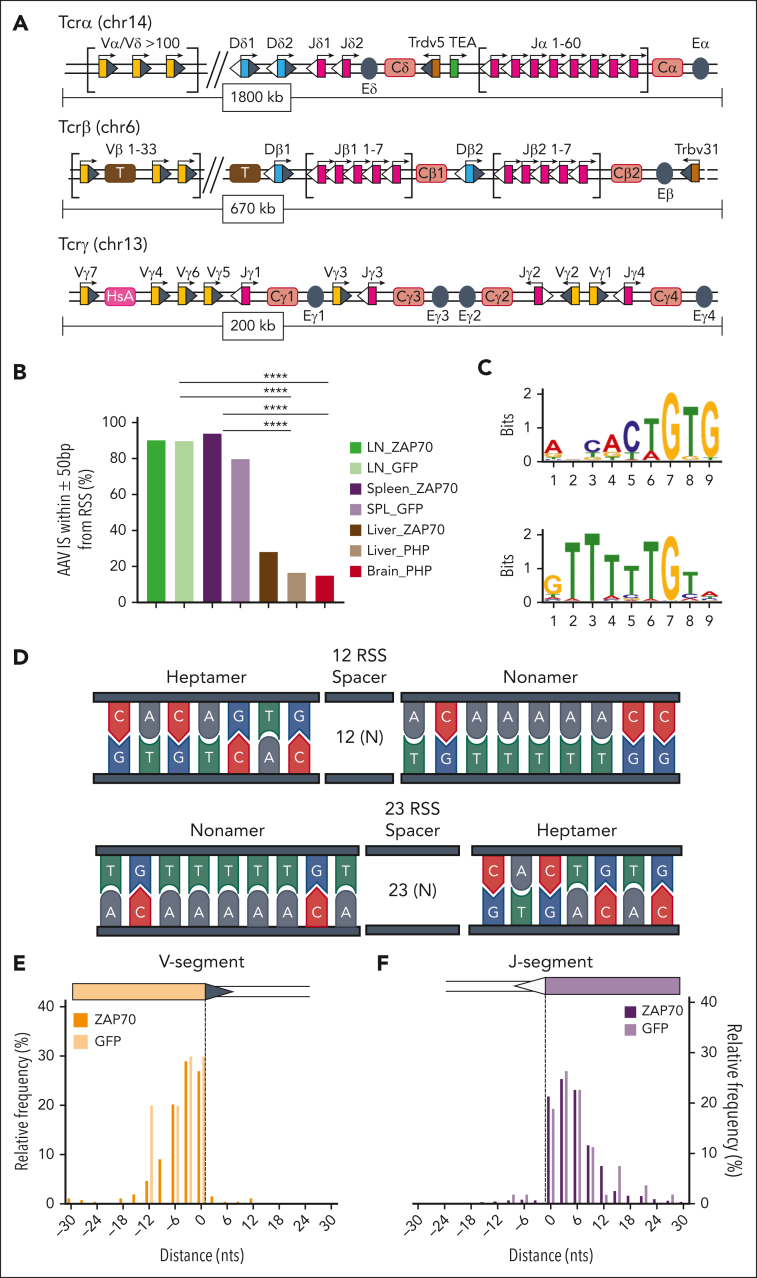
Figure 4.
AAV integrations occurred at RAG-induced DSBs. (A) Schematic representation of the organization of the murine Tcrα/Tcrδ, Tcrγ, and Tcrβ loci. Genomic proportions are not preserved. V, D, and J segments are indicated by yellow, blue, and purple rectangles, respectively. RSS are represented as triangles close to the V, D, and J gene segments: RSS with a 12-bp spacer are indicated as grey triangles, RSS with a 23-bp spacer are indicated as white triangles. TCR constant regions are indicated as Ca, Cb, Cg and Cd and represented as pink rectangles. The T early exon (TEA) in the TCRα locus is represented by a green rectangle. Trypsinogen genes in the TCRβ locus (T) are represented by brown rectangles. Enhancers are represented by grey circles and indicated as E. Germ line transcription is indicated by black arrows above each segment. (B) Frequency (indicated as percentage) of AAV ISs surrounded by candidate RSSs in a genomic window of 100 bp (± 50 bp). (C) Significant motifs identified by MEME algorithm within the LN and SPL data set of ZAP70-treated mice. (D) Schema of the conserved heptamer and nonamer sequence of RSS. (E, F) Distribution of AAV ISs at the 3′ region of V segments (E) and at the 5′ region of J segments (F). Statistical analyses in panel B were performed using the Fisher exact test. ∗∗∗∗P < .0001. chr, chromosome; MEME, multiple Em for motif elicitation.

