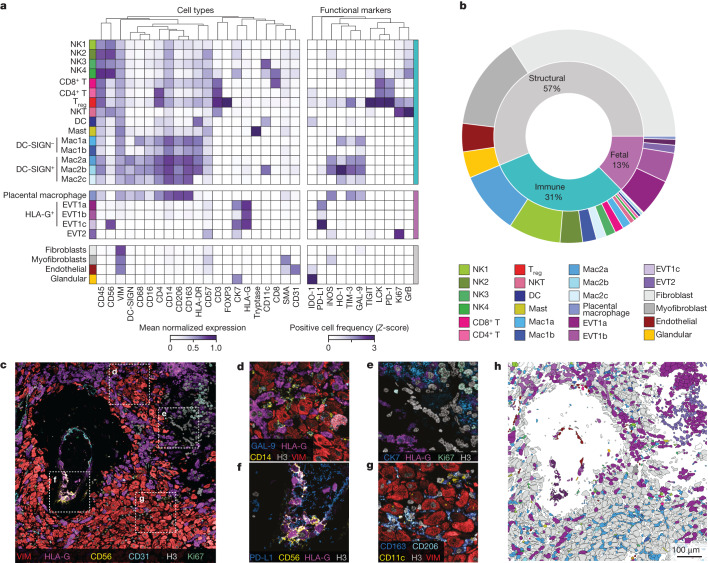
Fig. 2. Multiplexed imaging of human decidua reveals the immune-tolerance-conducive composition of the maternal–fetal interface.
a, Cell lineage assignments showing mean normalized expression of lineage markers (left) and functional-marker-positive cell frequency (right, Z-score). Columns (markers) are hierarchically clustered. DC, dendritic cell. b, Cell lineage abundances across our cohort. c, MIBI field of view (FOV) colour overlay of a 20-week sample. Representative image of n = 33 FOVs. d, Inset of c showing interstitial fetal EVTs. e, Inset of c showing anchoring villous cell column to decidua interface. f, Inset of c showing intravascular EVTs. g, Inset of c showing decidual stromal cells (fibroblasts) and macrophages. h, Cell lineage assignments overlaid onto the cell-segmentation output to produce a cell phenotype map.

