

Abstract
Drugs pharmacology is defined by pharmacokinetics and pharmacodynamics and both of them are affected by genetic variability. Genetic variability varies from population to population, and sometimes even within the population, it exists. Single nucleotide polymorphisms (SNPs) are one of the major genetic variability factors which are found to be associated with the pharmacokinetics and pharmacodynamics process of a drug and are responsible for variable drug response and clinical phenotypes. Studies of SNPs can help to perform genome-wide association studies for their association with pharmacological and clinical events, at the same time; their information can direct genome-wide association studies for their use as biomarkers. With the aim to mine and characterize Indian populated SNPs of pharmacological and clinical importance. Two hundred six candidate SNPs belonging to 43 genes were retrieved from Indian Genome Variation Database. The distribution pattern of considered SNPs was observed against all five world super-populations (AFR, AMR, EAS, EUR, and SAS). Further, their annotation was done through SNP-nexus by considering Human genome reference builds - hg38, pharmacological and clinical information was supplemented by PharmGKB and ClinVar database. At last, to find out the association between SNPs linkage disequilibrium was observed in terms of r2. Overall, the study reported 53 pharmaco-clinical active SNPs and found 24 SNP-pairs as potential markers, and recommended their clinical and experimental validation.
Supplementary Information
The online version contains supplementary material available at 10.1007/s40203-023-00154-4.
Keywords: Single nucleotide polymorphisms, Drug response, Linkage disequilibrium, Molecular marker, Haplotype
Introduction
Drug pharmacology defines in terms of pharmacokinetics (PK) and pharmacodynamics (PD) is a very important aspect of any drug; it decides the fate of the drug as well as its effect on patients (Glassman and Muzykantov 2019). It has been observed that genes that are involved in pharmacokinetics and pharmacodynamics, known as pharmacogenes (PGx-genes), also harbor a range of SNPs (Katara and Yadav 2019). Few of these SNPs are very critical, and their presence alters the structure and activity of their protein’s product. The presence of these SNP variants brings variability in the functionality of pharmacogenes which mainly affects drug’s PK and results in variable drug response (VDR) among patients. The more critical situation arises in some circumstances where this VDR resulted adversely and causes adverse drug response (ADR), which is lethal in some cases (Roden et al. 2011; Arbitrio et al. 2021).
The Genome of every person is unique and differs from other individuals even among the members of the same population, pharmacogenomics comes with the possible solution and proposed practice of genetic information in pharmaceutical and clinical care practice (Roden et al. 2019; Katara 2014). Pharmacogenetic testing (pharmacogenotyping) and genome-based medicine (personalized medicine) are the two possible ways to reduce the probability of ADR and enhance the possibilities of precise medication. Both, pharmacogenotyping and personalized medicine needs the use of genomic variant information, especially the variants of pharmacological and clinical (pharmaco-clinical) importance (González-Covarrubias et al. 2020). Contemporary studies are mainly relying on SNPs for these purposes (Ji et al. 2021). Numbers of SNPs are already in practice for various pharmacological and clinical screenings such as rs4917639 (CYP2C9*2) and rs1057910 (CYP2C9*3) for Cardiovascular Drugs (Crews et al. 2012; Pandey et al. 2020; Yadav et al. 2022; Yadav and Katara 2018). As studies reveal that most of these SNPs have a specific distribution pattern in the global population and show inter-population genetic variations, thus drugs, as well as markers used for pharmacogenomics purposes in one population, may not be appropriate for another population (Lauschke et al. 2017). Considering the facts, it is essential to include ethnicity in pharmacogenomics to ensure proper dosing, drug efficacy, and to develop pharmacogenomics tests (Sosa-Macías et al. 2016; Katara 2013).
Those SNPs which are associated with phenotypes are generally shown to have a non-random association with alleles of different loci. Linkage disequilibrium (LD) is one of the parameters used to measure the non-random association between alleles of different loci, which provides information about the set of SNPs that tend to be inherited together (Crossline et al. 2010). Population-specific LD patterns among genetic variants in different populations can provide information about genetic relatedness between the studied populations (Suarez-Kurtz and Parra 2018). Knowledge about LD patterns among SNPs allows Genome-wide association study (GWAS) to identify and use biomarkers in a population-specific manner, i.e., tagSNPs (Uffelmann et al. 2021). Since allelic distribution and LD of SNPs vary among populations, mining of pharmacogenomics-related SNPs allele frequencies and their LD patterns are crucial and anticipated for association studies (De et al. 2002; Uffelmann et al. 2021).
Population-specific genome projects across the globe that produce a considerable size of sequence data allow scientists to analyze and get the variant patterns of importance (Van Rooij et al. 2017). India is one of the most densely populated South Asian countries whose population shows huge diversity among themselves as well as from the rest of the world (Bongaarts 2009; Jain et al. 2021). Despite this huge diversity, very less is studied on the Indian population, specifically with respect to clinical genomics (GUaRDIAN Consortium et al. 2019). The current study focused on the analysis of Indian population-specific SNP variants of pharmaco-clinical importance. The study mainly includes a distribution pattern to identify Indian population-specific SNPs and SNP-variants, followed by their pharmaco-clinical annotation. Along with that, pair-wise LD analysis was also performed to find out SNP associations and to observe the possibility to use them as markers.
Methods
Mining of Indian population-specific SNPs belongs to the genes of pharmacokinetics importance
A list of pharmacogenes belonging to pharmacokinetics was collected from PharmGKB (Thorn et al. 2013), https://www.pharmgkb.org/. Indian populated SNP-mining for all the PK-genes was done from the Indian genome variation database (IGVDB, Indian Genome Variation Consortium 2005; http://www.igvdb.res.in). SNP-Variant IDs (rsIDs) and their major and minor allele information were utilized for the whole analysis. A total of 43 genes from 26 gene families comprising 206 SNPs have been investigated (Table 1).
Table 1.
Details of considered pharmacogenes and their pharmacological role
| S. No. | Gene | SNPs | Description |
|---|---|---|---|
| 1 | ABCB1(5) | rs7790722, rs2235040, rs2188531, rs12704363, rs10267099 | Transporter |
| 2 | ABCC1(17) | rs129116, rs246221, rs903880, rs4781712, rs35597, rs246220, rs2239995, rs2014800, rs215106, rs152022, rs11864374, rs212090, rs246217, rs35587, rs3765129, rs3851713, rs3887893 | |
| 3 | ABCC2(10) | rs2002042, rs12260112, rs6584327, rs3740074, rs4148385, rs717620, rs3740065, rs2756104, rs2073337, rs3740063 | |
| 4 | SLCO1B1(3) | rs999278, rs1292912, rs4149026 | |
| 5 | ADH1B (6) | rs1229983, rs3840297, rs17033, rs1042026, rs1789882, rs4147536 | Metabolizer |
| 6 | ALDH2(3) | rs2238151, rs10849970, rs2158029 | |
| 7 | CES1(3) | rs2002577, rs2307240, rs12443580 | |
| 8 | CYP1A1(5) | rs4646421, i00243, rs4646903, rs1048943, rs1799814 | |
| 9 | CYP1A2(3) | rs762551, rs3743484, rs2069526 | |
| 10 | CYP2A6(2) | rs28399466, rs28399467 | |
| 11 | CYP2B6(5) | rs8192709, rs4803419, rs4803418, rs2279343, rs1042389 | |
| 12 | CYP2C19(7) | rs4986893, rs17882787, rs12247175, rs12257497, rs17879393, rs4917623, rs12768009 | |
| 13 | CYP2C8(2) | rs11572080, rs10509681 | |
| 14 | CYP2C9(4) | rs9332120, rs9332220, rs2153628, rs9332092 | |
| 15 | CYP2D6(5) | rs3915951, rs16947, rs1081003, rs1065852, rs17002852 | |
| 16 | CYP3A4(6) | rs6956344, rs3735451, rs2242480, rs2740574, rs28988574, rs4646437 | |
| 17 | CYP3A5(1) | rs28365094 | |
| 18 | CYP3A7(1) | rs2687077 | |
| 19 | MTHFR (9) | rs1537516, rs1801133, rs4846052, rs2066470, rs1801131, rsI000156, rs2274976, rs3766747, rs3753582 | |
| 20 | TPMT (4) | rs2518463, i000259, rs1800460, rs2518462 | |
| 21 | UGT1A8(5) | rs3821242, rs10929301, rs6431628, rs10929303, rs6742078 | |
| 22 | NAT1(4) | rs7017402, rs4921880, rs13278990, rs7003890 | |
| 23 | NAT2(5) | rs1041983, rs1801280, rs4646246, rs1208, rs1799930 | |
| 24 | PPARA (8) | rs7364220, rs4823613, rs4253617, rs9626814, rs9306498, rs9626736, rs5767700, rs4253765 | |
| 25 | HSD11B1(4) | rs932335, rs2298930, rs2236902, rs1000283 | |
| 26 | GSTM3(2) | rs7483, rs10735234 | |
| 27 | GSTA1(3) | rs2290758, rs10948722, rs1051566 | |
| 28 | AGTR1(10) | rs6801836, rs385338, rs12721275, rs2131127, rs2638363, rs275652, rs2933249, rs4524238, rs5186, rs4681443, rs5182 | Receptor and signaling |
| 29 | AHR (2) | rs2066853, i00241 | |
| 30 | BDKRB2(2) | rs5225, rs1046248 | |
| 31 | CTLA4(5) | rs4553808, rs231777, rs11571315, rs11571317, rs3087243 | |
| 32 | DRD3(6) | rs7638876, rs167770, rs2251177, rs226082, rs4646996, rs324035 | |
| 33 | IL10(11) | rs1518110, rs3024495, rs3024498, rs1800871, rs10494879, rs2222202, rs11119474, rs3024496, rs1800872, rs1878672, rs3024500 | |
| 34 | IL18(3) | rs5744247, rs1946519 | |
| 35 | IL3(1) | rs31481 | |
| 36 | NR1I2(5) | rs6438546, rs12721607, rs12721612, rs1357459, rs13059232 | |
| 37 | NR1I3(5) | rs6686001, rs2501873, rs2502805, rs2502815, rs3003596 | |
| 38 | OPRM1(1) | rs1799971 | |
| 39 | VDR (8) | rs12717991, rs1544410, rs739837, rs10735810, rs2238136, rs2189480, rs4516035, rs7963776 | |
| 40 | ANKK1 (1) | rs1800497 | |
| 41 | HNF4A (6) | rs1028583, rs2071197, rs6093978, rs11086926, rs3212199, rs1800961 | Regulator |
| 42 | EPHX1(6) | rs2671272, rs2292566, rs2260863, rs1051741, rs1051740, rs2234922 | |
| 43 | GRIK1(5) | rs363504, rs363430, rs2178865, rs363538, rs2832419 | Ion channel |
Population-specific distribution analysis of selected SNPs
To infer population-specific worldwide distribution patterns of Indian-SNPs a comparative approach was used against all five super-populations, i.e., African (AFR), American (AMR), East-Asian (EAS), European (EUR), and South-Asian (SAS). Each variant’s allele frequency was retrieved from the population genetics database using an ensemble genome browser. These populations’ data were obtained from Phase 3 of the 1000 Genome Project https://www.internationalgenome.org/data (The 1000 Genomes Project Consortium, 2015).
Annotation of SNPs
To find out the potential significance of these SNPs or possible functional and physiological consequences of SNPs, structural and functional annotation was performed through SNPnexus, https://www.snp-nexus.org/v4/, the web open-access, variant annotation tool (Oscanoa et al. 2020). For annotation, Human genome reference builds - hg38 was utilized as a reference. Further clinical and pharmacological annotation for all SNPs was done through ClinVar (Landrum et al. 2018), https://www.ncbi.nlm.nih.gov/clinvar/; and PharmGKB (Thorn et al. 2013), https://www.pharmgkb.org/, database.
Linkage disequilibrium analysis of SNP-Haplotypes (R2)
Investigating patterns of linkage disequilibrium over a wide range of demographic groupings aids in identifying the potential genetic association. R2 (R squared) is one of the two measures of linkage disequilibrium; that was considered for LD analysis; it quantifies the concordance of alleles for two genetic variants (VanLiere and Rosenberg 2008). This pair-wise linkage disequilibrium is calculated using the module LDmatrix of the tool LDlink (https://ldlink.nci.nih.gov). Considering the LD, the association of pharmaco-clinical SNPs has been observed and screening for potential SNP-markers was performed.
Results and discussion
Change in a single nucleotide can have major impacts, with non-synonymous SNPs playing their role and affecting genes belonging to almost all kinds of physiological processes. As drug pharmacology has clinical significance, genes belonging to PK were explored for their SNP variants. As the distribution of these SNPs-variant plays a significant role. Distribution patterns of all considered SNPs were analyzed for the world population, and further analysis was done to enrich their pharmaco-clinical significance and check for the possibilities of using them as markers.
Distribution patterns of SNPs
Genomic variation studies are well practices and it is established that most genomic variations are population-specific and follow population-specific distribution patterns. SNPs are also following the same distribution rules; their distribution patterns illustrate plenty about the evolution and population-specific phenotypes (Choudhury et al. 2014; Huang et al. 2015). To detect the Indian population-specific SNPs, their presence was observed in the world super-population, and all 206 SNPs belonging to 43 pharmacogenes were considered for population-specific distribution patterns investigation. The resulting distribution patterns indicate that out of 206 SNPs, 11 SNPs did not shown their presence in any of the world’s populations. Such exclusive SNPs were earlier considered population-specific SNPs and also termed “private SNPs” (Baye et al. 2009). From the rest of the 195 SNPs, 84 were found to harbor unique minor and major alleles in Indian populations and were considered “private- allele SNPs” for Indians. The rest of 111 SNPs were observed as global SNPs which were found in all super populations with similar minor and major alleles. On the basis of the obtained results, all SNPs were classified into three classes; (i) Private SNPs (SNPs only present in the Indian population), (ii) Global SNPs with Private Indian alleles, and (iii) Global SNPs with common alleles (Table s1). In total, we got 11 SNPs as Private, 84 SNPs with private Indian alleles, and the rest of 111 SNPs as global SNPs with common alleles (Table s1).
Information about these distribution patterns is very important and has the potential to answer a lot of questions, especially regarding the causal role of common human DNA variation in complex human traits and for investigating the nature of genetic variation within and between human populations (Hinds et al. 2005; Srivastava and Katara 2020). It also helps in pharmaceutical studies, mainly during clinical trial phases, for drug efficacy and dosage standardization processes in a population-wise manner (Burt and Dhillon 2013; Sim and Ingelman-Sundberg 2011). Application of populations-specific SNPs is also projected for practice to population-specific disease gene mappings (Shastry 2007, 2009).
Annotations
As mentioned, SNPs provide a huge scope in numerous variation-related aspects, but before their use for this purpose, they need to be enriched and annotated. All the considered SNPs belong to genes of pharmacogenomic importance, but not all of them are relevant or affect phenotype. Annotations can provide further details which could help us to deduce more about their potential significance (Miller et al. 2019). Annotation was performed to explore features of the considered SNPs mainly with reference to their physical consequences (Fig. 1), and pharmacological and clinical significance (Table 2).
Fig. 1.
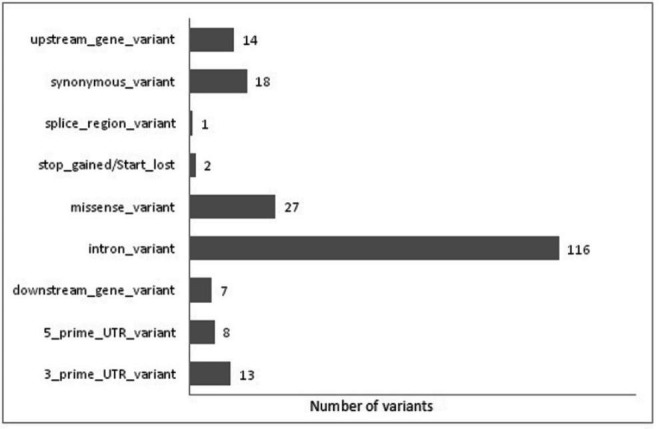
Column chart shows physical annotation (consequences) of SNPs variants
Table 2.
Reported SNPs with pharmaco-clinical significance and their phenotypic association
| S. No. | Gene name | Variation ID | Affected pharmacology and major phenotypic changes# |
|---|---|---|---|
| A | Indian Population Specific SNP Variants | ||
| 1 | ABCB1 | rs2235040 | - Toxicity |
| 2 | ABCC2 | rs717620 | - Metabolism/PK; Dubin-Johnson syndrome |
| 3 | ABCC2 | rs3740065 | - Toxicity; Metabolism/PK; Leukemia, B-Cell, Acute |
| 4 | ANKK1 | rs1800497 | - Toxicity; Alcoholism; Substance-Related Disorders |
| 5 | CES1 | rs2307240 | - Efficacy; Acute coronary syndrome |
| 6 | CYP1A1 | rs1048943 | - Efficacy; Breast Neoplasms |
| 7 | CYP2C8 | rs11572080 | - Toxicity; CYP2C8 Haplotype Polymorphism |
| 8 | CYP2D6 | rs17002852 | - Tramadol response |
| 9 | HNF4A | rs11086926 | - Familial hyperinsulinism, Maturity-onset diabetes of the young, type 1 |
| 10 | HNF4A | rs1800961 | - All Highly Penetrant, Familial hyperinsulinism, Maturity-onset diabetes of the young, type 1, Monogenic diabetes |
| 11 | MTHFR | rs1801133 | - Drug Toxicity; hematotoxicity; Leukopenia; mucositis; Neoplasms; Neutropenia; Osteosarcoma; Precursor Cell Lymphoblastic Leukemia-Lymphoma; primary central nervous system lymphoma; Thrombocytopenia; Toxic liver disease |
| 12 | MTHFR | rs2066470 | - Homocystinuria due to methylene tetrahydrofolate reductase deficiency, Homocystinuria due to MTHFR deficiency |
| 13 | MTHFR | rs1801131 | - Efficacy; Neoplasms |
| 14 | MTHFR | rs2274976 | - Homocystinuria |
| 15 | NR1I3 | rs2502815 | - Toxicity; Anemia;Nasopharyngeal Neoplasms |
| 16 | TPMT | rs1800460 | - Toxicity; Neoplasms |
| 17 | VDR | rs1544410 | - Efficacy; Osteoporosis |
| 18 | VDR | rs4516035 | - Metabolism/PK |
| 19 | CYP2D6 | rs1065852 | - Toxicity; Opioid-Related Disorders |
| 20 | CYP3A4 | rs2740574 | - Toxicity; Breast Neoplasms |
| 21 | CYP3A4 | rs4646437 | - Metabolism/PK; Kidney Transplantation; liver transplantation; Proteinuria |
| 22 | IL10 | rs1800872 | - Efficacy; Kidney Transplantation |
| 23 | NR1I3 | rs2501873 | - Dosage; Inflammatory bowel disease |
| 24 | VDR | rs739837 | - Basal cell carcinoma |
| 25 | CYP3A4 | rs3735451 | - Toxicity; Vitamin D-dependent rickets type II with alopecia |
| B. | Global SNP Variants | ||
| 1 | AGTR1 | rs5182 | - Efficacy; Coronary Artery Disease |
| 2 | ABCB1 | rs10267099 | - Toxicity; Breast Neoplasms; Neutropenia |
| 3 | AGTR1 | rs5186 | - Toxicity / Efficacy; Drug Hypersensitivity; Hypertension; Hypertrophy, Left Ventricular; Renal tubular dysgenesis, |
| 4 | CTLA4 | rs4553808 | - Toxicity/PK; Kidney Transplantation |
| 5 | CYP1A2 | rs762551 | - Toxicity/Dosage; Stevens-Johnson Syndrome; Arthritis, Rheumatoid/ Depressive Disorder, Major |
| 6 | CYP1A2 | rs2069526 | - Toxicity; Depressive Disorder, Major |
| 7 | CYP2B6 | rs8192709 | - Toxicity; Carcinoma, Non-Small-Cell Lung, Cystitis;Transplantation |
| 8 | CYP2B6 | rs4803419 | - Metabolism/PK; HIV Infections, efavirenz response - Metabolism/PK |
| 9 | CYP2C19 | rs4986893 | - Toxicity; Cough, Maculopapular Exanthema;Tuberculosis |
| 10 | CYP2C19 | rs12768009 | - Metabolism/PK; HIV Infections |
| 11 | CYP2C8 | rs10509681 | - Toxicity; CYP2C8 HAPLOTYPE POLYMORPHISM, rosiglitazone response - Metabolism/PK |
| 12 | EPHX1 | rs1051740 |
- Metabolism/PK; Kidney Transplantation, Epilepsy; Ovarian Neoplasms - carbamazepine response, Cystic fibrosis |
| 13 | IL18 | rs5744247 | - Efficacy; Breast Neoplasms;Colorectal Neoplasms |
| 14 | NAT2 | rs1041983 | - Toxic liver disease; Tuberculosis; Drug interaction with drug; Drug Toxicity; Tuberculosis |
| 15 | NAT2 | rs1801280 | - Other/Toxicity; Tobacco Use Disorder; Ovarian Neoplasms, ACETYLATION |
| 16 | NAT2 | rs1208 | - Toxicity; Drug interaction with drug;Drug Toxicity; Acetylation, Slow |
| 17 | NAT2 | rs1799930 | - Toxicity; Drug interaction with drug; Drug Toxicity; ethambutol, isoniazid, pyrazinamide, and rifampin response |
| 18 | OPRM1 | rs1799971 | - Efficacy/Toxicity; Tobacco Use Disorder; Erectile Dysfunction; Sexual Dysfunctions, |
| 19 | PPARA | rs4823613 | - Efficacy; Organ Transplantation |
| 20 | UGT1A8 | rs10929303 | - Toxicity; Liver Failure, Acute; HIV Infections; nephrolithiasis; Lucey-Driscoll syndrome, Gilbert syndrome, Crigler-Najjar syndrome |
| 21 | UGT1A8 | rs6742078 | - Bilirubin, Serum Level of, Quantitative Trait Locus 1, Gilbert syndrome |
| 22 | CYP2D6 | rs16947 | - Toxicity; Bradycardia; Debrisoquine, ultrarapid metabolism, Tramadol response, Deutetrabenazine response |
| 23 | CYP3A4 | rs2242480 | - Efficacy/Toxicity; Coronary Artery Disease; Heroin Dependence |
| 24 | DRD3 | rs167770 | - Efficacy; Anxiety Disorders |
| 25 | EPHX1 | rs2234922 | - Toxicity/Dosage; Congenital Abnormalities; Craniofacial Abnormalities/ Carcinoma, Non-Small-Cell Lung/ Epilepsy; carbamazepine response |
| 26 | IL10 | rs1800871 | - Dosage; liver/Kidney transplantation |
| 27 | NR1I3 | rs3003596 | - Metabolism/PK; HIV Infections |
| 28 | CTLA4 | rs3087243 | - Toxicity; Psoriasis Autoimmune lymphoproliferative syndrome type V, chronic fatigue syndrome with infection-triggered onset |
#Source-ClinVar database and PharmGKB database
The impact of all the consequences is not common; it varied from modifier to high impact range. Modifier impacts (158 SNP variants) include variants at downstream, upstream, intron, 3_prime_UTR, and 5_prime_UTR, where predictions are difficult or there is no evidence of impact. Low impacts (18 SNP variants) are created by synonymous_variant, they are assumed to be mostly harmless or unlikely to change protein behavior. Moderate impacts (28 SNP variants) mainly include miss-sense and splice region variants; generally, these are non-disruptive variants that might change protein effectiveness. Consequences like the start_lost and stop_gained variants are assumed to have a high (disruptive) impact (02 SNP variants) on the protein, probably causing protein truncation, loss of function, or triggering nonsense-mediated decay.
Annotation with reference to pharmacological importance and clinical significance suggests that in total 53 SNPs were found to be associated with pharmaco-clinical impact (Table 2). These 53 SNPs are shared by 26 genes, where three genes, i.e., MTHFR, NAT2, and CYP3A4 share four SNPs each, and another three genes, i.e., NR1I3, VDR, and CYP2D6 share three SNPs each. Twelve genes, i.e., ABCB1, ABCC2, AGTR1, CTLA4, CYP1A2, CYP2B6, CYP2C19, CYP2C8, EPHX1, HNF4A, IL10, and UGT1A8, share two SNPs each, and the rest of 8 SNPs belongs to OPRM1, PPARA, TPMT, IL18, DRD3, CYP1A1, ANKK1, and CES1 genes. Though very brief information is available, interestingly, it has been observed that most of these SNPs are reported to be associated with multiple phenotypic outcomes. rs1799971, which belongs to OPRM1, was found to be involved in a huge number of events and shows 56 annotation hits in the PharmGKB (Thorn et al. 2013) database. Though we were concerned to enrich the private Indian SNPs we did not find hits for all 11 SNPs during pharmaco-clinical annotation. As they are only reported in Indian populations, there are possibilities that very less is known and studied about their significance and phenotypic associations.
As all of these SNPs belong to the Absorption/Distribution /Metabolism/Excretion or Toxicity (ADMET) process, the pharmacokinetics of drugs get affected and result in increased severity of related diseases (e.g., Leukemia in the presence of rs3740065). At the same time, a few abnormalities also emerged in terms of disease and syndrome (e.g., Dubin-Johnson syndrome caused by the presence of rs717620). Though these SNPs belong to genes involved in drugs pharmacokinetics, in other ways, they also affect the pharmacodynamics of drugs, mainly the efficacy of the drugs (e.g., rs1048943), and alter the dosage of the drug as well (e.g., rs2501873), which finally results in variable drug response (VDR).
Linkage disequilibrium between SNP-Haplotypes
Haplotypes are ensembles of genetic polymorphisms that co-occur throughout a single chromosome and are critical to fully describing and inferring an individual’s genome. Linkage disequilibrium is a sensitive indicator of the population genetic forces that structure a genome. Pair-wise Linkage disequilibrium, in terms of r2, was mined between all considered haplotype-SNPs to find SNP-pairs and observe the strength of associations between them (García-Fernández et al. 2018). Linkage disequilibrium was done in two sets of the population (i) among all five super-populations, and (ii) all South Asian sub-populations independently. In both super-populations and South Asian sub-populations, all those pairs were considered significant if they showed r2 ≥ 0.8 in at least one population.
LD in super-populations
LD results for five super-populations indicate that in total 98 SNP-pairs are significantly coupled; the maximum number of SNP pairs with r2 ≥ 0.8 belongs to chromosome 10 (32-pairs) followed by chromosome number 1 (27-pairs). A further observation indicates that out of 94 pairs, 18 pairs are associated in all five populations, and 20 pairs show association in only one of the five populations. SNP-pairs indicate that each of rs2756104, rs4148385, and rs6584327 was found significantly associated with 7 other SNPs, and rs12260112, rs2073337, rs3740063, and rs3740074 were associated with 6 other SNPs. Other frequent SNPs are rs1537516, rs2222202, rs3024496, rs3024500, rs3753582, and rs3766747 each of which is associated with 4 other SNPs.
Observations for inter-population variability in LD across super-population indicate that AMR and EUR populations almost show a similar association among SNP-pairs which are 71 and 70 in number, respectively. The most frequent number of pairs, i.e., 85, was observed in EAS, which includes 17 unique pairs that were not observed in other populations. SNP-pair in SAS (56) is almost comparable to AMR, EUR, and EAS populations but does not carry any single unique pair. On the other hand, the AFR population only displays 26 SNP-pairs with significant values (Fig. 2), and most of them are common with four other populations.
Fig. 2.
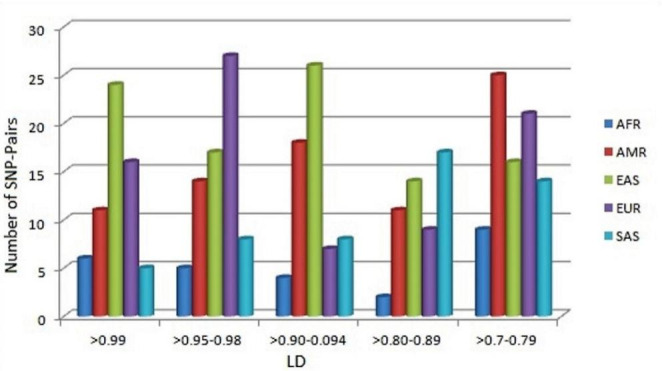
Range wise comparative representation of LD in SNP-pairs among world super-population (AFR: African, AMR: Ad Mixed American, EAS: East Asian, EUR: European, SAS: South Asian)
LD in SAS sub-populations
Mining for SAS sub-populations resulted in 87 SNP pairs in total, out of them 33 SNP-pairs belong to chromosome 1, and 21 belong to chromosome 10, rest of SNP-pairs are shared by chromosome- 5|2, 3|3, 2|4, 2|6, 8|7, 2|8, 3|12, 1|15, 4|16, 1|19, 1|20 and 1|22. Out of these 87, 24 SNP-pairs were found common in all five populations, and in fact, most of them show r2 ~ 1 (Fig. 3), which indicates that they are strongly associated with each other in all South Asian populations. Interestingly it has been found that out of all five populations’ only ITU shares unique (12) SNP pairs. It has been observed that rs3024500 is associated with 7 other SNPs and each of rs10494879, rs1878672, rs3024496 associated with 6 other SNPs, and rs12260112, rs2066470, rs2073337, rs2222202, rs2756104, rs3740074, rs3753582, rs3766747, rs4148385, and rs6584327 are associated with 5 SNPs. Other frequent SNPs are rs1518110, rs1537516, rs1800871, rs1800872, rs2242480, and rs3735451 each of which is associated with 4 other SNPs.
Fig. 3.
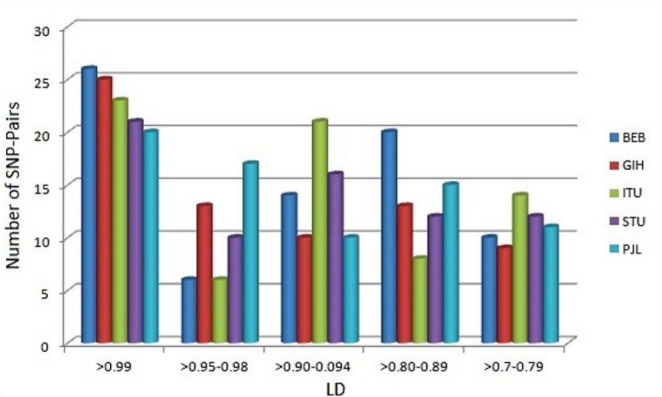
Range wise comparative representation of LD sharing among SAS subpopulations (BEB: Bengali from Bangladesh, GIH: Gujrati Indian from Houston, Texas, ITU: Indian Telugu from the UK, STU: Sri Lankan Tamil from the UK, PJL: Punjabi from Lahore, Pakistan)
Results for inter-population LD variations, among the population, indicate that four populations, i.e., STU (69), PJL (70), GIH (68), and BEB (72) share similar kind of association patterns among SNP-pairs. On the other hand, ITU also shows 62 SNP-pairs, but out of them, 12 are found unique and do not share by any other South Asian population.
SNP biomarker
SNP-pairs with high LD are very interesting and important for molecular biology purposes; they can be utilized as a potential biomarker for genome-wide association studies (GWAS) and related phenotypic features (Alwi 2005; Uffelmann et al. 2021). On the basis of population-specific LD, SNP-pair can be either considered as a universal marker or a population-specific (private) marker. As annotation indicated that 53 SNPs are associated with pharmaco-clinical phenotypes, out of these 53, 21 SNPs were significantly paired with other SNPs and formed 24 significant pairs in total (Fig. 4). Interestingly, out of 21 clinically significant SNPs, 7 SNPs, i.e., rs1800871 (4), rs1800872 (4), rs2066470 (2), rs2242480 (2), rs2501873 (2), rs3003596 (2), and rs4646437 (2) are involved in multiple associations (Table 3).
Fig. 4.
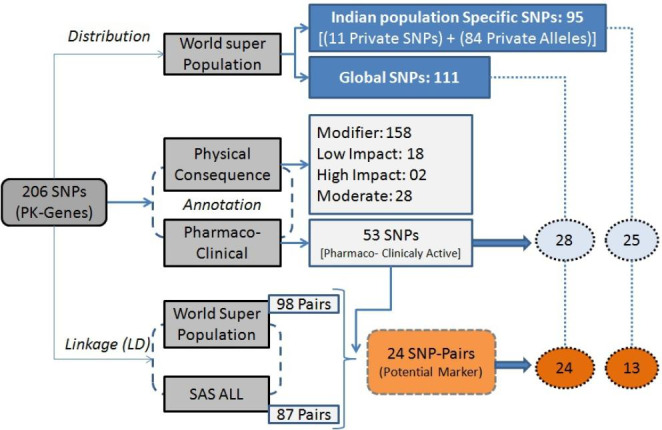
Synopsis of overall analysis of Indian populated SNPs belongs to pharmacokinetics genes
Table 3.
Association (LD) between SNP-pairs and their distribution across populations
| S. No. | rsID of SNP-Pairs | World ALL | SAS ALL | |
|---|---|---|---|---|
| Reference* | Associated SNPs | |||
| 1 | rs2066470 | rs3766747 | 0.934 | 1.0 |
| 2 | rs2502815 | rs2502805 | 0.788 | 0.801 |
| 3 | rs1800871 | rs1800872 | 0.998 | 1.0 |
| 4 | rs2501873 | rs3003596 | 0.828 | 0.992 |
| 5 | rs2274976 | rs1537516 | 0.638 | 0.716 |
| 6 | rs4553808 | rs231777 | 0.801 | 0.846 |
| 7 | rs167770 | rs226082 | 0.948 | 0.991 |
| 8 | rs4646437 | rs2242480 | 0.724 | 0.915 |
| 9 | rs1208 | rs1801280 | 0.823 | 0.914 |
| 10 | rs11572080 | rs10509681 | 1.0 | 1.0 |
| 11 | rs739837 | rs7963776 | 0.807 | 0.927 |
| 12 | rs4803419 | rs4803418 | 0.936 | 1.0 |
| 13 | rs4823613 | rs5767700 | 0.589 | 0.773 |
| 14 | rs2242480 | rs2687077 | 0.482 | 0.723 |
| 15 | rs2066470 | rs3753582 | 0.932 | 0.97 |
| 16 | rs1800872 | rs1518110 | 0.962 | 0.94 |
| 17 | rs1800871 | rs1518110 | 0.961 | 0.94 |
| 18 | rs1800872 | rs1800871 | 0.998 | 1.0 |
| 19 | rs3003596 | rs2501873 | 0.828 | 0.992 |
| 20 | rs1800871 | rs1518110 | 0.961 | 0.94 |
| 21 | rs1800872 | rs1518110 | 0.962 | 0.94 |
| 22 | rs2242480 | rs3735451 | 0.768 | 0.914 |
| 23 | rs3087243 | rs11571315 | 0.467 | 0.709 |
| 24 | rs4646437 | rs3735451 | 0.676 | 0.833 |
* Found to be associated with pharmaco-clinical features
High r2 values indicate that both SNPs of SNP-pairs convey similar information, as one allele of the first SNP of the pair is often observed with one allele of the second SNP of the pair, so only one of the two SNPs needs to be genotyped to capture the presence of the allelic polymorphism (Bush and Moore 2012). It is noticeable that all 24 SNP-pairs in Table 3 show presence in both, the world and SAS populations, but out of these, 13 have Indian population-specific variants (minor-major alleles) which are different from the rest of the population. As noted, before, patterns of LD are population-specific, thus tag SNPs selected for one population may not work well for different populations. To avoid false-positive tagging or redundant information, the use of these 13 SNP-pairs for global genotyping needs to take care of allelic variations during LD analysis. The rest of the 11 SNP-pairs, as their minor and major alleles are common in global populations, their use of genotyping will be straightforward with similar alleles in all populations in comparison and thus act as universal SNP-tags (Li et al. 2008).
Though in Table 3, Only, SNP-Pairs with pharmaco-clinical significance were mentioned, various other SNP-pairs, whose phenotypic information is not available, were also mined. The use of all of these SNPs-pair for population-specific GWAS mainly with reference to the pharmacokinetics studies is expected. As they all belong to genes involved in the ADMET process, it is anticipated that as soon as their annotation is available, they will be further explored for their pharmaco-clinical connection.
Conclusion
It is imperative to have knowledge about population-specific SNPs with relevance to pharmacogenomics. In this study, Mining, distribution pattern, and annotation were performed for 206 SNPs of pharmacokinetics importance, reported in the Indian population. Distribution patterns suggest a wide range of distribution of SNPs among the world’s super-population and South Asian sub-population, eleven private SNPs for the Indian population were also observed. Annotation suggested that out of 206 considered SNPs, 53 are reported to be associated with pharmaco-clinical phenotypes and affect the pharmacokinetics of the drugs. Linkage disequilibrium through r2 suggests that the number of SNPs forms considerable SNP-pairs, whose number varies from population to population. Further, it has been observed that 24 of these SNP-pairs have the potential to be used as markers (Tag-SNPs) for pharmaco-clinical phenotypes. It is assumed that the information produced through this study, after experimental validation, may be useful for further GWAS for pharmacogenomics-based pharmaco-clinical phenotype purposes among populations in the near future.
Electronic supplementary material
Below is the link to the electronic supplementary material.
Table S1: Distribution patterns of candidate SNPs
Acknowledgements
The contribution of AY is a part of her Ph.D. work.
Author contributions
AY: Contributed to the implementation of the research, to the analysis of the results, and to the writing of the manuscript SS: Contribute to population-wise data analysis and interpretation ST: Performed SNP annotation for their clinical significance NK: Prepared figures PK: Design and supervised the work, and writing & communicating the manuscript Note: All authors reviewed the manuscript.
Declarations
Competing interests
The authors declare no competing interests.
Footnotes
Publisher’s Note
Springer Nature remains neutral with regard to jurisdictional claims in published maps and institutional affiliations.
References
- Alwi ZB. The use of SNPs in Pharmacogenomics Studies. Malays J Med Sci. 2005;12:4–12. [PMC free article] [PubMed] [Google Scholar]
- Arbitrio M, Scionti F, Di Martino MT, Caracciolo D, Pensabene L, Tassone P, Tagliaferri P. Pharmacogenomics biomarker discovery and validation for translation in clinical practice. Clin Transl Sci. 2021;14:113–119. doi: 10.1111/cts.12869. [DOI] [PMC free article] [PubMed] [Google Scholar]
- Baye TM, Wilke RA, Olivier M. Genomic and geographic distribution of private SNPs and pathways in human populations. Per Med. 2009;6:623–641. doi: 10.2217/pme.09.54. [DOI] [PMC free article] [PubMed] [Google Scholar]
- Bongaarts J. Human population growth and the demographic transition. Philos Trans R Soc Lond B Biol Sci. 2009;364:2985–2990. doi: 10.1098/rstb.2009.0137. [DOI] [PMC free article] [PubMed] [Google Scholar]
- Burt T, Dhillon S. Pharmacogenomics in early-phase clinical development. Pharmacogenomics. 2013;14:1085–1097. doi: 10.2217/pgs.13.81. [DOI] [PMC free article] [PubMed] [Google Scholar]
- Bush WS, Moore JH. Chap. 11: genome-wide association studies. PLoS Comput Biol. 2012;8:1–11. doi: 10.1371/journal.pcbi.1002822. [DOI] [PMC free article] [PubMed] [Google Scholar]
- Choudhury A, Hazelhurst S, Meintjes A, et al. Population-specific common SNPs reflect demographic histories and highlight regions of genomic plasticity with functional relevance. BMC Genomics. 2014;15:1–20. doi: 10.1186/1471-2164-15-437. [DOI] [PMC free article] [PubMed] [Google Scholar]
- Crews KR, Hicks JK, Pui CH, Relling MV, Evans WE. Pharmacogenomics and individualized medicine: translating science into practice. Clin Pharmacol Ther. 2012;92(4):467–475. doi: 10.1038/clpt.2012.120. [DOI] [PMC free article] [PubMed] [Google Scholar]
- Crosslin DR, Qin X, Hauser ER. Assessment of LD matrix measures for the analysis of biological pathway association. Stat Appl Genet Mol Biol. 2010;9:1–44. doi: 10.2202/1544-6115.1561. [DOI] [PMC free article] [PubMed] [Google Scholar]
- De La Vega FM, Dailey D, Ziegle J, Williams J, Madden D, Gilbert DA. New generation pharmacogenomic tools: a SNP linkage disequilibrium map, validated SNP assay resource, and high-throughput instrumentation system for large-scale genetic studies. Biotechniques. 2002;52:48–54. doi: 10.2144/jun0209. [DOI] [PubMed] [Google Scholar]
- García-Fernández C, Sánchez JA, Blanco G. SNP-haplotypes: an accurate approach for parentage and relatedness inference in gilthead sea bream (Sparus aurata) Aquaculture. 2018;495:582–591. doi: 10.1016/j.aquaculture.2018.06.019. [DOI] [Google Scholar]
- Genomes Project Consortium. Auton A, Brooks LD, et al. A global reference for human genetic variation. Nature. 2015;526:68–74. doi: 10.1038/nature15393. [DOI] [PMC free article] [PubMed] [Google Scholar]
- Glassman PM, Muzykantov VR. Pharmacokinetic and pharmacodynamic properties of drug delivery systems. J Pharmacol Exp Ther. 2019;370:570–580. doi: 10.1124/jpet.119.257113. [DOI] [PMC free article] [PubMed] [Google Scholar]
- González-Covarrubias V, Lozano K, Texis T, Guzmán-Cruz CK, Rodríguez-Dorantes M, Rubio-Carrasco K, Méndez-Lorenzo HL, Soberón X. Pharmacogenomics: current actionable variants. Revista de investigación clínica. 2020;72:271–279. doi: 10.24875/RIC.20003239. [DOI] [PubMed] [Google Scholar]
- GUaRDIAN Consortium. Sivasubbu S, Scaria V. Genomics of rare genetic diseases-experiences from India. Hum Genomics. 2019;13:1–18. doi: 10.1186/s40246-019-0215-5. [DOI] [PMC free article] [PubMed] [Google Scholar]
- Hinds DA, Stuve LL, Nilsen GB, et al. Whole-genome patterns of common DNA variation in three human populations. Science. 2005;307:1072–1079. doi: 10.1126/science.1105436. [DOI] [PubMed] [Google Scholar]
- Huang T, Shu Y, Cai YD. Genetic differences among ethnic groups. BMC Genomics. 2015;16:1–10. doi: 10.1186/s12864-015-2328-0. [DOI] [PMC free article] [PubMed] [Google Scholar]
- Indian Genome Variation Consortium The Indian Genome Variation database (IGVdb): a project overview. Hum Genet. 2005;118:1–11. doi: 10.1007/s00439-005-0009-9. [DOI] [PubMed] [Google Scholar]
- Jain A, Bhoyar RC, Pandhare K, et al. IndiGenomes: a comprehensive resource of genetic variants from over 1000 indian genomes. Nucleic Acids Res. 2021;49:1225–1232. doi: 10.1093/nar/gkaa923. [DOI] [PMC free article] [PubMed] [Google Scholar]
- Ji X, Ning B, Liu J, et al. Towards population-specific pharmacogenomics in the era of next-generation sequencing. Drug Discov Today. 2021;26:1776–1783. doi: 10.1016/j.drudis.2021.04.015. [DOI] [PubMed] [Google Scholar]
- Katara P. Role of bioinformatics and pharmacogenomics in drug discovery and development process. Netw Model Anal Health Inform Bioinforma. 2013;2:225–230. doi: 10.1007/s13721-013-0039-5. [DOI] [Google Scholar]
- Katara P. Single nucleotide polymorphism and its dynamics for pharmacogenomics. Interdiscip Sci. 2014;6:85–92. doi: 10.1007/s12539-013-0007-x. [DOI] [PubMed] [Google Scholar]
- Katara P, Yadav A. Pharmacogenes (PGx-genes): current understanding and future directions. Gene. 2019;718:1–12. doi: 10.1016/j.gene.2019.144050. [DOI] [PubMed] [Google Scholar]
- Landrum MJ, Lee JM, Benson M, Brown GR, Chao C, Chitipiralla S, Gu B, Hart J, Hoffman D, Jang W, Karapetyan K. ClinVar: improving access to variant interpretations and supporting evidence. Nucleic Acids Res. 2018;46:1062–1067. doi: 10.1093/nar/gkx1153. [DOI] [PMC free article] [PubMed] [Google Scholar]
- Lauschke VM, Milani L, Ingelman-Sundberg M. Pharmacogenomic biomarkers for Improved Drug Therapy-Recent progress and future developments. AAPS J. 2017;20:1–16. doi: 10.1208/s12248-017-0161-x. [DOI] [PubMed] [Google Scholar]
- Li M, Li C, Guan W. Evaluation of coverage variation of SNP chips for genome-wide association studies. Eur J Hum Genet. 2008;16:635–643. doi: 10.1038/sj.ejhg.5202007. [DOI] [PubMed] [Google Scholar]
- Miller JE, Veturi Y, Ritchie MD. Innovative strategies for annotating the “relationSNP” between variants and molecular phenotypes. BioData Min. 2019;12:1–22. doi: 10.1186/s13040-019-0197-9. [DOI] [PMC free article] [PubMed] [Google Scholar]
- Oscanoa J, Sivapalan L, Gadaleta E, Dayem Ullah AZ, Lemoine NR, Chelala C. SNPnexus: a web server for functional annotation of human genome sequence variation (2020 update) Nucleic Acids Res. 2020;48:185–192. doi: 10.1093/nar/gkaa420. [DOI] [PMC free article] [PubMed] [Google Scholar]
- Pandey S, Dhusia K, Katara P, Singh S, Gautam B. An in-silico analysis of deleterious single nucleotide polymorphisms and molecular dynamics simulation of disease linked mutations in genes responsible for neurodegenerative disorder. J Biomol Struct Dyn. 2020;38:4259–4272. doi: 10.1080/07391102.2019.1682047. [DOI] [PubMed] [Google Scholar]
- Roden DM, Wilke RA, Kroemer HK, Stein CM. Pharmacogenomics: the genetics of variable drug responses. Circulation. 2011;123:1661–1670. doi: 10.1161/CIRCULATIONAHA.109.914820. [DOI] [PMC free article] [PubMed] [Google Scholar]
- Roden DM, McLeod HL, Relling MV, et al. Pharmacogenomics Lancet. 2019;394:521–532. doi: 10.1016/S0140-6736(19)31276-0. [DOI] [PMC free article] [PubMed] [Google Scholar]
- Shastry BS. SNPs in disease gene mapping, medicinal drug development and evolution. J Hum Genet. 2007;52:871–880. doi: 10.1007/s10038-007-0200-z. [DOI] [PubMed] [Google Scholar]
- Shastry BS. SNPs: impact on gene function and phenotype. Methods Mol Biol. 2009;578:3–22. doi: 10.1007/978-1-60327-411-1_1. [DOI] [PubMed] [Google Scholar]
- Sim SC, Ingelman-Sundberg M. Pharmacogenomic biomarkers: new tools in current and future drug therapy. Trends Pharmacol Sci. 2011;32:72–81. doi: 10.1016/j.tips.2010.11.008. [DOI] [PubMed] [Google Scholar]
- Sosa-Macías M, Teran E, Waters W, et al. Pharmacogenetics and ethnicity: relevance for clinical implementation, clinical trials, pharmacovigilance and drug regulation in Latin America. Pharmacogenomics. 2016;17:1741–1747. doi: 10.2217/pgs-2016-0153. [DOI] [PubMed] [Google Scholar]
- Srivastava S, Katara P. Distribution of indian population-specific transporter SNPs among Asians and their physiological consequences. Meta Gene. 2020;26:1–6. doi: 10.1016/j.mgene.2020.100764. [DOI] [Google Scholar]
- Suarez-Kurtz G, Parra EJ. Population Diversity in Pharmacogenetics: a latin american perspective. Adv Pharmacol. 2018;83:133–154. doi: 10.1016/bs.apha.2018.02.001. [DOI] [PubMed] [Google Scholar]
- Thorn CF, Klein TE, Altman RB. PharmGKB: the pharmacogenomics knowledge base. Methods Mol Biol. 2013;1015:311–320. doi: 10.1007/978-1-62703-435-7_20. [DOI] [PMC free article] [PubMed] [Google Scholar]
- Uffelmann E, Huang QQ, Munung NS, et al. Genome-wide association studies. Nat Rev Methods Primers. 2021;1 59:1–21. [Google Scholar]
- Van Rooij JGJ, Jhamai M, Arp PP, et al. Population-specific genetic variation in large sequencing data sets: why more data is still better. Eur J Hum Genet. 2017;25:1173–1175. doi: 10.1038/ejhg.2017.110. [DOI] [PMC free article] [PubMed] [Google Scholar]
- VanLiere JM, Rosenberg NA. Mathematical properties of the r2 measure of linkage disequilibrium. Theor Popul Biol. 2008;74:130–137. doi: 10.1016/j.tpb.2008.05.006. [DOI] [PMC free article] [PubMed] [Google Scholar]
- Yadav A, Katara P In-silico mining of SNP-effects on structural properties of CYP2C9 and their consequences. International Conference on Bioinformatics and Systems, Biology (2018) (BSB), Allahabad pp 136–140
- Yadav A, Kesharwani A, Chaurasia DK, Katara P (2022) Mining of molecular insights of CYP2A6 and its variants complex with coumarin (CYP2A6*-coumarin) using molecular dynamics simulation. J Biomol Struct Dynamics pp 1–12 [DOI] [PubMed]
Associated Data
This section collects any data citations, data availability statements, or supplementary materials included in this article.
Supplementary Materials
Table S1: Distribution patterns of candidate SNPs