

Abstract
Purpose
Retinoic acid inducible protein 3 (RAI3) has been suggested as prognostic biomarker in several cancer types. The present study aimed to examine the role of RAI3 expression in non-small cell lung cancers (NSCLCs).
Methods
RAI3 protein expression was evaluated by immunohistochemistry in tissue microarray (TMA) sections from a retrospective cohort of more than 600 surgically resected NSCLCs and results were compared with clinicopathological features and follow-up data.
Results
While membranous RAI3 immunostaining was always strong in benign lung, strong RAI3 staining was only detectable in 14.7% of 530 interpretable NSCLCs. Within NSCLC subtypes, immunostaining intensity for RAI3 was significantly decreased in large cell lung cancers (LCLCs) and squamous cell carcinomas (SQCCs) relative to lung adenocarcinomas (LUACs) (P < 0.0001 each). However, RAI3 staining was neither associated with pathological features of NSCLCs nor with survival of patients (P = 0.6915).
Conclusion
Our study shows that RAI3 expression was not associated with clinical outcomes of NSCLC patients and cannot be considered as prognostic marker in lung cancer patients.
Keywords: RAI3, Lung adenocarcinoma, Squamous cell lung carcinoma, Large cell lung carcinoma, Immunohistochemistry, Non-small cell lung cancer
Introduction
Non-small cell lung cancer (NSCLC) is a heterogeneity disease and to date, specific clinical factors and tumor stage are established as prognostic markers. Nevertheless, prognosis within stage may vary significantly. Therefore, the identification of novel biomarkers reflecting the early diagnosis and exact assessment of individual patient prognosis and thus enable better decision-making in the individual treatment of NSCLC patients are desperately needed.
The retinoic-acid inducible protein 3 (RAI3), also known as G-protein-coupled receptor family C group 5 type A (GPRC5A) consists of extracellular ligand-binding-, transmembrane, and internal C-terminal domain (Li et al. 2005). The intracellular C-terminus interacts with G-proteins that bind guanidine-nucleotides and can activate downstream effectors such as adenyl cyclases, phospholipases, phosphodiesterases and ion channels when an agonist binds to the extracellular portion of the receptor (McCudden et al. 2005). GPCRs activate numerous signal transduction cascades and thus play pivotal role in the regulation of many physiological processes, including cell growth and differentiation (Shore and Reggio 2015).
Previous studies have suggested that dysregulation of RAI3 expression is associated with several malignancies, including increased RAI3 expression in colorectal (Kume et al. 2014; Zougman et al. 2013) and breast cancer (Jörißen et al. 2009) or decreased RAI3 expression in oral squamous cell (Liu et al. 2013), non-small cell lung (Fujimoto et al. 2012), hepatocellular (Zheng et al. 2014), and gastric cancer (Cheng et al. 2012).
For lung, RAI3 overexpression resulted in reduced cell growth in NSCLC cell line H1792 (Xu et al. 2005), GPRCA5-knockout mice developed spontaneous lung tumors (Tao et al. 2007) and loss of heterozygosity of chromosome 12p, where GPRC5A gene resides has been frequently detected in human NSCLCs (Takeuchi et al. 1996; Grepmeier et al. 2005). In addition, reduced RAI3 protein expression has been suggested in malignant relative to benign lung (Fujimoto et al. 2012; Lin et al. 2014). To further examine the role of RAI3 immunostaining in NSCLCs, we took advantage of our TMA containing of more than 600 lung cancer specimens with follow-up data. Our study shows that RAI3 expression was not associated with prognosis of NSCLC patients.
Patients and methods
Patient cohort and TMA construction
Lung cancer TMAs with a total of 619 NSCLC specimens were included in this study. Patients were treated at the University Medical Center Hamburg-Eppendorf, Germany. The TMAs contained 619 NSCLC specimens, including 227 LUACs, 134 LCLCs, and 258 lung SQCCs. Raw survival data were obtained from the responsible physicians for 300 patients. The median follow-up time was 18.3 months (range 0–155 months). TMA construction was as described (Mirlacher and Simon 2010). In brief, hematoxylin and eosin-stained sections were made from each block to define representative tumor regions. One tissue cylinder with a diameter of 0.6 mm was then punched from the tumor on the “donor” tissue block using a home-made semi-automated precision instrument and brought into empty recipient paraffin blocks. Four µm sections of the resulting TMA blocks were transferred to an adhesive coated slide system (Instrumedics Inc., Hackensack, New Jersey). The usage of tissue microarrays for research purposes has been approved by the local ethics committee.
Immunohistochemical staining
Freshly cut TMA sections were analyzed on 1 day and in one experiment. Slides were deparaffinized and exposed to heat-induced antigen retrieval for 5 min in an autoclave at 121 C in pH 7.8 Tris–EDTA-Citrate buffer. Primary antibody specific for RAI3 (polyclonal rabbit, NB100-310; Novus Biological; at 1/450 dilution) was applied at 37 °C for 60 min. Bound antibody was then visualized using the EnVision Kit (Dako, Glostrup, Denmark) according to the manufacturer’s directions. RAI3 staining was analyzed by one person (KG) experienced in immunohistochemisty. Assessment of immunostaining was performed in four categories: negative, weak, moderate, and strong immunostaining.
Statistical analysis
Statistical calculations were performed with JMP® 10.0.2 software (2012 SAS Institute Inc., NC, USA). Contingency tables and the chi-square test were performed to search for associations between molecular parameters and tumor phenotype. Survival curves were calculated according to Kaplan–Meier. The Log-Rank test was applied to detect significant survival differences between groups. Cox proportional hazards regression analysis was performed to test the statistical independence and significance between pathological, molecular and clinical variables.
Results
Prevalence of RAI3 immunostaining in NSCLCs
We obtained interpretable staining results for RAI3 in a total of 530 of 619 (84.1%) tumor samples. The reason for failure was insufficient tumor cells available for scoring. Immunoreactivity for RAI3 was predominantly detectable in the membranes of the cells. Immunostaining intensity for RAI3 was always strong in benign lung and was decreased in tumors relative to normal tissue. In NSCLCs, positive RAI3 staining was only observed in 73.6% of 530 interpretable NSCLCs, including 32.3% with weak, 26.6% with moderate, and 14.7% with strong staining. Representative images of RAI3 immunohistochemical membranous protein expression are given in Fig. 1. Within NSCLCs, RAI3 expression was significantly lower in LCLCs and SQCCs than in LUACs (P < 0.0001 each) as visualized in Fig. 2.
Fig. 1.
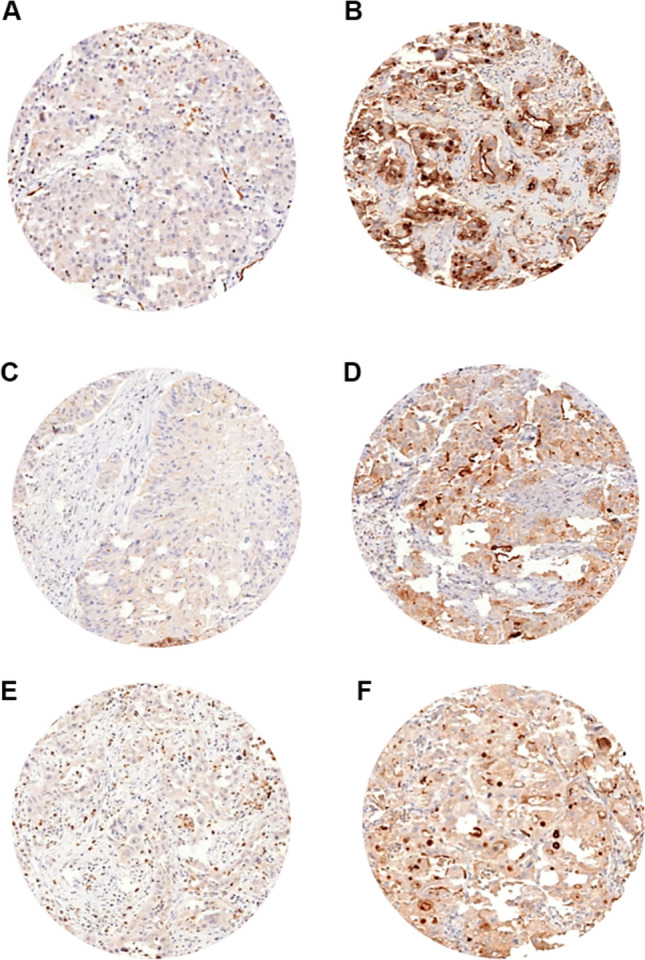
RAI3 immunohistochemical membranous protein expression in NSCLC subtypes. Immunohistochemical examples of negative and strong RAI3 immunostaining in LUACs, LCLCs, and SQCCs
Fig. 2.

Frequency of RAI staining intensities in NSCLC subtypes. Immunostaining intensity for RAI3 was decreased in LCLCs and SQCCs relative to LUACs (P < 0.0001 each)
Prognostic significance of RAI3 immunostaining in NSCLCs
In the analysis of all NSCLCs, RAI3 staining was not strongly linked to pathological tumor stage (P = 0.3012), lymph node and distant metastasis status (P = 0.1398 and P = 0.0816) as shown in Table 1. Additionally, there were no significances observed between RAI3 staining and clinicopathological features in histological subsets of NSCSLs (Table 2).
Table 1.
Correlation between RAI3 immunostaining and clinicopathological features of NSCLCs
| Clinicopathologic parameter | n on TMA | RAI3 immunostaining | P value | ||||
|---|---|---|---|---|---|---|---|
| n evaluable | (%) negative | (%) weak | (%) moderate | (%) strong | |||
| All cancers | 619 | 530 | 26.42 | 32.26 | 26.6 | 14.72 | |
| Histology | |||||||
| Adenocarcinoma | 227 | 196 | 10.2 | 30.1 | 37.24 | 22.45 | < 0.0001 |
| Large cell carcinoma | 134 | 111 | 29.73 | 36.94 | 16.22 | 17.12 | |
| Squamous cell carcinoma | 258 | 223 | 39.01 | 31.84 | 22.42 | 6.73 | |
| pT stage | |||||||
| pT1 | 174 | 140 | 19.29 | 33.57 | 32.14 | 15 | 0.3021 |
| pT2 | 323 | 291 | 28.52 | 31.62 | 25.43 | 14.43 | |
| pT3 | 53 | 46 | 30.43 | 30.43 | 21.74 | 17.39 | |
| pT4 | 50 | 43 | 34.88 | 37.21 | 13.95 | 13.95 | |
| N status | |||||||
| pN0 | 264 | 227 | 22.91 | 32.6 | 28.63 | 15.86 | 0.1398 |
| pN1 | 164 | 146 | 34.25 | 31.51 | 23.29 | 10.96 | |
| pN2 | 111 | 94 | 27.66 | 38.3 | 20.21 | 13.83 | |
| pN3 | 18 | 16 | 25 | 43.75 | 6.25 | 25 | |
| M status | |||||||
| M0 | 577 | 500 | 27.4 | 32.4 | 25.8 | 14.4 | 0.0816 |
| M1 | 33 | 25 | 8 | 32 | 36 | 24 | |
Table 2.
Correlation between RAI3 immunostaining and clinicopathological features of (A) LUACs, (B) LCLCs, and (C) SQCCs
| (A) | ||||||
|---|---|---|---|---|---|---|
| Clinicopathologic parameter | RAI3 immunostaining | P value | ||||
| n evaluable | (%) Negative | (%) Weak | (%) Moderate | (%) Strong | ||
| Tumors | 196 | 10.2 | 30.1 | 37.24 | 22.45 | |
| pT stage | ||||||
| pT1 | 67 | 7.46 | 32.84 | 46.27 | 13.43 | 0.4229 |
| pT2 | 95 | 11.58 | 30.53 | 29.47 | 28.42 | |
| pT3 | 13 | 7.69 | 30.77 | 30.77 | 30.77 | |
| pT4 | 13 | 15.38 | 23.08 | 38.46 | 23.08 | |
| N status | ||||||
| pN0 | 94 | 10.64 | 31.91 | 35.11 | 22.34 | 0.6772 |
| pN1 | 36 | 8.33 | 33.33 | 38.89 | 19.44 | |
| pN2 | 34 | 11.76 | 38.24 | 23.53 | 26.47 | |
| pN3 | 5 | 20 | 40 | 0 | 40 | |
| M status | ||||||
| M0 | 178 | 10.67 | 31.46 | 36.52 | 21.35 | 0.0901 |
| M1 | 13 | 0 | 15.38 | 38.46 | 46.15 | |
| (B) | ||||||
|---|---|---|---|---|---|---|
| Clinicopathologic parameter | RAI3 immunostaining | P value | ||||
| n evaluable | (%) Negative | (%) Weak | (%) Moderate | (%) Strong | ||
| Tumors | 111 | 29.73 | 36.94 | 16.22 | 17.12 | |
| pT stage | ||||||
| pT1 | 33 | 21.21 | 36.36 | 15.15 | 27.27 | 0.5218 |
| pT2 | 58 | 34.48 | 39.66 | 17.24 | 8.62 | |
| pT3 | 9 | 22.22 | 33.33 | 22.22 | 22.22 | |
| pT4 | 11 | 36.36 | 27.27 | 9.09 | 27.27 | |
| N status | ||||||
| pN0 | 51 | 27.45 | 35.29 | 19.61 | 17.65 | 0.97 |
| pN1 | 23 | 26.09 | 47.83 | 8.7 | 17.39 | |
| pN2 | 19 | 21.05 | 42.11 | 15.79 | 21.05 | |
| pN3 | 8 | 37.5 | 37.5 | 12.5 | 12.5 | |
| M status | ||||||
| M0 | 109 | 29.36 | 37.61 | 15.6 | 17.43 | 0.3417 |
| M1 | 2 | 50 | 0 | 50 | 0 | |
| C) | ||||||
|---|---|---|---|---|---|---|
| Clinicopatholgic parameter | RAI3 immunostaining | P value | ||||
| N evaluable | (%) Negative | (%) Weak | (%) Moderate | (%) Strong | ||
| Tumors | 223 | 39.01 | 31.84 | 22.42 | 6.73 | |
| pT stage | ||||||
| pT1 | 40 | 37.5 | 32.5 | 22.5 | 7.5 | 0.0743 |
| pT2 | 138 | 37.68 | 28.99 | 26.09 | 7.25 | |
| pT3 | 24 | 45.83 | 29.17 | 16.67 | 8.33 | |
| pT4 | 19 | 47.37 | 52.63 | 0 | 0 | |
| N status | ||||||
| pN0 | 82 | 34.15 | 31.71 | 26.83 | 7.32 | 0.0799 |
| pN1 | 87 | 47.13 | 26.44 | 20.69 | 5.75 | |
| pN2 | 41 | 43.9 | 36.59 | 19.51 | 0 | |
| pN3 | 3 | 0 | 66.67 | 0 | 33.33 | |
| M status | ||||||
| M0 | 213 | 40.38 | 30.52 | 22.07 | 7.04 | 0.0755 |
| M1 | 10 | 10 | 60 | 30 | 0 | |
Survival curves demonstrated that RAI3 expression was unrelated to outcome if all NSCLCs (P = 0.6915) or subsets of LUACs (P = 0.6208), LCLCs (P = 0.2807), and SQCCs (P = 0. 0.2062) were analyzed (Fig. 3).
Fig. 3.

Clinical impact of RAI3 in NSCLCs. Kaplan–Meier plots for the overall survival rate in all NSCLC patients (P = 0.6915) and in subsets of LUAC (P = 0.6208), LCLC (P = 0.2807), and SQCC (P = 0.2062) patients
Discussion
The successful analysis of RAI3 expression revealed that RAI3 expression was decreased in malignant as compared to benign tissue. A comparison with clinicopathological parameters of tumor aggressiveness did not suggest a clinical significance of RAI3 expression in lung cancers.
Here, we identify lower levels of RAI3 immunostaining in lung cancers than normal bronchial epithelia. This result is in line with previous studies analyzing RAI3 expression in cohorts of 150 and 474 NSCLC patients (Lin et al. 2014; Fujimoto et al. 2012). The functional relevance of RAI3 expression in benign lung was previously highlighted by earlier studies demonstrating that GPRC5A-knockout mice spontaneous develop lung adenomas and adenocarcinomas (Tao et al. 2007) and that loss of heterozygosity of chromosome 12p13 is a common alteration in NSCLCs (Takeuchi et al. 1996; Grepmeier et al. 2005). Taken together, it is tempting to suggest that GPRC5A might have a tumor-suppressive function in lung epithelial cells.
Within NSCLC subtypes, RAI3 expression was significantly decreased in LCLCs and SQCCs relative to LUACs. This observation is in accordance with the study of Fujimoto et al. (Fujimoto et al. 2012) on RAI3 expression in a cohort of 474 NSCLC patients, describing a positive association between RAI3 expression and LUAC histology (Fujimoto et al. 2012). Moreover, Fujimoto et al. (Fujimoto et al. 2012) suggested that RAI3 expression was highest in disease-free lung, decreased and intermediate in lung of cancer-free COPD patients and further attenuated and lowest in epithelia of COPD patients with LUAC and SQCC histology. These findings pinpoint to a potential tumor-suppressive role, similar to that established in mice, of GPRC5A in the sequential development of human NSCLC, in particular those associated with inflammatory chronic obstructive disease which is a major risk factor for lung cancer and shares various pathogenic features with lung tumor (Wistuba and Gazdar 2006).
The mechanism how RAI3 drives lung carcinogenesis remains elusive. Interestingly, GPRC5A-knockout mice developed LUACs and not LCLCs and SQCCs (Tao et al. 2007). These findings may be due to biological pathway-specific gene signatures that are differentially expressed and relevant in distinct subtypes of NSCLC. Previous microarray analysis showed that the transcriptomes of lung epithelial cells of GPRC5A-knockout defined a loss-of-GPRC5A gene signature, which was characterized by many aberrations in cancer-associated pathways, and was prevalent in human LUACs compared with SQCCs or normal lung (Wistuba and Gazdar 2006).
In literature, RAI3 has been suggested as prognostic marker in several cancer types, including colon cancer (Kume et al. 2014; Zougman et al. 2013), gastric cancer (Cheng et al. 2012), oral squamous cell carcinoma (Liu et al. 2013), and hepatocellular carcinoma (Zheng et al. 2014). In contrast, we were not able to find a prognostic significance of RAI3 expression.
In summary, these results exclude RAI3 as prognostic marker but underlines the potential role of RAI3 as tumor suppressor in lung cancer.
Abbreviations
- NSCLC
Non-small cell lung cancer
- RAI3
Retinoic acid inducible protein 3
- LCLCs
Large cell lung cancers
- SQCCs
Squamous cell carcinomas
- LUACs
Lung adenocarcinomas
- GPRC5A
G-protein-coupled receptor family C group 5 type A
- TMA
Tissue microarray
Author contributions
All authors contributed to the study conception and design. Material preparation, data collection and analysis were performed by all authors. The first draft of the manuscript was written by KG, NM and all authors commented on previous versions of the manuscript. All authors read and approved the final manuscript.
Funding
Open Access funding enabled and organized by Projekt DEAL. None.
Data availability
The datasets generated during and/or analyzed during the current study are available from the corresponding author on reasonable request.
Declarations
Conflict of interest
The authors have no relevant financial or non-financial interests to disclose.
Footnotes
Publisher's Note
Springer Nature remains neutral with regard to jurisdictional claims in published maps and institutional affiliations.
References
- Cheng L, Yang S, Yang Y et al (2012) Global gene expression and functional network analysis of gastric cancer identify extended pathway maps and GPRC5A as a potential biomarker. Cancer Lett 326:105–113. 10.1016/j.canlet.2012.07.031 [DOI] [PubMed] [Google Scholar]
- Fujimoto J, Kadara H, Garcia MM et al (2012) g-protein coupled receptor family C, group 5, member A (gprc5a) expression is decreased in the adjacent field and normal bronchial epithelia of patients with chronic obstructive pulmonary disease and non–small-cell lung cancer. J Thorac Oncol 7:1747–1754. 10.1097/JTO.0b013e31826bb1ff [DOI] [PMC free article] [PubMed] [Google Scholar]
- Grepmeier U, Dietmaier W, Merk J et al (2005) Deletions at chromosome 2q and 12p are early and frequent molecular alterations in bronchial epithelium and NSCLC of long-term smokers. Int J Oncol. 10.3892/ijo.27.2.481 [PubMed] [Google Scholar]
- Jörißen H, Bektas N, Dahl E et al (2009) Production and characterisation of monoclonal antibodies against RAI3 and its expression in human breast cancer. BMC Cancer 9:200. 10.1186/1471-2407-9-200 [DOI] [PMC free article] [PubMed] [Google Scholar]
- Kume H, Muraoka S, Kuga T et al (2014) Discovery of colorectal cancer biomarker candidates by membrane proteomic analysis and subsequent verification using selected reaction monitoring (SRM) and tissue microarray (TMA) analysis. Mol Cell Proteomics 13:1471–1484. 10.1074/mcp.M113.037093 [DOI] [PMC free article] [PubMed] [Google Scholar]
- Li S, Huang S, Peng S-B (2005) Overexpression of G protein-coupled receptors in cancer cells: involvement in tumor progression. Int J Oncol 27:1329–1339 [PubMed] [Google Scholar]
- Lin X, Zhong S, Ye X et al (2014) EGFR phosphorylates and inhibits lung tumor suppressor GPRC5A in lung cancer. Mol Cancer 13:233. 10.1186/1476-4598-13-233 [DOI] [PMC free article] [PubMed] [Google Scholar]
- Liu S, Zhong S, Ye D et al (2013) Repression of G protein-coupled receptor family C group 5 member A is associated with pathologic differentiation grade of oral squamous cell carcinoma. J Oral Pathol Med 42:761–768. 10.1111/jop.12077 [DOI] [PubMed] [Google Scholar]
- McCudden CR, Hains MD, Kimple RJ, Siderovski DP, Willard FS (2005) G-protein signaling: back to the future. Cell Mol Life Sci 62(5):551–577. 10.1007/s00018-004-4462-3 [DOI] [PMC free article] [PubMed] [Google Scholar]
- Mirlacher M, Simon R (2010) Recipient block TMA technique. In: Simon R (ed) Tissue microarrays. Humana Press, Totowa, pp 37–44 [DOI] [PubMed] [Google Scholar]
- Shore DM, Reggio PH (2015) The therapeutic potential of orphan GPCRs, GPR35 and GPR55. Front Pharmacol. 10.3389/fphar.2015.00069 [DOI] [PMC free article] [PubMed] [Google Scholar]
- Takeuchi S, Mori N, Koike M et al (1996) Frequent loss of heterozygosity in region of the KIP1 locus in non-small cell lung cancer: evidence for a new tumor suppressor gene on the short arm of chromosome 12. Cancer Res 56:738–740 [PubMed] [Google Scholar]
- Tao Q, Fujimoto J, Men T et al (2007) Identification of the retinoic acid-inducible gprc5a as a new lung tumor suppressor gene. JNCI J Natl Cancer Instit 99:1668–1682. 10.1093/jnci/djm208 [DOI] [PubMed] [Google Scholar]
- Wistuba II, Gazdar AF (2006) Lung cancer preneoplasia. Annu Rev Pathol Mech Dis 1:331–348. 10.1146/annurev.pathol.1.110304.100103 [DOI] [PubMed] [Google Scholar]
- Xu J, Tian J, Shapiro SD (2005) Normal lung development in RAIG1-deficient mice despite unique lung epithelium-specific expression. Am J Respir Cell Mol Biol 32:381–387. 10.1165/rcmb.2004-0343OC [DOI] [PubMed] [Google Scholar]
- Zheng J, Guo X, Gao X et al (2014) Overexpression of retinoic acid-induced protein 3 predicts poor prognosis for hepatocellular carcinoma. Clin Transl Oncol 16:57–63. 10.1007/s12094-013-1040-2 [DOI] [PubMed] [Google Scholar]
- Zougman A, Hutchins GG, Cairns DA et al (2013) Retinoic acid-induced protein 3: identification and characterisation of a novel prognostic colon cancer biomarker. Eur J Cancer 49:531–539. 10.1016/j.ejca.2012.07.031 [DOI] [PubMed] [Google Scholar]
Associated Data
This section collects any data citations, data availability statements, or supplementary materials included in this article.
Data Availability Statement
The datasets generated during and/or analyzed during the current study are available from the corresponding author on reasonable request.