Abstract
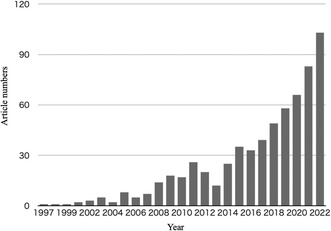
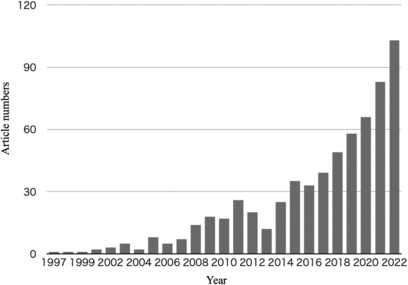
Dramatical increase in articles mentioning “directed acyclic graph.”

To the Editor,
Primary care research has been developing daily and addresses diseases and various fields involving local patients, communities, and practices to measure health improvements. In designing these studies, causal directed acyclic graphs (DAGs) are still novel for primary care researchers. DAGs comprise variable names and arrows following several rules and allow researchers to show their research concepts and causal relationship explaining bias structures, as well as confounding. Appropriate utilization of DAGs helps us visually distinguish between factors that require adjustment, such as confounders and bias, and those that do not. 1
Historically, DAGs are based on mathematical graph theory. 1 More recently, DAGs have helped evaluate causal relationships in epidemiology and medicine. 1 In estimating causal effects, the identification of adjustment variables using DAGs is beneficial for multivariable regression and other methods. DAGs can identify selection bias at the study design stage and observation period. Moreover, DAGs detect measurement bias, such as detection bias, and explore variables even in risk prediction regression models. 1 , 2 , 3 , 4
Some reviews and tutorials also introduced DAGs to clinical researchers. 1 , 5 Various research fields, including circulation, respiratory medicine, pediatrics, and psychiatry, recently mobilized DAGs. We searched the numbers of annual published articles mentioning DAGs in their title or abstract with PubMed (MEDLINE); the search term was “directed acyclic graphs [Title/Abstract]” between 1997 and 2022 in Figure 1, showing a dramatical increase trend. With the advancement of primary care research, it is time to make DAGs known to clinical researchers involving primary care and education.
FIGURE 1.

The searched article numbers mentioning “Directed acyclic graphs”.
Primary care research sometimes faces difficulty sharing research issues, researcher's challenges, and solutions, especially with non‐primary caregivers, due to the research issue's complex structure. DAGs can mitigate such issues, allowing researchers to share, and demonstrate their knowledge, theories, and assumptions about the relationships between variables transparently. 5 However, researchers should be aware that DAGs themselves do not provide a logical explanation for confounding factors. Adding expert background knowledge and real‐world observations will bring one closer to creating an accurate DAG.
In addition, there are some DAGs cautions to keep in mind when working with DAGs. Beginners need help in drawing DAGs following the rules. 1 , 2 , 3 Drawing DAGs need clinical knowledge background in the research field. The absence of critical variables produces bias, leading researchers to wrong causal assumptions. DAGs tend to suffer from small sample size effects such as random confounding or sparse data bias. 1 Even if the DAG is valid, the estimation may not work well when the sample size is small, leading to bias. Since even experts may draw different DAGs when there are multiple relevant factors, an iterative study is necessary for proper model building. We therefore emphasize the importance of DAG training for clinical researchers.
Sophisticated research is demanded in the primary care field now and in the future. Selecting variables inconsistent with the DAGs, such as adjusting variables that were not confounders and leaving bias, may drop the reliability of primary care research as a whole. Thus, we hope DAGs will cultivate primary care research and its education. 5
CONFLICT OF INTEREST STATEMENT
HI, TW, and RK have no conflicts of interest relevant to the content of this research.
ETHICS APPROVAL STATEMENT
None.
REFERENCES
- 1. Etminan M, Collins GS, Mansournia MA. Using causal diagrams to improve the design and interpretation of medical research. Chest. 2020;158(1):S21–8. 10.1016/j.chest.2020.03.011 [DOI] [PubMed] [Google Scholar]
- 2. Piccininni M, Konigorski S, Rohmann JL, Kurth T. Directed acyclic graphs and causal thinking in clinical risk prediction modeling. BMC Med Res Methodol. 2020;20(1):179. [DOI] [PMC free article] [PubMed] [Google Scholar]
- 3. Greenland S, Pearl J, Robins JM. Causal diagrams for epidemiologic research. Epidemiology. 1999;10(1):37–48. [PubMed] [Google Scholar]
- 4. Lash TL, VanderWeele TJ, Haneuse S, Rothman KJ. Modern Epidemiology. 4th ed. Lippincott Williams & Wilkins; 2021. p. 37–42. [Google Scholar]
- 5. Tennant PWG, Murray EJ, Arnold KF, Berrie L, Fox MP, Gadd SC, et al. Use of directed acyclic graphs (DAGs) to identify confounders in applied health research: review and recommendations. Int J Epidemiol. 2021;50(2):620–32. [DOI] [PMC free article] [PubMed] [Google Scholar]


