Abstract
We have previously demonstrated the importance of myofiber-collagen mechanical interactions in modeling the passive mechanical behavior of right ventricle free wall (RVFW) myocardium. To gain deeper insights into these coupling mechanisms, we developed a high-fidelity, micro-anatomically realistic 3D finite element model of right ventricle free wall (RVFW) myocardium by combining high-resolution imaging and supercomputerbased simulations. We first developed a representative tissue element (RTE) model at the sub-tissue scale by specializing the hyperelastic anisotropic structurally-based constitutive relations for myofibers and ECM collagen, and equi-biaxial and non-equibiaxial loading conditions were simulated using the open-source software FEniCS to compute the effective stress-strain response of the RTE. To estimate the model parameters of the RTE model, we first fitted a ‘top-down’ biaxial stress-strain behavior with our previous structurally based (tissue-scale) model, informed by the measured myofiber and collagen fiber composition and orientation distributions. Next, we employed a multi-scale approach to determine the tissue-level (5 × 5 × 0.7 mm specimen size) RVFW biaxial behavior via ‘bottom-up’ homogenization of the fitted RTE model, recapitulating the histologically measured myofiber and collagen orientation to the biaxial mechanical data. Our homogenization approach successfully reproduced the tissue-level mechanical behavior of our previous studies in all biaxial deformation modes, suggesting that the 3D micro-anatomical arrangement of myofibers and ECM collagen is indeed a primary mechanism driving myofiber-collagen interactions.
Keywords: Myocardium mechanics, Image based modeling, Finite element modeling
1. Introduction
Pulmonary arterial hypertension (PAH) often leads to significant adaptations in the tissue structure and mechanical behavior of the right ventricle (RV). PAH induces an increase in resistance of the pulmonary vasculature that, as a direct result, imposes a chronic pressure overload on the RV (Benza et al., 2007; Naeije and Manes, 2014). This in turn causes the RV to initially thicken via hypertrophy of the myofibers to mitigate increased wall stress, but later dilate and lose contractile function, leading to a reduction in cardiac output and RV failure (Lai et al., 2014; Pinsky, 2016). Previous work characterizing the complex changes in PAH has identified that the amount of RV remodeling resulting from pressure overload is one of the major predictors of poor prognosis in RV function (Bogaard et al., 2009; McLaughlin et al., 2015; Jang et al., 2017). As such, there is a need to quantify the functional state of the RV in order to identify factors influencing the onset, progression, and potential reversibility of remodeling in response to PAH (Hemnes and Champion, 2008; Sakao et al., 2010).
Past studies on the characterization of normal and diseased RV myocardium mechanics have involved experimental mechanical and histological evaluation on excised tissue specimens of the right ventricular free wall (RVFW) (Sacks and Chuong, 1993; Hill et al., 2014a; Avazmohammadi et al., 2017d; Kakaletsis et al., 2021), the portion of the RV not in contact with the interventricular septum (which is generally considered to be functionally part of the left ventricle). Structurally, the RVFW consists of layered laminae of interwoven myofibers and collagen fibers (Macchiarelli et al., 2002), in general similar to the left ventricular (LV) myocardium (LeGrice et al., 1995; Lunkenheimer et al., 2006). In contrast to the LV, the RVFW laminae are organized parallel to the epi- and endocardial surfaces, but with similar transmural fiber orientation behaviors (Chuong et al., 1991; Hill et al., 2014b). The dominant constituents within the myocardium contributing to its mechanical response include myofibers, which determine its low-strain behavior, and extracellular matrix (ECM, made up primarily of collagen fibers), which are in an undulated state in the undeformed configuration and determine the high-strain response when fully straightened with increased tissue stretch (Robinson et al., 1983; Fomovsky et al., 2010).
Naturally, this complex multi-scale myocardial structure governs its unique nonlinear and anisotropic passive mechanical responses (Schmid et al., 2009b, 2008; Nash and Hunter, 2000). The mechanical behaviors of the myocardium have been modeled at the tissue (i.e., meso) level with both phenomenological (Schmid et al., 2009a,b, 2008, 2007, 2006; Sommer et al., 2015; Eriksson et al., 2013; Holzapfel and Ogden, 2009a) and structurally-based hyperelastic constitutive forms (Young et al., 2012; Algranati et al., 2010; Lanir and Nevo, 1993; Horowitz et al., 1988a,b), as also comprehensively reviewed in Avazmohammadi et al. (2019a). The nonlinear stiffening of the tissue has commonly been captured with exponential functions for myofibers (Fung, 1993; Holzapfel and Ogden, 2009b) and recruitment functions of linear elastic fibers for extracellular collagen (Avazmohammadi et al., 2017d; Horowitz et al., 1988b) that depend on deformation invariants for fiber stretch.
In addition to the ability of the current myocardial material models to simulate the macroscale 3D stress-strain behaviors, understanding how myocardial micro-structure functions can help in bridging the myocyte biophysics to organ-level function. Such myofiber-collagen interactions arise from connections between myofibers and the ECM collagen weave/sheath structure (Caulfield and Borg, 1979; Borg et al., 1983; Macchiarelli et al., 2002). We have previously demonstrated the importance of specifically accounting for myofiber-collagen interactions in RVFW myocardium in order to capture its full anisotropic mechanical behavior (Avazmohammadi et al., 2017d). Yet, the precise form and mechanisms for this coupling has yet to be determined at the level of individual myo- and collagen fibers.
Multi-scale modeling of the myocardium has become a recognized approach to address the complex hierarchical nature of cardiac function. This is due to its ability to connect behaviors at all scales that quantitatively includes such features as the micro-anatomy of the tissue constituents (Dalbosco et al., 2021; Perestrelo et al., 2021). Computationally implemented multi-scale approaches in particular can greatly facilitate our understanding, due to their ability to handle complex large scale problems. Moreover, recent advances in micro-imaging have made quantification of individual myofibers and other components of the myocardium possible. Yet there are relatively sparse examples of computational models of cardiac tissue that are faithful to the microstructure of the myocardium in a detailed sense. Such an understand is especially important for investigating mechanisms driving adaptations to structural heart disease.
In the present study we developed a micro-anatomically realistic finite element (FE) based micro model of RVFW ventricular myocardium. Our specific objectives were to (1) establish a micro-tissue FE model from segmented micro-scale imaging, (2) determine the individual constituent fiber mechanical behaviors, and (3) utilize the micro-scale model to reproduce the macro-scale behaviors including myofibercollagen coupling. We based our model on a high-resolution 3D imaging dataset from ventricular myocardium to define and construct a representative tissue element (RTE) model. Parallel supercomputing was then used to perform FE simulations of biaxial loading, and hyperelastic constitutive models were employed to compute the effective mechanical behavior of the RTE, which was then matched to the results of our previous tissue-level model in planar biaxial deformations (Avazmohammadi et al., 2017d). Lastly, we estimated micro-scale myofiber and ECM strain profiles under biaxial loading and further investigated the influence of micro-scale myofiber-collagen mechanical interactions in driving the bulk tissue mechanical properties.
2. Methods
2.1. Modeling goals
The present study was based on a previously developed mesostructural constitutive model of the RVFW myocardium (Avazmohammadi et al., 2017d), which as based on an extensive dataset described in Hill et al. (2014b) (Fig. 1). In these works, we demonstrated the importance of specifically accounting for myofiber-collagen interactions in RVFW myocardium in order to capture its full anisotropic mechanical behavior (Avazmohammadi et al., 2017d). While this quantitatively determined a significant mechanical interaction contribution, the mechanism for this coupling has yet to be determined. Thus, our goal in the present study was to gain insight into these mechanics through the use of a computational micro-scale mechanical model to explicitly represent key micro-tissue structural features and mechanical behaviors.
Fig. 1.
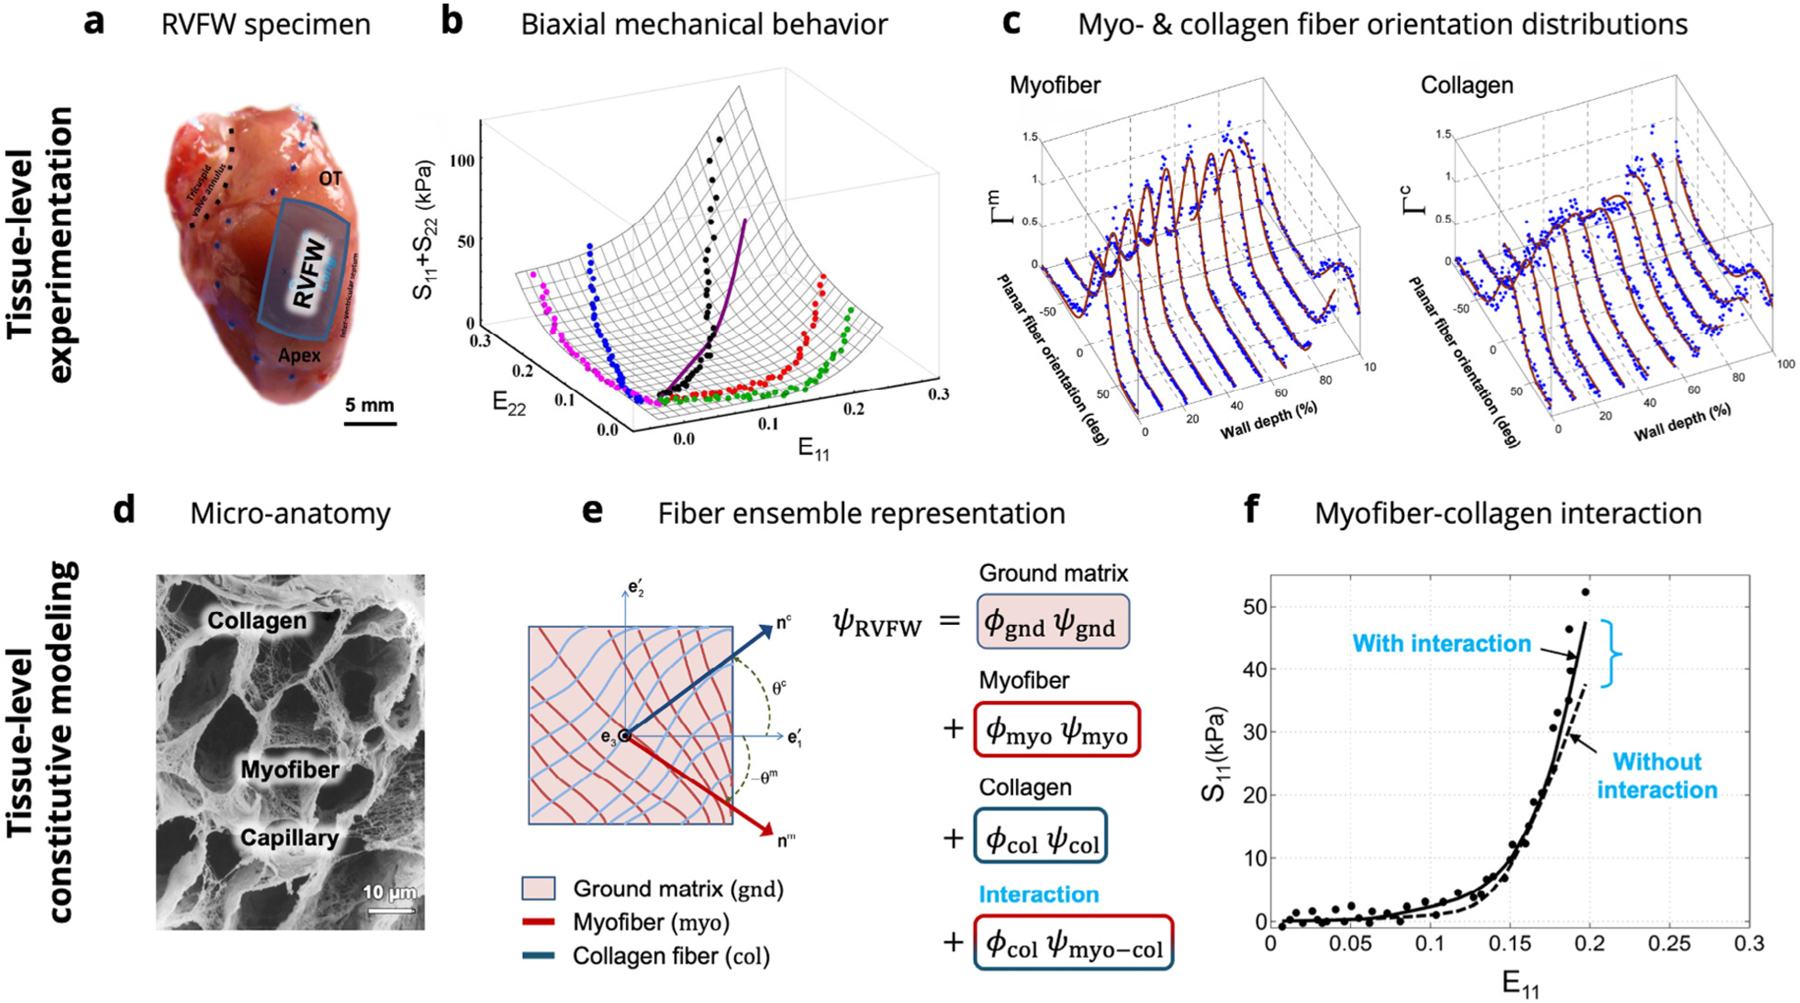
A graphical summary of the previous tissue-level studies on RVFW myocardium. (a) Specimens of murine RVFW myocardium underwent (b) biaxial mechanical testing and (c) histological analysis to measure the orientation distributions of myofibers and collagen fibers. (d) Knowledge of the micro-anatomical arrangement of myofibers and extracellular collagen was used to develop (e) a structurally-based constitutive model incorporating contributions from ground matrix, myofibers, collagen fibers, and myofiber–collagen interaction. (f) Myofiber collagen interaction was required to fully characterize the experimental dataset. Images adapted from Avazmohammadi et al. (2017d) and Macchiarelli et al. (2002). The reader is referred to Avazmohammadi et al. (2017d) for the definition of terms in the tissue-level model formulation.
2.2. Confocal imaging and image segmentation
We developed our representative tissue element (RTE) model for rat RVFW myocardium using an extant 3D imaging dataset of right ventricular myocardium from New Zealand white rabbits (Seidel et al., 2013, 2016). We utilized RVFW myocardium due to the fact that we have extensive prior work on modeling the coupling behaviors (Avaz-mohammadi et al., 2017c) and that the RVFW myocardium exhibits a more simplified micro-anatomy compared to LV myocardium (e.g. not possessing a significant out-of-plane component). It should also be noted that while we utilized rabbit vs. rat RVFW data, the fundamental myocardial structure at the micro scale is largely shared amongst these mammalian species.
Acquisition of the imaging data has been previously presented in detail (Seidel et al., 2013, 2016). Briefly, myocardium samples of 5mm diameter were obtained from the left ventricle and were then cryosectioned into slices with thickness of 100μm. Sections were fluorescently labeled and mounted compression-free by sealing within Fluoromount-G (Electron Microscopy Science, PA, USA) to mitigate vessel compression and myocyte distortion, preserving slice thickness, vessel visibility, and myocyte morphology (Seidel et al., 2016) (Fig. 2a). 3D image stacks of the sections were acquired via laser scanning confocal microscopy, with 1024×1024×300 voxels spanning the sample and tissue volume of 204×204×60μm imaged. The segmentation and reconstruction of the 3D tissue geometry was performed using a semi-automatic segmentation approach based on watershed methods and histogram-based thresholding (Seidel et al., 2013) (Fig. 2b). This method was used to segment myocytes, fibroblasts, and coronary blood vessels (Fig. 2c). Extracellular space was defined as the residual space after the exclusion of segmented myocytes, fibroblasts, and vessels. Manual smoothing and feature separation was performed using Seg3D (sci.utah.edu), with final volume fractions of 0.65,0.02,0.08, and 0.25 for myocytes, fibroblasts, vessels, and extracellular space, respectively.
Fig. 2.
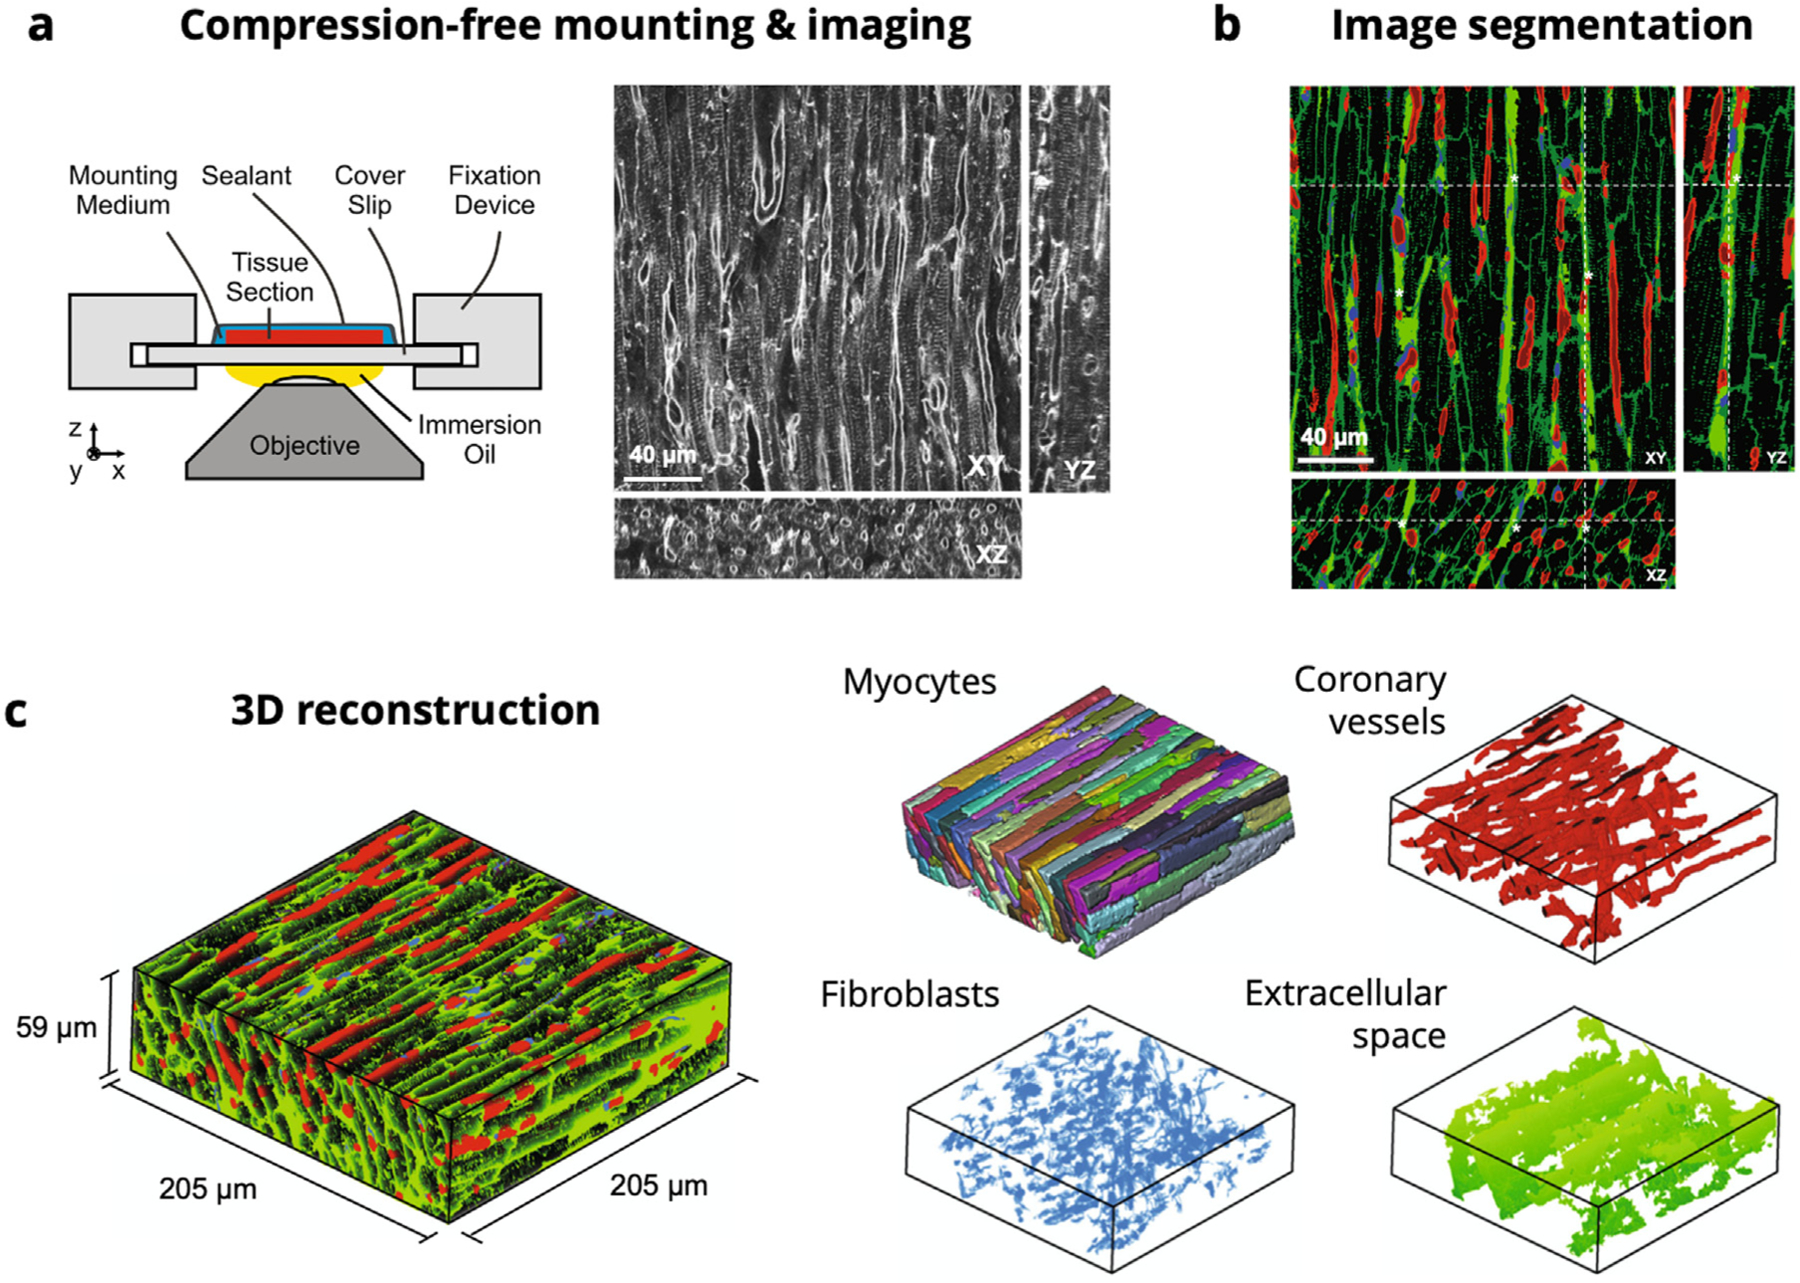
Confocal microscopy imaging, segmentation, and reconstruction pipeline for the ventricular myocardium representative tissue element. (a) Schematic of compression-free mounting of myocardium sections with representative XY, XZ, and YZ cross-sections in the imaging volume. (b) Segmentation of myocytes (black), coronary vessels (red), fibroblasts (blue), and extracellular space (green). (c) 3D reconstructions of myocardium sample (205 × 205 × 59 μm), with individual myocytes (recolored), coronary vessels, fibroblasts, and extracellular space extracted.
Source: Images adapted from Seidel et al. (2016).
2.3. RTE finite element mesh construction
For the meshing of an initial FE model, we considered a twophase representation of the RTE domain, with myofiber and ECM collagen constituents only. Myocytes were connected and combined into a myofiber phase, rather than as individual myocytes, according to knowledge of the interconnected arrangement of myocytes in the myocardium (Avazmohammadi et al., 2019b). Coronary vessels, fibroblasts, and extracellular space were combined into a single extracellular matrix collagen phase in order to eliminate cavities within the model domain. This segmentation was cleaned with island removal and Gaussian smoothing and was then used to generate a volumetric mesh consisting of 1,057,194 linear tetrahedral elements within Simpleware ScanIP (Synopsys, CA, USA) (Fig. 3), with final dimensions of 204×204×40μm and average element volume of . The orientation of myocytes was aligned with the axis in the image and the cross-fiber direction with the axis in the final RTE model. The volume fractions for myofibers and ECM were confirmed to be consistent with the segmented confocal microscopy image.
Fig. 3.
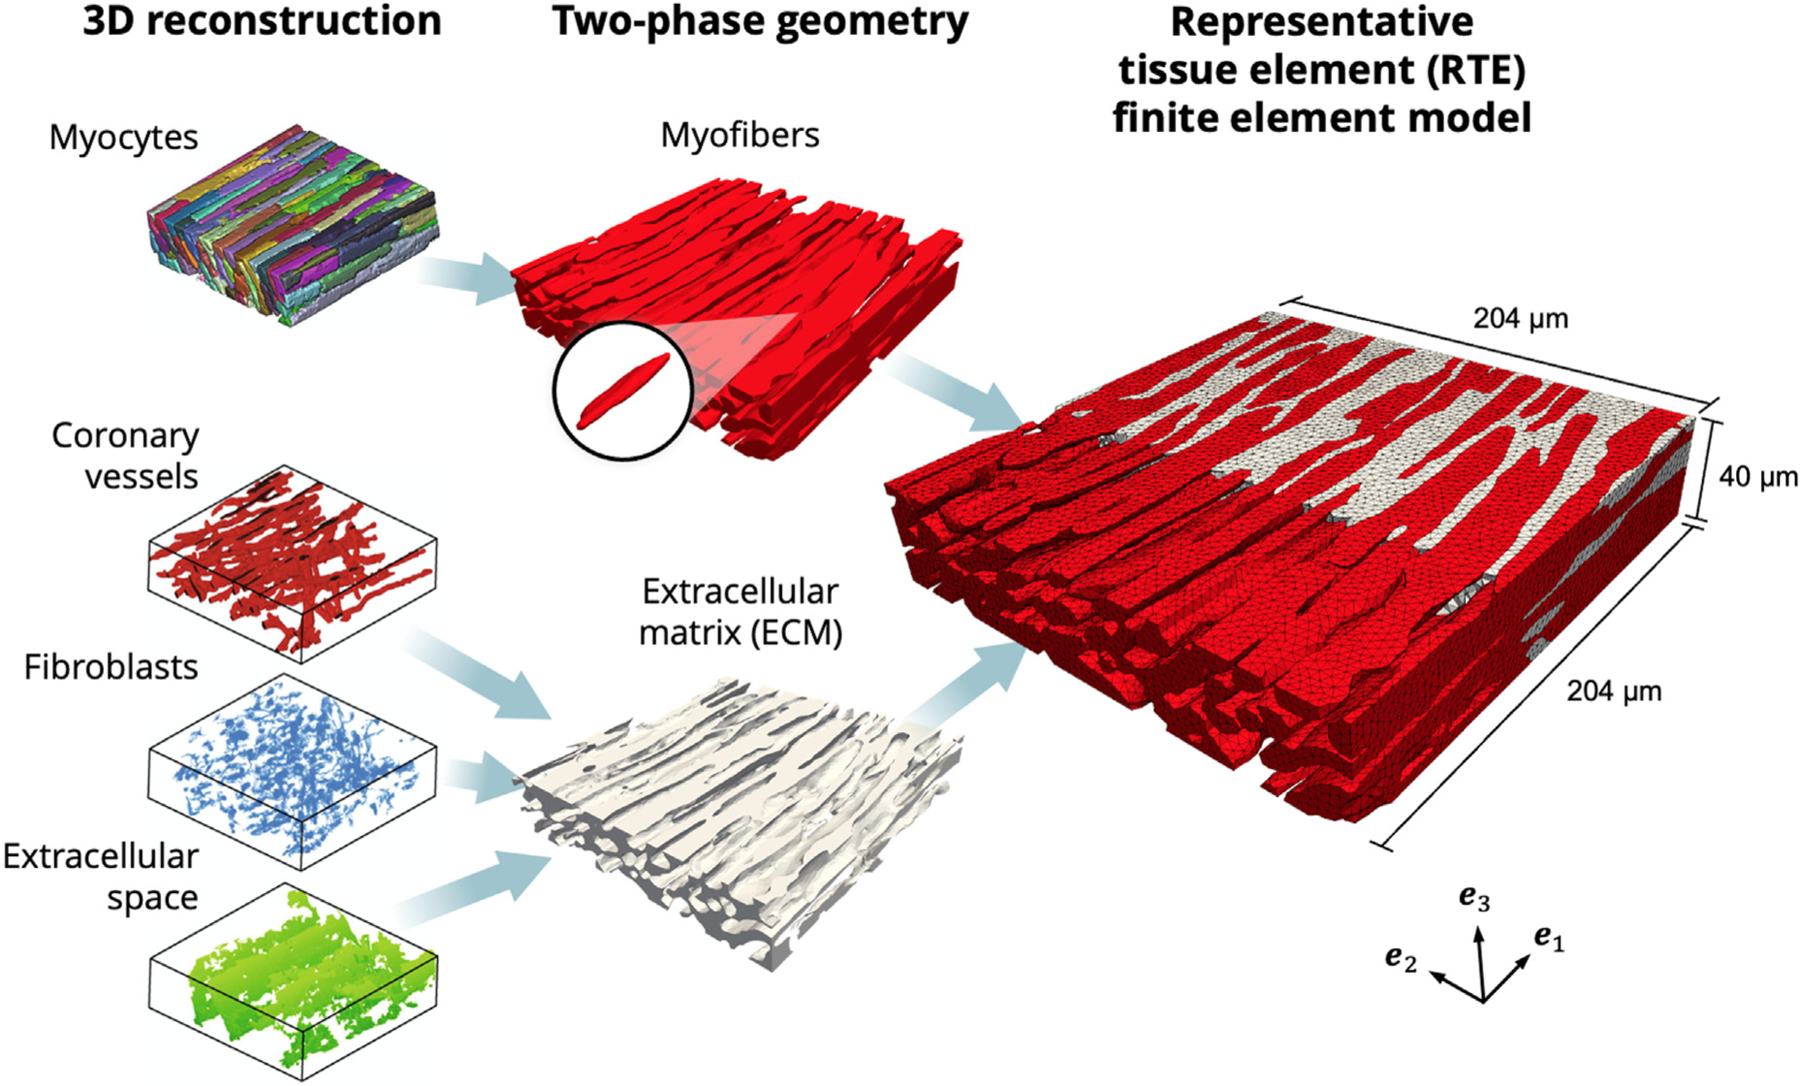
Finite element model developed from 3D reconstructions. Left: Geometry of myocytes, coronary vessels, fibroblasts, and extracellular space (Seidel et al., 2016). Center: Myocytes joined into the myofiber phase (red), with representative myocyte highlighted. Coronary vessels, fibroblasts, and extracellular space joined into the extracellular matrix (ECM) phase (gray). Right: Cross-section of RTE FE model showing myofiber elements embedded in ECM elements, with ECM elements removed to highlight myofiber interconnections. Coordinate axes {} indicate the image and laboratory axes.
2.4. RTE component material constitutive modeling
2.4.1. General considerations
We defined the RTE at a length scale such that continuum hyperelasticity could be applied to the individual fibers, while still focusing on incorporating detailed microstructural geometry. We note that although this approach is based upon the 3D micro-anatomy of myocardium, sub cellular structures were not explicitly modeled. Thus, the mechanical properties of the myofiber and ECM phases were characterized with nonlinear, anisotropic, nearly incompressible material models based on our previous studies (Avazmohammadi et al., 2017a,d). Deformations of material points in the domain were described with a local deformation gradient tensor , from which the right Cauchy-Green tensor and the Green-Lagrange strain tensor , where is the identity tensor, were determined.
2.4.2. Myo- and collagen fiber material models
Discrete individual myofibers could be easily obtained from the imaging dataset. From these data we defined the RTE myofiber direction as the predominant direction of the long axes of myofibers, which was also parallel to , and was fairly constant throughout the RTE geometry with a splay standard deviation of only ~3.0°. The mechanical response of each myofiber was modeled as a transversely isotropic solid (Holzapfel and Ogden, 2009b), with its long axis defined using f, using
| (2.1) |
where , and are the material parameters. is used to enforce incompressibility, and .
Although the confocal imaging dataset clearly delineated the geometry of myocytes, individual collagen fibers, having diameters roughly at the scale of , were not resolved using this modality. In light of this, the ECM/collagen phase was modeled as an isotropic neo-Hookean matrix reinforced by a distribution of undulated, linearly stiffening collagen fibers described by a local orientation distribution function (ODF) and recruitment function . The collagen fiber ODF was represented with the following von Mises distribution
| (2.2) |
where is the in-plane angle used to define the collagen fiber orientation is the modified Bessel function of order 0, and and are related to and in the normal distribution, respectively (that is, collagen fiber splay ). The recruitment function, statistically defining the gradual straightening of crimped collagen fibers as they are stretched, was represented with the half-normal distribution
| (2.3) |
where is the slack stretch of the collagen fibers, is the upperbound slack stretch at which all fibers are fully recruited, and controls the rate of recruitment. and were assumed to be independent of one another and to satisfy the respective constraints and . Defining the neo-Hookean shear modulus and collagen fiber modulus , the final expression for the ECM constitutive form was thus given by
| (2.4) |
where is the component of the fiber stretch along the n direction. are the material parameters. In order to match the tissue-scale collagen fiber recruitment, the fiber slack stretch was determined based on previous modeling results (Avazmohammadi et al., 2017d), which also indicated the collagen fiber distribution was aligned with the myofibers (f) in the model . Considering the fact that the collagen fiber splay could not be directly measured from the imaging data, it was defined as a parameter in the model and estimated in order to reproduce our previous modeling responses.
2.5. Linking the RTE and tissue-level models
As there was a significant length scale difference between the RTE finite element model, with dimensions of , and our previous tissue-level structure-based model for macroscopic specimens, with average dimensions of (Hill et al., 2014a). As each length scale demanded different structural descriptions, experimental methods, and modeling approaches, homogenization methods were therefore required to appropriately link their respective mechanical behaviors. In the following, we detail our approaches using a
“top-down”, scaling our tissue-level model down to the RTE level to provide an estimate for RTE-level constitutive parameters.
“bottom-up”, wherein the RTE FE model was linked to the bulk tissue level to evaluate the role of myofiber-ECM micro-anatomy in the overall mechanical response at both scales (Fig. 4).
Fig. 4.
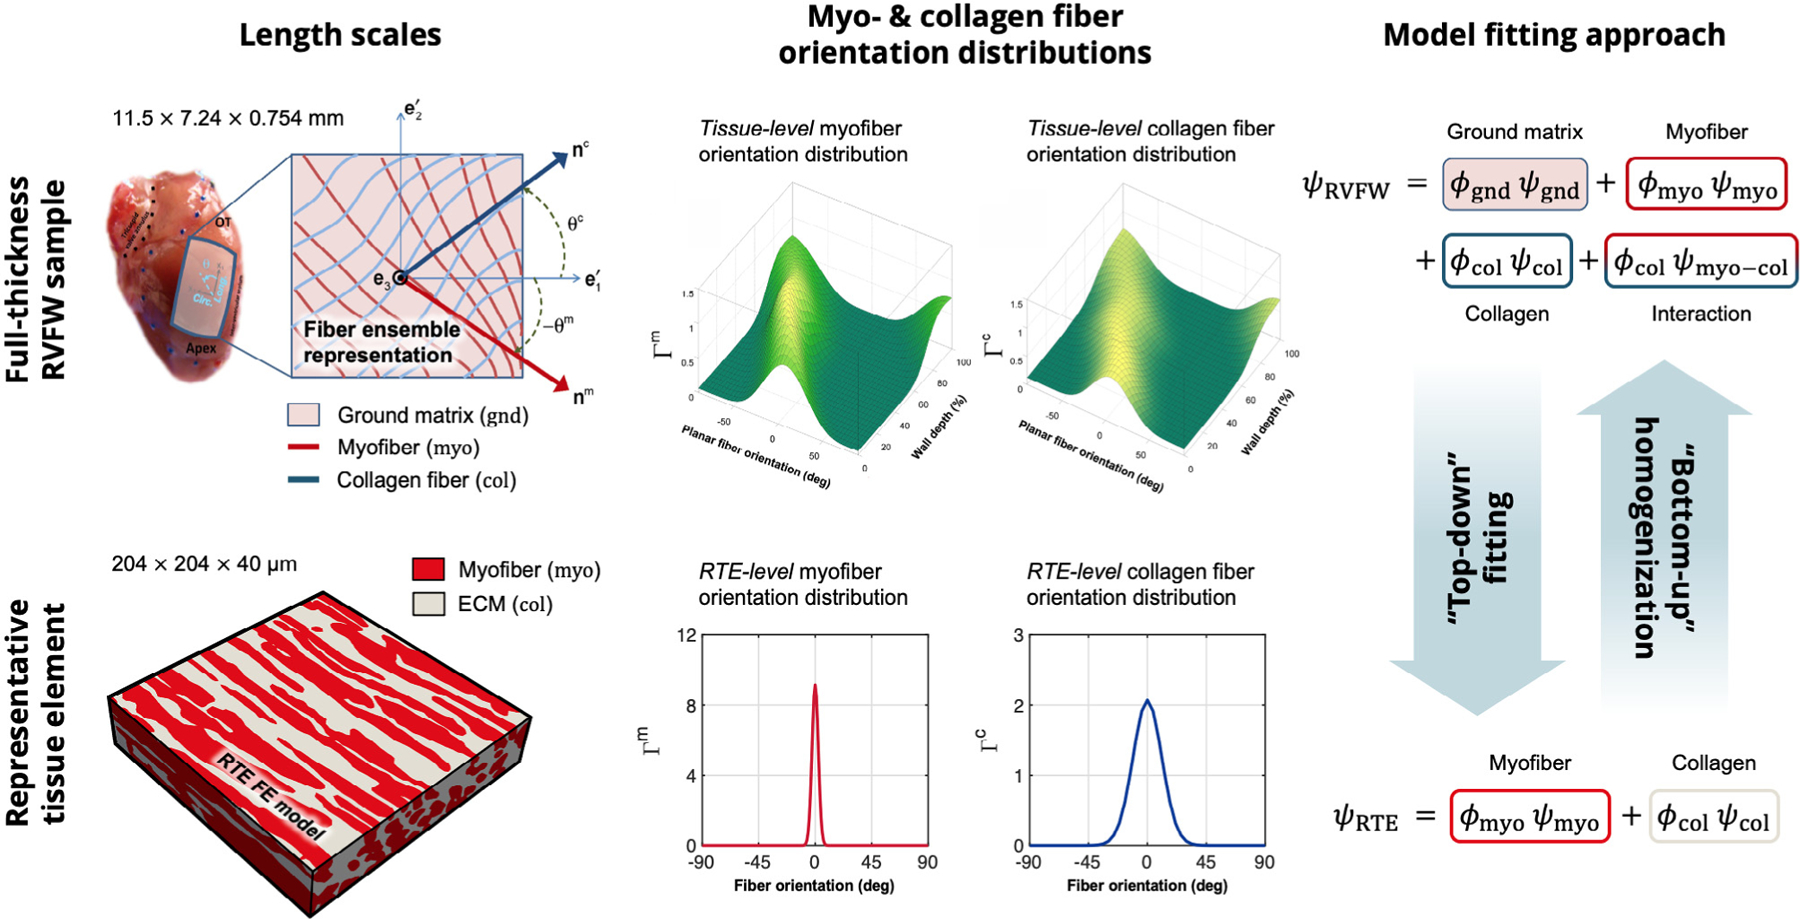
Comparison of the length scales and modeling approaches for past tissue-level RVFW studies (top) and current RTE modeling (bottom). “Top-down” fitting is used to determine RTE-level constitutive parameters, whereas “bottom-up” homogenization is used to replicate bulk tissue mechanical behavior. RVFW image adapted from Hill et al. (2014a) and Avazmohammadi et al. (2017d). The reader is referred to Avazmohammadi et al. (2017d) for the definition of terms in the structurally-based model formulation.
Meso to micro: the top-down approach.
We based our first “top-down” approach on the assumption that our previous meso-scale constitutive model for stress could be used to generate a response target for the RTE simulation. Specifically, we used the material parameters reported by Avazmohammadi et al. (2017d) and distributions of myo- and collagen fibers with preferred directions along (that is, ), myofiber splay of 3.0°, and collagen splay of 11.0°. We evaluated the stress components along the and directions (described in Equation 27 and Table 1 in Avazmohammadi et al. (2017d)) in equibiaxial and non-equibiaxial strain configurations described by , and 0.15:0.30.
Table 1.
Constitutive parameters for myofibers and ECM in the RTE FE model fitted to the top-down model prediction.
| Myofiber | ECM | |||||||
|---|---|---|---|---|---|---|---|---|
| 0.0565 | 1.59 | 8.94 | 1.59 | 0.01 | 4.11 | 13.2 | 1.209 | 0.017 |
The planar biaxial deformations considered in the top-down model were then simulated in the RTE FE model. Myofiber and ECM elements were assigned their corresponding material models (Eqs. (2.1) and (2.4)) and assumed to be perfectly bonded with a no-slip condition, based on descriptions by Machiarelli et al. of myofibers being anchored to the surrounding extracellular collagen (Macchiarelli et al., 2002; Avazmohammadi et al., 2019b). We employed the open-source software FEniCS (fenicsproject.org) for implementation of the FE model. Gaussian quadrature was used for the integration of the orientation distribution and recruitment functions in the ECM constitutive form. Deformations were applied to the boundary surfaces of the model, which were prescribed as uniform displacements over 15 steps. All simulations were performed on the Stampede2 supercomputer at the Texas Advanced Computing Center within a Singularity container.
At each simulation step, the second Piola-Kirchhoff stress
| (2.5) |
was evaluated for the myofiber and ECM elements throughout the volume. We then computed an element-averaged stress throughout each phase
| (2.6) |
where is the element-wise stress, , and . The total stress of the RTE model was then computed with rule-of-mixtures relations by . The RTE constitutive parameters were fitted to match the top-down model predictions for all paths simultaneously with standard nonlinear regression methods. It is important to emphasize that, although the overall stress in the tissue-level model included myofiber, collagen fiber, and myofibercollagen interactions, the total stress within the RTE model consisted of only myofibers and ECM, without an explicit interaction term. The RTE constitutive parameters were therefore calibrated to match the total stress-strain response of the top-down model while relying on the 3D micro-anatomy of the RTE to account for myofiber-collagen interaction.
Micro to meso: bottom-up homogenization.
As a critical validation step, we sought to reproduce the mechanical response of the full-thickness RVFW from the highly aligned local structure of the RTE, thereby verifying that the 3D microstructure at the individual fiber level was capable of fully accounting for tissue-level behaviors. Relative to the average macroscopic tissue specimen size, there were 56-, 35-, and 19fold dimension differences for the RTE domain along the longitudinal, circumferential, and transmural directions, respectively. Additionally, histologically measured myofiber and collagen orientation distribution functions of previous studies showed that at the bulk tissue level, the myofiber and collagen fiber splay was significantly greater than at the individual myofiber level (~20° for myofibers, about an order of magnitude difference compared to the RTE-level fiber splay of ~3.0°). The average preferred direction of the RVFW also varied from at the endocardium to −90° at the epicardium, whereas there was virtually no transmural variation in the RTE. Thus, a “bottom-up” homogenization approach was necessary to recover the tissue-level stress-strain response.
The bulk tissue mechanics estimated from the collective response of stacked layers of locally highly aligned RTEs of myocardium, each rotationally positioned such that (i) the distribution of all RTE orientations within a given layer matched the meso-scale preferred direction and splay at each transmural depth, and (ii) the distributions of RTE orientations varied transmurally according to the histologically measured preferred directions and splays (Avazmohammadi et al., 2017d). From a 3D beta distribution previously fitted to the histological data for myofibers, we extracted the depth-specific myofiber orientation distributions at linearly spaced intervals throughout the transmural thickness, which were then sampled with an envelope-rejection method based on a wrapped Cauchy distribution to provide a set of angles to describe the local orientation of the RTE at each longitudinal, circumferential, and transmural position.
At each position, to generate the local stress-strain response the RTE FE simulation was rotated by the corresponding sampled orientation angle, while the biaxial loading paths were consistently applied with respect to the coordinate system. With this operation repeated over all transmural depths, we computed an effective stress for each of the biaxial paths (Appendix A.1). We also assessed the sensitivity of the homogenized stress-strain response to the number of longitudinal, circumferential, and transmural samples, comparing the results computed from 56×35×19,25×25×19,10×10×10, and 5×5×5 total samples, discussed in Appendix A.2. The total stress-strain predictions of the homogenized RTE model were then validated against the total biaxial stress-strain predictions of the tissue-level model under the , and 0.15:0.30 paths (Avazmohammadi et al., 2017d). Equi-biaxial and non-equibiaxial loading paths , and 0.15:0.30 were simulated at the RTE level with our model. Parallelization of the simulations over 68 processors was found to yield sufficient computational efficiency for the model, with an approximate wall time of 6–7 h.
3. Results
3.1. Finite element simulation of planar biaxial loading in the RTE
The dependence of final morphology of myofibers and ECM in the RTE FE model on the biaxial loading path can be clearly observed (Fig. 5), where the cross-fiber extracellular space between adjacent myofibers is reduced when (Fig. 5b,c) relative to the initial undeformed configuration (Fig. 5a). In contrast, this space is expanded when (Fig. 5d). In all loading paths, the volume compressed isochorically along , and we confirmed that remained approximately equal to 1 throughout the domain.
Fig. 5.
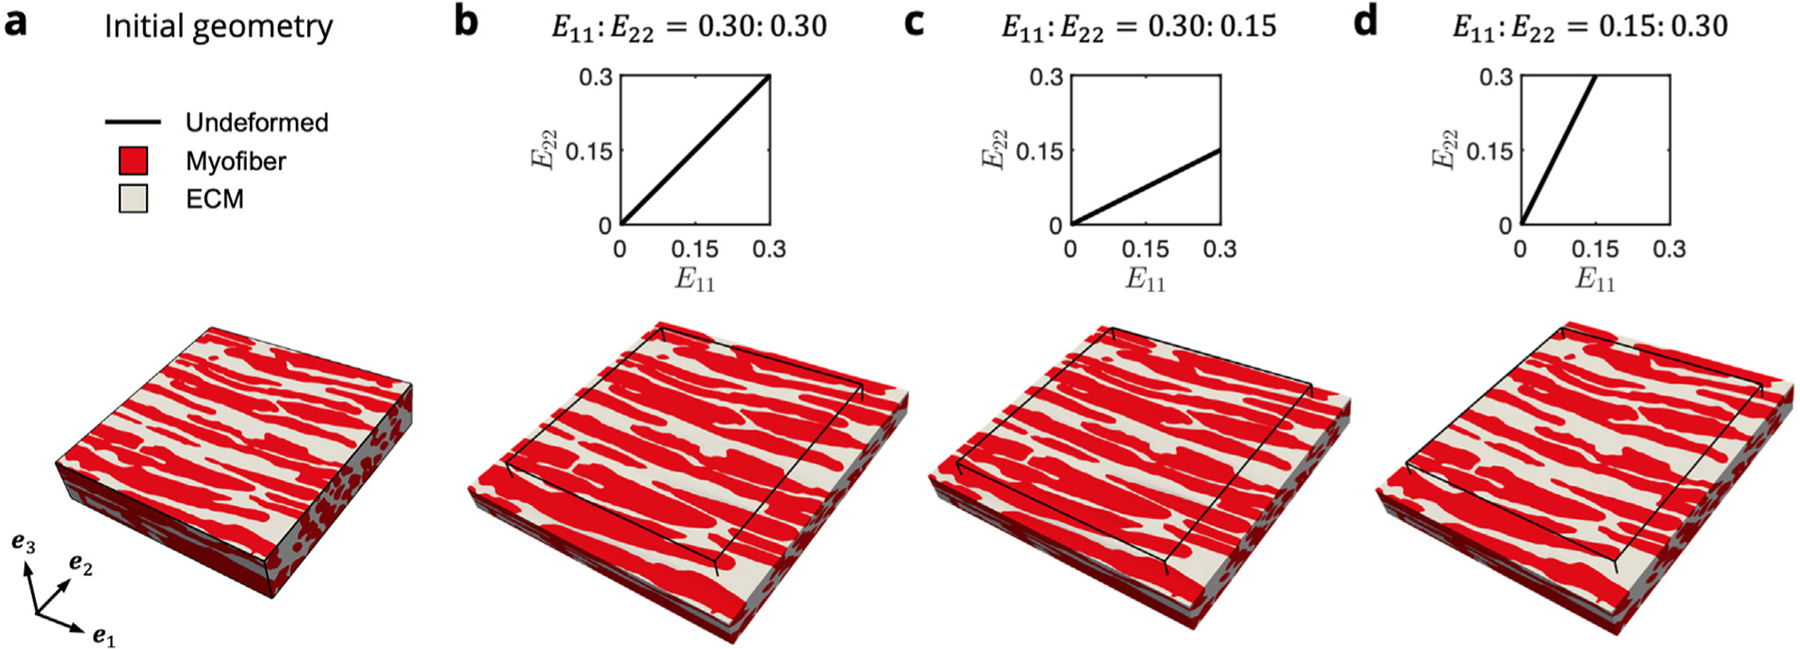
FE simulations of biaxial loading in the (a) two-phase RTE model containing myofibers (red) bonded to ECM collagen (gray). E11∶E22 = (b) 0.30∶0.30, (c) 0.30∶0.15, and (d) 0.15∶0.30. Displayed is the maximum applied stain indicated in the E11–E22 path insets, with the initial undeformed configuration shown by the black outline.
3.2. Estimation of RTE-level constitutive parameters with top-down fitting
Our previous tissue-level constitutive model was used to predict the RTE-level mechanical response using a top-down approach and act as a fitting target for the RTE FE model (Fig. 6). As the RTE geometry contained highly aligned myofibers oriented along the direction, the model exhibited exponentially stiffening myofiber stress in the direction with negligible contributions along the direction, in contrast to the significant cross-fiber stresses developed at the tissue scale. The ECM had a negligible contribution to the overall stress at low strains and exhibited nonlinear stiffening during collagen fiber recruitment , after which fibers were fully recruited and the ECM response became linear, as demonstrated previously (Avazmohammadi et al., 2017d). The total mechanical response was governed by myofiber behavior in the low-strain regime (below <0.17). At higher strains, the ECM collagen fibers became the major contributor along both and . This behavior was primarily observed in loading paths that stretched the collagen (along ) beyond the slack stretch, as opposed to the path, in which collagen recruitment was not significant. Even at this highly localized length scale, myofibercollagen interaction was also predicted to contribute significantly to the overall stress for paths in which the collagen fibers were recruited, especially in equibiaxial loading.
Fig. 6.
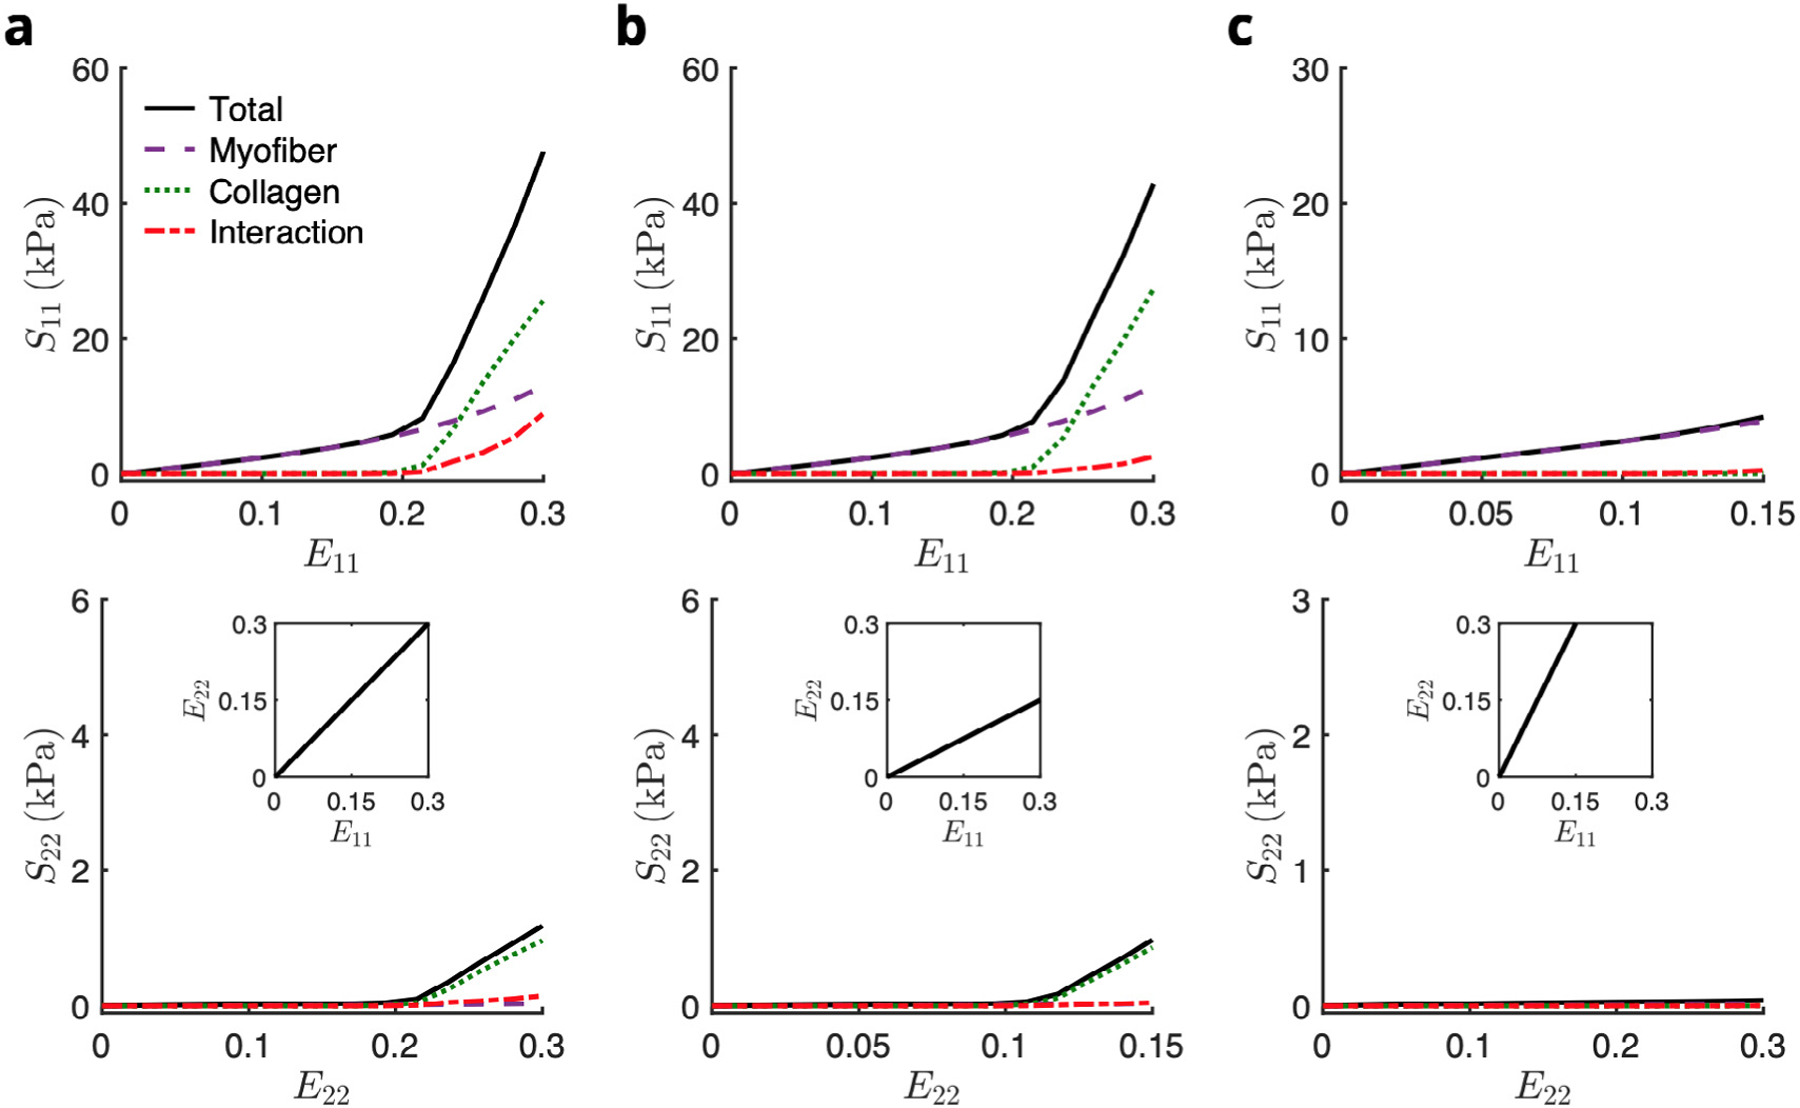
Stress–strain predictions of the top-down model in biaxial paths E11∶E22 = (a) 0.30∶0.30, (b) 0.30∶0.15, and (c) 0.15∶0.30. The total stress (black solid line) was computed as the sum of the myofiber (purple dashed line), collagen (green dotted line), and myofiber–collagen interaction (red dot-dashed line) contributions.
The fitted RTE FE model successfully reproduced the total stress response predicted by the top-down model in all biaxial deformation modes (Fig. 7), with fitted parameters listed in Table 1. Both the maximum total stress as well as the deformation-dependent collagen recruitment behavior were captured despite no inclusion of a myofibercollagen interaction term. Compared to the top-down model, the RTE FE model necessitated a greater collagen fiber splay in order to achieve the same amount of cross-fiber stress.
Fig. 7.
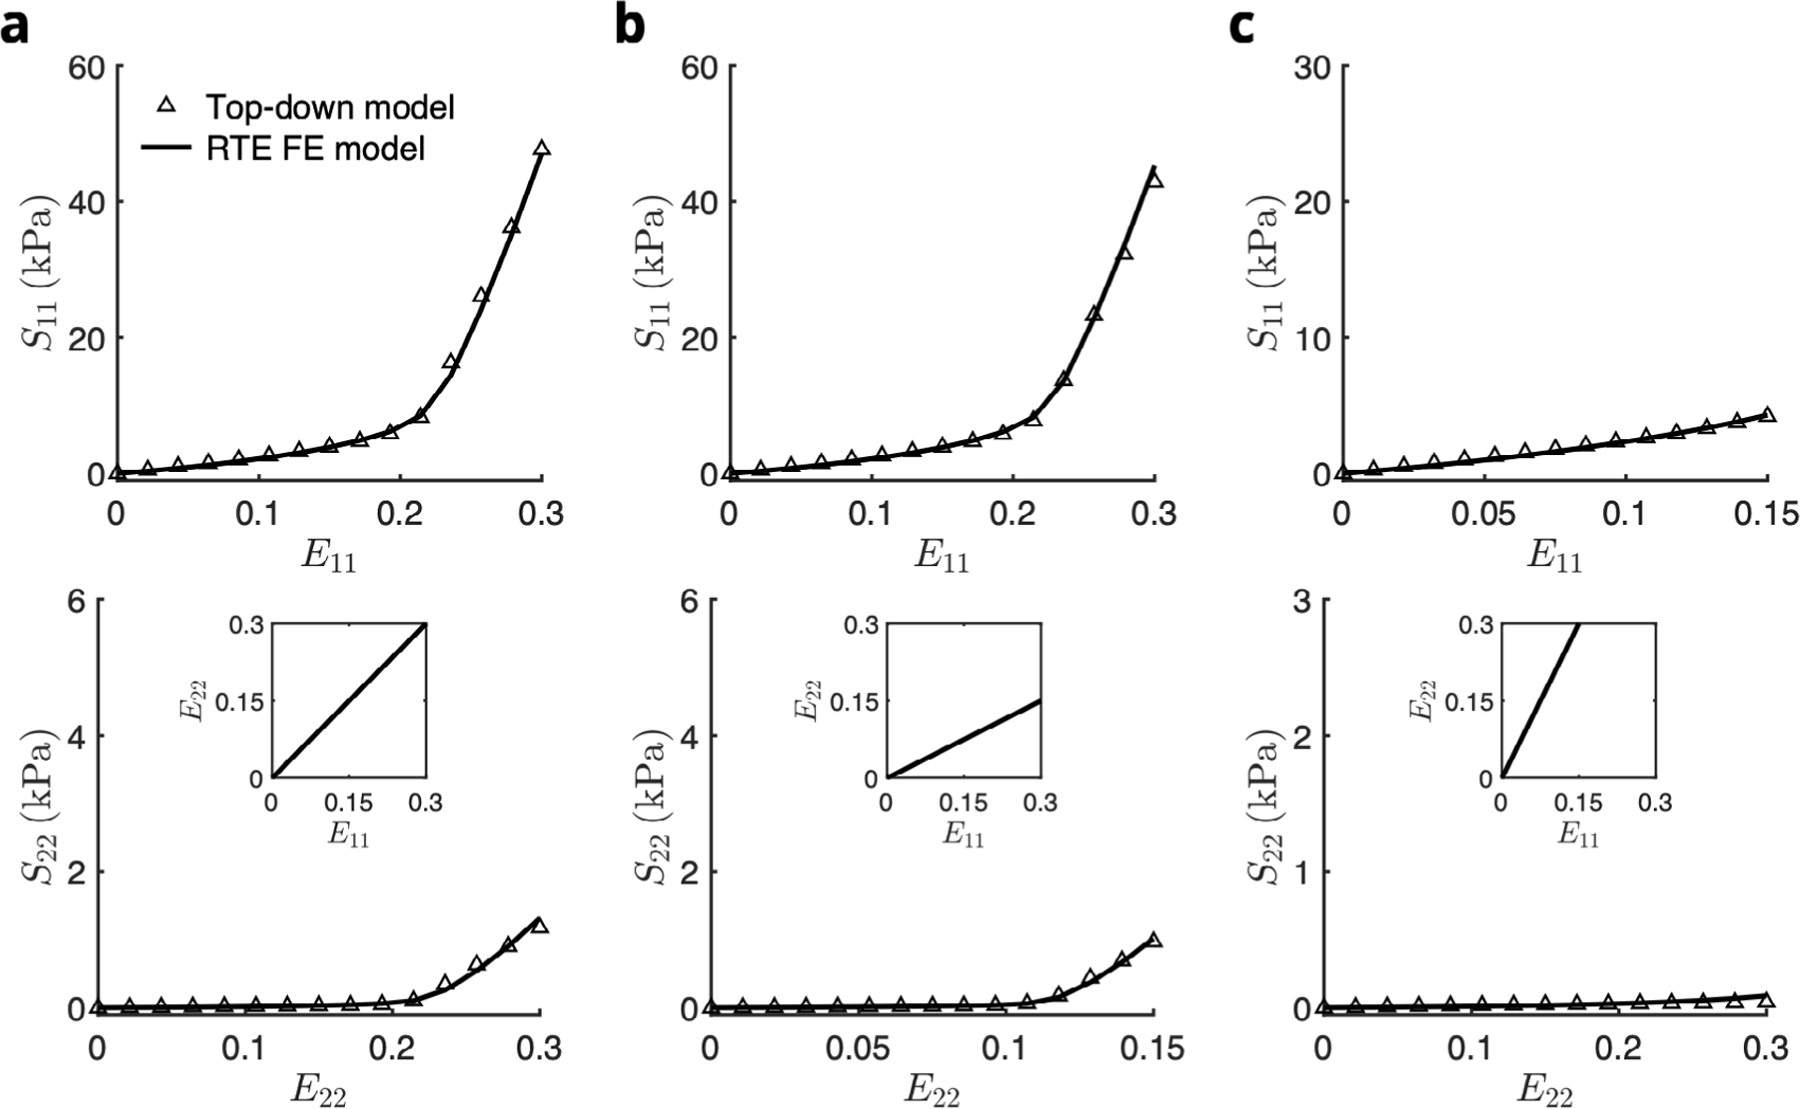
Fit of stress–strain response of the RTE finite element model (solid line) to the prediction of the top-down model (open symbols) for biaxial loading paths E11∶E22 = (a) 0.30∶0.30, (b) 0.30∶0.15, and (c) 0.15∶0.30. The total stress of the top-down model included contributions from myofibers, collagen fibers, and myofiber–collagen interaction. The total stress of the RTE FE model contained only myofiber and ECM contributions.
3.3. Recapitulation of bulk tissue mechanics with bottom-up homogenization
The tissue-level RVFW stress-strain response, owing to both increased myofiber and collagen fiber splay relative to the RTE model as well as a large transmural variation in preferred direction, exhibited a less anisotropic response than the top-down model (Figure 12 in Avazmohammadi et al. (2017d)). Examining the constituent-wise stress contributions also predicted myofiber-collagen interaction making up a significant proportion of the total stress at the meso scale. Through incorporation of these structural features in the bottom-up approach, the full-thickness homogenization of the RTE FE model successfully reproduced the total stress curve in all paths (Fig. 8). In other words, by using a single set of constitutive parameters determined at the single-myofiber level, along with incorporation of both the 3D microanatomy of myofibers and the surrounding ECM as well as knowledge of structural variations at the bulk tissue level, the RTE model was able to provide a consistent estimation of the RVFW mechanical behavior at multiple length scales.
Fig. 12.
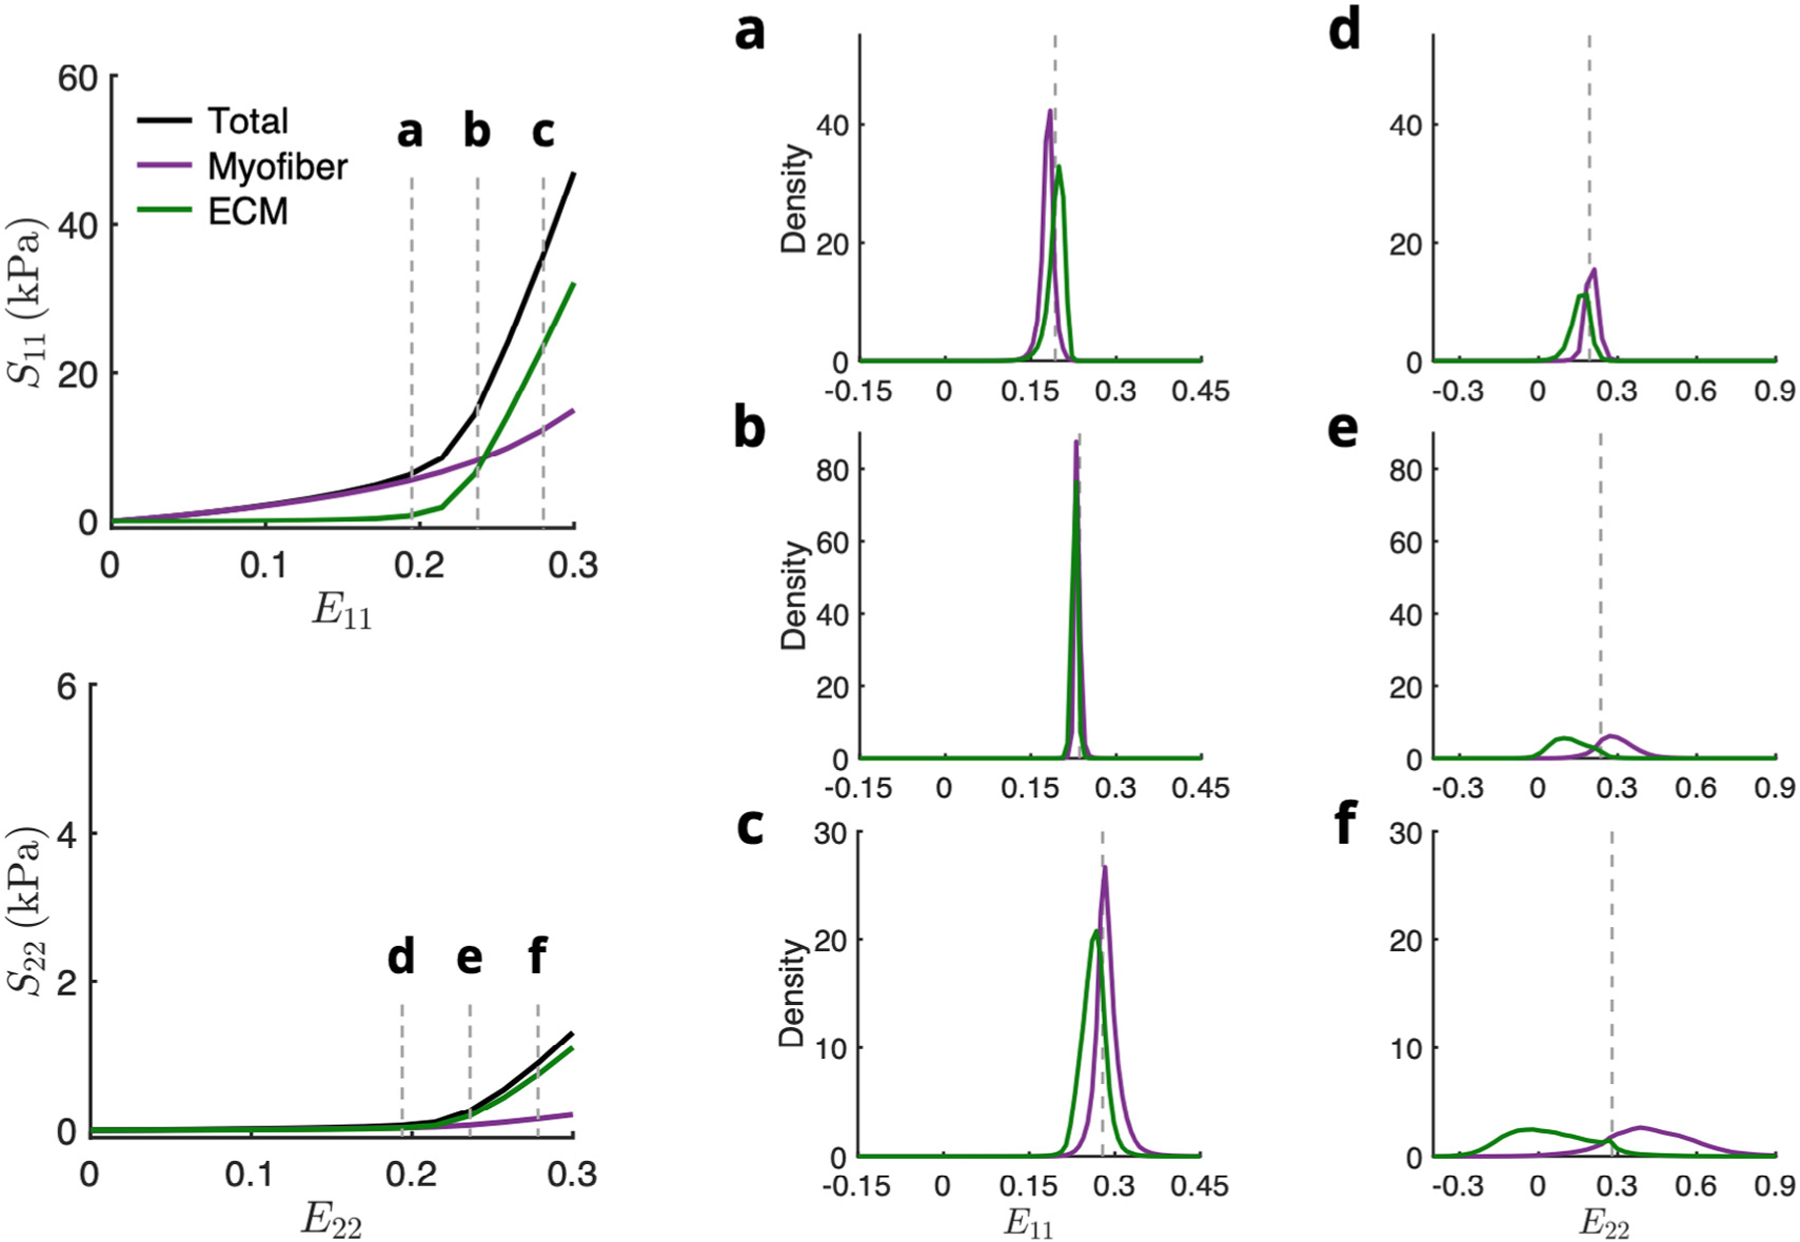
Normalized histograms of (a–c) E11 and (d–f) E22 in myofiber (purple) and ECM (green) elements at various applied strains before, during, and after collagen fiber recruitment for equibiaxial deformation . Total stress (black line) was fitted to the top-down model prediction. Dotted gray lines indicate applied strain.
Fig. 8.
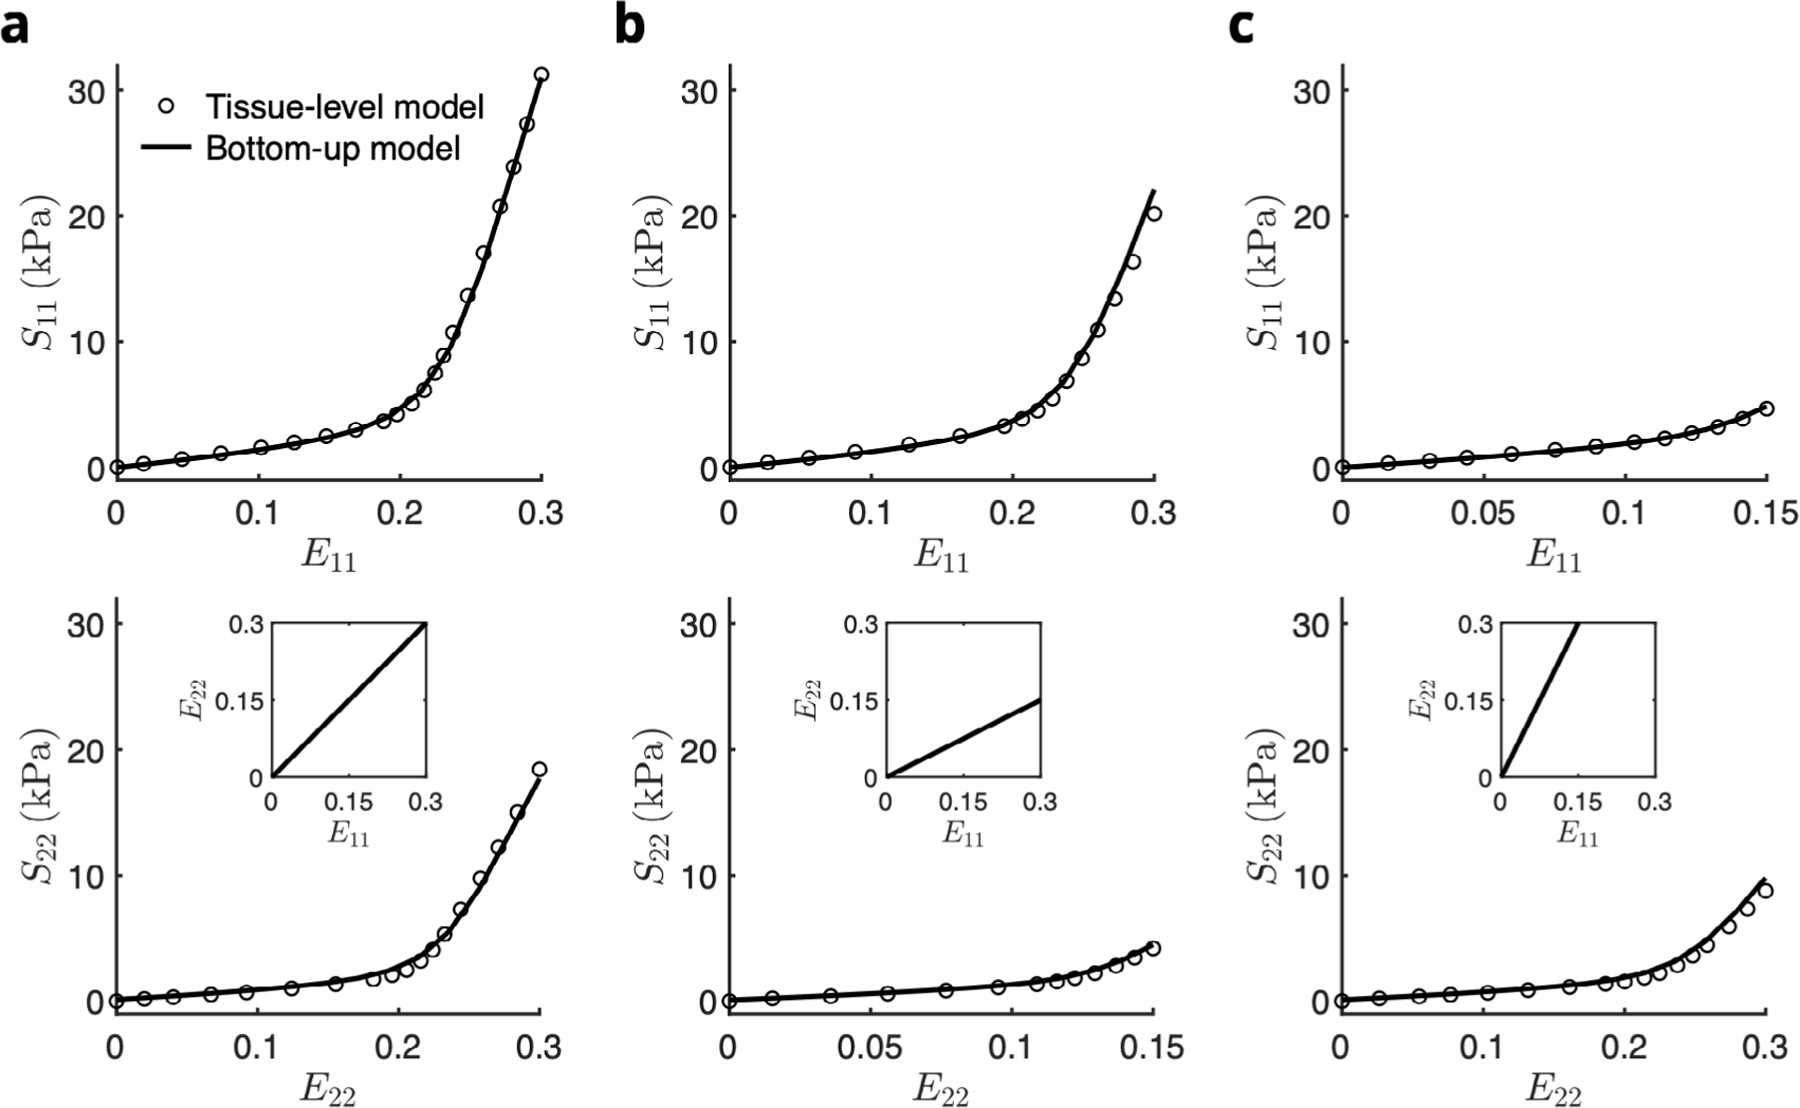
Prediction of the stress–strain response from the bottom-up homogenization of the top-down fitted RTE model (solid line) to the tissue-level model (open symbols) for biaxial loading paths E11∶E22 = (a) 0.30∶0.30, (b) 0.30∶0.15, and (c) 0.15∶0.30. Source: Tissue-level model results were reproduced from Avazmohammadi et al. (2017d).
3.4. Fiber-level strain profiles
Through examination of the phase-specific results of the RTE FE model, we determined that the model accounted for the necessary myofiber-collagen interaction contribution through increased stress in both the myofiber and ECM phases (see Appendix A.3), indicating that strains higher than the applied boundary strain were occurring within the FE model. The strain fields () within the myofiber and ECM phases showed that although the distribution of myofiber and ECM strains in the direction followed the applied boundary strains in an average sense, there was a high level of heterogeneity with pronounced differences in the strain along the direction (Fig. 9). In particular, the arrangement of myofibers and highly stiffened ECM elements resulted in a distinct banded pattern in (Fig. 9a,b), including regions of cross-fiber compression. This was observed for biaxial loading paths involving collagen recruitment (e.g., and 0.30:0.15); however, the amount of change was not as prominent when collagen fibers were not being recruited (e.g., , Fig. 9c).
Fig. 9.
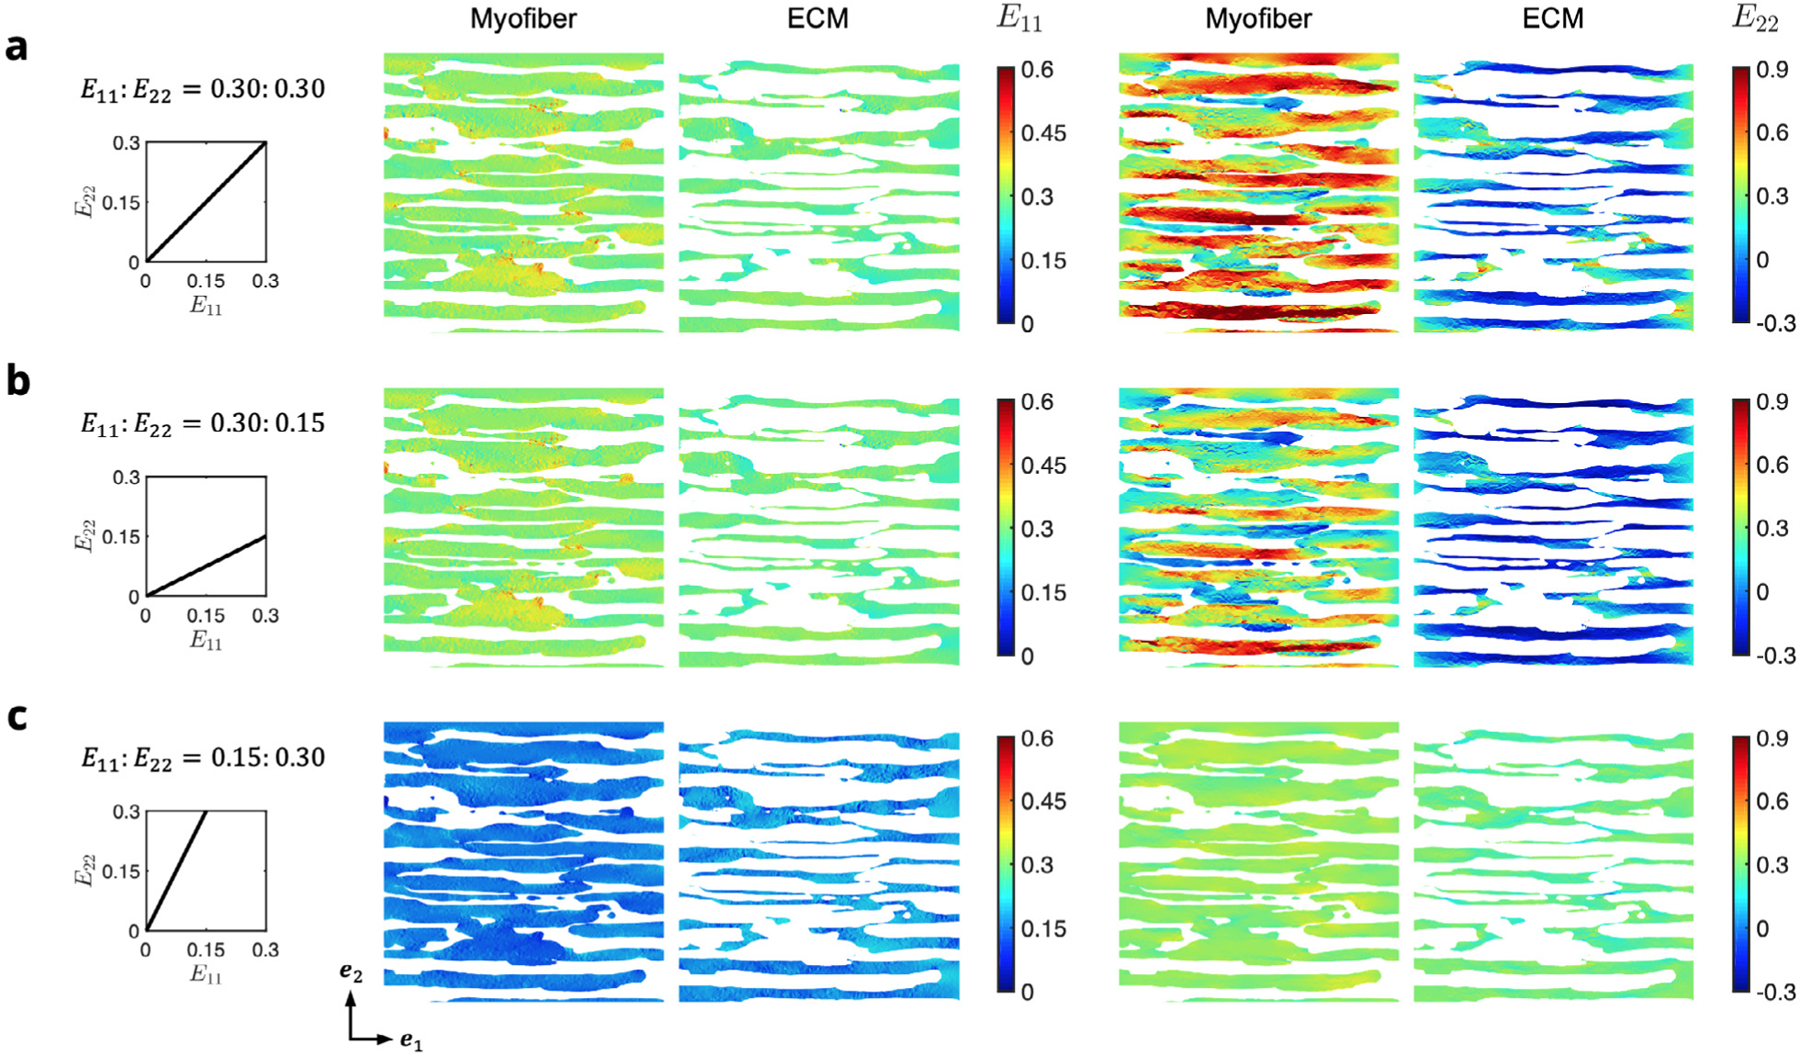
Midplane cross-sections of the RTE domain colored by E11 (left) and E22 (right) at maximum applied strain for the myofiber and ECM phases in each of the biaxial modes (a) 0.30:0.30, (b) 0.30:0.15, and (c) 0.15:0.30. Myofibers and ECM phases are shown separately for clarity.
Normalized histograms of the components of the strain tensor show the widely dispersed cross-fiber strains in cases of collagen fiber recruitment, where the applied strain along exceeded the upper bound slack stretch in (Fig. 10). Substantial shear strains also developed at maximum deformation, despite the high alignment of myofibers in the RTE with the direction. Prior to collagen fiber recruitment, the average fiber axial strains were comparable but slightly greater in the ECM phase than the myofiber (Fig. 10c). However, after recruitment, the relationship was reversed, and the cross-fiber strain discrepancy increased dramatically (Fig. 10a,b) due to the large difference between their respective stiffnesses, with myofiber elements experiencing an average cross-fiber strain greater than the applied strain, and ECM elements undergoing mild compression.
Fig. 10.
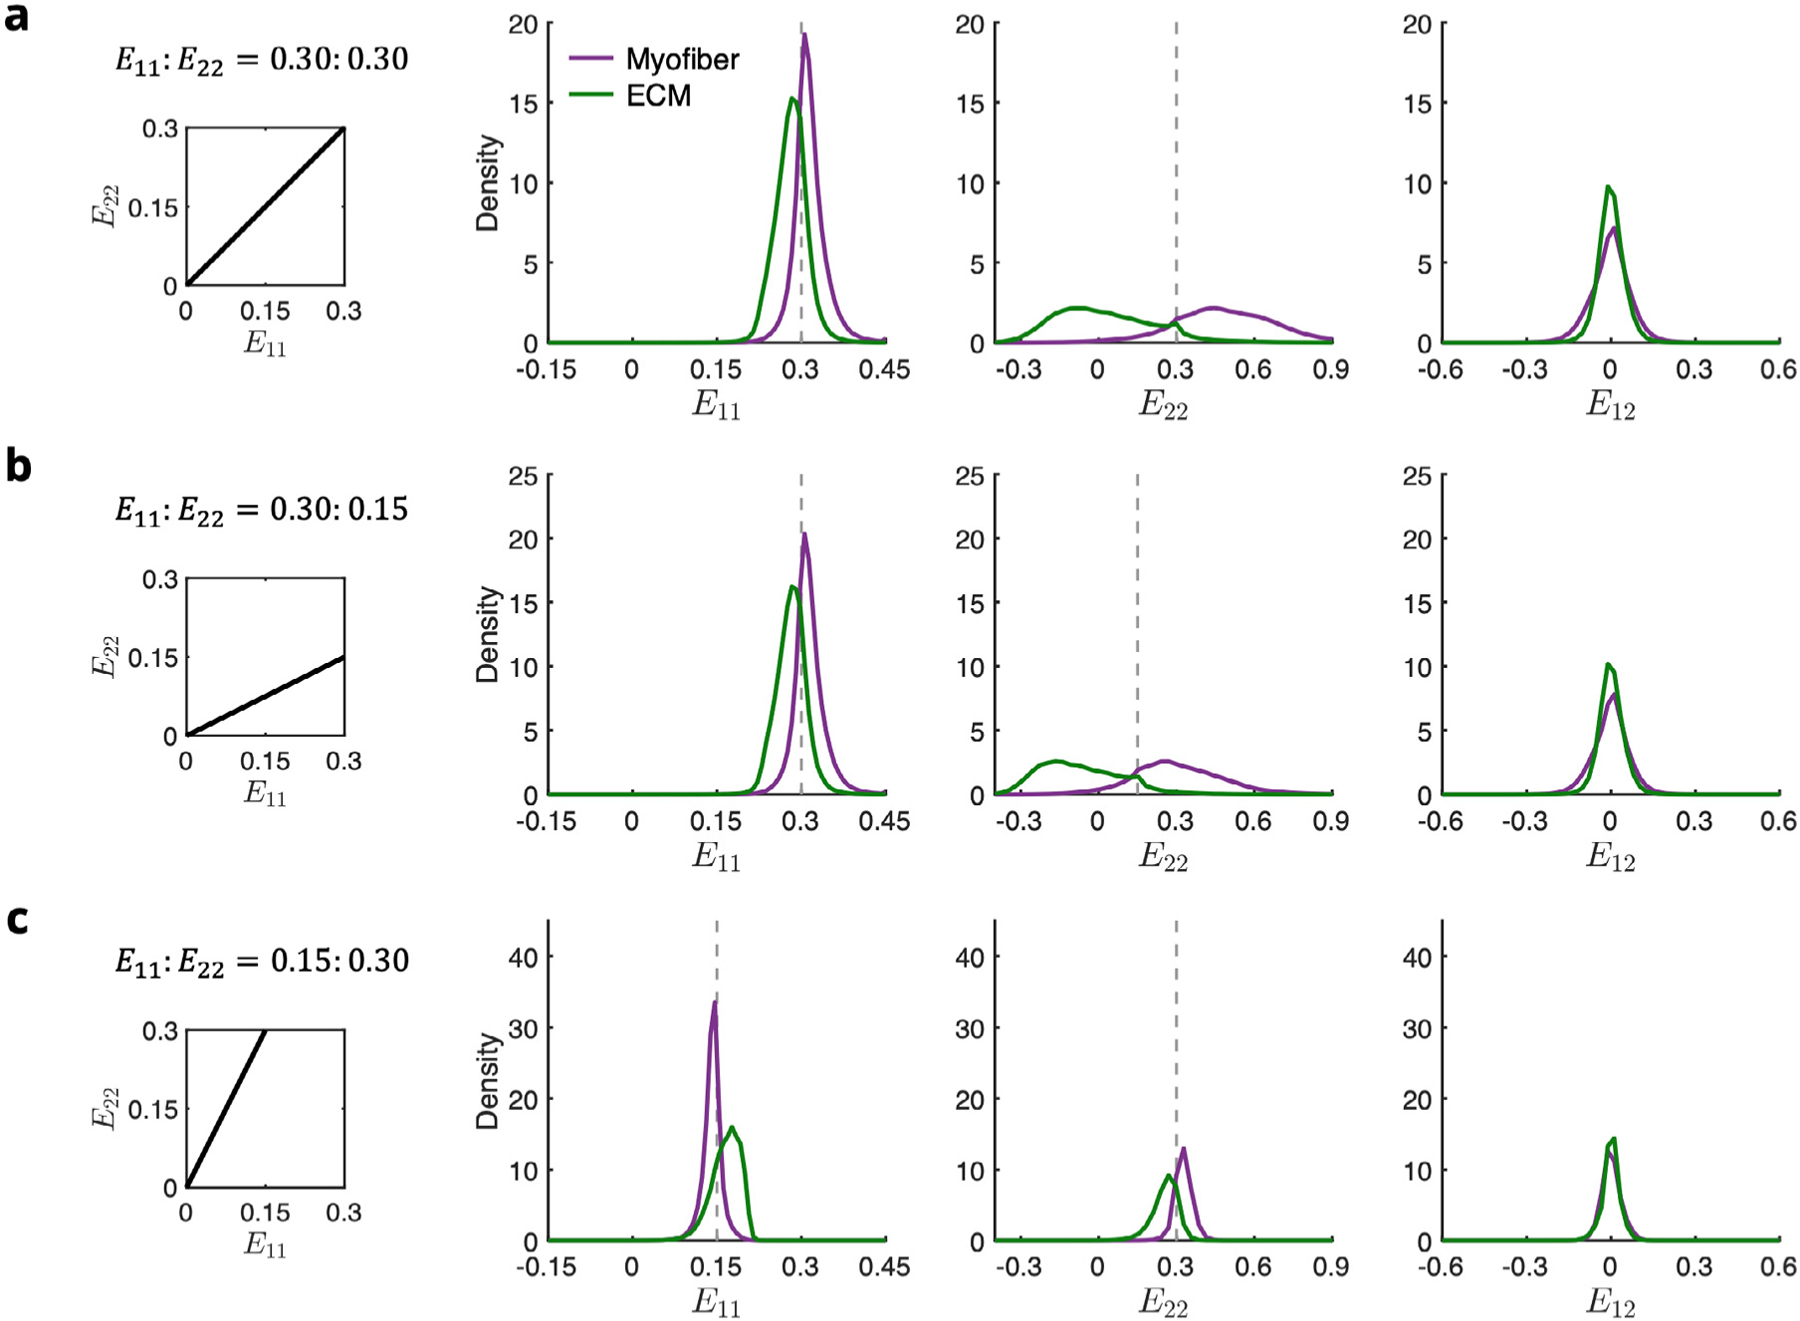
Normalized histograms of E11, E22, and E12 in myofiber (purple) and ECM (green) elements at maximum applied strain for the biaxial modes = (a) 0.30∶0.30, (b) 0.30:0.15, and (c) 0.15:0.30. Dotted gray lines indicate applied strain.
3.5. Quantifying the micromechanical states of myofibers and ECM
One advantage of the present approach is that it allowed examination of the fiber-specific strain fields that highlights the complexity of the cellular-scale mechanical environment (Fig. 11). Here, a single myocyte isolated from the RTE model at maximum applied strain for each of the biaxial loading paths considered was analyzed, providing a more detailed perspective on the strain maps (Fig. 9). Large crossfiber strains can be observed on the surface of the myocyte in regions where the myofiber is bound to the surrounding collagen elements, especially prominent in loading paths with greater applied cross-fiber deformation.
Fig. 11.
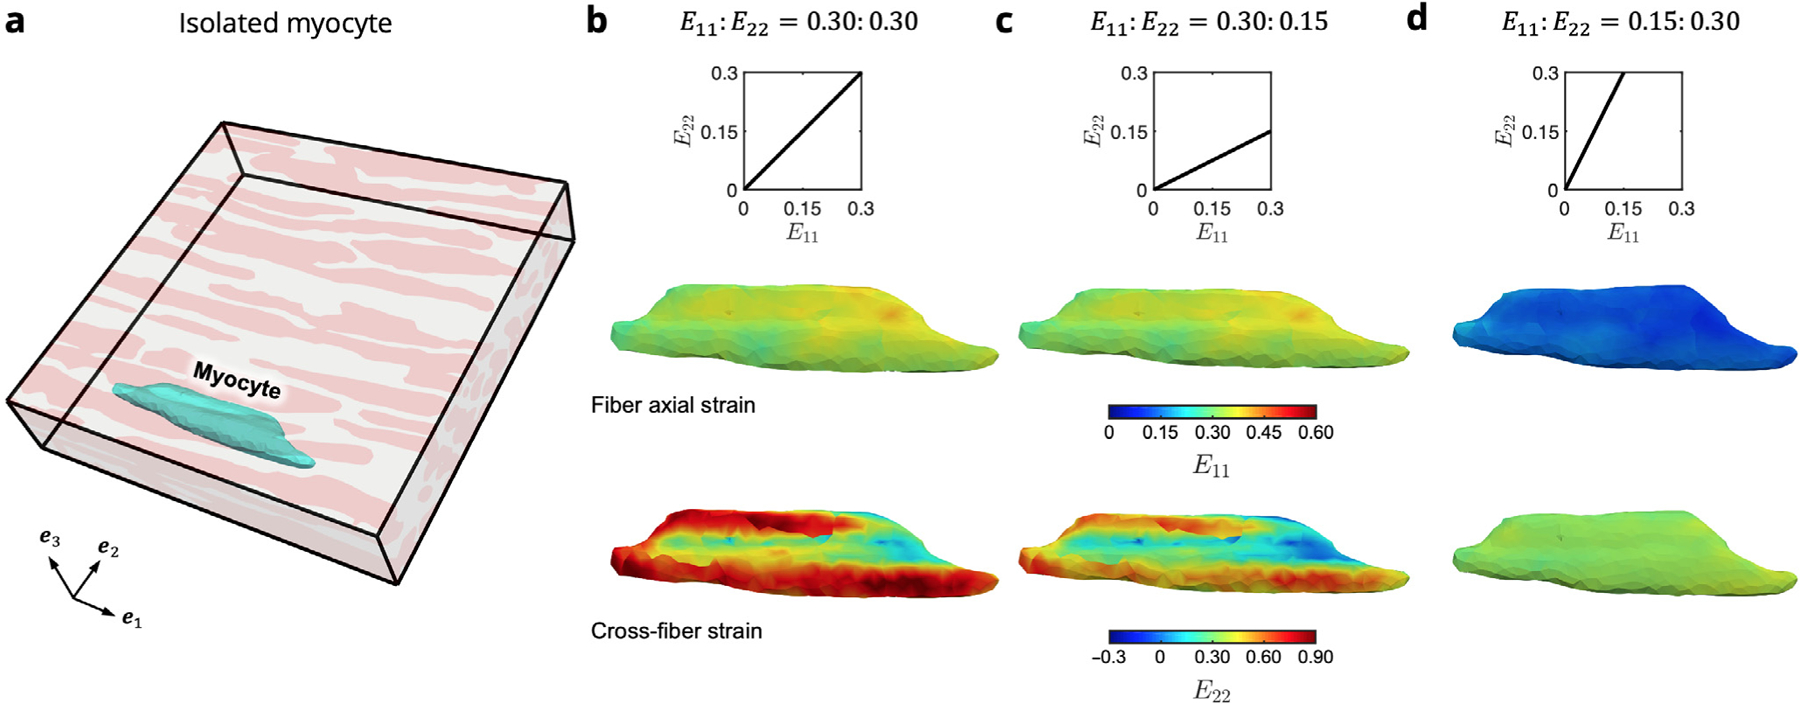
Colormaps of strain along the fiber axial () and cross-fiber () directions for an isolated myocyte within the RTE FE model. (a) Location of the myocyte (cyan) within the undeformed RTE domain, which is connected both to adjacent myofibers as well as the surrounding ECM. Results are shown for maximum applied strain in each of the biaxial modes = (b)0.30:0.30, (c) 0.30:0.15, and (d) 0.15:0.30.
Prior to collagen fiber recruitment, both phases tend to exhibit strains close to the applied boundary strain along both and , with the ECM phase deforming slightly more in the fiber direction due to the collagen fibers remaining undulated in this range and the myofiber phase slightly more in the cross-fiber direction (Fig. 12a,d). Once the collagen becomes fully recruited, the strain within the RTE model becomes relatively homogeneous along the fiber direction, and the increased cross-fiber ECM stiffness causes a reduction in the average ECM strain (Fig. 12b,e). Finally, near maximum applied strain, the fully stiffened ECM exhibits sightly less fiber axial deformation than the myofibers, and the greatest cross-fiber difference is observed (Fig. 12c,f). It is evident that both collagen fiber undulation in the unloaded state as well as collagen fiber splay at the RTE level have primary influence over the high-strain level behavior of the myocardium. Indeed, the unique cellular-scale arrangement of myofibers and collagen fibers, along with the different mechanical behaviors of the constituents, together contribute to the interactions that manifest at the tissue scale.
4. Discussion
In this study, we developed a finite element based micro-model for a representative tissue element of myocardium based on a highresolution imaging dataset of a localized sample of right ventricle free wall tissue. We then used structurally motivated constitutive modeling approaches to both quantify the RTE-level strain and stress fields in the tissue as well as link the micro-scale mechanical response to previously established tissue-scale modeling studies. This study constitutes a critical step in the connection between micro-anatomy-based and continuum-based computational models of ventricular myocardium.
4.1. Evidence for micro-anatomy-driven myofiber-collagen interaction at the cellular scale
The myofiber-collagen interaction term introduced in Avazmohammadi et al. (2017d) was found to contribute significantly to the overall bulk tissue stress; up to 20% in equi-biaxial strain (Figure 12 in Avazmohammadi et al. (2017d)). Thus the inclusion of this interaction effect was integral for capturing the biaxial mechanical properties of the RVFW. We also observed similar levels of contribution in the topdown model of around 15% in equi-biaxial strain (Fig. 6). Although there was no coupling term within the RTE constitutive models, the increased stresses generated in the FE model still matched the total stress predicted by both the top-down model as well as the bulk tissue model. Additionally, the fact that this interaction resulted from the myofiber and ECM phases (Fig. A.4 in Appendix A.3) suggests that the micro-anatomical arrangement that results in the myofiber-collagen interaction as the mechanism for the previously observed tissue-level coupling behavior.
4.2. How representative tissue element-level mechanics drives bulk tissuelevel behavior
Despite the locally highly aligned geometry at the RTE scale, modeling of individual myofibers embedded in extracellular matrix replicated the macro-scale stress-strain response when computing the homogenized behavior of multiple rotationally positioned RTEs. In previous studies, we hypothesized that the increased tissue-level fiber splay and transmurally varying fiber orientations would have a major influence in myofiber-collagen coupling behavior; however, it was unclear whether increased splay or transmural variation played the dominant role. The development of the bottom-up approach allowed us to separately evaluate these effects by generating synthetic predictions of bulk tissue behavior based on localized myocardium mechanics. As before, we consistently found that the transmural variation in orientation is a major contributor to the overall mechanics of the RVFW (Avazmohammadi et al., 2017d). It is interesting to note that successfully capturing the tissue-scale stress-strain response with the transmural thickness homogenization, incorporating both of these aforementioned factors, could indicate that it is still necessary to account for myocardial microanatomy as an additional driver underpinning the tissue-level structural features. It is clear that all effects are required to fully account for the experimental observations; however, it is likely that the transmural variation in fiber orientation is likely the dominant factor determining the mechanical anisotropy of the full-thickness tissue.
4.3. Limitations
Although the present work utilizes micro-anatomically faithful geometries as a foundation for the representative tissue element, the current two-phase model does not account for additional tissue constituents like cardiac fibroblasts and coronary vessels, the latter of which would necessitate the consideration of myocardial compressibility at the RTE level (McEvoy et al., 2018). However, more detail on the mechanical properties of these individual constituents will need to be established in order to fully incorporate the remaining features of the confocal microscopy dataset. We also occasionally observed very high strains in the cross-fiber direction at maximum applied strain that may not be physiologically realistic. This could be ameliorated with further consideration of extracellular collagen fiber populations in the RTE. In particular, future studies will be required that examine the collagen fiber arrangement surrounding the myocytes in order to develop more accurate structural representations of the extracellular matrix, including different populations of perimysial and endomysial families of collagen fibers. Such information will also be useful to evaluate the influence of the choice of perfect bonding. In this case, the current model could offer a novel platform for investigation of possible sliding of myofibers and ECM relative to one another; nevertheless, we do not expect this interaction would have a significant impact on bulk tissue behavior. Finally, in this study, the biaxial deformations were applied as uniform, fixed displacements on the boundary surfaces of the model, whereas recent work on modeling the arterial wall could suggest that periodic boundary conditions may be more appropriate for multiscale approaches (Dalbosco et al., 2021); further exploration into applications of this technique will be necessary for myocardium.
4.4. Future directions
A long-term goal for this project was to apply this approach to the remodeled myocardium in pulmonary hypertension (Avazmohammadi et al., 2017e; Hill et al., 2014b). These studies have demonstrated that right ventricular myocardium remodels significantly, including changes to the intrinsic stiffness of the myofibers. In addition, there is a paucity of information comparing the biophysical characteristics of the left and right ventricular myocardium (Avazmohammadi et al., 2019a). Moreover, the left ventricle has a much more complex, fully 3D fibrous structure (Schmid et al., 2009b; Nash and Hunter, 2000; Hunter et al., 1998). The present approach can work with left ventricular myocardium with the use of appropriately imaged tissue. The present approach can help to better determine these quantities, as it can better separate structural and intrinsic mechanical properties better.
We also note that although it is common to represent myocardium as an incompressible hyperelastic material in computational modeling of normal and deceased cardiac function, there has been considerable evidence showing that myocardium is compressible during systole (Hassaballah et al., 2013; Liu et al., 2021; Avazmohammadi et al., 2020). The redistribution of blood in the coronary arterial and venous networks during systole has long been thought to be the primary mechanism behind in vivo myocardial compressibility (Yin et al., 1996) and may indeed be essential for efficient cardiac energetics. The incorporation of compressibility into myocardium models plays a significant role in the accurate assessment of cardiac function (Liu et al., 2021). Given previous observation of volume reductions up to 15% to 20% (Avazmohammadi et al., 2020), the frequently used incompressible approximation of myocardium behavior in computational cardiac would likely lead to inaccurate descriptions of LV kinematics that are often used as clinical metrics, particularly an overestimation of wall thickening and an underestimation in long-axis shortening. The approaches used herein could be extended to improve our understanding.
Another logical area of extend the present models are the mechanisms underlying the growth and remodeling (G&R) of the heart. Despite significant progress in developing mathematical models that can reproduce the key manifestations of G&R events at the tissue and organ levels, our understanding of how the mechanisms at smaller scales (e.g., hypertrophy, atrophy, fibrosis, etc.) can collectively lead to anatomical and functional changes of the heart remains limited. To improve our understanding of these mechanisms, it is essential to conduct theory-driven experiments that can separate the contribution of each type of mechanisms (taking place at the cellular level) on the measurable changes in tissue-level behavior (Avazmohammadi et al., 2017b). The approach developed herein can provide critical connections between cellular and tissue/organ level events.
4.5. Conclusions
Existing structural approaches continue to rely on stochastic tissuelevel structural data and paradigms. The ability to obtain cell-level structural information has greatly outpaced its use in biomechanical model development. Thus, one major challenge is to extend tissue-level stochastic approaches and extend them to directly integrate detailed 3D structural information, toward which a first step has been presented here. We have presented the first step in a novel class of multi-scale, supercomputer-based computational approaches for myocardial modeling that combine high-resolution imaging of cardiac micro-anatomy as a means to better understand elucidate the structure-function relationship of ventricular myocardium. Ultimately, our micro-anatomical model will allow us to investigate fiber-specific alterations of the cardiac microstructure in response to structural heart disease. Through this micro-anatomical and bottom-up homogenization framework, we demonstrate the feasibility of exploring cellular-scale stress transfer between myocytes and extracellular matrix to further probe the effect of micro-level behavior on organ-level remodeling and identify mechanical attributes critical to heart disease therapies.
Acknowledgments
This work was supported by the National Institutes of Health, United States (T32 EB007507 to D.S.L., K99 HL138288 to R.A., R01 HL094464 to F.B.S., R01 HL063954 to M.S.S.).
Appendix
A.1. Bottom-up homogenization approach
In order to incorporate the dimensional differences between our previous experimental studies and the current FE model, we computed the effective stress-strain response of 56×35×19 rotated RTE simulations undergoing the same prescribed tissue-level biaxial loading. Instances of the rotated RTE simulation were driven by the histologically measured mean and standard deviation of the myofiber structure from Avazmohammadi et al. (Fig. A.1a), which were used to generate ODFs over the interval as a function of transmural depth, where for any . At 19 regularly spaced depths, we extracted the corresponding ODF (Fig. A.1b), which was then sampled 56×35 times to obtain a number of instances matched to the dimensions of the tissue-level studies (Fig. A.1c).
We ran a series of forward simulations of the RTE FE model rotated by values of regularly spaced over the ( interval for all three biaxial loading paths, allowing us to evaluate the total stress (sum of both myofiber and ECM phases weighted by their respective volume fractions) at all deformations for each rotation. We also found that the stress-strain behavior was periodic over . A 3D cubic interpolation was then fit to the forward model results in MATLAB, from which the components of the stress tensor could be determined for any strain or rotation (Fig. A.2).
A.2. Bottom-up homogenization sensitivity
We also assessed the sensitivity of the homogenized stress-strain response to the number of longitudinal, circumferential, and transmural samples, comparing the results computed from 56×35×19,25×25×19,10×10×10, and 5×5×5 total samples, repeated 3–5 instances. When comparing the average normalized error relative to the tissue-level model predictions, computed over all data points and loading paths for each case, we observed a convergence-like behavior over multiple trials by the 25×25×19 case, suggesting that the 56×35×19 case could be well represented with a reduced number of RTE samples, improving the overall computation time (Fig. A.3).
A.3. Comparison of top-down and RTE model constituent contributions
The total stress within the top-down model was comprised of myofiber, (extracellular) collagen, and myofiber-collagen interactions, whereas the total stress within the RTE FE model was comprised of myofiber and ECM contributions only. Fig. A. 4 shows the constituent breakdown for both models that yield the same total stress, showing that the RTE FE model predicts increased stresses in both the myofiber and ECM phases relative to their top-down model counterparts that offset the interaction stress of the top-down model.
Fig. A.1.
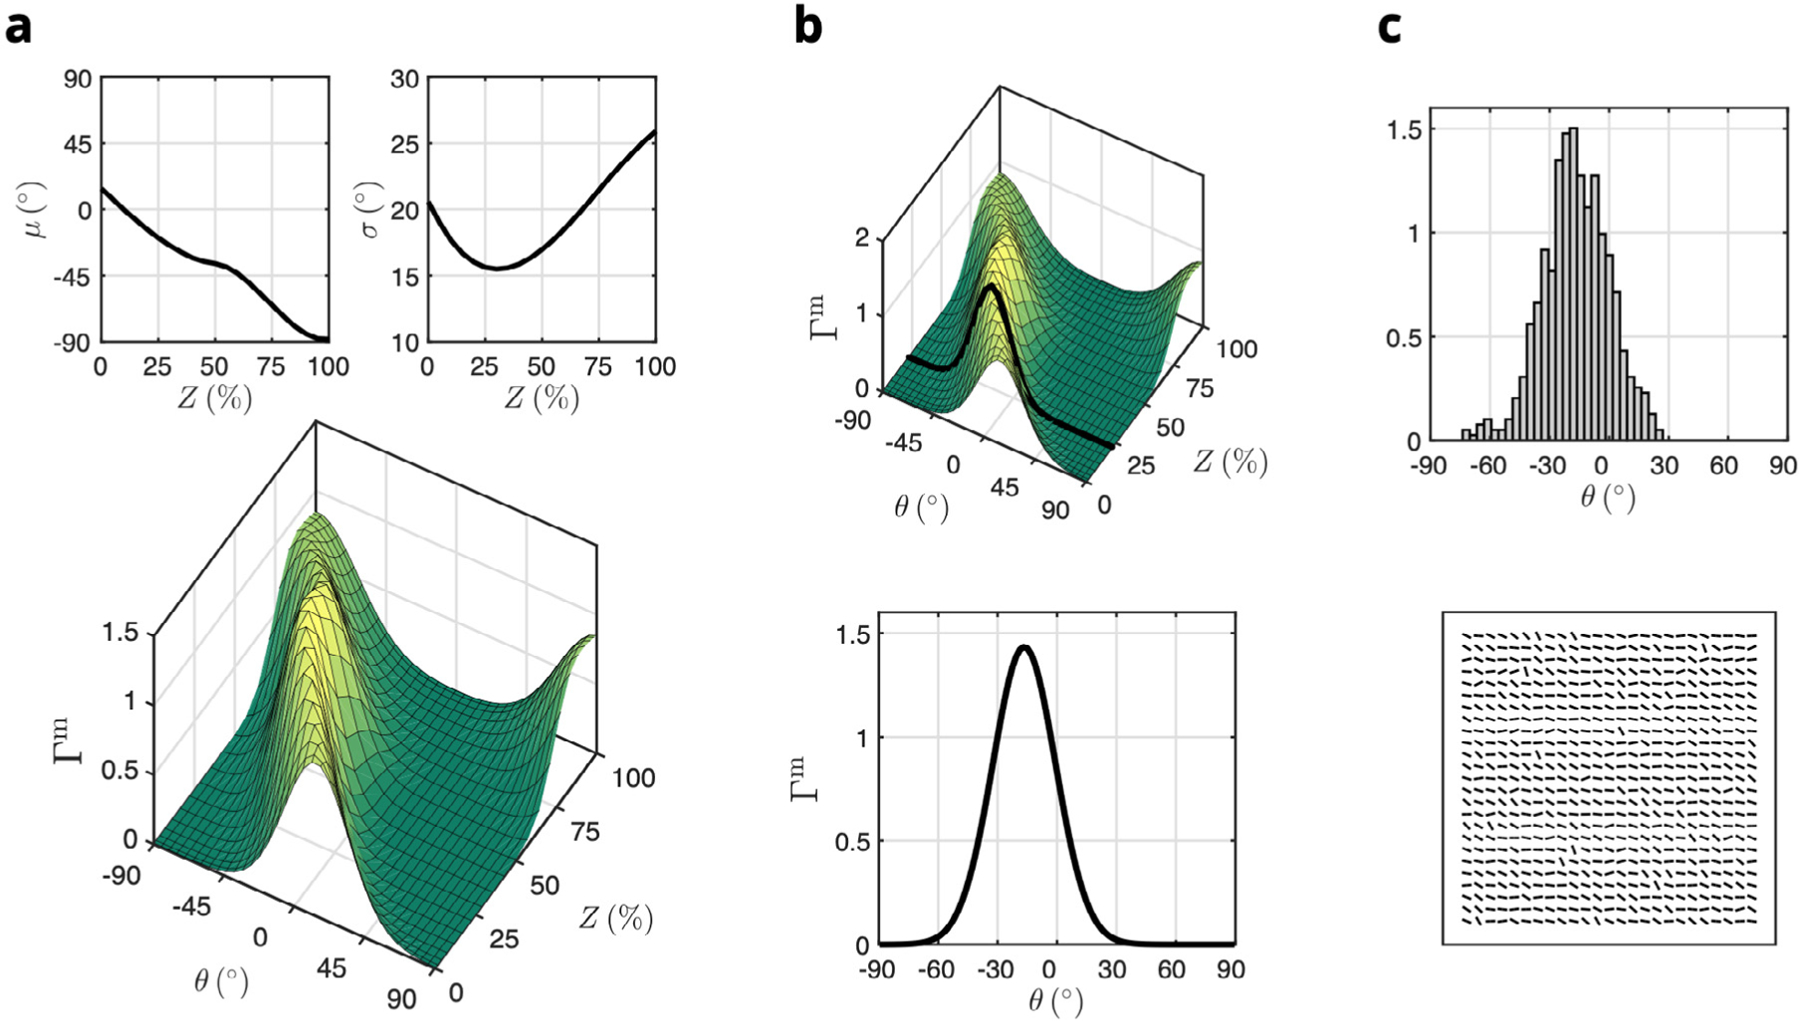
Bottom-up homogenization approach for prediction of bulk tissue mechanics from the RTE model. (a) Mean and standard deviations of the orientation distribution function over angle and transmural depth for myofibers () measured from histology (reproduced from Figure 7 in Avazmohammadi et al. (2017d)). (b) Extracting a representative orientation distribution function at a given transmural depth (black line). (c) Normalized histogram of local orientation angles based on sampling , including an alternative grid arrangement visualization of RTE models used to construct a tissue-level layer, with each bar describing the local orientation of the RTE model (not to scale).
Fig. A.2.
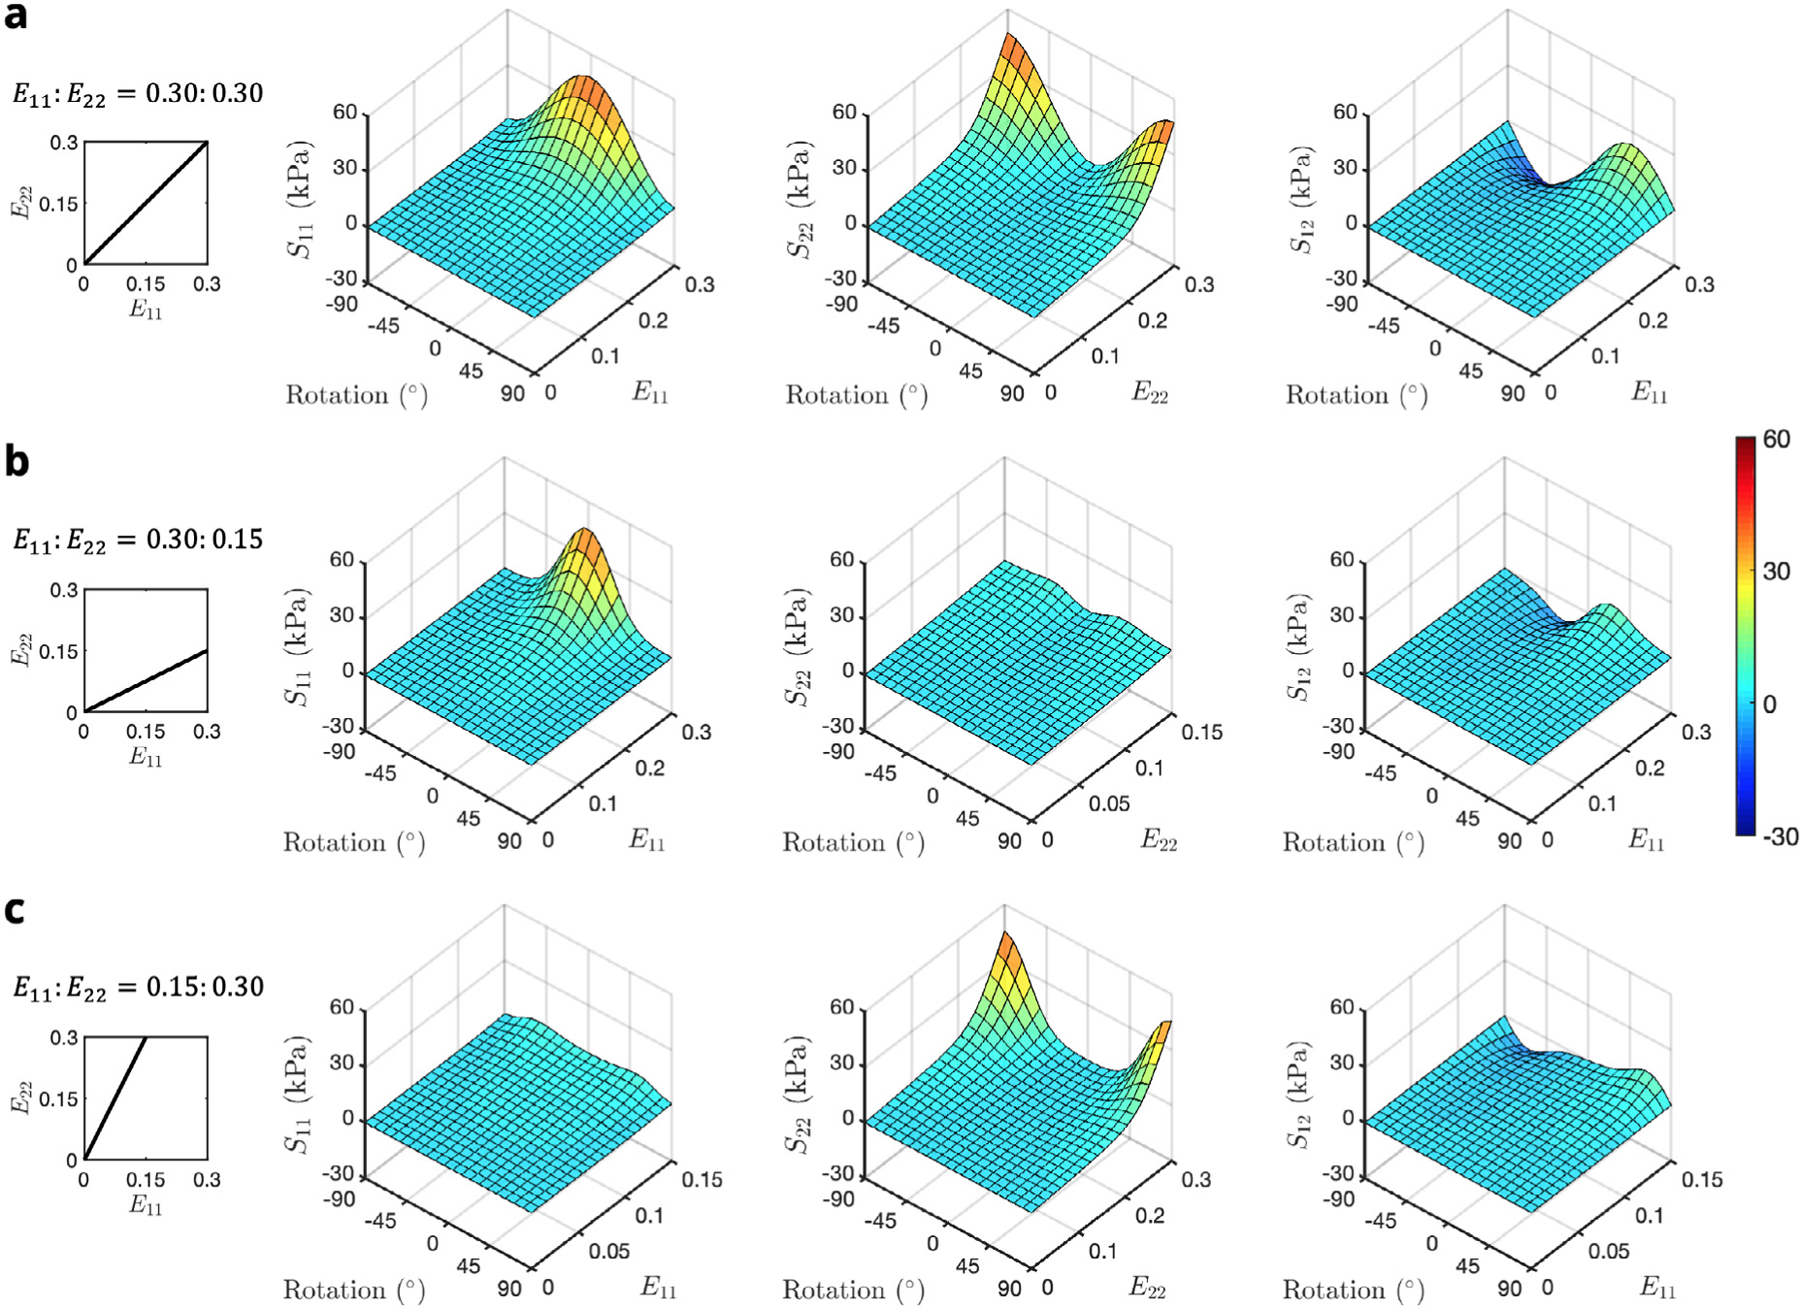
Interpolated total stress–strain-rotation surfaces for biaxial loading paths = (a) 0.30∶0.30, (b) 0.30∶0.15, and (c) 0.15∶0.30. Shear stress is plotted as a function of for clarity.
Fig. A.3.
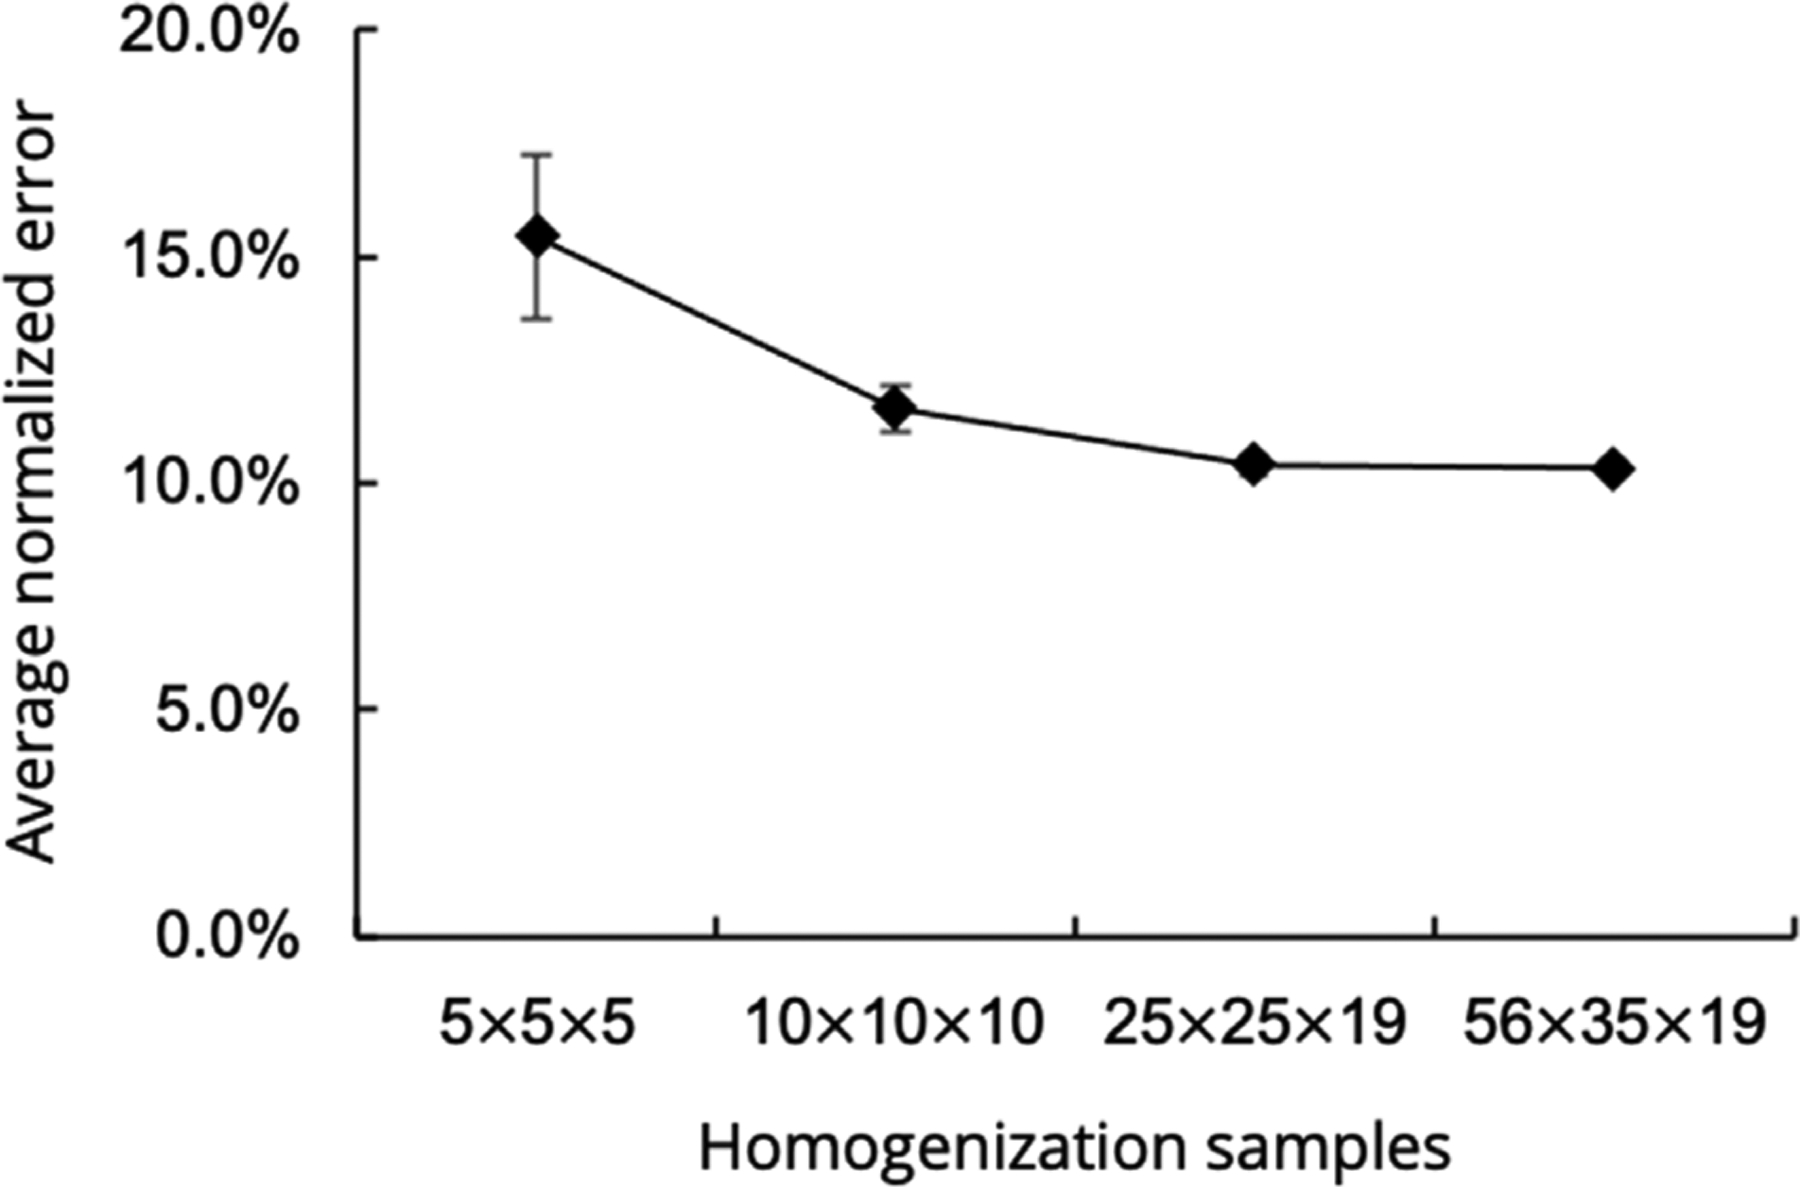
Average normalized error between previous tissue-level model and bottom-up homogenization routine. Values are reported as mean ± SEM computed over all data points and loading paths for each case.
Fig. A.4.
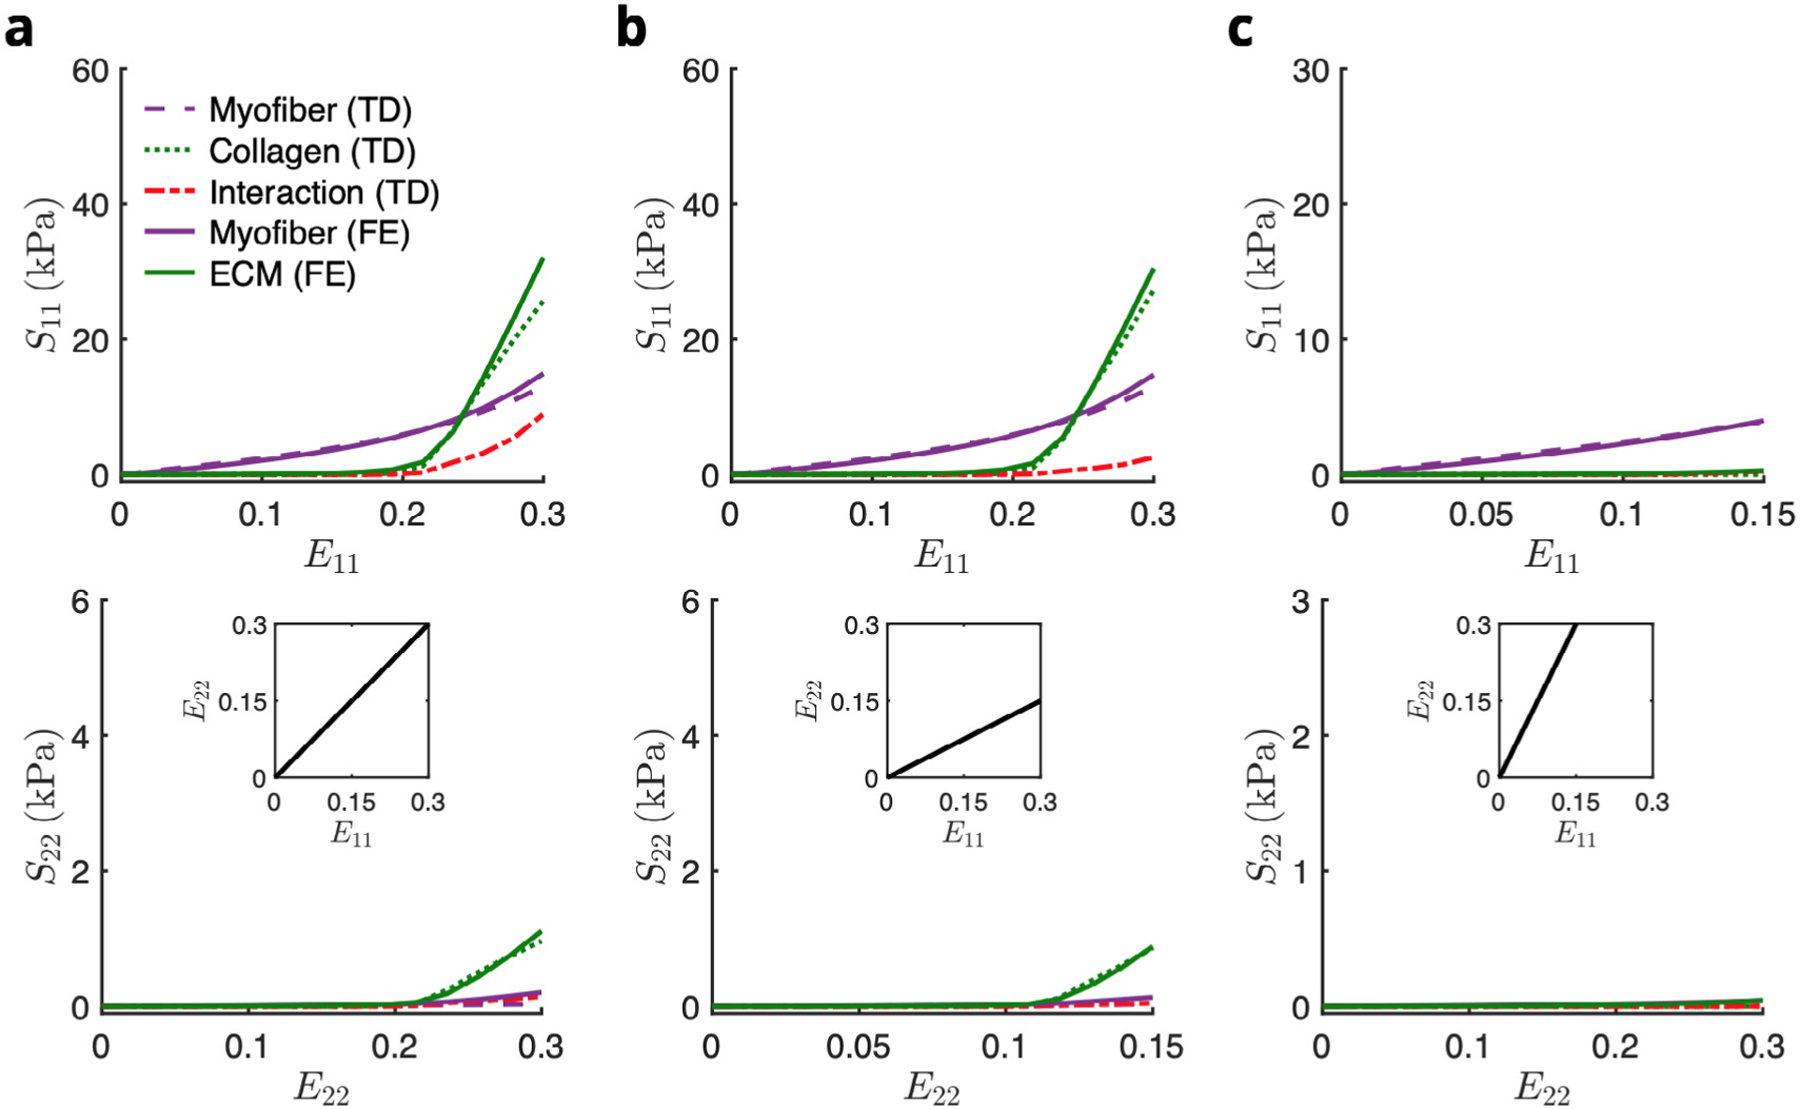
Comparison of the constituent contributions of the top-down and RTE FE models in biaxial paths E11∶E22 = (a) 0.30∶0.30, (b) 0.30∶0.15, and (c) 0.15∶0.30. Abbreviations: TD, top-down; FE, finite element.
Footnotes
CRediT authorship contribution statement
David S. Li: Writing - original draft, Software, Methodology, Formal analysis. Emilio A. Mendiola: Software, Methodology. Reza Avaz-mohammadi: Software. Frank B. Sachse: Methodology, Data curation. Michael S. Sacks: Writing - review & editing, Writing - original draft, Visualization, Validation, Supervision, Resources, Project administration, Methodology, Investigation, Funding acquisition, Formal analysis, Conceptualization.
Declaration of competing interest
The authors declare that they have no known competing financial interests or personal relationships that could have appeared to influence the work reported in this paper.
Data availability
Data will be made available on request
References
- Algranati D, Kassab GS, Lanir Y, 2010. Mechanisms of myocardium-coronary vessel interaction. Am. J. Physiol. Heart Circ. Physiol 298 (3), H861–73. 10.1152/ajpheart.00925.2009, URL http://www.ncbi.nlm.nih.gov/pubmed/19966048. [DOI] [PMC free article] [PubMed] [Google Scholar]
- Avazmohammadi R, Hill MR, Simon MA, Sacks MS, 2017a. Transmural remodeling of right ventricular myocardium in response to pulmonary arterial hypertension. APL Bioeng. 1 (1), 016105. 10.1063/1.5011639. [DOI] [PMC free article] [PubMed] [Google Scholar]
- Avazmohammadi R, Hill M, Simon M, Sacks M, 2017b. Transmural remodeling of right ventricular myocardium in response to pulmonary arterial hypertension. APL Bioeng. 1 (1), 016105. [DOI] [PMC free article] [PubMed] [Google Scholar]
- Avazmohammadi R, Hill M, Simon M, Zhang W, Sacks M, 2017c. A novel constitutive model for passive right ventricular myocardium: evidence for myofibercollagen fiber mechanical coupling. Biomech. Model. Mechanobiol 16 (2), 561–581. [DOI] [PMC free article] [PubMed] [Google Scholar]
- Avazmohammadi R, Hill MR, Simon MA, Zhang W, Sacks MS, 2017d. A novel constitutive model for passive right ventricular myocardium: evidence for myofiber-collagen fiber mechanical coupling. Biomech. Model. Mechanobiol 16 (2), 561–581. 10.1007/s10237-016-0837-7. [DOI] [PMC free article] [PubMed] [Google Scholar]
- Avazmohammadi R, Hill M, Simon M, Zhang W, Sacks M, 2017e. A novel constitutive model for passive right ventricular myocardium: evidence for myofiber-collagen fiber mechanical coupling. Biomech. Model. Mechanobiol. [DOI] [PMC free article] [PubMed] [Google Scholar]
- Avazmohammadi R, Soares JS, Li DS, Eperjesi T, Pilla J, Gorman RC, Sacks MS, 2020. On the in vivo systolic compressibility of left ventricular free wall myocardium in the normal and infarcted heart. J. Biomech 107, 109767. 10.1016/j.jbiomech.2020.109767. [DOI] [PMC free article] [PubMed] [Google Scholar]
- Avazmohammadi R, Soares JS, Li DS, Raut SS, Gorman RC, Sacks MS, 2019a. A contemporary look at biomechanical models of myocardium. Annu. Rev. Biomed. Eng 21, 417–442. 10.1146/annurev-bioeng-062117-121129. [DOI] [PMC free article] [PubMed] [Google Scholar]
- Avazmohammadi R, Soares JS, Li DS, Raut SS, Gorman RC, Sacks MS, 2019b. A contemporary look at biomechanical models of myocardium. Annu. Rev. Biomed. Eng 21 (1), 417–442. 10.1146/annurev-bioeng-062117-121129, [DOI] [PMC free article] [PubMed] [Google Scholar]
- Benza RL, Park MH, Keogh A, Girgis RE, 2007. Management of pulmonary arterial hypertension with a focus on combination therapies. J. Heart Lung Transplant 26 (5), 437–446. 10.1016/j.healun.2007.01.035. [DOI] [PubMed] [Google Scholar]
- Bogaard H, Abe K, Vonk Noordegraaf A, Voelkel NF, 2009. The right ventricle under pressure: cellular and molecular mechanisms of right-heart failure in pulmonary hypertension. Chest 135 (3), 794–804. [DOI] [PubMed] [Google Scholar]
- Borg T, Johnson L, Lill P, 1983. Specific attachment of collagen to cardiac myocytes: in vivo and in vitro. Dev. Biol 97 (2), 417–423. [DOI] [PubMed] [Google Scholar]
- Caulfield J, Borg T, 1979. The collagen network of the heart. Lab. Invest 40 (3), 364–372. [PubMed] [Google Scholar]
- Chuong CJ, Sacks MS, Templeton G, Schwiep F, Johnson RL Jr., 1991. Regional deformation and contractile function in canine right ventricular free wall. Am. J. Physiol 260 (4 Pt 2), H1224–35, URL http://www.ncbi.nlm.nih.gov/entrez/query.fcgi?cmd=Retrieve&db=PubMed&dopt=Citation&list_uids=2012225. [DOI] [PubMed] [Google Scholar]
- Dalbosco M, Carniel TA, Fancello EA, Holzapfel GA, 2021. Multiscale numerical analyses of arterial tissue with embedded elements in the finite strain regime. Comput. Methods Appl. Mech. Engrg 381, 113844. 10.1016/j.cma.2021.113844. [DOI] [Google Scholar]
- Eriksson TS, Prassl AJ, Plank G, Holzapfel GA, 2013. Modeling the dispersion in electromechanically coupled myocardium. Int. J. Numer. Method Biomed. Eng 29 (11), 1267–1284. 10.1002/cnm.2575, URL http://www.ncbi.nlm.nih.gov/pubmed/23868817. [DOI] [PMC free article] [PubMed] [Google Scholar]
- Fomovsky G, Thomopoulos S, Holmes J, 2010. Contribution of extracellular matrix to the mechanical properties of the heart. J. Mol. Cell. Cardiol 48 (3), 490–496. [DOI] [PMC free article] [PubMed] [Google Scholar]
- Fung Y, 1993. Biomechanics: Mechanical Properties of Living Tissues, second ed. Springer, 10.1007/978-1-4757-2257-4. [DOI] [Google Scholar]
- Hassaballah AI, Hassan MA, Mardi AN, Hamdi M, 2013. An inverse finite element method for determining the tissue compressibility of human left ventricular wall during the cardiac cycle. PLoS One 8 (12), e82703. [DOI] [PMC free article] [PubMed] [Google Scholar]
- Hemnes AR, Champion HC, 2008. Right heart function and haemodynamics in pulmonary hypertension. Int. J. Clin. Pract. Suppl 11–19. [DOI] [PubMed] [Google Scholar]
- Hill MR, Simon MA, Valdez-Jasso D, Zhang W, Champion HC, Sacks MS, 2014a. Structural and mechanical adaptations of right ventricle free wall myocardium to pressure overload. Ann. Biomed. Eng 42 (12), 2451–2465. 10.1007/s10439-014-1096-3. [DOI] [PMC free article] [PubMed] [Google Scholar]
- Hill MR, Simon MA, Valdez-Jasso D, Zhang W, Champion HC, Sacks MS, 2014b. Structural and mechanical adaptations of right ventricle free wall myocardium to pressure overload. Ann. Biomed. Eng 42 (12), 2451–2465. 10.1007/s10439-014-1096-3, URL http://www.ncbi.nlm.nih.gov/pubmed/25164124. [DOI] [PMC free article] [PubMed] [Google Scholar]
- Holzapfel GA, Ogden R, 2009a. Constitutive modelling of passive myocardium: A structurally based framework for material characterization. Philos. Trans. Ser. A Math. Phys. Eng. Sci 367 (1902), 3445–3475. [DOI] [PubMed] [Google Scholar]
- Holzapfel GA, Ogden RW, 2009b. Constitutive modelling of passive myocardium: a structurally based framework for material characterization. Philos. Trans. R. Soc. Lond. A: Math. Phys. Eng. Sci 367 (1902), 3445–3475. 10.1098/rsta.2009.0091. [DOI] [PubMed] [Google Scholar]
- Horowitz A, Lanir Y, Yin FCP, Perl M, Sheinman I, Strumpf RK, 1988a. Structural three dimensional constitutive law for the passive myocardium. J. Biomech. Eng 110, 200–207. [DOI] [PubMed] [Google Scholar]
- Horowitz A, Lanir Y, Yin FC, Perl M, Sheinman I, Strumpf RK, 1988b. Structural three-dimensional constitutive law for the passive myocardium. J. Biomech. Eng 110 (3), 200–207, URL http://www.ncbi.nlm.nih.gov/htbin-post/Entrez/query?db=m&form=6&dopt=r&uid=0003172739. [DOI] [PubMed] [Google Scholar]
- Hunter PJ, McCulloch AD, ter Keurs HE, 1998. Modelling the mechanical properties of cardiac muscle. Prog. Biophys. Mol. Biol 69 (2–3), 289–331, URL http://www.ncbi.nlm.nih.gov/htbin-post/Entrez/query?db=m&form=6&dopt=r&uid=0009785944. [DOI] [PubMed] [Google Scholar]
- Jang S, Vanderpool RR, Avazmohammadi R, Lapshin E, Bachman TN, Sacks M, Simon MA, 2017. Biomechanical and hemodynamic measures of right ventricular diastolic function: Translating tissue biomechanics to clinical relevance. J. Am. Heart Assoc 6. [DOI] [PMC free article] [PubMed] [Google Scholar]
- Kakaletsis S, Meador WD, Mathur M, Sugerman GP, Jazwiec T, Malinowski M, Lejeune E, Timek TA, Rausch MK, 2021. Right ventricular myocardial mechanics: Multi-modal deformation, microstructure, modeling, and comparison to the left ventricle. Acta Biomater. 123, 154–166. [DOI] [PMC free article] [PubMed] [Google Scholar]
- Lai Y-C, Potoka KC, Champion HC, Mora AL, Gladwin MT, 2014. Pulmonary arterial hypertension. Circ. Res 115 (1), 115–130. http://dx.doi.org/10.1161CIRCRESAHA.115.301146. [DOI] [PMC free article] [PubMed] [Google Scholar]
- Lanir Y, Nevo E, 1993. The orientation of an intramyocardial vessel affects its mechanical loading by the surrounding myocardium. J. Biomech. Eng 115 (3), 327–328, URL http://www.ncbi.nlm.nih.gov/entrez/query.fcgi?cmd=Retrieve&db=PubMed&dopt=Citation&list_uids=8231149. [DOI] [PubMed] [Google Scholar]
- LeGrice IJ, Smaill BH, Chai LZ, Edgar SG, Gavin JB, Hunter PJ, 1995. Laminar structure of the heart: ventricular myocyte arrangement and connective tissue architecture in the dog. Am. J. Physiol.-Heart Circ. Physiol 269 (2), H571–H582. 10.1152/ajpheart.1995.269.2.H571, [DOI] [PubMed] [Google Scholar]
- Liu H, Soares JS, Walmsley J, Li DS, Raut S, Avazmohammadi R, Iaizzo P, Palmer M, Gorman JH, Gorman RC, et al. , 2021. The impact of myocardial compressibility on organ-level simulations of the normal and infarcted heart. Sci. Rep 11 (1), 1–15. [DOI] [PMC free article] [PubMed] [Google Scholar]
- Lunkenheimer P, Redmann K, Kling N, Jiang X, Rothaus K, Cryer C, Wübbeling F, Niederer P, Heitz P, Yen Ho S, et al. , 2006. Three-dimensional architecture of the left ventricular myocardium. Anat. Rec. Part A: Discov. Mol. Cell. Evol. Biol.: Off. Publ. Am. Assoc. Anat 288 (6), 565–578. [DOI] [PubMed] [Google Scholar]
- Macchiarelli G, Ohtani O, Nottola SA, Stallone T, Camboni A, Prado IM, Motta PM, 2002. A micro-anatomical model of the distribution of myocardial endomysial collagen. Histol. Histopathol 17, 699–706. [DOI] [PubMed] [Google Scholar]
- McEvoy E, Holzapfel GA, McGarry P, 2018. Compressibility and anisotropy of the ventricular myocardium: Experimental analysis and microstructural modeling. J. Biomech. Eng 140. [DOI] [PubMed] [Google Scholar]
- McLaughlin VV, Shah SJ, Souza R, Humbert M, 2015. Management of pulmonary arterial hypertension. J. Am. Coll. Cardiol 65 (18), 1976–1997. [DOI] [PubMed] [Google Scholar]
- Naeije R, Manes A, 2014. The right ventricle in pulmonary arterial hypertension. Eur. Respir. Rev.: Off. J. Eur. Respir. Soc 23, 476–487. [DOI] [PMC free article] [PubMed] [Google Scholar]
- Nash Hunter, 2000. Computational mechanics of the heart. J. Elasticity 61, 113–141. [Google Scholar]
- Perestrelo AR, Silva AC, Oliver-De La Cruz J, Martino F, Horváth V, Caluori G, Polanský O, Vinarský V, Azzato G, de Marco G, Žampachová V, Skládal P, Pagliari S, Rainer A, Pinto-do Ó P, Caravella A, Koci K, Nascimento DS, Forte G, 2021. Multiscale analysis of extracellular matrix remodeling in the failing heart. Circ. Res 128, 24–38. [DOI] [PubMed] [Google Scholar]
- Pinsky MR, 2016. The right ventricle: interaction with the pulmonary circulation. Crit. Care (London England) 20, 266. [DOI] [PMC free article] [PubMed] [Google Scholar]
- Robinson T, Cohen-Gould L, Factor S, 1983. Skeletal framework of mammalian heart muscle. Arrangement of inter-and pericellular connective tissue structures. Lab. Invest 49 (4), 482–498. [PubMed] [Google Scholar]
- Sacks M, Chuong C, 1993. A constitutive relation for passive right-ventricular free wall myocardium. J. Biomech 26 (11), 1341–1345. 10.1016/0021-9290(93)90357-K, URL http://www.sciencedirect.com/science/article/pii/002192909390357K. [DOI] [PubMed] [Google Scholar]
- Sakao S, Tatsumi K, Voelkel NF, 2010. Reversible or irreversible remodeling in pulmonary arterial hypertension. Am. J. Respir. Cell Mol. Biol 43, 629–634. [DOI] [PMC free article] [PubMed] [Google Scholar]
- Schmid H, Nash MP, Young AA, Hunter PJ, 2006. Myocardial material parameter estimation-a comparative study for simple shear. J. Biomech. Eng 128 (5), 742–750. 10.1115/1.2244576, URL http://www.ncbi.nlm.nih.gov/pubmed/16995761. [DOI] [PubMed] [Google Scholar]
- Schmid H, Nash MP, Young AA, Rohrle O, Hunter PJ, 2007. A computationally efficient optimization kernel for material parameter estimation procedures. J. Biomech. Eng 129 (2), 279–283. 10.1115/1.2540860, URL http://www.ncbi.nlm.nih.gov/pubmed/17408333. [DOI] [PubMed] [Google Scholar]
- Schmid H, O’Callaghan P, Nash MP, Lin W, LeGrice IJ, Smaill BH, Young AA, Hunter PJ, 2008. Myocardial material parameter estimation: a non-homogeneous finite element study from simple shear tests. Biomech. Model. Mechanobiol 7 (3), 161–173. 10.1007/s10237-007-0083-0, URL http://www.ncbi.nlm.nih.gov/pubmed/17487519. [DOI] [PubMed] [Google Scholar]
- Schmid H, Wang YK, Ashton J, Ehret AE, Krittian SB, Nash MP, Hunter PJ, 2009a. Myocardial material parameter estimation: a comparison of invariant based orthotropic constitutive equations. Comput. Methods Biomech. Biomed. Eng 12 (3), 283–295. 10.1080/10255840802459420, URL http://www.ncbi.nlm.nih.gov/pubmed/19089682. [DOI] [PubMed] [Google Scholar]
- Schmid H, Wang W, Hunter PJ, Nash MP, 2009b. A finite element study of invariant-based orthotropic constitutive equations in the context of myocardial material parameter estimation. Comput. Methods Biomech. Biomed. Eng 12 (6), 691–699. 10.1080/10255840902870427, URL http://www.ncbi.nlm.nih.gov/pubmed/19639485. [DOI] [PubMed] [Google Scholar]
- Seidel T, Dräbing T, Seemann G, Sachse F, 2013. A semi-automatic approach for segmentation of three-dimensional microscopic image stacks of cardiac tissue. Lecture Notes in Comput. Sci 7945, 300–307. 10.1007/978-3642-38899-6_36. [DOI] [Google Scholar]
- Seidel T, Edelmann J-C, Sachse FB, 2016. Analyzing remodeling of cardiac tissue: A comprehensive approach based on confocal microscopy and 3D reconstructions. Ann. Biomed. Eng 44 (5), 1436–1448. 10.1007/s10439-0151465-6. [DOI] [PMC free article] [PubMed] [Google Scholar]
- Sommer G, Schriefl A, Andra M, Sacherer M, Viertler C, Wolinski H, Holzapfel G, 2015. Biomechanical properties and microstructure of human ventricular myocardium. Acta Biomater. [DOI] [PubMed] [Google Scholar]
- Yin FC, Chan CC, Judd RM, 1996. Compressibility of perfused passive myocardium. Am. J. Physiol 271 (5 Pt 2), H1864–70, URL http://www.ncbi.nlm.nih.gov/htbin-post/Entrez/query?db=m&form=6&dopt=r&uid=0008945902. [DOI] [PubMed] [Google Scholar]
- Young JM, Choy JS, Kassab GS, Lanir Y, 2012. Slackness between vessel and myocardium is necessary for coronary flow reserve. Am. J. Physiol. Heart Circ. Physiol 302 (11), H2230–42. 10.1152/ajpheart.01184.2011, URL http://www.ncbi.nlm.nih.gov/pubmed/22408024. [DOI] [PMC free article] [PubMed] [Google Scholar]
Associated Data
This section collects any data citations, data availability statements, or supplementary materials included in this article.
Data Availability Statement
Data will be made available on request


