

Abstract

A series of Cd- and Er-doped bismuth ferrites were synthesized using a simple microemulsion technique. The influence of Cd and Er doping on the structural, ferroelectric, photocatalytic, and dielectric properties of bismuth ferrite (BFO) was examined in this research. The prepared materials were examined by X-ray diffraction, Raman, scanning electron microscopy, and UV–vis techniques. The XRD patterns reflected the formation of a monophasic rhombohedral structure with the space group R3–c and an average crystallite size calculated to be in the range of 29 to 32 nm. The saturation polarization (Ps), coercivity (Hc), and retentivity (Pr) of the materials were investigated by a hysteresis loop (P-E), and it was perceived that increasing the dopant contents improved the Ps and Pr values, which may be due to the variation of metal cation valence states. In accordance with the photoluminescence (PL) spectra, a highly substituted material displayed lower recombination and increased charge separation rate (e––h+), which eventually contributed to a higher photocatalytic degradation performance of the prepared NMs. Furthermore, as the frequency and dopant concentration increased, the dielectric loss decreased, which could be due to different types of polarization. Bi1 – xCdxFe1 – yEryO3 showed well-saturated hysteresis loops (P-E) with enhanced saturation polarization near 9.7 × 10⁻⁴ μC·cm–2. The remnant polarization of the BFO and BFOCE NPs was 2.26 × 10⁻⁴ and 8.11 × 10⁻⁴ μC·cm–2, respectively, under a maximum electric field, which may be due to the variation of the metal cation valence states. The improved ferroelectric and dielectric properties of Bi1 – xCdxFe1 – yEryO3 NPs are attributed to the reduced concentration of defects, the different domain behavior, and the valence state of Cd and Er ions. The electrochemical (crystal violet (CV) and I–V) properties of Bi1 – xCdxFe1 – yEryO3 were all influenced by the dopant concentrations (Cd and Er). The synergistic effects of Cd and Er on the substituted material enhanced the specific capacitance in comparison to undoped BiFeO3. The photocatalytic activity to degrade CV under visible irradiation increased in BFOCE as the dopant (x,y) concentration increased from 0 to 0.25 by showing 84% dye degradation in comparison to pristine BiFeO3 (53% only) within 120 min under visible light. Moreover, the stability of these prepared nanoparticles was confirmed using recycling experiments, with the results indicating that the synthesized nanomaterials demonstrated promising stability and reusability.
1. Introduction
Multiferroic materials are encouraging for design and fabrication of multi-functional materials. They are notable for their distinctive and solid connection of structural, electric, and magnetic order characteristics, which results in simultaneous ferromagnetism, ferroelectricity, and ferroelasticity. Multiferroics having magnetoelectric (ME) effects may be electrically polarized when a magnetic field is applied, or magnetization can be induced by introducing an external field.1,2 As a result, multiferroic materials are being investigated for use in a variety of new electronic devices, i.e., multiple-state memory, new storage medium, spin valves, microelectronic devices, and quantum electromagnets.1,3 Perovskite ABO3-structured BiFeO3 has been one of the most well-known multi-ferroic materials with sequential ferroelectric (TC ≈ 830 °C) and anti-ferromagnetic (TN ≈ 370 °C) characteristics, making it one of top possibilities for ME applications over room temperature. It owns a distorted rhombohedral perovskite structure. BiFeO3 spontaneous polarization in hetero-epitaxially restricted thin films has been increased by nearly an order of the magnitude above that of a single crystal. The multi-functionality of BiFeO3 not only allows for fundamental physics research but also may be employed as a visible-light-sensitive photocatalyst for water splitting and organic pollutant degradation owing to its favorable band gap and outstanding chemical stability.4,5 Furthermore, studies have shown its potential applications in opto-electronic devices and solar cells. The use of tiny band gap ferroelectric materials with high carrier transport capabilities is a viable way toward innovative opto-electronic applications, making BiFeO3 a potential choice for commercially accessible devices such as femto-second laser pulses.6,7
Doping bismuth ferrite (BFO) with another atom on any site (A or B) of the ABO3 lattice has recently been revealed to show an essential part in changing its characteristics, for instance, replacing Bi3+ with RE (rare-earth) metal ions, which caused a significant progress in ferroelectric and ferromagnetic properties of BiFeO3, which could potentially result in an improved ME effect.4,5 Kan et al. recently discovered a general conduct in a variety of the RE-doped BiFeO3 materials.8 The structure transition from the ferroelectric rhombohedral to orthorhombic phase, which shows double hysteresis loop polarization and improves electro-mechanical characteristics significantly, is observed to happen independently of RE dopant species. Because such changes in the functional properties have been proved to take place as a result of alterations in the crystallite structure of BFO, it is fair to conclude that this kind of replacement might also influence BFO’s photocatalytic property.6
At present, environmental pollution and contamination of water resources are two major issues, which are due to the population increase and industrialization, causing a negative effect on the living organisms. Industries including printing, textile dying, leather tanning, and paper discharge a large number of dyes; synthetic dyes being visible even at lowest concentrations in water are harmful for humans and aquatic life. In order to ensure the safety of water resources, these coloring agents must be removed before being discharged into water bodies.9−11 A large number of dyes are synthesized every year, of which almost 15% is discharged into the water sources, which enter the food chain by bioaccumulation processes. Several techniques are in practice for the remediation of dyes, but these techniques have limitations, i.e., low efficiency as well as generation of sludge, which is also toxic to the living organisms.12−15 Hence, there is a need to use techniques that are cost-effective and economical to completely remove the pollutants. Among treatment approaches, the efficient and cost-effective approach is photocatalytic treatment. In photocatalysis, degradation takes place at the surface of the photocatalyst through an oxidative process. For efficient and cost-effective degradation, it is crucial that the photocatalysts remain active under visible light irradiation.4,5 Different catalysts have been studied, which proved efficient for catalytic applications, i.e., metallic oxides, composites, and doped materials,6,7,16,17 and the BaFe12O19 doping with different elements may also show promising photocatalytic activities. Based on aforementioned facts, a series of Cd- and Er-doped BiFeO3 synthesized via the micro-emulsion approach and doping influence on ferroelectric, dielectric, electrochemical, and photocatalytic properties was appraised. The catalytic potential was appraised for crystal violet (CV) dye removal with the mechanism of dye degradation.
2. Experimental Section
2.1. Chemicals and Reagents
Bi(NO3)2·6H2O, Cd(NO3)2·4H2O, Fe(NO3)3·6H2O, Er(NO3)3·5H2O, and CTAB were supplied by Sigma-Aldrich. The ammonia solution (NH4OH) and CV were obtained from AnalaR.
2.2. Synthesis of BiFeO3 and Bi1–xCdxFe1–yEryO3
Various compositions of Bi1 – xCdxFe1 – yEryO3 NPs (x,y = 0.0, 0.05, 0.10, 0.15, 0.20, 0.25) were synthesized by a microemulsion route. For this, stoichiometric amounts of aqueous solutions of each metal nitrate were prepared, mixed, and agitated for 30 min at 60 °C before adding CTAB (0.2 molar) as a surfactant to the resulting mixtures. The heating was switched off once the appropriate temperature was achieved. Ammonia (32%) solution was appropriately introduced into stirring solution, and precipitate formation started at pH = 11. The precipitates were rinsed with distilled water multiple times before being dried overnight at 150 °C, which were ground and sintered at 950 °C for 7 h to acquire the required perovskite structure and subjected to characterization. The chemical reactions are shown in eqs 1 and 2(18) and Figure 1.
| 1 |
| 2 |
Figure 1.

Synthesis scheme of Bi1–xCdxFe1–yEryO3 nanoparticles (photograph courtesy of Zarish Nazeer. Copyright 2022).
2.3. Characterization
Several scientific methodologies were then used to characterize the nanomaterials synthesized by the micro-emulsion process. For example, the X-ray diffraction method was used to examine the crystallinity of nanoparticles by using a Philips X’Pert Pro 3040/60 X-ray diffractometer. The SEM descriptions were attained by a JEOL JSM-6490LA SEM instrument. The ferroelectric P-E loop tracer M-S (Radiant Technologies, United States) equipment for evaluating ferroelectric properties was finalized. Using Raman spectroscopy and FTIR, chemical bonds between the elements were verified (Nexus 470 spectrophotometer). Photoluminescence spectra were measured by a Shimadzu RF-5301PC fluorescence spectrophotometer. The measurements of dielectric properties were acquired by a Wayn Kerr WK-6500B LCR meter in 20 Hz–0.2 GHz. The UV–vis spectra for the materials were recorded by a double-beam Cary 60 spectrophotometer.
2.4. Photocatalytic Activity Measurement
When evaluated in the presence of visible light, BFO and BFOCE showed to be efficient photocatalysts for CV dye degradation. During the experiment, 10 mg of the catalyst was introduced to a 50 mL solution (10 mg/L) of CV dye. To achieve adsorption–desorption equilibria, the solution was exposed to a 100 W Xe lamp in the dark while constantly stirred. At predetermined intervals, dye solution samples were collected and their absorbance at 665 nm was measured (Cary 60). Before each set of absorption tests, the solution was centrifuged for 20 min at 5000 rpm to eliminate particles of the catalyst. The concentration of CV was obtained from absorbance measurements using a standard curve indicating a linear connection between absorbance and concentration at 665 nm. Equation 3 was used to obtain % degradation (where Ao and At denote absorbance values at time “0” and zero “t”, correspondingly).
| 3 |
3. Results and Discussion
3.1. Structural Analysis
Figure 2 displays the XRD spectra of as-prepared pristine BFO and doped BFOCE NPs by the microemulsion technique. The presence of well-defined peaks in the XRD pattern verifies the polycrystalline and monophasic character of the fabricated material. The characteristic diffraction peaks appeared at 2θ = 22.3, 31.7, 39.4, 45.6, 51.2, 56.3, and 56.8° corresponding to the crystalline planes (012), (104), (202), (024), (116), (018), and (214), respectively, providing clear evidence of perovskite formation. The XRD peaks of BiFeO3 were indexed by using the JCPDS card no. 01-071-2494 and revealed a rhombohedral phase with an R3c space group, confirming production of BiFeO3 NPs.
Figure 2.

(a) XRD patterns of pure BFO and substituted Bi1–xCdxFe1–yEryO3. (b) X-ray density, bulk density, dislocation density, and porosity.
The substitution of the dopants in the BFO structure was shown by a considerable decline in the peak intensities for substituted samples, as well as a minor shift of diffraction peaks toward the lower 2θ axis, demonstrating the formation of the perovskite structure. This shifting could be ascribed to a comparatively small difference in ionic radii of Bi2+ (1.03A°) and Cd2+ (0.97A°) at the A site compared to Fe3+ (0.64A°) and Er3+ (0.88A°) at the B site, which causes structural defects.7 The cell volume, crystalline size, bulk density, X-ray density, and porosity were estimated using relationships indicated in eqs 4–8. Lattice parameters were calculated by means of Cell Software (Table 1).
| 4 |
| 5 |
| 6 |
| 7 |
| 8 |
Table 1. Cd and Er Doping Impact on the Structural Parameters of Bi1–xCdxFe1–yEryO3 NPs.
| doping contents |
||||||
|---|---|---|---|---|---|---|
| parameters | 0 | 0.05 | 0.1 | 0.15 | 0.2 | 0.25 |
| cell volume (A)3 | 374.98 | 375.46 | 375.66 | 376.26 | 376.87 | 378.01 |
| lattice constant a (Å) | 5.587 | 5.589 | 5.59 | 5.594 | 5.596 | 5.598 |
| lattice constant c (Å) | 13.84 | 13.86 | 13.87 | 13.88 | 13.89 | 13.93 |
| crystallite size (nm) | 29.08 | 29.73 | 30.62 | 31.23 | 31.72 | 32.98 |
| X-ray density (g cm–3) | 2.77 | 2.76 | 2.75 | 2.74 | 2.73 | 2.71 |
| bulk density (g cm–3) | 1.09 | 1.28 | 1.29 | 1.31 | 1.33 | 1.37 |
| porosity | 60.7 | 53.7 | 53.1 | 52.2 | 51.3 | 49.5 |
| dislocation density | 1.18 | 1.13 | 1.06 | 1.02 | 0.99 | 0.91 |
| strain | 0.496 | 0.488 | 0.487 | 0.476 | 0.474 | 0.471 |
Cell volume (Vcell) was increased from 374.98 Å3 for the undoped BFO to 378.01 Å3 for the highly doped composition. The perceived increment in Vcell might be ascribed to the bigger ionic radius cation occupying the space of smaller ionic radii cations, i.e., Fe3+ (0.64A°) and Er3+ (0.88A°) at the B site, resulting in an increase in lattice parameters and therefore origination of the lattice strain. The higher ionic radius makes a major contribution in the improvement of these values. Bulk density (ρm) showed to be low as compared to X-ray density, which might be associated with the existence of porosity in as-synthesized materials. The increment in crystallite size was observed from 29.08 to 32.98 nm with increasing x,y concentration. The relative increment in crystallite size is owing to the replacement of Fe3+ (smaller ionic radii 0.64 Å) by the larger Er3+ (larger ionic radii 0.88 Å). The inclusion of large-sized Er3+ at B-site ions results in the development of a distorted structure as a result of the creation of a microstrain, which in turn increases crystal defects. There may be a correlation between a decrease in porosity values and a reduction in X-ray densities in materials. Porous materials with higher porosity typically exhibit lower X-ray densities due to the presence of void spaces within the material. This decrease in porosity and X-ray densities may impact the suitability of the material for optical and catalytic applications.6,7
3.2. Surface Morphology and Elemental Analysis
The morphology of nanomaterials was examined by SEM investigation, and the achieved micrographs are presented in Figure 3. The morphology of the fabricated NPs shows that the shape of the particles is comparatively elongated and spherical, producing agglomerates with smaller size particles in the heterogeneous form. The size measured by SEM correlates with the grain size obtained by XRD study. There was also more aggregation in Cd- and Er-substituted NPs, which increased with increasing dopant content. Because particles had a higher surface energy and a small dimension, they readily combined with one another. The Cd- and Er-doped material has a larger size range and a greater surface area, making it a good material for photocatalytic applications.7 EDX analysis of the prepared samples was also performed, and the results revealed the formation of the pure final product. EDX also showed the incorporation of Cd and Er in the prepared sample since no Er and Cd were detected in BFOCE (pristine). In BFOCE, the percentages of O, Fe, and Bi were found to be 5.46, 21.40, and 73.15 (%), respectively. Similarly, the O, Fe, Cd, Er, and Bi percentages were found to be 4.16, 18.03, 8.56, 1.76, and 67.49 (%) in BFOCE2 and 5.31, 15.69, 12.14, 3.48, and 63.37 (%) in BFOCE4 (Figure 4). The prepared samples were in pure form since no additional element was observed.
Figure 3.

SEM micrographs of pristine and Bi1–xCdxFe1–yEryO3 nanoparticles.
Figure 4.

EDX analysis of Bi1–xCdxFe1–yEryO3; (A) BFO, (B) BFOCE2, and (C) BFOCE4.
3.3. FTIR Analysis
FTIR was employed as a significant tool for detecting bond vibration frequencies in the molecule. Figure 5 represents the spectra of all the fabricated samples. The results demonstrate that strong bands emerge at 440, 474, and 560 cm–1 in the perovskite structure. The bands in 700 and 400 (cm–1) were primarily ascribed to the metal oxides, whereas peaks at 560 and 440 (cm–1) in Bi1 – xCdxFe1 – yEryO3 crystallites were attributed to vibrations (stretching and bending) of Fe–O, which are features of perovskite compounds of the octahedral FeO6 group.19 The Bi–O vibration is assigned to the FTIR absorption peak at about 474 cm–1.20 The peak at 1384 cm–1 relates to NO3– left from un-reacted prelude salts.21 The existence of Cd is verified by FTIR spectra, which shows bands in the range between 1270 and 1641 cm–1.22 A band between 3600 and 3000 cm–1 is consigned to the anti-symmetric and symmetric stretching vibrations of absorbed molecules of water at the surface of the material, which could be related to water molecules adsorbed on the surface.19 These spectra reveal that in the case of substituted materials, no extra peak occur; instead, bands move to a lower wavenumber as the Er concentration increases, indicating that bending of the Fe–O and Bi–O bonds formed as a result of octahedron deformation with the Er substitution.23
Figure 5.
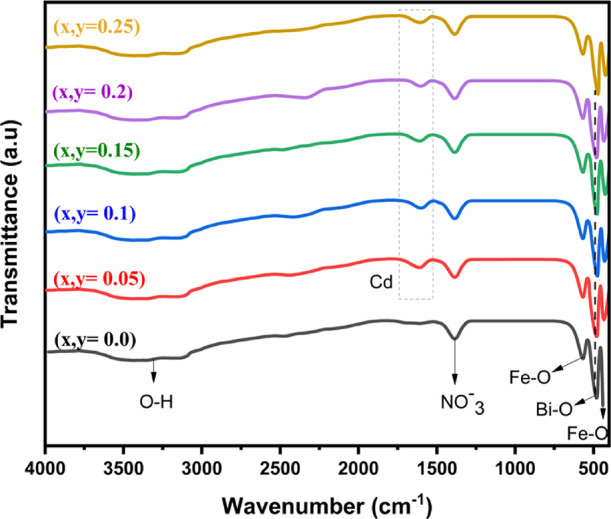
FTIR spectra of pristine and Bi1–xCdxFe1–yEryO3 nanoparticles.
3.4. Raman Spectroscopic Analysis
Raman spectroscopy is considered as one of the most active ways for evaluating structural variables at the microscopic level. It also contributes to the understanding of chemical bonding and the chemical environment by studying molecular vibrations. Raman analysis was used to gain a better understanding of Bi1 – xCdxFe1 – yEryO3 (where x,y = 0.0, 0.05, 0.10, 0.15, 0.20, 0.25) NPs (Figure 6). According to group theory, BiFeO3 with a rhombohedral structure and the R3c space group has five Raman active modes in the spectrum; ΓRaman = 2A1g + 3Eg modes.41,42 The five main Raman peaks E-1, A1-1, A1-3, E-3, and E-8 were perceived at 71, 136, 204, 286, and 521 cm–1, correspondingly. In all of our BFO samples, a peak at 76 cm–1 with a symmetric Lorentzian profile can be readily identified and ascribed to the E mode.24 The high-intensity peaks at 136 and 204 (cm–1) correspond to modes A1-1 and A1-3,25 respectively, while other phonon modes can be seen at 286 and 521, indicating the R3–c structure of BFO.25,26 With increasing Cd and Er concentrations in BFO, Ag(1) mode broadening was found. The replacement of larger host cations by small-sized doped cations induces a compressive strain in the lattice at both (octahedral and tetrahedral) sites, resulting in a blue shift in the Ag(1), Ag(3), and Eg(8) bands.27
Figure 6.

Raman spectra of pristine and Bi1–xCdxFe1–yEryO3 nanoparticles.
3.5. Ferroelectric Property
To examine the impact of substitution on the ferroelectric nature of NPs, positive-up–negative-down (PUND) ferroelectric tests were executed by ceramic pellets with silver paste covering to serve as electrodes. Figure 7 depicts traced polarization loops at room temperature vs electric field (P-E) of undoped and doped Bi1 – xCdxFe1 – yEryO3 pallets. With polarization curves that are well-shaped, all loops showed a standard ferroelectric behavior. Maximum polarization (Pmax) was recorded for all the materials, showing the semiconductor nature of the fabricated material. For varying dopant contents, the ferroelectric parameter Pmax exhibited a substantial rise from 2.5 × 10⁻² to 9.7 × 10⁻² C/cm2 (Table 2). This is due to the fact that the dopant has a high electrical sensitivity than the host (Bi), and structural alterations enhanced the ferroelectric features of the substituted compositions. The significant increase in Pr and Ec was observed in conjunction with an increase in dopant content, suggesting a potential association with structural deformation in the crystal. This deformation could arise from differences in the ionic radii at the A or B site of the crystal lattice caused by the dopant.6
Figure 7.

(a) P-E loops. (b) Ferroelectric properties of pristine and Bi1–xCdxFe1–yEryO3 nanoparticles.
Table 2. Ferroelectric Parameters of Bi1–xCdxFe1–yEryO3 (x,y = 0.0–0.25) with Respect to Dopant Content.
| doping content | composition | Pr (μC·cm2 × 10–4) | Ec (kV/cm) | Ps (μC·cm2 × 10–4) |
|---|---|---|---|---|
| 0 | BFO | 2.26 | 3.62 | 2.54 |
| 0.05 | BFOCE1 | 2.86 | 4.82 | 3.3 |
| 0.1 | BFOCE2 | 3.16 | 4.85 | 4.12 |
| 0.15 | BFOCE3 | 3.61 | 5.02 | 4.67 |
| 0.2 | BFOCE4 | 4.12 | 5.23 | 5.29 |
| 0.25 | BFOCE5 | 8.11 | 8.75 | 9.75 |
3.6. Photoluminescence (PL) Property
The electron structure, mobility, and recombination of photoinduced electron–hole pair phenomena are examined by PL analysis. The rate of charge transfer for light-induced carriers in a material is directly proportional to the intensity of the PL peak. The height of the PL peak serves as an indicator of the rate at which holes and electrons recombine. Figure 8 shows the induced fluorescence intensity of all Bi1 – xCdxFe1 – yEryO3 (x,y = 0.0–0.25) structures measured at a wavelength of 565 nm. As shown in the graph, the intensities of the PL emission peaks reduced as the doping level in the BFO crystallite structure increased. This decline in intensity indicates that the inhibitory nature of substituted elements in recombination of e––h+ results in better charge separation and, as a result, improved the photocatalytic performance of the doped BFO samples.4 More electronic states are created when host cations are substituted by Cd2+ and Er3+ in a perovskite structure, which suppresses e––h+ recombination and efficiently stabilizes charge carriers in substituted materials.4 The Bi0.75Cd0.25Fe0.75Er0.25O3 composition has the weakest PL emission peak intensity of all the fabricated materials. The decrease in PL intensity was inconsistent with an increase in the charge separation or suppression of electron–hole recombination, implying that the Bi0.75Cd0.25Fe0.75Er0.25O3 composition should increase the photocatalytic performance by effectively employing its higher charge separation and lowest recombination probability of the photoinduced e––h+ pair.
Figure 8.

Photoluminescence spectra of pristine and Bi1–xCdxFe1–yEryO3 nanoparticles.
3.7. Dielectric Properties
Dielectric is a promising method for material characterization with possible applications in electrostrictive transducers, storage capacitors and actuators, etc. Hence, the dielectric constant (ε′), tangent loss (tanδ), and conductivity of Bi1 – xCdxFe1 – yEryO3 (x,y = 0.0, 0.05, 0.10, 0.15, 0.20, 0.25) NPs have been studied in the 20 Hz–0.04 GHz frequency range at room temperature.
3.7.1. Dielectric Constant
The dielectric constant is computed using the relation shown in eq 9.
| 9 |
where C and ε indicate the capacitance and dielectric constant, respectively, έ is a specified permittivity (8.85 × 10⁻¹² F/m), d is the pallet thickness, and A is the cross-sectional area.28Figure 9a displays the dielectric constant (ε′) in accordance with frequency. The dielectric constant of a material typically decreases with increasing frequency and reaches a constant value at higher frequencies. This behavior can be explained by the Maxwell–Wagner model, which describes space charge relaxation.29 and Koops’ theory30 can be employed to determine the dielectric constant of these samples. In this relation, periodic changes occur when field is applied. Therefore, it produces polarization, which consequently enhances the dielectric constant. Space charges are unable to keep up with the rapidly changing applied electric field at higher frequencies, which may decrease the dielectric constant at higher frequencies.5 The ionic, interfacial, electronic, and dipolar changes are responsible for polarization at low frequencies, which enhance the dielectric constant. Moreover, at high frequencies, multiple polarization contributions pass through, resulting in a decline in overall polarization. As depicted in Figure 9b, pristine BiFeO3 has relatively small values of dielectric and, by increasing the dopant content these values are going to be improved. This is because erbium doping causes oxygen vacancies in the system, causing electrons to be released and a proportion of Fe3+ ions to be converted to Fe2+ ions. Consequently, electron hopping between Fe3+ and Fe2+ ions occurs, resulting in an increase in polarization. The increment in dielectric constant could be associated with an increased level of Fe2+ ions. It is also revealed that there is a substantial relationship between the dielectric characteristics and the micro-structure of the Cd and Er replacement in ortho-ferrites.31 Consequently, variability in dielectric constant can be connected with variation in crystalline size of the sample by changing the dopant’s content. This promotes charge carrier hopping, and thus, the dielectric constant is ascertained to be high when crystallite size grows with increasing Cd and Er concentrations.
Figure 9.

(a). Dielectric constant vs log f. (b) Dielectric constant vs dopant content of pristine and Bi1–xCdxFe1–yEryO3 nanoparticles.
3.7.2. Dielectric Loss and Tangent Loss
Figure 10 shows the dielectric loss and tangent loss behavior of Bi1 – xCdxFe1 – yEryO3 depending on frequency (a and c). Tangent and dielectric loss reduced with increasing frequency and eventually became constant. As the dopant (Cd and Er) content increased, the dielectric and tangent loss decreased, which might be owing to few vacancies of oxygen in perovskite materials, which minimizes the hopping conduction mechanism and hinders the domain wall. It is evident that increasing the concentration of Cd and Er doping lowered the dielectric and tangent loss. Low leakage current is shown by low dielectric and tangent loss, which may be effective in radio and other higher-frequency materials.32
Figure 10.

(a, c) Dielectric and tangent loss as a function of frequency. (b, d) Dielectric and tangent loss vs dopant concentration of pristine and Bi1–xCdxFe1–yEryO3 nanoparticles.
3.7.3. Conductivity
Depending on frequency, AC conductivity is studied at 25 °C and the response is depicted in Figure 11. Electrical conduction in orthoferrites is connected with hole conduction from Fe4+ centers to adjacent Fe3+ sites, which is induced as a result of intrinsic discrepancies in RFeO3.33 The AC of a material has been shown to exhibit different trends with frequency, which can be attributed to the hopping of polarons. In materials with small hopping electron motions, the AC conductivity tends to increase with frequency, whereas in materials with higher electron hopping, the conductivity tends to decrease with frequency.34 According to this phenomenon, all samples exhibit their typical characteristics, and increasing frequency results in high AC conductivity. As per Figure 10, the electrical conduction behavior of each sample displays a linear trend, indicating that the low polaron conduction mechanism is dominant across the entire measurement range. Notably, the charge carriers are observed to be more prominent near the grain boundaries compared to the interior of the grains during the conduction process. At lower frequencies, charge hopping is less prevalent, but as the frequency increases, the grains become more conducive to charge hopping, leading to an increase in conductivity with frequency. Furthermore, as illustrated in Figure 10b, the concentration of dopants has a considerable effect on their conductivity. This can be attributed to a rise in the number of hopping of charge carriers as the Er concentration increased, resulting in higher conductivity.4
Figure 11.

(a) Frequency-dependent AC conductivity. (b) Conductivity vs dopant content pristine and Bi1–xCdxFe1–yEryO3 nanoparticles.
3.7.4. Resistivity
The influence of Cd and Er on electrical resistivity of Bi1 – xCdxFe1 – yEryO3 NPs was examined, as given in Figure 12. The electrical resistivity of Bi1 – xCdxFe1 – yEryO3 NPs was high at lower frequencies, reduced as the frequency increased, and then stayed constant at high frequency due to the doping result. This may be because of the hopping mechanism for substituted materials. Electron hopping in doped materials was decreased by the addition of Cd and Er, as well as conforming substitution of Bi and Fe host cations. The material’s resistivity decreased due to a decrease in electron hopping from Er2+ to Er3+, and this property is useful for such materials in microwave and electronic devices.5
Figure 12.

(a). Frequency-dependent resistivity. (b) Resistivity vs dopant content pristine and Bi1–xCdxFe1–yEryO3 nanoparticles.
3.8. Magnetic Properties
Figure 13a depicts the magnetic hysteresis loops of pristine and Cd2+–Er3+-substituted BFO recorded in a magnetic field of −5–5 kOe at 300 K. Magnetic energy loss characteristic of soft magnetic materials is demonstrated by a smart loop area within M–H loops. The parameters coercivity (Hc), remnant magnetization (Mr), and saturation magnetization (Ms) were obtained by M–E loops and are displayed in Table 3. Every sample exhibited typical and smart and hysteresis loops, demonstrating its soft ferro-magnetic nature.35 The Ms for pristine materials was obtained to be 9.949 emu/g, which increased from 11.98 to 21.80 emu/g with increasing dopant concentration. At the A site, the replacement of nonmagnetic Cd2+ (0 μB) for magnetic Bi2+ (4.5 μB) cations decreases Ms and the doping of high magnetic Er3+ (9.5 μB) for low magnetic Fe3+ (5 μB) at the opposite is responsible for magnetization, which is related to activity at the B site that is responsible for the total magnetization not changing the doped perovskite. However, in current findings, the magnetization slowly enhanced with doping, which might be due to the exchange between both sites’ cations that are accountable for magnetic parameter fluctuation.36 Similar to Ms, Mr and Hc also exhibit an upward trend in doping levels in substituted perovskites, which might be related to a reduction in spin-canting. Ms may also increase due to cationic dispersion and a disordered surface layer. Surface effect became minor as the particle size increased, potentially leading to an increase in Ms.37Figure 13b depicts Hc values, which follow the same trend as saturation magnetization; for undoped samples, this value was 0.1087 and gradually enhanced the dopant content, reaching a maximum 0.5223 kOe value for highly substituted materials. The rise in coercivity can be linked to variations in crystalline size in Cd-Er perovskites, which can be explained by the critical size, interface anisotropy, surface, and crystal structure domain. So as to minimize enormous magnetization energy, a crystallite, which is single-domain, will spontaneously break apart into a huge number of domains. The energy ratio before or after domain can be changed as √D,38 where D signifies crystallite size. As a result, as D decreases, the energy ratio decreases, implying that the crystallite chooses to remain in single-domain form for a relatively small D. Variance in the coercive field with average crystallite size in only the domain area is displayed in eq 10.39
| 10 |
where, h, g, and D denote coercivity, constant, and crystalline size, respectively. According to the aforesaid relationship, Hc increases as D increases. The investigational results are due to the fact that such high magnetization materials could have good photocatalytic property.6 The permeability of these materials may be enhanced by their high Ms, which is advantageous for microwave impedance coupling area absorption.40
Figure 13.

(a) M–H loops. (b) Magnetic behavior of pristine and Bi1–xCdxFe1–yEryO3 nanoparticles.
Table 3. Variation in Magnetic Parameters of Bi1–xCdxFe1–yEryO3 (x,y = 0.0–0.25) NPs as a Function of Dopant Content.
| doping content | composition | Ms × 10–2 (emu/g) | Hc (Oe) | Mr × 10–3 (emu/g) |
|---|---|---|---|---|
| 0 | BFO | 2.13 | 439.1 | 6 |
| 0.05 | BFOCE1 | 2.3 | 470 | 7 |
| 0.1 | BFOCE2 | 2.5 | 475.5 | 7.3 |
| 0.15 | BFOCE3 | 3.3 | 487 | 7.9 |
| 0.2 | BFOCE4 | 3.9 | 492 | 8 |
| 0.25 | BFOCE5 | 5 | 495 | 8.4 |
3.9. Electrochemical Property
The sludge of the prepared nanoparticles was combined with a Nafion binder and solvent to make working electrodes. The resulting mixture was enriched with nickel foam. The embellished electrodes were dried for 10 h at 60 °C. On the substrate, 0.003 g of the substance was placed.
The CV technique was used to investigate the as-prepared working electrodes. All of the working electrodes’ cyclic voltammograms were recorded using a potential window ranging from 0 to 0.5 V at different scan rates (10–100 mVs–1). The analysis of electrochemical reaction was carried out with a KOH (3 M) electrolyte at 25 °C. The CV curves showed noticeable oxidation and reduction peaks at scan rates thought to be indicative of both non-faradaic and faradaic reactions to accumulate charge, conferring the pseudo-capacitive nature to BFOCE nanoparticles. The dopant’s content (x,y) of electrode of Bi1 – xCdxFe1 – yEryO3 NPs is 0.20. The sample has a somewhat bigger CV loop area than BiFeO3 and Bi1 – xCdxFe1 – yEryO3 NPs with an electrode composition of x,y = 0.10 (Figure 14a,b) and maintains higher EC caused by Cd and Er ion doping (Figure 14c). The Csp (specific capacitance) of all prepared electrodes was computed using eq 11.41
| 11 |
Figure 14.

CV analysis, (a) BiFeO3, (b) Bi1–xCdxFe1–yEryO3 (x,y = 0.10), and (c) Bi1–xCdxFe1–yEryO3 (x,y = 0.20).
In eq 11 and υ, ΔV and m are the scan rate, potential window, and mass of electrode (g), correspondingly. Owing to the harmonious effect of Cd, Fe, and Er ions (x,y = 0.2), the electrode with the higher dopant concentration (x,y = 0.2) has Csp values of 429 F g–1 as related to BiFeO3 (135 F g–1) and the electrode with the lowest dopants content has specific capacitance (329 F g–1). Figure 15 depicts the reversal effect of scan rate on all Csp of electrodes considered. In comparison to higher scan rates, the Csp values of all the working electrodes improved at lower scan rates due to favorable interactions between ions of the electrolyte and electrode material.
Figure 15.

Specific capacitance of electrode vs scan rate of pristine and Bi1–xCdxFe1–yEryO3 nanoparticles.
3.10. Electrical Property
The electrical characteristics of Cd2+- and Er3+-doped BiFeO3 ferrites were investigated using two probes, measuring current–voltage (I–V) in the 302–820 K temperature range. Findings of electrical resistivity (DC) vs 1000/T are shown in Figure 16. It can be seen that the Curie temperature in this case was calculated from kink as displayed in (ρDC) vs 1000/T graphs, which increases with increasing Cd2+ and Er3+ doping, rising to 353, 443, and 413 K, for x,y = 0.0, 0.1, and 0.25 respectively. It can be seen that the resistivity declines with increasing temperature in the ferromagnetic zone; however, it changes to the opposite in the paramagnetic region. The decrease in resistivity at higher temperature demonstrates the semiconducting nature of soft ferrites. The “ρDC” at room temperature for all samples are 1.36 × 10⁵, 3.25 × 10⁸, and 1.62 × 10⁸ Ω·cm for x,y = 0.0, 0.1, and 0.25, respectively. The sample with x,y = 0.25 has maximum resistivity, making it ideal to be utilized with high-frequency electrical devices.42 Using the following relation, activation energy (E) is computed by taking the slope of log ρ vs 1000/T43 (eq 12).
| 12 |
where kB is the Boltzmann constant (8.602 × 10⁻⁵ eV/K). The behavior of activation energy (ΔE) and calculated values for fabricated NPs are displayed in Figure 16b. The activation energy (ΔE) decreased with increasing dopant (Cd2+ and Er3+) content and has a maximum value for the undoped BiFeO3 sample. The conductivity of ferrites based on activation energy and non-linearity in ΔE with introduction of dopants may be attributed to the impact of spin disordering. The overall large-resistivity variations obtained in fabricated samples develop them potentially useful in telecommunication electronics.44 The drift mobility was computed using eq 13.
| 13 |
where e is the charge on the electron, ρDC is the electrical resistance, and η is the concentration of the charge carrier. η can be calculated using eq 14.
| 14 |
where PFe is the number of Fe atoms in the composition formula, NA is the Avogadro number (6.02 × 10²³ mol–1), ρb is the bulk density, and M is the molecular mass of ferrite nanoparticles. The drift mobility (μd) of samples has values 1.0 × 10⁻¹¹ cm2 V–1 s–1 (x,y = 0), 1.7 × 10⁻¹¹ cm2 V–1 s–1 (x,y = 1.0), and 2.189 × 10⁻⁸ cm2 V–1 s–1 (x,y = 0.25). This is obvious that samples of higher electrical resistivity have lower drift mobility values, and vice versa, as electrical resistivity and drift mobility have a contrasting relationship.45
Figure 16.

1000/T vs log of resistivity of pristine and Bi1–xCdxFe1–yEryO3 nanoparticles.
3.11. BET Analysis
BiFeO3 and Bi1–xCdxFe1–yEryO3 NP surface areas were subjected to BET analysis utilizing nitrogen (N2) at 78 K with desorption/adsorption isotherms (Figure 17a,b). The mesoporous nature of the structure of BiFeO3 and Bi1–xCdxFe1–yEryO3 NPs is demonstrated by the hysteresis loop (0.4 to 1.0, relative pressure). BiFeO3 and Bi1–xCdxFe1–yEryO3 NPs have BET surface areas of 9.8 and 12.5 m2/g, respectively. The BET findings show that Cd and Er doping in BiFeO3 enhanced its surface area, resulting in the creation of a porous structure. This may have improved the doped sample’s photocatalytic activity as well as the catalysts’ active sites.
Figure 17.

BET analysis of (a) undoped BiFeO3 and (b) doped Bi1–xCdxFe1–yEryO3 nanoparticles.
3.12. Optical Property
To evaluate the optical performance of pristine and substituted BFO compositions, UV–vis spectra were obtained in the 220–800 nm range (Figure 18a). The absorption edge of pure BFO was observed to be around 550 nm. Moreover, the absorption tail of the doped BFO samples was moved to the visible region, showing a red shift and indicating strong visible-active absorption of substituted NPs. The observed red shift in spectra could be owing to the correlation among the 3d orbitals of Fe3+ and Er3+, which generates intra-energy bandgap states.4 Furthermore, charge transfer transitions between the valence and conduction bands of the substituting elements and BiFeO3 could be attributed to this shifting.46 The bandgap energy (Eg) was measured by Tauc’s plot,47 as shown in eq 15.
| 15 |
where α, hν, and A signify the absorption coefficient, light energy in eV, and proportionality constant, respectively. The Eg for pure BFO was determined to be 2.11 eV; however, for x,y = 0.0–0.25, a decreasing behavior in the bandgap, i.e., 2.11–1.87 eV, was observed (Figure 18b). This narrowing of the bandgap could be because of the following factors: the generation of energy band levels because of doping in the BFO lattice, which happened in the center of VB and CB, resulting in a decrease in energy bandgap and charge transfer transition, such as excitation of 3d orbital es– of Er3+ to the BFO conduction band.
Figure 18.

(a) UV–vis spectra. (b) Tauc plot of pristine and Bi1–xCdxFe1–yEryO3 nanoparticles.
3.13. Photocatalytic Studies
CV was used as a pollutant to study the photo-degradation activities of BFO and Bi1 – xCdxFe1 – yEryO3 nanoparticles and response thus observed, which are depicted in Figure 19. BiFeO3 has low photo-degradation efficiency; thus, doping with cadmium and erbium was used to improve it. There are three steps involved in the photo-degradation process. The first stage is the photon’s absorption with higher energy than the photocatalyst’s band-gap energy. The production and transport of photoactive species, i.e., electrons/holes, take place on the surface of the catalyst. The third stage involves redox reactions on the photocatalyst surface. Because of the capacity of dopant ions to increase photo-response on the catalyst surface, the Bi1 – xCdxFe1 – yEryO3 photocatalyst demonstrates a better reaction to photocatalytic degradation than BFO. This improved removal efficacy was attributed to more active sites for maximal adsorption and reduced rate of photo-generated species recombination (electrons and holes).
Figure 19.

(a–f) UV–vis spectra of CV using various concentrations of dopant content (x,y = 0.0–0.25).
3.13.1. Kinetics Study
The photocatalytic reaction was clearly described by studying kinetics.67 The kinetic analysis was examined using eq 16.
| 16 |
The kinetic graphs of CV dye by the photocatalysts are shown in Figure 20. The percentage of CV degradation by the BFO and Bi1 – xCdxFe1 – yEryO3 photocatalysts was 53.29 and 84.41%, respectively. The rate constants for the degradation reaction with BFO and Bi1 – xCdxFe1 – yEryO3 were determined. The rate constants of Bi1 – xCdxFe1 – yEryO3 (x,y = 0.0, 0.05, 0.10, 0.15, 0.20, and 0.25) were 0.0057, 0.0067, 0.0079, 0.01, 0.012, and 0.0135 (min–1), respectively. It was observed that Bi1 – xCdxFe1 – yEryO3 (x,y = 0.25) degraded CV more efficiently than other photocatalysts. The elimination of dye is 57.75% by BFO (4.41% adsorption + 53.29% degradation) and 87.36% by BFOCE 5 (2.95% adsorption + 84.41% degradation). The efficiency was compared with reported similar studies, and it was found that Bi1 – xCdxFe1 – yEryO3 showed promising photocatalytic activity (Table 4).
Figure 20.

(a, b) A/Ao vs time plot of CV dye degradation. (c) Rate constants for photocatalysts. (d) Percentage degradation of CV via degradation and adsorption.
Table 4. A Comparative Analysis of Photocatalytic Activity-Related Materials to the Present Study.
3.14. Photocatalytic Recyclability Study
The photo-stability of the photocatalyst is a very significant quality to consider in terms of practical applications of photocatalyst.7Figure 21 displays the results of reusability experiments performed under the same experimental circumstances used above to evaluate the photo-stability of the BFOCE photo-catalyst. BFOCE clearly degraded 84% of the CV dye in the first cycle run; however, after four cycle runs, just an 8% drop in photo-degradation of CV was observed due to particle accumulation, loss of surface area, and photo-catalyst leaching. This suggests that the BFOCE photo-catalyst stays stable after seven consecutive reuse cycles, with just a little decrease in photocatalytic effectiveness.
Figure 21.

(a) Time vs At/Ao plot of four cycles of CV degradation by Bi1 – xCdxFe1 – yEryO3. (b) CV degradation (%) using BFOCE for four different cycles.
3.15. Stability of Photocatalysts
XRD measurements taken before and after photo-catalytic tests indicate that the XRD spectra of doped and un-doped BFO did not change appreciably (Figure 22a). These results demonstrate that the doped photo-catalyst is highly photo-stable and resistant to photo-corrosion. The enhanced photo-activity and reduced photo-corrosion are the result of the quick transfer of electrons and efficient segregation of charge carriers over the heterojunction.6 As a result, the BFOCE catalyst for CV degradation will not result in production of any secondary pollutants. The morphology of the sample after photo-catalysis and particle agglomeration condition differs significantly from the morphology of the material before photo-catalysis, showing slight aggregation of the material (Figure 22b). Consequently, we presume that photo-catalysis slightly altered the morphology of the sample. The SEM analysis showed slight material agglomeration. The material, however, persisted in its spherical form and also aggregate information may affect the catalytic activity of the material.
Figure 22.

(a) XRD spectra of doped and un-doped BFO after photocatalysis. (b) SEM micrographs of pristine and Bi1–xCdxFe1–yEryO3 nanoparticles after photocatalysis.
3.16. Scavenging Studies
The trapping experiment was executed to investigate most proficient species linked in the process of photo-degradation of dye under visible light. Various sacrificial agents were utilized in a PCA to examine the function of electrons, hydroxyl radicals, and holes. EDTA, 2-propanol, and AgNO3 were used as the trapping agents for electrons, OH*, and holes, respectively. Figure 23 depicts kinetic graphs for CV photocatalytic degradation with scavengers. Scavenging tests showed that 2-propanol, ethylenediaminetetraacetic acid (EDTA), and silver nitrate considerably reduced the degradation rate, indicating that hydroxyl radicals, electrons, and holes are primary photoactive species associated in CV photo-degradation. In comparison, •OH radicals are the most important contributors in photo-degradation, and they are the primary active species in photo-degradation of CV by Bi1 – xCdxFe1 – yEryO3, while electrons play a minor role. The active species contributing in the photo-degradation process were listed in the following order: electrons < holes < hydroxyl radicals.
Figure 23.

(a) A/Ao vs time plot of crystal violet dye photo-degradation. (b) Kinetic plot. (c) Percentage degradation. (d) Rate constant of crystal violet for various scavengers.
3.17. Plausible Mechanism
In light of the research provided above, a possible photocatalytic mechanism for Bi1–xCdxFe1–yEryO3 is illustrated in Figure 24. From the DFT study, we can calculate the VB and CB potentials at the point of zero charge using eqs. 17 and 18.52
| 17 |
| 18 |
where EVB and ECB are the edge potentials of the VB and CB, separately. X is the geometric mean of the electronegativity of constituent atoms of the semiconducting material, and Eg is the energy bandgap, while Ee is the hydrogen scale (4.5 eV) value for free electron energy. When BiFeO3 is subjected to light with enough energy (>2.5 eV), photo-generated electrons (e–) in the low energy state get excited and jump to a high energy state, whereas photo-generated holes (h+) remain in the lower energy state. The electrons stay for a short time and recombine with photogenerated holes, which affect the efficiency.53 The electrical interaction between dopants in the BFO structure introduces a change in CB edge, which in turn decreases the bandgap of BFOCE from 2.11 to 1.87 eV. This facilitates the production of excitons at lower energies. As was mentioned before, substitution leads to the formation of shallow traps in BFOCE. The dopants make shallow traps that capture the excited electrons from the VB of BFOCE, leaving h+ in the VB. Since the VB potential of BFOCE is greater than (1.99 eV), h+ on the VB of BFOCE can act as an oxidizer. Furthermore, h+ can directly target CV molecules to compete with the degradation process due to the proximity of the HOMO level of CV and NHE.62 Although photogenic electrons are capable of reducing O2 to –•O2, the CB potential of BFO and BFOCE semiconductors is less than the conventional oxygen reduction potential (−0.046 eV); hence, the sufficient potential cannot be generated on CB to reduce O2 to –•O2.16,54 On the other hand, the CB of BFOSG does not possess a sufficient amount of negative potential for conversion (−0.046 eV).55 On the contrary, holes created in the valence band of BFOCE have a sufficiently positive potential (EVB = 2.49 eV) to carry out either direct oxidation of dyes or conversion of H2O and –OH to •OH (H2O/–OH = +1.99 eV versus NHE and –OH/•OH = +2.27 eV versus NHE).54 Consequently, •OH then breaks down the dyes into CO2 and H2O. Hence, it is fair to classify BFOCE as a photocatalyst with significant oxidation capability.56 The simultaneous presence of dopants effectively prevents recombination of the e–/h+ couples, extending the lifetime of photoactive species.4,5,54,57 The photo-generated species route for CV degradation is summarized in eqs 19–29.
| 19 |
| 20 |
| 21 |
| 22 |
| 23 |
| 24 |
| 25 |
| 26 |
| 27 |
| 28 |
| 29 |
Figure 24.

Schematic presentation of the CV dye degradation mechanism using Bi1–xCdxFe1–yEryO3 nanoparticles.
4. Conclusions
The Cd- and Er-doped BiFeO3 NPs were synthesized by the micro-emulsion approach, and their various properties were investigated based on doping contents. A distorted rhombohedral crystalline phase with an average crystalline size in the range of 29–32 nm was observed. With the content of dopants (Cd and Er), the PL intensity of the substituted NMs was observed to decline. On raising the doping content, ferroelectric loops with substituted compositions displayed improved polarization. Attributable to synergistic effects of the dopants (Cd and Er), the doped material has a lower charge transfer resistance and a larger specific capacitance (429 F g–1) than pristine BiFeO3 (135 F g–1). A narrowing of the bandgap may be responsible for the increase in AC conductivity with doping concentration. The Bi1 – xCdxFe1 – yEryO3 photocatalyst displayed better efficiency than bare BFO in degradation of CV dye under visible irradiation. Recycling experiments revealed that Bi1 – xCdxFe1 – yEryO3 are quite reliable, enhancing its potential for treatment effluents containing dyes under solar light irradiation.
Acknowledgments
The authors express their gratitude to Princess Nourah bint Abdulrahman University Researchers Supporting Project number (PNURSP2023R11), Princess Nourah bint Abdulrahman University, Riyadh, Saudi Arabia.
The authors declare no competing financial interest.
References
- Abdullah; Khan U. A.; Khan S.; Ahmed S. J.; Khan N. U.; Ullah H.; Naz S.; Farhat L. B.; Amami M.; Tirth V.; Zaman A. Structural, Electronic and Optical Properties of Titanium Based Fluoro-Perovskites MTiF3 (M= Rb and Cs) via Density Functional Theory Computation. ACS Omega 2022, 47662. 10.1021/acsomega.2c04631. [DOI] [PMC free article] [PubMed] [Google Scholar]
- Lone I. H.; Khan H.; Jain A. K.; Ahmed J.; Ramanujachary K. V.; Ahmad T. Metal–Organic Precursor Synthesis, Structural Characterization, and Multiferroic Properties of GdFeO3 Nanoparticles. ACS Omega 2022, 7, 33908–33915. 10.1021/acsomega.2c02809. [DOI] [PMC free article] [PubMed] [Google Scholar]
- Zeghoud S.; Hemmami H.; Ben Seghir B.; Ben Amor I.; Kouadri I.; Rebiai A.; Messaoudi M.; Ahmed S.; Pohl P.; Simal-Gandara J. A review on biogenic green synthesis of ZnO nanoparticles by plant biomass and their applications. Mater. Today Commun. 2022, 33, 104747 10.1016/j.mtcomm.2022.104747. [DOI] [Google Scholar]
- Bibi I.; Qayyum M.; Ata S.; Majid F.; Kamal S.; Alwadai N.; Sultan M.; Rehman F.; Iqbal S.; Iqbal M. Effect of dopant on ferroelectric, dielectric and photocatalytic properties of chromium-doped cobalt perovskite prepared via micro-emulsion route. Results Phys. 2021, 20, 103726 10.1016/j.rinp.2020.103726. [DOI] [Google Scholar]
- Bibi I.; Nazeer Z.; Majid F.; Ata S.; Hakami O.; Talib I.; Iqbal M.; Fatima M.; Alfryyan N.; Alwadai N. Structural, electrochemical and photocatalytic properties of zinc doped Co1-xZn1.5xFeO3 perovskites prepared by auto combustion sol–gel approach. Results Phys. 2021, 26, 104392 10.1016/j.rinp.2021.104392. [DOI] [Google Scholar]
- Bibi I.; Maqbool H.; Iqbal S.; Majid F.; Kamal S.; Alwadai N.; Iqbal M. La1-xGdxCr1-yNiyO3 perovskite nanoparticles synthesis by micro-emulsion route: Dielectric, magnetic and photocatalytic properties evaluation. Ceram. Int. 2021, 47, 5822–5831. 10.1016/j.ceramint.2020.11.033. [DOI] [Google Scholar]
- Aamir M.; Bibi I.; Ata S.; Majid F.; Kamal S.; Alwadai N.; Sultan M.; Iqbal S.; Aadil M.; Iqbal M. Graphene oxide nanocomposite with Co and Fe doped LaCrO3 perovskite active under solar light irradiation for the enhanced degradation of crystal violet dye. J. Mol. Liq. 2021, 114895 10.1016/j.molliq.2020.114895. [DOI] [Google Scholar]
- Kan D.; Pálová L.; Anbusathaiah V.; Cheng C. J.; Fujino S.; Nagarajan V.; Rabe K. M.; Takeuchi I. Universal behavior and electric-field-induced structural transition in rare-earth-substituted BiFeO3. Adv. Funct. Mater. 2010, 20, 1108–1115. 10.1002/adfm.200902017. [DOI] [Google Scholar]
- Ukpaka C. P.; Ugiri A. C. Biodegradation kinetics of petroleum hydrocarbon in soil environment using Mangnifera indica seed biomass: A mathematical approach. Chem. Int. 2022, 8, 77–88. [Google Scholar]
- Jalal G.; Abbas N.; Deeba F.; Butt T.; Jilal S.; Sarfraz S. Efficient removal of dyes in textile effluents using aluminum-based coagulants. Chem. Int. 2021, 7, 197–207. [Google Scholar]
- Elsherif K. M.; El-Dali A.; Alkarewi A. A.; Mabrok A. Adsorption of crystal violet dye onto olive leaves powder: Equilibrium and kinetic studies. Chem. Int. 2021, 7, 79–89. [Google Scholar]
- Awwad A. M.; Amer M. A. Adsorption of Pb(II), Cd(II), and Cu(II) ions onto SiO2/kaolinite/Fe2O3 composites: modeling and thermodynamics properties. Chem. Int. 2022, 8, 95–100. [Google Scholar]
- Awwad A. M.; Shammout M. W.; Amer M. W. Fe(OH)3/kaolinite nanoplatelets: Equilibrium and thermodynamic studies for the adsorption of Pb (II) ions from aqueous solution. Chem. Int. 2021, 7, 90–102. [Google Scholar]
- Minas F.; Chandravanshi B. S.; Leta S. Chemical precipitation method for chromium removal and its recovery from tannery wastewater in Ethiopia. Chem. Int. 2017, 3, 392–405. [Google Scholar]
- Djehaf K.; Bouyakoub A. Z.; Ouhib R.; Benmansour H.; Bentouaf A.; Mahdad A.; Moulay N.; Bensaid D.; Ameri M. Textile wastewater in Tlemcen (Western Algeria): Impact, treatment by combined process. Chem. Int. 2017, 3, 414–419. [Google Scholar]
- Wang X.; Ren Y.; Li Y.; Zhang G. Fabrication of 1D/2D BiPO4/g-C3N4 heterostructured photocatalyst with enhanced photocatalytic efficiency for NO removal. Chemosphere 2022, 287, 132098 10.1016/j.chemosphere.2021.132098. [DOI] [PubMed] [Google Scholar]
- Wang X.; Wang Z.; Li Y.; Wang J.; Zhang G. Efficient photocatalytic CO2 conversion over 2D/2D Ni-doped CsPbBr3/Bi3O4Br Z-scheme heterojunction: Critical role of Ni doping, boosted charge separation and mechanism study. Appl. Catal., B 2022, 319, 121895 10.1016/j.apcatb.2022.121895. [DOI] [Google Scholar]
- Asefi N.; Masoudpanah S.; Hasheminiasari M. Photocatalytic performances of BiFeO3 powders synthesized by solution combustion method: The role of mixed fuels. Mater. Chem. Phys. 2019, 228, 168–174. 10.1016/j.matchemphys.2019.02.059. [DOI] [Google Scholar]
- Chen Z.; Li Y.; Wu Y.; Hu J. Hydrothermal synthesis and mechanism and property study of La-doped BiFeO3 crystallites. J. Mater. Sci.: Mater. Electron. 2012, 23, 1402–1408. 10.1007/s10854-011-0605-5. [DOI] [Google Scholar]
- Lan S.; Yu C.; Sun F.; Chen Y.; Chen D.; Mai W.; Zhu M. Tuning piezoelectric driven photocatalysis by La-doped magnetic BiFeO3-based multiferroics for water purification. Nano Energy 2022, 93, 106792 10.1016/j.nanoen.2021.106792. [DOI] [Google Scholar]
- Yotburut B.; Yamwong T.; Thongbai P.; Maensiri S. Synthesis and characterization of coprecipitation-prepared La-doped BiFeO3 nanopowders and their bulk dielectric properties. Jpn. J. Appl. Phys. 2014, 53, 06JG13 10.7567/JJAP.53.06JG13. [DOI] [Google Scholar]
- Ishaq B.; Murtaza G.; Sharif S.; Azhar Khan M.; Akhtar N.; Will I. G.; Saleem M.; Ramay S. M. Investigating the effect of Cd-Mn co-doped nano-sized BiFeO3 on its physical properties. Results Phys. 2016, 6, 675–682. 10.1016/j.rinp.2016.09.018. [DOI] [Google Scholar]
- Kumar K. S.; Ramanadha M.; Sudharani A.; Ramu S.; Vijayalakshmi R. Structural, magnetic, and photoluminescence properties of BiFeO3: Er-doped nanoparticles prepared by sol-gel technique. J. Supercond. Novel Magn. 2019, 32, 1035–1042. 10.1007/s10948-018-4789-2. [DOI] [Google Scholar]
- Smee J. J.; Epps J. A.; Ooms K.; Bolte S. E.; Polenova T.; Baruah B.; Yang L.; Ding W.; Li M.; Willsky G. R.; Cour A. .; Anderson O. P.; Crans D. C. Chloro-substituted dipicolinate vanadium complexes: synthesis, solution, solid-state, and insulin-enhancing properties. J. Inorg. Biochem. 2009, 103, 575–584. 10.1016/j.jinorgbio.2008.12.015. [DOI] [PubMed] [Google Scholar]
- Gupta S.; Tomar M.; Gupta V. Raman spectroscopy of nanocrystalline Mn-doped BiFeO3 thin films. J. Exp. Nanosci. 2013, 8, 261–266. 10.1080/17458080.2012.666808. [DOI] [Google Scholar]
- Yang Y.; Sun J.; Zhu K.; Liu Y.; Wan L. Structure properties of BiFeO 3 films studied by micro-Raman scattering. J. Appl. Phys. 2008, 103, 093532 10.1063/1.2913198. [DOI] [Google Scholar]
- Soni K.; Yadav E.; Harisankar S.; Mavani K. Influence of Ce doping and thickness on the structure and non-Fermi liquid behavior of LaNiO3 thin films. J. Phys. Chem. Solids 2020, 141, 109398 10.1016/j.jpcs.2020.109398. [DOI] [Google Scholar]
- Kaur T.; Kumar S.; Bhat B. H.; Want B.; Srivastava A. Effect on dielectric, magnetic, optical and structural properties of Nd–Co substituted barium hexaferrite nanoparticles. Appl. Phys. A: Mater. Sci. Process. 2015, 119, 1531–1540. 10.1007/s00339-015-9134-z. [DOI] [Google Scholar]
- Prodromakis T.; Papavassiliou C. Engineering the Maxwell–Wagner polarization effect. Appl. Surf. Sci. 2009, 255, 6989–6994. 10.1016/j.apsusc.2009.03.030. [DOI] [Google Scholar]
- Koops C. On the dispersion of resistivity and dielectric constant of some semiconductors at audiofrequencies. Phys. Rev. 1951, 83, 121. 10.1103/PhysRev.83.121. [DOI] [Google Scholar]
- Asif M.Study of Rare Earth Metals Substituted YFeO3 Ceramics. 2021.
- Nazeer Z.; Bibi I.; Majid F.; Kamal S.; Ibrahim S. M.; Iqbal M. Energy band gap tuning of Ba1-xZnxFe12-yCrYO19 doped with Cr and Zn ions to enhance the optical, dielectric, ferroelectric, and photocatalytic properties. Opt. Mater. 2022, 125, 112090 10.1016/j.optmat.2022.112090. [DOI] [Google Scholar]
- Jacob K.; Rajitha G.; Dasgupta N.. Electrical conductivity of Ca-doped YFeO 3. 2012.
- Zarrin N.; Husain S. Study of structural, morphological, optical, and dielectric behaviour of zinc-doped nanocrystalline lanthanum chromite. Appl. Phys. A: Mater. Sci. Process. 2018, 124, 1–13. 10.1007/s00339-018-2139-7. [DOI] [Google Scholar]
- Khafagy R. M. Synthesis, characterization, magnetic and electrical properties of the novel conductive and magnetic Polyaniline/MgFe2O4 nanocomposite having the core–shell structure. J. Alloys Compd. 2011, 509, 9849–9857. 10.1016/j.jallcom.2011.07.008. [DOI] [Google Scholar]
- Deshmukh S.; Humbe A. V.; Kumar A.; Dorik R.; Jadhav K. Urea assisted synthesis of Ni1– xZnxFe2O4 (0≤ x≤ 0.8): Magnetic and Mössbauer investigations. J. Alloys Compd. 2017, 704, 227–236. 10.1016/j.jallcom.2017.01.176. [DOI] [Google Scholar]
- Kumar S.; Singh V.; Aggarwal S.; Mandal U. K.; Kotnala R. Synthesis of nanocrystalline Ni0. 5Zn0. 5Fe2O4 ferrite and study of its magnetic behavior at different temperatures. Mater. Sci. Eng., B 2010, 166, 76–82. 10.1016/j.mseb.2009.10.009. [DOI] [Google Scholar]
- George M.; John A. M.; Nair S. S.; Joy P. A.; Anantharaman M. R. Finite size effects on the structural and magnetic properties of sol–gel synthesized NiFe2O4 powders. J. Magn. Magn. Mater. 2006, 302, 190–195. 10.1016/j.jmmm.2005.08.029. [DOI] [Google Scholar]
- Cullity B. D.; Graham C. D.. Introduction to magnetic materials. John Wiley & Sons: 2011. [Google Scholar]
- Abbas W.; Ahmad I.; Kanwal M.; Murtaza G.; Ali I.; Azhar Khan M.; Akhtar M. N.; Ahmad M. Structural and magnetic behavior of Pr-substituted M-type hexagonal ferrites synthesized by sol–gel autocombustion for a variety of applications. J. Magn. Magn. Mater. 2015, 374, 187–191. 10.1016/j.jmmm.2014.08.029. [DOI] [Google Scholar]
- Ajmal S.; Bibi I.; Majid F.; Ata S.; Kamran K.; Jilani K.; Nouren S.; Kamal S.; Ali A.; Iqbal M. Effect of Fe and Bi doping on LaCoO3 structural, magnetic, electric and catalytic properties. J. Mater. Res. Technol. 2019, 8, 4831–4842. 10.1016/j.jmrt.2019.08.029. [DOI] [Google Scholar]
- Mammo T. W.; Murali N.; Sileshi Y. M.; Arunamani T. Studies of structural, morphological, electrical, and magnetic properties of Mg-substituted Co-ferrite materials synthesized using sol-gel autocombustion method. Phys. B 2017, 523, 24–30. 10.1016/j.physb.2017.08.013. [DOI] [Google Scholar]
- Aslam A.; Morley N. A.; Amin N.; Arshad M. I.; un Nabi M. A.; Ali A.; Mahmood K.; Bibi A.; Iqbal F.; Hussain S.; Hussain S.; Jamil Y. Study of structural, optical and electrical properties of La3+ doped Mg0. 25 Ni0. 15 Cu0. 25 Co0. 35 Fe2-x Lax O4 spinel ferrites. Phys. B 2021, 602, 412565 10.1016/j.physb.2020.412565. [DOI] [Google Scholar]
- Arshad M. I.; Hasan M.; Rehman A. U.; Akhtar M.; Amin N.; Mahmood K.; Ali A.; Trakoolwilaiwan T.; Thanh N. T. K. Structural, optical, electrical, dielectric, molecular vibrational and magnetic properties of La3+ doped Mg–Cd–Cu ferrites prepared by Co-precipitation technique. Ceram. Int. 2022, 48, 14246–14260. 10.1016/j.ceramint.2022.01.313. [DOI] [Google Scholar]
- Ajmal M.; Maqsood A. Influence of zinc substitution on structural and electrical properties of Ni1– xZnxFe2O4 ferrites. Mater. Sci. Eng., B 2007, 139, 164–170. 10.1016/j.mseb.2007.02.004. [DOI] [Google Scholar]
- Ghafoor A.; Bibi I.; Majid F.; Kamal S.; Ata S.; Nazar N.; Iqbal M.; Raza M. A.; Almoneef M. M. Ce and Fe doped LaNiO3 synthesized by micro-emulsion route: Effect of doping on visible light absorption for photocatalytic application. Mater. Res. Express 2021, 8, 085009 10.1088/2053-1591/ac1aea. [DOI] [Google Scholar]
- Li Y.; Yao S.; Wen W.; Xue L.; Yan Y. Sol–gel combustion synthesis and visible-light-driven photocatalytic property of perovskite LaNiO3. J. Alloys Compd. 2010, 491, 560–564. 10.1016/j.jallcom.2009.10.269. [DOI] [Google Scholar]
- Bibi I.; Muneer M.; Iqbal M.; Alwadai N.; Almuqrin A. H.; Altowyan A. S.; Alshammari F. H.; Almuslem A. S.; Slimani Y. Effect of doping on dielectric and optical properties of barium hexaferrite: Photocatalytic performance under solar light irradiation. Ceram. Int. 2021, 47, 31518–31526. 10.1016/j.ceramint.2021.08.030. [DOI] [Google Scholar]
- Saravan R. S.; Muthukumaran M.; Mubashera S.; Abinaya M.; Prasath P. V.; Parthiban R.; Mohammad F.; Oh W. C.; Sagadevan S. Evaluation of the photocatalytic efficiency of cobalt oxide nanoparticles towards the degradation of crystal violet and methylene violet dyes. Optik 2020, 207, 164428 10.1016/j.ijleo.2020.164428. [DOI] [Google Scholar]
- Sathiyavimal S.; Vasantharaj S.; Shanmugavel M.; Manikandan E.; Nguyen-Tri P.; Brindhadevi K.; Pugazhendhi A. Facile synthesis and characterization of hydroxyapatite from fish bones: Photocatalytic degradation of industrial dyes (crystal violet and Congo red). Prog. Org. Coat. 2020, 148, 105890 10.1016/j.porgcoat.2020.105890. [DOI] [Google Scholar]
- Priya G. H.; Shaly A. A.; Linet J. M. Effect of Zn variation in TiO2/ZnS nanocomposite on photocatalysis for the degradation of the hazardous crystal violet dye. J. Mater. Sci.: Mater. Electron. 2021, 32, 5790–5802. 10.1007/s10854-021-05300-2. [DOI] [Google Scholar]
- Mukherjee A.; Chakrabarty S.; Kumari N.; Su W.-N.; Basu S. Visible-light-mediated electrocatalytic activity in reduced graphene oxide-supported bismuth ferrite. ACS Omega 2018, 3, 5946–5957. 10.1021/acsomega.8b00708. [DOI] [PMC free article] [PubMed] [Google Scholar]
- Liu B.; Bie C.; Zhang Y.; Wang L.; Li Y.; Yu J. Hierarchically porous ZnO/g-C3N4 S-scheme heterojunction photocatalyst for efficient H2O2 production. Langmuir 2021, 37, 14114–14124. 10.1021/acs.langmuir.1c02360. [DOI] [PubMed] [Google Scholar]
- Li W.; Wang Z.; Li Y.; Ghasemi J. B.; Li J.; Zhang G. Visible-NIR light-responsive 0D/2D CQDs/Sb2WO6 nanosheets with enhanced photocatalytic degradation performance of RhB: Unveiling the dual roles of CQDs and mechanism study. J. Hazard. Mater. 2022, 424, 127595 10.1016/j.jhazmat.2021.127595. [DOI] [PubMed] [Google Scholar]
- Wang Y.; Wang K.; Wang J.; Wu X.; Zhang G. Sb2WO6/BiOBr 2D nanocomposite S-scheme photocatalyst for NO removal. J. Mater. Sci. Technol. 2020, 56, 236–243. 10.1016/j.jmst.2020.03.039. [DOI] [Google Scholar]
- Iqbal S.; Bibi I.; Majid F.; Kamal S.; Alwadai N.; Iqbal M. Band gap tuning by Gd and Fe doping of LaNiO3 to boost solar light harvesting for photocatalytic application: A mechanistic approach. Opt. Mater. 2022, 124, 111962 10.1016/j.optmat.2021.111962. [DOI] [Google Scholar]
- Ren Y.; Li Y.; Wu X.; Wang J.; Zhang G. S-scheme Sb2WO6/g-C3N4 photocatalysts with enhanced visible-light-induced photocatalytic NO oxidation performance. Chin. J. Catal. 2021, 42, 69–77. 10.1016/S1872-2067(20)63631-2. [DOI] [Google Scholar]