

Abstract

Exemestane (EXE), an irreversible aromatase inhibitor, is employed as a therapy for hormone-dependent breast cancer. Several studies have also established the budding effects of genistein (GEN) in various types of cancer such as breast, prostate, as well as skin due to its feeble estrogenic and anti-estrogenic properties. Considering the promising benefits of GEN, it was combined with EXE to accomplish superior therapeutic efficiency with fewer side effects. The quantification of the exact concentration of EXE and GEN when delivered as a combination would be required for which HPLC method was developed and validated. For this purpose, the C18 ODS column having dimensions of 150 × 4.6 mm, 5 μm, using mobile phase A as methanol:water (35:15, v/v), with formic acid (0.01%), and B as acetonitrile (in the ratio of A:B––30:70 v/v) at a flow rate of 1 mL/min was commonly used. The Box–Behnken design was chosen as our experimental model, and the interactions among the independent and dependent variables were analyzed. Parameters like linearity, system suitability, specificity, precision (intra- and interday), robustness, ruggedness, LOD (limit of detection), and LOQ (limit of quantification) were selected for the validation of our proposed method. EXE and GEN were eluted individually at 245 and 270.5 nm, respectively, while both of the agents were determined simultaneously at 256 nm, showing retention time as 2.10 and 1.67 min, respectively, and the calibration plot was observed to be linear in the range of 5–110 μg/mL. Hence, the method that we developed and validated was found to be suitable for the identification of both the drugs simultaneously in combination and in our in-house-developed nanoformulation.
1. Introduction
Even though there have been momentous developments in the treatment of breast cancer, about 25 % of women with breast cancer die from this ailment. Over the precedent years, breast cancer has become a major health problem globally. Reducing estrogen levels remains a valuable target for breast cancer treatment as approximately one-third of all the breast cancers are hormone-dependent and will relapse following estrogen deficiency in premenopausal and postmenopausal women.1 Aromatase system is an enzyme complex involving two components Aavoprotein NADPH-cytochrome P-450 reductase and aromatase cytochrome P-450. Hormone-dependent breast cancer could be treated by inhibiting the aromatase cytochrome P-450 to reduce estrogen production by peripheral and ovarian tissue.2 When evaluated against a nonspecific reversible aromatase inhibitor, irreversible aromatase inhibitors offer remarkable advantages. An irreversible aromatase inhibitor acts as a substrate and inactivates the active site of the enzyme by covalently binding to an intermediate compound prepared by the aromatase cytochrome P-450 through the standard catalytic mechanism.3
Exemestane (EXE), chemically 6-methylenandrosta-1, 4-diene-3, 17-dione (C20H24O2; 296.403 g/mol), (Figure 1) an irreversible aromatase inhibitor, is employed for the therapy of hormone-dependent breast cancer.4 The presence of 1, 2-double bond in the ring of steroid molecule augmented the aromatase inactivator resemblance for the aromatase enzyme, which further improved the therapeutic potency obliquely. EXE is a BCS Class IV drug and exhibits distinctive poor aqueous solubility and low permeability.5 Additionally, bone loss is caused as a side effect, leaving the patients at an elevated risk of osteoporosis and bone fracture. Furthermore, an alarming impediment to successful breast cancer therapy is therapeutic resistance to aromatase inhibitors.6
Figure 1.
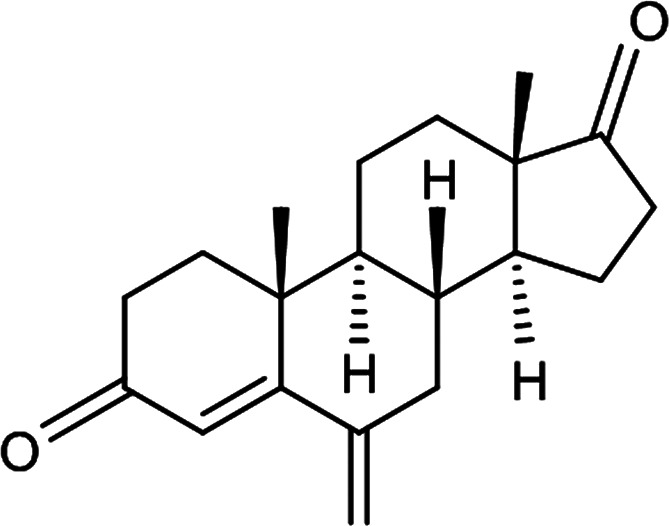
Chemical structure of EXE.
Henceforth, harmless and efficient alternative approaches have been encouraged to evade serious toxicities and challenges associated with standard chemotherapy.7 The combinatorial approach of conventional chemotherapeutics with a herbal moiety will be beneficial in reducing the noxious effects, surmounting the multidrug resistance, reducing the chemotherapeutic dose, and consequently potentiating anticancer efficacy.8
Genistein (GEN, 4′,5,7-trihydroxyisoflavone) (Figure 2), an isoflavone, is an essential active constituent of the soybean, kudzuvine root, scoparius, and other leguminous plants, having numerous beneficial effects in cardiovascular diseases, osteoporosis, and postmenopausal syndrome. GEN, owing to its weak estrogenic and anti-estrogenic properties, acts in various cancers including prostate, skin, as well as breast, through different approaches such as initiation of differentiation, inhibition of topoisomerase II, protein tyrosine kinase activity, and angiogenesis.9 Declined risks of osteoporosis, cardiovascular disease, breast cancer, and uterine cancer have been reported in Asiatic women with a higher intake of soy products constituting isoflavones.10
Figure 2.

Chemical structure of GEN.
Contemplating the budding benefits of GEN, it was ideal to be combined with EXE to accomplish superior therapeutic effectiveness with fewer side effects. One of the major side effects of hormonal therapy, bone hunting, could be prevented by this novel combination.11
For the combination EXE and GEN, no concurrent method of analysis has been accounted in the literature yet. However, different methods have been used for the quantitative determination of these two drugs individually. An analytical technique is therefore required for the quality control and quantification of constituent drugs for the advancement of the combination formulation. Hence, the present study was designed to develop and validate an RP-HPLC method for the simultaneous estimation of EXE and GEN. This method was further applied to liposomes prepared by the ethanol injection method and rotary evaporation method, co-loaded with EXE and GEN. This method was further applied to co-loaded EXE and GEN liposomes formulated by the ethanol injection method and thin-film hydration method as well. Moreover, to confirm the suitability of the method, different degradation studies such as acid, alkaline, photolytic, and oxidative were also carried out.
2. Experimental Section
2.1. Materials and Methods
2.1.1. Materials
EXE was supplied from Coral Drugs Private Limited (New Delhi, India) as a gift sample, and GEN was a gift sample from DSM Nutritional Products Europe Ltd. Phospholipid (Lipoid S 100) was provided as a gift sample from Lipoid (GmbH, Germany). Cholesterol was a gift sample from Central Drug House Pvt., Ltd., Delhi. Tween 80 was procured from Mana Scientific Products, Hyderabad, Telangana. Ultrapure water was obtained through the Milli-Q purification system (Millipore, Bedford, MA, USA) and used throughout the study. Pharmaceutical or analytical grade solvents or reagents were used.
2.1.2. Chromatography Instrument and Conditions
The HPLC system comprises a Waters model 1525 binary pump linked by a photodiode array detector (PDA detector, Waters 2998) with EMPOWER software to control the system and for the acquisition and analysis of the data. The mobile phase composed of A––methanol:water (35:15, v/v) with formic acid (0.01%) and B––acetonitrile (A:B––30:70, v/v) was used in an isocratic mode with 1.0 mL/min flow rate. A PVDF filter membrane (0.45 μm; Millex HV, Millipore, USA) was used to filter the mobile phase prior to its use and then ultrasonically degassed. The volume for injection was kept at 10 μL for the sample analysis (Supporting Information, Table S1). Both analytes were alienated on a reverse-phase (RP) C18 ODS column (150 mm × 4.6 μm, 5 μm) at their respective wavelengths, i.e., 245 nm for EXE and 270.5 nm for GEN. The absorption maxima of both drugs are shown in Figure 3a,b.
Figure 3.

Absorption maxima of (a) EXE and (b) GEN.
2.1.2.1. Standard and Working Solution Preparation
The standards of both the analytes namely EXE (analyte A) and GEN (analyte B) were prepared individually in HPLC-grade methanol by weighing 10 mg of EXE and GEN diluted with 10 mL of methanol, so that 1000 μg/mL of standard solution of analyte A1 and analyte B1 was obtained. From this solution, 1 mL was taken and diluted with methanol to obtain a stock solution of 100 μg /mL (stock A2 and stock B2). Stock A2 and stock B2 were diluted further with methanol, so that working stock solutions with 3, 6, 9, 12, 15, 18, 21, 24, 27, 30, 33, and 36 μg/mL concentrations were achieved. Further, the quality control (QC) samples of analyte A and analyte B were accordingly prepared to obtain 15 μg/mL (lower level), 25 μg/ mL (middle level), and 35 μg/mL (higher level). By using a 0.22 mm filter (Millifilter, Milford, MA, USA), all solutions were filtered prior to analysis.
2.1.2.2. Optimization of the RP-HPLC Method
Optimization of the anticipated method was performed by the Box Behnken design (BBD) using three independent variables and six dependent variables. BBD generates higher order responses of independent variables with less possible runs than a standard factorial approach. Percent methanol concentration (A), autosampler temperature (B), and flow rate (C) were considered as independent variables, and retention time (RT) of EXE (Y1) and GEN (Y4), tailing factors of EXE (Y2) and GEN (Y5), and the number of theoretical plates of EXE (Y3) and GEN (Y6) were taken as dependent variables in this design. Seventeen test runs were performed, and the responses of dependent variables (Y) via polynomial equations were examined with the help of design Expert (STATEASE Inc., USA) software,12,13
| 1 |
where α0 is an intercept; α1, α2, and α3 are linear coefficients; α12, α13, and α23 are interaction coefficients; and α11, α22, and α33 are quadratic coefficients produced from experimental runs, while A, B, and C are independent variables, and AB, AC, BC, A2, B2, and C2 are quadratic terms, respectively.14
Research surface methodology (RSM) was performed to establish the association involving the dependent and independent variables, and by the use of variance analysis (ANOVA), the model impact was validated.15 At this point, we have selected the range of dependent factors, i.e., 20–50% of methanol concentration; autosampler temperature specified between 15 and 35; and the flow rate amplified from 0.8 to 1.2 mL/min, correspondingly, as shown in Table 1.
Table 1. Observed Responses in Box–Behnken Trial Runs for EXE–GEN.
| run | factor 1 A: % methanol | factor 2 B: autosampler temp | factor 3 C: flow rate mL/min | response 1 retention time (EXE) min | response 2 retention time (GEN) | response 3 tailing factor (EXE) | response 4 tailing factor (GEN) | response 5 theoretical plates (EXE) | response 6 theoretical plates (GEN) |
|---|---|---|---|---|---|---|---|---|---|
| 1 | 30 | 15 | 1.2 | 2.07 | 1.69 | 1.47 | 1.57 | 7500 | 6200 |
| 2 | 40 | 15 | 1 | 2.11 | 1.62 | 1.41 | 1.58 | 7540 | 6232 |
| 3 | 30 | 35 | 1.2 | 2.19 | 1.7 | 1.47 | 1.45 | 7600 | 6297 |
| 4 | 30 | 25 | 1 | 2.15 | 1.68 | 1.56 | 1.57 | 7574 | 6271 |
| 5 | 20 | 15 | 1 | 2.09 | 1.66 | 1.48 | 1.55 | 7454 | 6174 |
| 6 | 30 | 15 | 0.8 | 2.09 | 1.69 | 1.48 | 1.56 | 7550 | 6252 |
| 7 | 40 | 25 | 1.2 | 2.15 | 1.67 | 1.39 | 1.49 | 7552 | 6255 |
| 8 | 30 | 25 | 1 | 2.14 | 1.67 | 1.55 | 1.56 | 7550 | 6249 |
| 9 | 30 | 25 | 1 | 2.13 | 1.68 | 1.57 | 1.55 | 7549 | 6258 |
| 10 | 40 | 25 | 0.8 | 2.14 | 1.64 | 1.45 | 1.54 | 7580 | 6282 |
| 11 | 30 | 25 | 1 | 2.15 | 1.67 | 1.54 | 1.56 | 7550 | 6251 |
| 12 | 20 | 25 | 1.2 | 2.13 | 1.66 | 1.45 | 1.54 | 7432 | 6139 |
| 13 | 20 | 35 | 1 | 2.2 | 1.65 | 1.46 | 1.55 | 7422 | 6125 |
| 14 | 30 | 25 | 1 | 2.15 | 1.67 | 1.55 | 1.58 | 7540 | 6241 |
| 15 | 40 | 35 | 1 | 2.21 | 1.64 | 1.45 | 1.42 | 7640 | 6344 |
| 16 | 20 | 25 | 0.8 | 2.15 | 1.69 | 1.44 | 1.56 | 7421 | 6131 |
| 17 | 30 | 35 | 0.8 | 2.18 | 1.69 | 1.49 | 1.53 | 7545 | 6247 |
2.1.3. Method Development
For ascertaining the maximal solubility profile of the drug, scrupulous literature search on the physicochemical properties of the drug in various organic solvents (i.e., methanol and acetonitrile) was done. Method development was completed by using different flow rates, column temperatures, mobile phase ratios, concentrations, and pH values.16
2.1.4. Method Validation
According to the International Conference on Harmonization (ICH) of Technical Requirements for Registration of Pharmaceuticals for Human Use––ICH Q2 (R1) and the Food and Drug Administration (FDA)––Guidance for Bioanalytical Method Validation, the developed method was validated with regard to specificity, system suitability, precision (intraday and interday), linearity, ruggedness, robustness, limit of quantification (LOQ), and limit of detection (LOD, to ensure that the analytical process was appropriate for its proposed purpose. Stability studies on different storage conditions were also performed.17
2.1.4.1. System Suitability Test
This test is a requisite component of the method development, ensuring that the HPLC system and the developed method are able to provide consistent results. Injecting six replicates of EXE and GEN, the system suitability test was done, and the results were estimated through RT, theoretical plates, peak area, and tailing factor of both analytes at 256 nm. The percent relative standard deviation (RSD) of diverse parameters such as peak area, retention time (Rt), theoretical plates, and tailing factor were determined. As per US-FDA guidelines, the condition for this test is that the relative standard deviation (% RST) for RT and peak area should be less than 2%. For the tailing factor, the range should not surpass 2%, and for the theoretical plates of the column, it should be more than 2000 (N > 2000).18
The peaks obtained for EXE and GEN (Figure 4) were found to be sharp, well separated, and with superior resolution. The results attained for the abovementioned parameters reveal the suitability of the selected chromatographic system for the supplementary validation and analysis of EXE and GEN.
Figure 4.

Chromatograms of EXE and GEN.
2.1.4.2. Specificity
This parameter is an imperative aspect of HPLC and denotes the potential of the analytical system to segregate the analyte from the multifaceted combination, ensuring that no further interferences from the solvent are present in the chromatograms of both drugs at the definite wavelength. Blank solution (mobile phase and solvent), placebo, and their mixture individually were compared by their chromatograms at MQC levels, thereby evaluating the specificity.19
2.1.4.3. Linearity
Different concentrations of five mixed standard solutions were prepared for the determination of linearity ranging between 5 and 110 μg/mL. Plotting the concentration on the x-axis and peak area on the y-axis separately, calibration curves of EXE and GEN were plotted, and the regression equation was procured from them. By dividing the peak area with concentration, the response ratio (response factor) was also calculated.20
2.1.4.4. Robustness
By making small variations in the experimental constraints like modifying the wavelengths of EXE (242 to 247) and GEN (268 to 271), flow rate (0.8–1.2), and composition of the mobile phase (20:80to 30:70), the suitability of the method was assessed. Additionally, the consequences that were observed due to these variations in the method conditions were inspected, and the results were analyzed. From the % RSD of the mean peak area and mean % recovery of EXE and GEN, the robustness of the method was evaluated, and their limit should not surpass 2%. The tailing factor, theoretical plates, and RT of both analytes were measured. Robustness depicts the capacity of the analytical method to remain efficient, regardless of the small calculated parameter variations.21
2.1.4.5. Accuracy
The accuracy of an analytical method means the proximity between the estimated value and the value that is actually found. Through the percentage recovery of both analytes at three QC levels (50, 100, and 150%), the accuracy of the proposed method was determined, and from each concentration, three sample replicates (n = 3) were injected. By using the following formula, the mean % recovery of EXE and GEN with their % RSD and standard error (SE) was analyzed. The limits for mean % recovery to be accepted for the accuracy should be within 90–110%. SE and % RSD should not be more than 2%.16
| 2 |
2.1.4.6. Precision
Precision is referred to as the amount in which the repetition of a particular technique is performed for analyzing several replicates in different instances. The QC samples of both the analytes were considered for determining the interday and intraday precision, wherein for intraday, considering each QC level, three replicates (n = 3) were run and analyzed for each drug on the same day, while for intraday precision, the samples were analyzed for 3 days consecutively. Finally, the peak area as well as % recovery for both the drugs were recorded, followed by the calculation of % RSD that should be within the acceptable range of >2%. Additionally, the retention time, number of theoretical plates, and tailing factors for both the analytes were calculated.12
2.1.4.7. Ruggedness
The property of reproducing the testing results under various different conditions that include different analytes or different instruments is referred to as ruggedness. For the determination of ruggedness, two analytes are tested in the same as well as indifferent laboratories but on identical HPLC systems exhibiting similar specifications and columns. Thereafter, the % recovery was calculated for both the analytes, and comparison was done for the results obtained from two different HPLC instruments with two different analytes for investigating the ruggedness of the validated method.
2.1.4.8. Sensitivity
LOD and LOQ were considered for determining the sensitivity of the developed analytical method. The concentration at which the signal-to-noise ratio of 3:1 is produced is termed as LOD, whereas the concentration at which the signal-to-noise ratio of 10:1 is produced with less than 10% RSD (n = 3) is termed as LOQ. The following formula was used for examining the LOD and LOQ for both the analytes:
| 3 |
| 4 |
where σ stands for the standard deviation of y-intercepts of the regression line, and s stands for the slope obtained from the calibration curve.20,22
2.1.5. Forced Degradation Studies
Forced degradation studies were carried out by subjecting EXE and GEN to stress conditions like acidic (HCl), alkaline (NaOH), oxidative (H2O2), and photolytic conditions recommended by ICH for the controlled, forced, or stress degradation studies.15,16
2.1.5.1. Acid Hydrolysis
Acid hydrolysis was carried out using 1 N concentration of HCl. From 1 N HCl, 3 mL HCl was added to 1 mL of 1 mg/mL drug solution at room temperature in a 10 mL amber-colored volumetric flask, which was followed by its reflux at 80 °C for 1 h in a water bath by sealing the flask. After reflux, neutralization was carried out using 1 N NaOH. Later, a diluent was added to the sample for further dilution. Prior to analysis by the developed HPLC method, the resulting solution was filtered using a 0.22 μm membrane filter.
2.1.5.2. Alkaline Hydrolysis
Alkaline hydrolysis was performed by using 1 N concentration of NaOH. 3 mL of 1 N NaOH was added to 1 mL of 1 mg/mL of drug solution at room temperature in a 10 mL amber-colored volumetric flask, which was followed by its reflux performed by sealing the amber-colored flask at 80 °C for 1 h in a water bath. To neutralize this solution, 1 N HCl was added after reflux. The final volume was then adjusted to 10 mL with a diluent, and a 0.22 μm membrane filter was used for the filtration of the solutions for analysis by the developed HPLC method.
2.1.5.3. Oxidative Degradation
1 mL of 1% Hydrogen peroxide solution (H2O2) was added to a standard stock solution of drug (1 mL) in a 10 mL amber-colored volumetric flask, and reflux was carried out at 80 °C for 1 h in a water bath. After reflux, the volume of the flask was made up to 10 mL with the mobile phase.
2.1.5.4. Photolytic Degradation
In a clear volumetric flask (10 mL), 1 mL of stock solution of the drug mixture was taken and diluted up to 10 mL with the mobile phase. After sealing, the volumetric flask was exposed to direct sunlight for 30 min to study the photochemical stability. Then, filtration through syringe filters (0.2 μm) was done, followed by further analysis which was performed by injecting the sample solution into the HPLC chromatographic system.23
2.1.6. Application of the Simultaneous Analytical Method in Nanoformulations
Quantification of EXE and GEN in pharmaceutical nanoformulations such as liposomes prepared by the thin-film hydration method and ethanol injection method was performed by the developed and validated simultaneous analytical method. The quantity of both drugs entrapped in the nanoformulation was analyzed by the developed method for evaluation.
2.1.6.1. Preparation of EXE–GEN Liposomes by the Ethanol Injection Method
Phospholipid (Lipoid S 100) and cholesterol (2:1 ratio) were used for the preparation of EXE–GEN–LIPO by the ethanol injection method. Appropriately weighed amounts of lipid (200 mg), cholesterol (100 mg), EXE (7.5 mg), and GEN (15 mg) were dissolved in 5 mL of ethanol and injected into 20 mL of preheated distilled water. The incorporation of the drug in the vesicle of the liposome depends on its hydrophilic/hydrophobic characteristics. Inclusion of nonharmful solvents such as ethanol and the easy scale-up of the method reflect the main advantage of the ethanol injection method.24
2.1.7. Preparation of EXE–GEN Liposomes by the Thin-Film Hydration Method
Phospholipid (Lipoid S 100) and cholesterol were employed for the formulation of EXE–GEN–LIPO by the thin-film hydration method. In 5 mL of chloroform: methanol (2:1), aptly weighed quantities of lipid, cholesterol, EXE, and GEN were dissolved. Consequently, via a rotary evaporator (Buchi, Switzerland) in a round-bottom flask (RBF), the solvent was evaporated under reduced pressure to form a thin film comprising lipids. Further, in vacuum desiccators, a RBF was placed, and the vacuum was released for 12 h to eradicate the leftover traces of the organic solvent. The thin film of lipid was hydrated by rotating the RBF using 5 mL of milli-Q water at 100 rpm for 45 min in water maintained above the transition temperature (Tm) of the lipid. Liposome dispersion was obtained by rotating the flask until the thin film was completely hydrated. Using a probe sonicator for 5–10 min, the resulting liposome dispersion was ultrasonicated and stored at 4 ° C until further use.25
3. Results and Discussion
3.1. Selection of Wavelength
EXE quantification is accounted in the literature at different wavelengths of 247, 242, 246, and 249 nm by the HPLC method.26−29 Correspondingly, GEN quantification by the HPLC method has been reported at 265, 261, and 267 nm.30−32 EXE and GEN individually were detected at 246 and 270.5 nm, respectively, while developing this bioanalytical technique. On the contrary, for the concomitant estimation of both the drugs at a particular wavelength at which the estimation of both the drugs could be accomplished, a common wavelength is required. A common wavelength that facilitates an adequate amount of absorptivity of the therapeutic compounds with separate absorption maxima represents a single wavelength. For this reason, the single wavelength was found to be at 256 nm. To surmount tribulations related with the developed individual methods in the past, an efficient and cost-effective HPLC method for the simultaneous quantification of EXE and GEN was developed based on the discussed single wavelength. The developed method was validated as per the ICH guidelines, and the relevance of this analytical method was assessed on the developed nanoformulations.
3.2. Optimization and Development
For the prepared method to be more economical and realistic, a particular wavelength was preferred for analysis, based on the identification of a common wavelength at which both the agents EXE and GEN showed maximum absorbance. Methanolic solutions of EXE and GEN at 10 μg/mL concentration were prepared, and UV spectra were noted in the 400–200 nm range. The analysis results showed that maximum absorbance was obtained at 245 nm for EXE, while GEN showed a similar absorbance at 270.5 nm. Taking into consideration the spectra from the UV instruments, 256 nm was chosen to be the common wavelength, which was further confirmed through a PDA detector. The simultaneous estimation of EXE and GEN was performed with A––methanol:water (35:15, v/v) with formic acid (0.01%) and B––acetonitrile (A:B––30:70, v/v) used in an isocratic mode with a flow rate of 1.0 mL/min, due to fact that the peaks obtained were of high resolution and sharpness, showing distinct separation of EXE and GEN. The retention times (RT) of 2.10 and 1.67 min were obtained for EXE and GEN, respectively. For comparison, both analytes (EXE and GEN) were analyzed at their respective λmax, that is, 245 and 270.5 nm, respectively (Figures S1 and S2). EXE and GEN, when analyzed concurrently, displayed separation at retention times of 2.10 and 1.67 min, respectively, implying that no change in the retention time is observed in the combination of both drugs, further signifying that there is no interaction between the peaks of both analytes (Figure 4). Owing to the rapidity, efficiency, and ability to detect both analytes in a run time of less than 5 min, the developed method for the analysis of EXE and GEN and their simultaneous determination has been suggested being superior over other methods.
3.3. Optimization Using BBD
The selection of any optimization technique to be applied on any analytical procedure depends upon the available resources as well as time it saves. BBD was selected as our optimization tool due to the fact that it involves a simple statistical model with reduced experimental runs. In this case, we applied BBD to obtain the 3D graphs (Figures 5 and 6), which were further analyzed to establish the interaction between independent and dependent variables. The detailed analysis showed that there were considerable differences in values. Tables S2–S8 enlist r2 values of predicted and actual dependent variables, which were found to be in perfect agreement with each other with their difference (<0.2). Furthermore, r2 values touching 0.999 demonstrated a superior correlation among the experimental and fitted models. The software-generated polynomial equations were relied for connection establishment between the factors and their responses.
| 5 |
| 6 |
| 7 |
| 8 |
| 9 |
| 10 |
Figure 5.

Three-dimensional response plots demonstrating the effect of independent variables on (A) RT, (B) tailing factor, and (C) number of theoretical plates of EXE.
Figure 6.

Three-dimensional response plots demonstrating the effect of independent variables on (A) RT, (B) tailing factor, and (C) number of theoretical plates of GEN.
3.4. Validation of the Analytical Method
3.4.1. Test for System Suitability
The analyses of peak area as well as RT that were performed were repeated many times to check the authenticity of the results. The % RSD value for peak area and RT were within the limit of 2%, suggesting the suitability for our system (Table 2). Moreover, the % RSD values for the theoretical plates and tailing factors of the column for different runs were found to be 1.47 ± 0.80% and 7552 ± 0.94 for EXE and 1.56 ± 0.52% and 6717.5 ± 1.13% for GEN, respectively. The theoretical plate number was found to be (>2000), indicating adequacy for meeting the criteria for system suitability. Additionally, for the tailing factors, % RSD was also observed to be within the set limits. The above results were sufficient to establish that our newly proposed HPLC method was efficient in producing results of acceptable quality.
Table 2. System Suitability of EXE and GEN.
| parameters | RT (min) | peak area (mV-min) | theoretical plates | tailing factor |
|---|---|---|---|---|
| System Suitability of EXE | ||||
| Rep-1 | 2.10 | 4,962,145 | 7494 | 1.47 |
| Rep-2 | 2.12 | 4,964,253 | 7540 | 1.48 |
| Rep-3 | 2.11 | 4,964,964 | 7646 | 1.45 |
| Rep-4 | 2.10 | 4,959,155 | 7574 | 1.47 |
| Rep-5 | 2.09 | 4,964,664 | 7454 | 1.46 |
| Rep-6 | 2.14 | 4,974,299 | 7604 | 1.48 |
| mean | 2.11 | 4964913.33 | 7552 | 1.47 |
| SD | 0.017 | 5087.505 | 70.90 | 0.0116 |
| RSD | 0.84 | 0.102 | 0.94 | 0.80 |
| System Suitability of GEN | ||||
| Rep-1 | 1.70 | 1,268,478 | 6698 | 1.57 |
| Rep-2 | 1.66 | 1,264,359 | 6679 | 1.56 |
| Rep-3 | 1.68 | 1,265,367 | 6788 | 1.57 |
| Rep-4 | 1.67 | 1,263,369 | 6753 | 1.57 |
| Rep-5 | 1.65 | 1,274,878 | 6595 | 1.55 |
| Rep-6 | 1.69 | 1,264,513 | 6792 | 1.56 |
| mean | 1.675 | 1266827.33 | 6717.5 | 1.563 |
| SD | 0.0187 | 4314.61 | 75.696 | 0.00816 |
| RSD | 1.12 | 0.34 | 1.13 | 0.52 |
3.4.2. Specificity
By evaluating the chromatograms of the blank solution (Figure S3) with the standard solutions of EXE, GEN, and EXE–GEN, we determined the specificity of the developed analytical method. A volume of analyte equal to 10 μL was injected into the HPLC system, and the chromatograms were investigated. During the individual runs for EXE and GEN, retention times of 2.10 and 1.67 min, respectively, were noted. While the combination (GEN–EXE mixture) displayed distinct chromatograms at 2.10 and 1.67 min for EXE and GEN, respectively, retention times of EXE and GEN when analyzed independently and in combination did not change, as shown in the result, which confirms the specificity of the developed HPLC analytical method.
3.4.3. Linearity
The graph plotted between the concentration of drugs (EXE and GEN) and their respective peak areas showed the linear nature of the plot, with the correlation coefficient R2 value of 0.995 for EXE and 0.998 for GEN (Figures 7 and 8). The obtained results denote the linearity of the prepared method over the measured concentration range (5–110 μg/mL) for both analytes.
Figure 7.

Calibration curve of EXE.
Figure 8.

Calibration curve of GEN.
3.4.4. Robustness
This study was carried out to evaluate the effects of different parameters of analysis, i.e., flow rate, detection wavelength of both analytes, and composition of the mobile phase on factors like retention time, theoretical plates, and tailing factors of the analytes. The results of changed conditions and their respective influence on the performance of our analytical method have been enlisted in Table 3. The results showed that our method was found to be consistent and robust.
Table 3. Robustness Result of EXE and GEN.
| chromatographic parameter | Modification | theoretical plates | retention time | tailing factor |
|---|---|---|---|---|
| Robustness Data of EXE | ||||
| wavelength (nm) | 242 | 7494 | 2.10 | 1.47 |
| 245 | 7540 | 2.12 | 1.48 | |
| 247 | 7646 | 2.11 | 1.45 | |
| flow rate (mL/min) | 1.0 | 7574 | 2.10 | 1.42 |
| 0.8 | 7454 | 2.14 | 1.45 | |
| 1.2 | 7604 | 2.18 | 1.48 | |
| composition of mobile phase | 30:70 | 7543 | 2.11 | 1.41 |
| 20:80 | 7555 | 2.13 | 1.42 | |
| 40:60 | 7621 | 2.15 | 1.45 | |
| Robustness Data of GEN | ||||
| wavelength (nm) | 268 | 6678 | 1.66 | 1.54 |
| 270 | 6687 | 1.67 | 1.56 | |
| 271 | 6798 | 1.68 | 1.57 | |
| flow rate (mL/min) | 1.0 | 6680 | 1.65 | 1.54 |
| 0.8 | 6779 | 1.67 | 1.55 | |
| 1.2 | 6987 | 1.69 | 1.58 | |
| composition of mobile phase | 30:70 | 6789 | 1.64 | 1.56 |
| 20:80 | 6877 | 1.67 | 1.58 | |
| 40:60 | 6988 | 1.69 | 1.59 | |
3.4.5. Accuracy
Accuracy means the immediacy to the actual value expressed in terms of % recovery. The % recovery at all three QC levels ranged from 98.30–101.11% and 99.0–101.32% for EXE and GEN, correspondingly, as summarized in Table 4. For routine drug analysis, the applicability of the developed method was verified, as these results were found to be within the established limits.
Table 4. Accuracy Results of EXE and GEN.
| sample name | level | actual concentration of sample (μg/mL) | concentration of sample spiked (μg/mL) | concentration of sample obtained (μg/mL) | % recovery | SD | % RSD |
|---|---|---|---|---|---|---|---|
| EXE | |||||||
| EXE | 80% | 15 | 27 | 26.90 | 99.62 | 0.745 | 0.74 |
| 80% | 15 | 27 | 27.30 | 101.11 | |||
| 80% | 15 | 27 | 27.10 | 100.37 | |||
| 100% | 25 | 50 | 50.10 | 100.21 | 0.995 | 0.96 | |
| 100% | 25 | 50 | 49.60 | 99.25 | |||
| 100% | 25 | 50 | 49.15 | 98.30 | |||
| 120% | 35 | 77 | 77.20 | 100.25 | 0.819 | 0.82 | |
| 120% | 35 | 77 | 77.37 | 100.48 | |||
| 120% | 35 | 77 | 76.20 | 98.96 | |||
| GEN | |||||||
| GEN | 80% | 15 | 27 | 27.29 | 101.07 | 0.551 | 0.55 |
| 80% | 15 | 27 | 26.99 | 99.96 | |||
| 80% | 15 | 27 | 27.12 | 100.44 | |||
| 100% | 25 | 50 | 49.50 | 99.00 | 1.216 | 1.21 | |
| 100% | 25 | 50 | 50.66 | 101.32 | |||
| 100% | 25 | 50 | 49.78 | 99.56 | |||
| 120% | 35 | 77 | 77.70 | 100.90 | 0.775 | 0.77 | |
| 120% | 35 | 77 | 77.15 | 100.19 | |||
| 120% | 35 | 77 | 76.50 | 99.35 | |||
3.4.6. Precision
The peak area’s % RSD during interday and intraday analyses was calculated for both EXE and GEN. The inter- and intraday values for EXE were reported to be 1.06–1.43 and 0.47–1.09, while for GEN, such values were observed to be 0.75–1.40 and 0.31–1.81, respectively. The reported results signify that our method possesses excellent precision and reproducibility, as the % RSD for all the analysis was <2%. The data from the above experiments have been reported in Tables S9a–c and S10a–c, thus suggesting the repeatability and consistency of the method.
3.4.7. Ruggedness
Reproducibility of the results was carried out by performing the ruggedness test. The analytical method was repeated with the same analyte on different HPLC instruments, keeping the other conditions exactly the same for the first half, while for the other half of the study, the method was run on the same HPLC instrument with different analytes, keeping other conditions constant. The results demonstrated an insignificant change in the mean % recovery values for both analytes. The high level of ruggedness signifies the excellent reproducibility of our in-house method on different HPLC systems with distinct analytes present in different labs (Table S11a,b).
3.4.8. Sensitivity
The values of LOQ and LOD for the developed analytical method were calculated to be 46.383 and 15.30 μg/mL for EXE and 44.623 and 14.725 μg/mL for GEN, respectively. The observed values suggested that the method was sensitive enough, satisfying the criteria of signal:noise ratio of 10:1 and 3:1, respectively, for LOQ and LOD. As compared to the methods previously reported, this method is highly responsive according to the results.
3.5. Stability Studies
The stability of both the drugs was analyzed during their storage conditions. For this study, both the agents were taken at three different concentration levels (15, 25, and 35 μg/mL) and evaluated under three different storage conditions (short-term stability, long-term stability, and freeze–thaw cycle). Accuracy of the envisaged concentration obtained was in the range 92.4–107.8% for EXE and 91.8–106.6% for GEN, as depicted in Table 5. The results obtained specified that both drugs did not undergo degradation throughout the diverse storage conditions. When compared to EXE, GEN was found to be less stable.
Table 5. Stability of EXE and GEN under Different Storage and Handling Conditions.
| sample name | actual concentration of sample (μg/mL) | % recovery |
||
|---|---|---|---|---|
| sshort-term stability (12 h) | long-term stability (−30 °C for 3 weeks) | freeze–thaw cycle | ||
| EXE | 15 | 93.6 | 101.6 | 98.3 |
| 15 | 100.5 | 101.9 | 101.2 | |
| 15 | 97.8 | 99.8 | 97.9 | |
| 25 | 97.5 | 99.9 | 98.7 | |
| 25 | 95.4 | 98.8 | 103.9 | |
| 25 | 102.8 | 99.9 | 97.8 | |
| 35 | 98.6 | 107.8 | 99.8 | |
| 35 | 104.5 | 104.6 | 106.4 | |
| 35 | 92.4 | 99.8 | 104.6 | |
| GEN | 15 | 94.9 | 97.7 | 101.2 |
| 15 | 96.8 | 93.9 | 99.5 | |
| 15 | 91.9 | 98.9 | 98.1 | |
| 25 | 98.2 | 99.9 | 94.3 | |
| 25 | 103.1 | 104.9 | 91.8 | |
| 25 | 101.6 | 99.9 | 101.9 | |
| 35 | 98.0 | 99.8 | 100.8 | |
| 35 | 102.4 | 103.9 | 99.9 | |
| 35 | 98.8 | 106.6 | 103.8 | |
3.6. Forced Degradation Studies
The HPLC method was accessed for its ability to separate and quantify the possible degradation products, which may be formed during the storage or manufacturing. For such estimation, stress-induced conditions (like acidic, alkaline, and oxidative) were applied. Figure 9 illustrates the findings of the forced degradation studies, with clear peaks of the degradation products at Rt 0.91 and 0.97 (during acidic and alkaline conditions), whereas broad peaks at Rt 1.72 (during oxidative stress conditions). It was observed during the study that no such degradation peak was noted during photolytic degradation studies. Hence, the developed analytical method meets the recommendations of ICH and FDA for the inclusion of degradation results for any newly developed analytical procedure. Under all circumstances, no change in the retention time of the drugs was observed, thereby maintaining the integrity of peaks.
Figure 9.

Forced degradation studies: chromatograms under (a) acidic, (b) alkaline, (c) oxidation, and (d) photolytic conditions.
3.7. Application of the Analytical Method in Pharmaceutical Formulations
The percentage entrapment efficiency of EXE and GEN in the prepared EXE–GEN liposomes by the thin-film hydration method and EXE–GEN liposomes by the ethanol injection method at a wavelength of 256 nm was analyzed by the developed analytical method. The entrapment efficiency (EE %) of EXE–GEN liposomes formulated using the ethanol injection technique was found to be in the range of 94 ± 2 to 99 ± 5% (Figure 10). The entrapment efficiency was found to be 90.1 ± 0.06 to 92.20 ± 20.80 for EXE–GEN liposomes prepared by the thin-film hydration method. Results revealed that liposomes prepared by the ethanol injection method showed maximum drug entrapment when compared to liposomes prepared by the rotary method. No significant changes in drug peaks and retention times were observed, assuring the selectivity and high specificity of the developed method.
Figure 10.

Chromatograms of EXE–GEN liposomes formulated by the ethanol injection method.
4. Conclusions
For treating multifaceted diseases such as cancer, therapies against miscellaneous molecular targets using combination of drugs should be deemed as remarkable alternatives. The present work proposes a novel method for the efficient separation of EXE and GEN. Following the guidelines enacted by the ICH and validation parameters, our analytical method was observed to be simple, rapid, with significant consistency and responsiveness, and economical. Additionally, the optimized method was efficient for the simultaneous measurement of GEN and EXE, in the nanoformulations that we prepared, as well as for all practical applications involving such combination. The developed method distinguished both the analytes within 3 min, consequently minimizing the use of solvents and saving time. To simply quantify both compounds at a single wavelength in the nanoformulations was the objective for designing this method. This method is expected to be of immense speculative value and could be applied for the speedy quantification of the abovementioned compounds present either in pharmaceutical formulations or in in vitro release media or in the in vivo samples by taking into consideration all validation parameters for the developed analytical method.
Acknowledgments
The authors would like to acknowledge Lloyd Institute of Management and Technology (Pharm.), Greater Noida, for providing HPLC amenities, and Jamia Hamdard, New Delhi, for providing the basic necessary facilities. The authors would also like to thank DST-FIST for providing instrumental facilities to Jamia Hamdard, India.
Supporting Information Available
The Supporting Information is available free of charge at https://pubs.acs.org/doi/10.1021/acsomega.3c01791.
Optimized process parameters for chromatographic conditions; chromatograms of GEN; chromatograms of EXE; chromatograms for blank solution; fit summary for the retention times of EXE and GEN; sequential model sum of squares for the retention times of EXE and GEN; fit summary for the tailing factors of EXE and GEN; sequential model sum of squares for tailing factors of EXE and GEN; fit summary for the theoretical plates of EXE and GEN; sequential model sum of squares for the theoretical plates of EXE and GEN; correlation coefficient (r2) of dependent variables; repeatability of EXE; intraday precision of EXE; interday precision of EXE; repeatability of GEN; intraday precision of GEN; interday precision of GEN; and ruggedness data (PDF)
The author (S.S.) would like to recognize the Indian Council of Medical Research (ICMR) for granting fellowship to S.S. (fellowship ID 45/36/2020-Nan/BMS).
The authors declare no competing financial interest.
Supplementary Material
References
- Núñez C.; Capelo J. L.; Igrejas G.; Alfonso A.; Botana L. M.; Lodeiro C. An Overview of the Effective Combination Therapies for the Treatment of Breast Cancer. Biomaterials 2016, 34. 10.1016/j.biomaterials.2016.04.027. [DOI] [PubMed] [Google Scholar]
- Lee J. H.; Nan A. Combination Drug Delivery Approaches in Metastatic Breast Cancer. J. Drug Delivery 2012, 2012, 915375 10.1155/2012/915375. [DOI] [PMC free article] [PubMed] [Google Scholar]
- Treatment A. Triple Negative Breast Cancer: Emerging Therapeutic Modalities and Novel Combination Therapies. Cancer Treat. Rev. 2018, 62, 110–122. 10.1016/j.ctrv.2017.11.003. [DOI] [PubMed] [Google Scholar]
- Ana A.; Sobral F.; Amaral C.; Nat C. Unravelling Exemestane: From Biology to Clinical Prospects. J. Steroid Biochem. Mol. Biol. 2016, 163, 1. 10.1016/j.jsbmb.2016.03.019. [DOI] [PubMed] [Google Scholar]
- Fein L.; Per B.; Lønning E.; Bajetta E.; Murray R.; Eisenberg P. D.; Mickiewicz E.; Celio L.; Pitt P.; Mita M.; Aaronson N. K.; Fowst C.; Arkhipov A.; Salle E.; Polli A.; Massimini G.. Activity of Exemestane in Metastatic Breast Cancer a Er Failure of Nonsteroidal Aromatase Inhibitors: A Phase I ... Related Papers. J. Clin. Oncol. , 18, 2234, 10.1002/ppul.26417. [DOI] [PubMed] [Google Scholar]
- Buzdar A. Review Paper Exemestane in Advanced Breast Cancer. Ther. Clin. Risk Manage. 2000, 11, 609–616. 10.1097/00001813-200009000-00002. [DOI] [PubMed] [Google Scholar]
- Ulrich-merzenich G. S. Combination Screening of Synthetic Drugs and Plant Derived Natural Products −— Potential and Challenges for Drug Development. Synergy 2014, 1, 59–69. 10.1016/j.synres.2014.07.011. [DOI] [Google Scholar]
- Ali S.; Beigi K.; Doroodizadeh T.; Haghnegahdar M. Therapeutic Applications of Herbal / Synthetic / Bio-Drug in Oral Cancer: An Update. Eur. J. Pharmacol. 2021, 890, 173657 10.1016/j.ejphar.2020.173657. [DOI] [PubMed] [Google Scholar]
- Dixon R. A.; Ferreira D. Genistein. Phytochemistry 2002, 60, 205–211. 10.1016/s0031-9422(02)00116-4. [DOI] [PubMed] [Google Scholar]
- Behloul N.; Wu G. Genistein: A Promising Therapeutic Agent for Obesity and Diabetes Treatment. Eur. J. Pharmacol. 2013, 698, 31–38. 10.1016/j.ejphar.2012.11.013. [DOI] [PubMed] [Google Scholar]
- Scavenging R.; Of P. Radical scavenging properties of genistein. Free Radical Biol. Med. 2003, 35, 958–965. 10.1016/S0891-5849(03)00472-6. [DOI] [PubMed] [Google Scholar]
- Mangla B.; Beg S.; Alam O.; Ahsan W.; Haque A.; Patel K. S.; Almalki W. H.; Alrobaian M.; Kohli K. Systematic Development and Validation of RP-HPLC Method for Simultaneous Estimation of Tamoxifen and Sulphoraphane with Specific Application for Nanolipidic Formulations. Arab. J. Chem. 2020, 13, 7909. 10.1016/j.arabjc.2020.09.022. [DOI] [Google Scholar]
- Hasan N.; Imran M.; Jain D.; Shamim A.; Beg S.; Kesharwani P. Rapid Analytical Method Development and Validation for the Simultaneous Estimation of 5-Fluorouracil and Cannabidiol in Plasma and Lipid-Based Nanoformulations. Curr. Anal. Chem. 2022, 18, 798–808. 10.2174/1573411018666220304085236. [DOI] [Google Scholar]
- Beg S.; Kohli K.; Swain S.; Saquib M. Development and validation of RP-HPLC method for quantitation of amoxicillin trihydrate in bulk and pharmaceutical formulations using box-behnken experimental design. J. Liq. Chromatogr. Relat. Technol. 2012, 35, 393–406. 10.1080/10826076.2011.601493. [DOI] [Google Scholar]
- Naidu K. R.; Kale U. N.; Shingare M. S. Stability Indicating RP-HPLC Method for Simultaneous Determination of Amlodipine and Benazepril Hydrochloride from Their Combination Drug Product. J. Pharm. Biomed. Anal. 2005, 39, 147–155. 10.1016/j.jpba.2005.04.001. [DOI] [PubMed] [Google Scholar]
- Beg S.; Malik A. K.; Afzal O.; Saleh A.; Altamimi A.; Kazmi I.; Al-abbasi F. A.; Almalki W. H.; Barkat A.; Kawish S. M.; Pradhan D. P.; Rahman M. Systematic Development and Validation of a RP-HPLC Method for Estimation of Abiraterone Acetate and Its Degradation Products. J. Chromatogr. Sci. 2021, 59, 79–87. 10.1093/chromsci/bmaa080. [DOI] [PubMed] [Google Scholar]
- Taylor P.; Chaudhary H.; Kohli K.; Amin S.; Arora S. RP-HPLC method for simultaneous estimation of diclofenac diethylamine and curcumin in transdermal gels. J. Liq. Chromatogr. Relat. Technol. 2012, 35, 174–187. 10.1080/10826076.2011.597068. [DOI] [Google Scholar]
- Hamdard J. Bioanalytical method development and validation for the simultaneous estimation of lamivudine and stavudine in human plasma by HPLC. Acta Pol. Pharm. 2010, 67, 429–437. [PubMed] [Google Scholar]
- Venishetty V. K.; Parikh N.; Sistla R.; Ahmed F. J.; Diwan P. V. Application of Validated RP-HPLC Method for Simultaneous Determination of Docetaxel and Ketoconazole in Solid Lipid Nanoparticles. J. Chromatogr. Sci. 2011, 49, 136–141. 10.1093/chrsci/49.2.136. [DOI] [PubMed] [Google Scholar]
- Haudhari B. G. C.; Atel M. P.; Bhagvatiprasad P.; Hah S. Stability Indicating RP-HPLC Method for Simultaneous Determination of Atorvastatin and Amlodipine from Their Combination Drug Products. Chem. Pharm. Bull. 2007, 55, 241–246. 10.1248/cpb.55.241. [DOI] [PubMed] [Google Scholar]
- Ferreira N. N.; Boni F. I.; Baltazar F.; Gremião M. P. D. Validation of an Innovative Analytical Method for Simultaneous Quantification of Alpha-Cyano-4-Hydroxycinnamic Acid and the Monoclonal Antibody Cetuximab Using HPLC from PLGA-Based Nanoparticles. J. Pharm. Biomed. Anal. 2020, 190, 113540 10.1016/j.jpba.2020.113540. [DOI] [PubMed] [Google Scholar]
- Bhaskaran N. A.; Kumar L.; Reddy M. S.; Pai G. K. An Analytical “Quality by Design” Approach in RP-HPLC Method Development and Validation for Reliable and Rapid Estimation of Irinotecan in an Injectable Formulation. Acta Pharm. 2021, 71, 57–79. 10.2478/acph-2021-0008. [DOI] [PubMed] [Google Scholar]
- Mukthinuthalapati M. A.; Bukkapatnam V. A Novel Validated Stability-Indicating RP-HPLC Method for the Determination of Exemestane (Steroidal Aromatase Inhibitor). J. Bioequivalence Bioavailability 2015, 7, 288. 10.4172/jbb.1000256. [DOI] [Google Scholar]
- Fan M.; Xu Æ. S.; Xia Æ. S.; Zhang X. Preparation of Salidroside Nano-Liposomes by Ethanol Injection Method and in Vitro Release Study. Eur. Food Res. Technol. 2008, 227, 167–174. 10.1007/s00217-007-0706-9. [DOI] [Google Scholar]
- Wagner A.; Vorauer-uhl K. Liposome Technology for Industrial Purposes. J. Drug Delivery 2011, 2011, 591325 10.1155/2011/591325. [DOI] [PMC free article] [PubMed] [Google Scholar]
- Johannessen D. C.; Engan T.; Di Salle E.; Zurlo M. G.; Paolini J.; Ornati G.; Piscitelli G.; Kvinnsland S.; Lonning P. E. Endocrine and Clinical Effects of Exemestane (PNU 155971), a Novel Steroidal Aromatase Inhibitor, in Postmenopausal Breast Cancer Patients: A Phase I Study. Clin. Cancer Res. 1997, 3, 1101–1108. [PubMed] [Google Scholar]
- Geisler J.; King N.; Anker G.; Ornati G.; Di Salle E.; Lønning P. E.; Dowsett M. In Vivo Inhibition of Aromatization by Exemestane, a Novel Irreversible Aromatase Inhibitor, in Postmenopausal Breast Cancer Patients. Clin. Cancer Res. 1998, 4, 2089–2093. [PubMed] [Google Scholar]
- Korzekwa K. R.; Trager W. F.; Smith S. J.; Osawa Y.; Gillette J. R. Theoretical Studies on the Mechanism of Conversion of Androgens to Estrogens by Aromatase. Biochemistry 1991, 30, 6155–6162. 10.1021/bi00239a011. [DOI] [PubMed] [Google Scholar]
- Evans T. R.; Di Salle E.; Ornati G.; Lassus M.; Benedetti M. S.; Pianezzola E.; Coombes R. C. Phase I and Endocrine Study of Exemestane (FCE 24304), a New Aromatase Inhibitor, in Postmenopausal Women. Cancer Res. 1992, 52, 5933–5939. [PubMed] [Google Scholar]
- Duursen M. B. M. V.; Nijmeijer S. M.; Morree E. S. D.; Jong P. C. D.; Berg M. V. D. Genistein Induces Breast Cancer-Associated Aromatase and Stimulates Estrogen-Dependent Tumor Cell Growth in in Vitro Breast Cancer Model. Toxicology 2011, 289, 67–73. 10.1016/j.tox.2011.07.005. [DOI] [PubMed] [Google Scholar]
- Pandit N. T.; Patravale V. B. Design and Optimization of a Novel Method for Extraction of Genistein. Indian J. Pharm. Sci. 2011, 73, 184–192. 10.4103/0250-474x.91583. [DOI] [PMC free article] [PubMed] [Google Scholar]
- Agrawal S. S.; Saxena S.; Sharma A. Phytoestrogen “Genistein:” Its Extraction and Isolation from Soybean. Seeds 2015, 7, 1121–1126. [Google Scholar]
Associated Data
This section collects any data citations, data availability statements, or supplementary materials included in this article.