Abstract
The objectives of this study were to review how conventional imaging for adrenocortical carcinoma has evolved over the past 100 years and to highlight the current role for computed tomography (CT) and magnetic resonance imaging (MRI). Using historical cases from the Mayo Clinic archives, the approaches to conventional imaging for adrenocortical carcinoma are described, and pertinent literature is reviewed. Limited conventional imaging options in the first 75 years of the twentieth century were supplemented with keen clinical observation and clinical intuition. With the development of CT and MRI, technologic advances in the computed image-based assessment of adrenocortical carcinoma have been truly remarkable. CT and MRI can help determine whether an adrenal mass is an adrenocortical carcinoma and can also assess for local tumor invasion and metastatic disease. CT and MRI provide the clinician and surgeon with key information to guide medical and surgical management. Three decades from now, what we currently view as conventional imaging (e.g., CT and MRI) will be the imaging equivalents to the plain abdominal roentogram and intravenous pyelogram of the mid-twentieth century.
Keywords: Adrenocortical carcinoma, Computed tomography, Magnetic resonance imaging
The past 100 years have been witness to the evolution of “conventional imaging” for adrenocortical carcinoma (ACC). Understanding these advancements provides the clinician with key perspectives on the current imaging of ACC. Conventional imaging is defined by the available technology of the day. Herein, the evolution of conventional imaging and the current use of computed tomography (CT) and magnetic resonance imaging (MRI) in the evaluation of patients with ACC are reviewed.
Historical Perspective
Conventional imaging has advanced from plain roentograms of the abdomen to aortography, perirenal insufflation of gas, and excretory urography (intravenous pyelogram with linear tomography). Before the development of CT and MRI, clinicians relied heavily on clinical acumen to guide medical decision-making. Two cases were selected from the Mayo Clinic archives to demonstrate the state of adrenal imaging for ACC in the 1930s and 1940s.
Patient 1
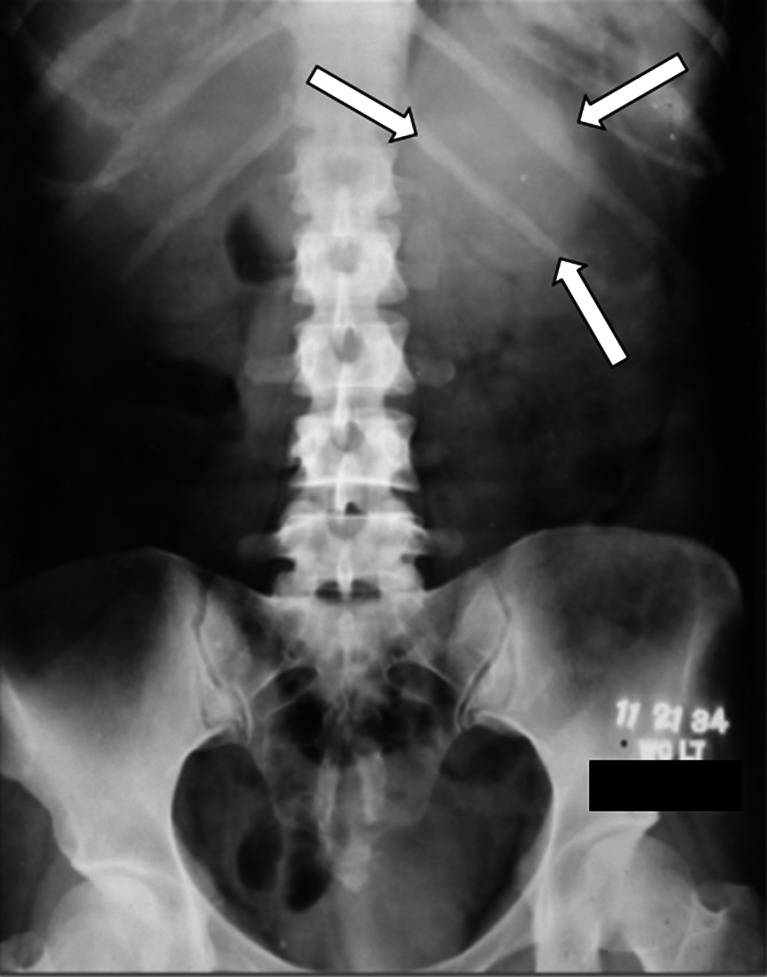
In November 1934, a 33-year-old woman presented with a 3-month history of rapidly progressive hirsutism, acne, and facial fullness. On physical examination, her Mayo Clinic physician detected a large mass in the left upper quadrant of the abdomen. At that time, there was no way to measure androgens, glucocorticoids, or estrogens. The only available imaging was a plain roentogram of the abdomen (Fig. 1). The radiologist reported a “possible shadow of greater density above the left kidney…over area of last 2 ribs on the left side.” The clinician wrote in the medical record, “Think we can make an unqualified diagnosis of left adrenal tumor (probably adenocarcinoma) with suprarenal cortical syndrome.” A large (15 cm, 1,050 g) left ACC was resected. The patient died 14 months later despite radiation therapy to the tumor bed.
Fig. 1.
A plain abdominal roentogram from 1934 demonstrating a subtle left upper abdominal mass (arrows) in a patient with left adrenal cortical carcinoma
Patient 2
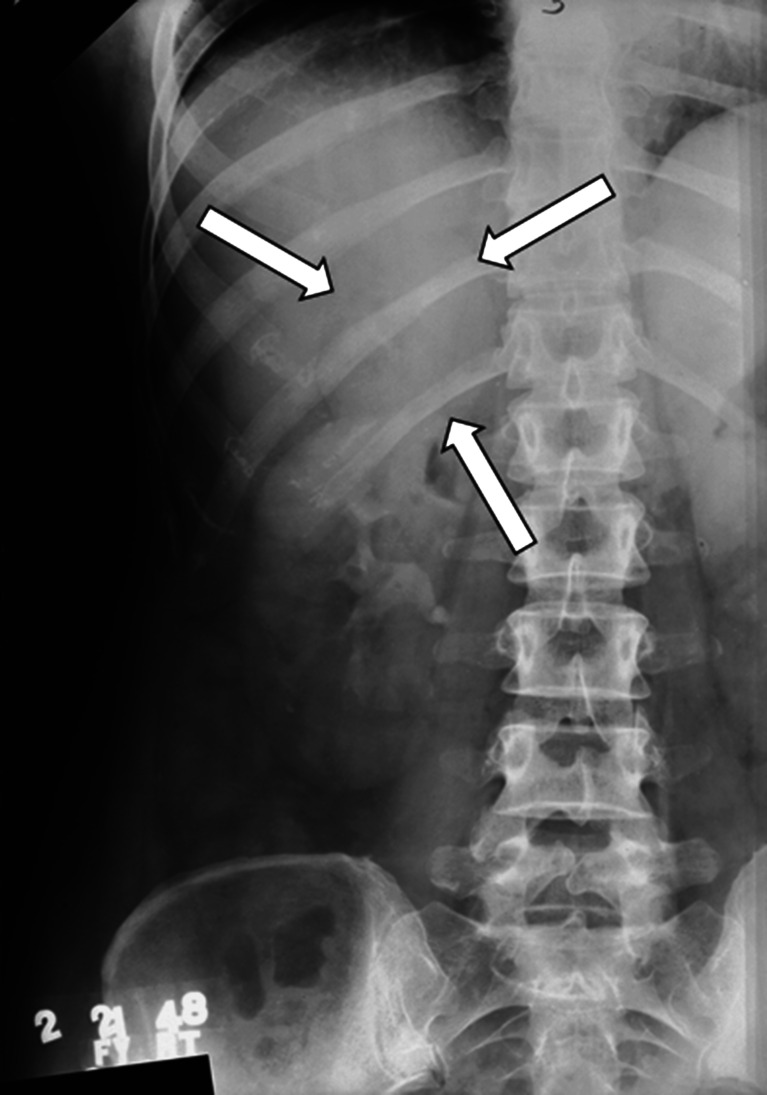
In February 1948, a 42-year-old woman presented with abrupt onset of hirsutism, acne, and facial fullness. On physical examination, her Mayo Clinic physician detected a firm mass in the right upper quadrant of the abdomen. A 24-h urine collection was obtained for the measurement of 17-ketosteroids, which were within the reference range. A plain roentogram of the abdomen was normal. An excretory urogram (intravenous pyelogram) was performed (Fig. 2), and the radiologist reported, “adjacent to the superior pole of the kidney there is a soft tissue mass 6 cm by 5 cm in diameter, which seems to be displacing the kidney downward…[consistent with]…tumor of the right suprarenal gland.” The clinician wrote in the medical record, “With virtually indisputable x-ray evidence of a mass above the right kidney, she should have an adrenal cortical tumor in spite of low 17-ketosteroids.” A right ACC was resected. Ten months later, the patient died of metastatic disease.
Fig. 2.
An excretory urogram (intravenous pyelogram) from 1948 demonstrating a subtle right adrenal mass (arrows) displacing the right kidney downward in a patient with right adrenal cortical carcinoma
Preoperative imaging of the adrenal glands was revolutionized with the clinical availability of body CT in the mid-1970s and body MRI in the early 1980s.
Adrenal CT
The methodology of CT involves acquiring and reconstructing an image of a thin cross section of the body. By rotating both the x-ray tube and the detectors around the patient, multiple measurements of x-ray attenuation are obtained through the plane of a finite thickness in a cross-section format of the body. The three-dimensional body structures are compressed onto a two-dimensional recording system. A digital image is reconstructed in which each pixel (picture element) represents the mean attenuation of a voxel—a box-like structure that extends through the thickness of the section. The field of view (FOV) is the area that is included in the image reconstruction. The scan FOV is the body anatomy that is included in the image reconstruction. The scan FOV determines the physical dimensions of each pixel. For example, the pixel dimensions are approximately 0.2 mm for a 10-cm FOV in a 512 × 512 matrix. The larger the FOV, the larger the pixel dimensions, and image resolution is lost.
Scan time (or gantry rotation speed) is the amount of time it takes for the CT gantry to rotate once around the patient. Scan times improved with the development of helical or spiral CT scanners—data are acquired continuously through multiple complete gantry rotations while the CT table is moved in and out of the gantry. With the sixth generation single-row detector CT (SDCT), a typical scan time is 1 s. With seventh generation multiple-row detector CT (MDCT), the scan time is less than 400 ms. The faster the scan time, the less image distortion is created by involuntary body movements. MDCT, available since 1998, can obtain a large number of thin slices that provide high spatial resolution in the longitudinal and axial directions.
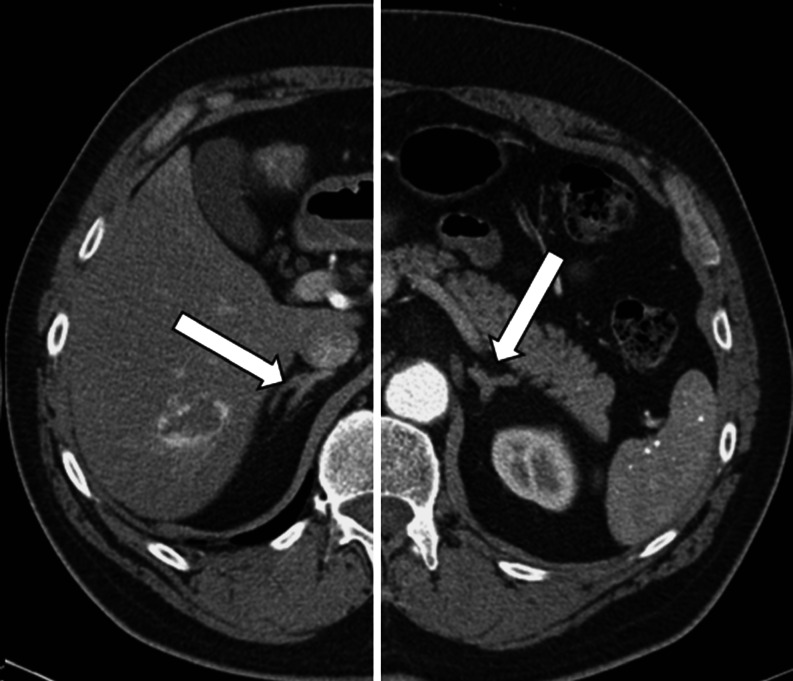
Abdominal CT is the primary imaging modality for adrenal disease because of widespread availability, excellent spatial resolution, and reproducibility. On the axial CT image, the right adrenal gland has the shape of an inverted letter V, and the left adrenal gland has the shape of an inverted letter Y (Fig. 3). The right adrenal gland is located medial to the right lobe of the liver, lateral to the right crus of the diaphragm, and posterior to the inferior vena cava. The lateral limb of the right adrenal gland extends more inferiorly than the medial limb, and it lies very close to the right lobe of the liver. In persons without much retroperitoneal fat, it may be difficult to see it as distinct from the surface of the liver. The left adrenal gland lies in the triangle between the aorta medially, the body and tail of the pancreas anteriorly, and the upper anterior pole of the left kidney inferiorly. The superior portion of the left adrenal gland abuts the splenic vessels. The superior–inferior length of normal adrenal glands can vary from 2 to 6 cm. The typical thickness of normal adrenal glands as imaged on CT is 5 to 6 mm and rarely exceeds 10 mm. Adrenal glands are typically imaged during breath-hold scans with 3-mm beam width and 3-mm slice thickness.
Fig. 3.
Contrast-enhanced computed tomography of normal adrenal glands. On this split axial computed tomographic image, the right adrenal gland (arrow) is located medial to the right lobe of the liver, lateral to the right crus of the diaphragm, and posterior to the inferior vena cava. The left adrenal gland (arrow) lies in the triangle between the aorta medially, the body and tail of the pancreas anteriorly, and the upper anterior pole of the left kidney inferiorly
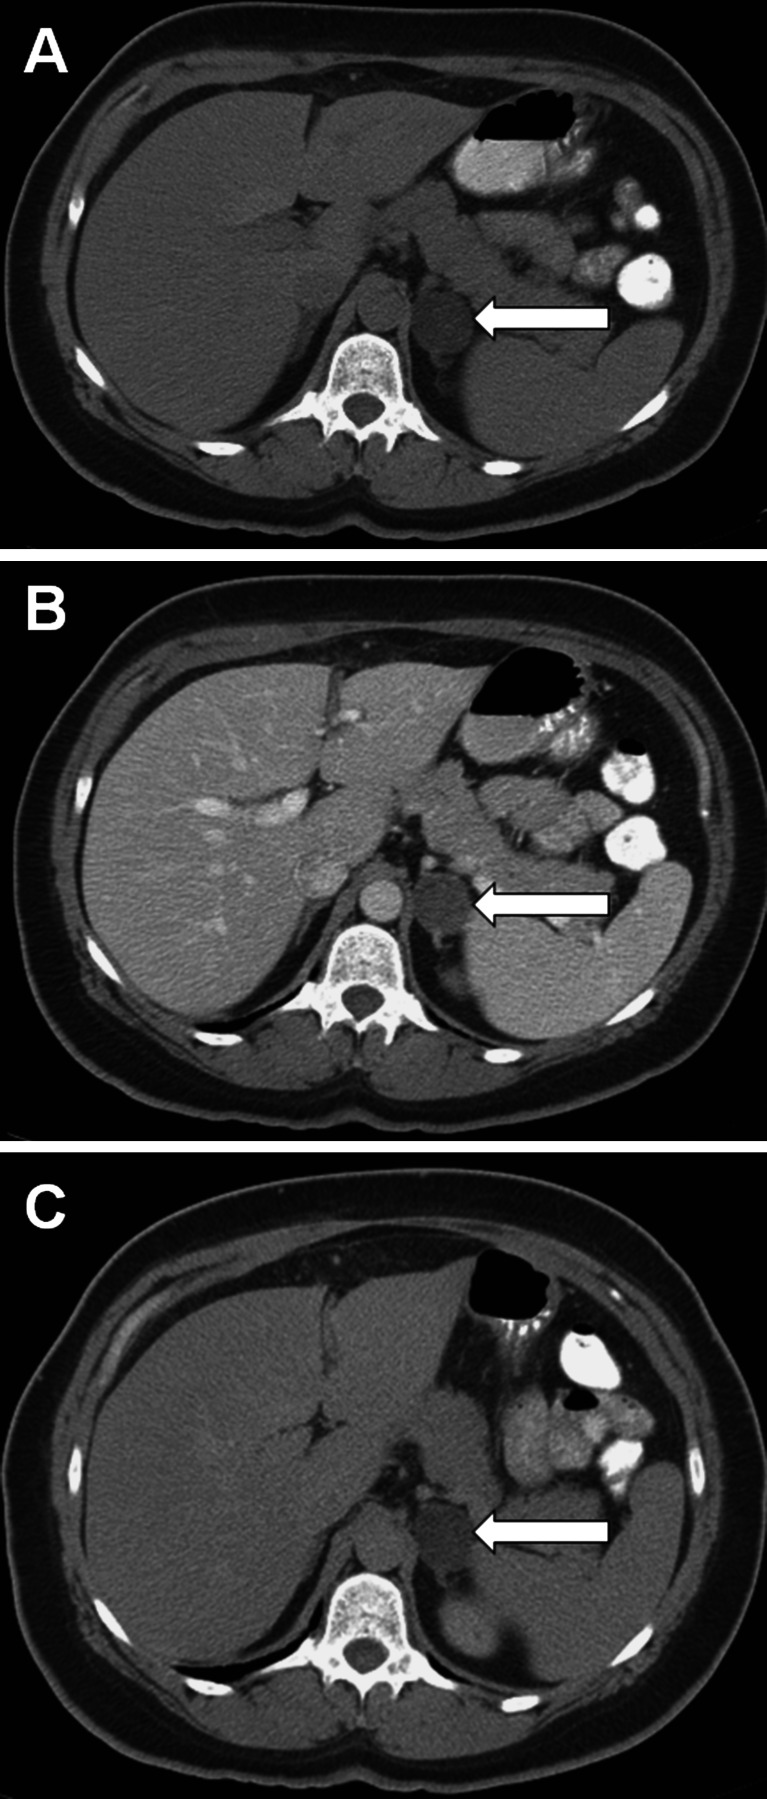
Unenhanced adrenal densitometry is useful in distinguishing benign cortical adenomas from other types of adrenal masses. Benign cortical adenomas typically contain more intracytoplasmic lipid (cholesterol, fatty acids, and neutral fat) than do malignant adrenal lesions. A noncontrast image is obtained first, and adrenal masses with Hounsfield unit (HU) densities less than 10 are consistent with lipid-rich benign cortical adenoma (sensitivity, 71%; specificity, 98%) (Fig. 4) [1]. Due to the high specificity of low CT attenuation, if lipid-rich adenoma is evident on noncontrast imaging, post-contrast imaging provides no incremental diagnostic information. If contrast-enhanced scans are performed, nonionic contrast (approximately 100 to 150 mL administered at a rate of 2 to 3 mL per second) is administered, and images are obtained 25 to 40 s after injection for an arterial or parenchymal phase scan and 70 s after injection for routine portal venous phase scan. If needed, a washout scan may be performed 10 to 15 min after contrast injection. If a baseline unenhanced image is not obtained, the relative percentage of contrast washout is calculated as: enhanced attenuation value at 70 s minus the delayed enhanced value at 10 to 15 min, divided by the enhanced attenuation value at 70 s. If a baseline unenhanced image is obtained, the absolute enhancement washout is calculated as: enhanced attenuation value at 70 s minus the delayed enhancement value at 10 to 15 min, divided by enhanced attenuation value at 70 s minus the unenhanced attenuation value (Fig. 4). Relative contrast washout more than 50% or absolute contrast washout more than 60% is consistent with benign adenoma (sensitivity, 56–100%; specificity, 98–100%) [2, 3]. Thus, most adrenal adenomas are homogenous and have low CT attenuation and rapid contrast washout (Fig. 4).
Fig. 4.
Computed tomographic scan of the abdomen of a 56-year-old woman with an incidentally discovered, 2.5-cm, benign, lipid-rich left adrenal adenoma. a Unenhanced, b contrast-enhanced, c 15-min delayed. The attenuation values were −5, 50, and 12 HU, respectively, with an absolute contrast washout of 69%
Radiation Exposure
When treating a neoplasm with ionizing radiation, the measure of energy deposited in a tissue is called the “absorbed dose,” and the energy absorbed per unit of mass is measured in the SI unit grays (Gy)—where 1 Gy equals 1 J of radiation energy absorbed per kilogram. In the past, treatment-related radiation exposure was expressed in rad (1 Gy = 100 rad). The radiation exposure from the environment or diagnostic x-rays is expressed in sieverts (Sv) (which for x-rays is numerically equivalent to gray). Sievert units are used when radiation dose distributions are not homogeneous (e.g., with medical imaging) and is an estimate of overall harm caused by radiation exposure. Roentgen equivalent man (rem) is the older unit of equivalent dose (1 Sv = 100 rem). Individuals in the USA receive about 3 mSv (300 mrem) of exposure from natural background radiation each year. A standard chest x-ray (PA and LAT) has an effective radiation dose of 0.16 mSv (16 mrem) [4]. A CT scan of the abdomen has an effective radiation dose of 10 mSv (1,000 mrem), and the total dose is increased to 20 mSv (2,000 mrem) if the CT scan is performed twice as part of an imaging package (e.g., with and without contrast administration) [4]. The effective radiation dose with MDCT is about 10% higher than with SDCT.
Adrenal MRI
Body MRI is based on spatially encoding a nuclear magnetic resonance signal where magnetic field gradients are used to vary the frequency and phase of the signal. Then images are reconstructed using mathematical algorithms to convert the nuclear magnetic resonance signals into spatial information. MRI is usually not the preferred imaging modality for adrenal disorders unless CT-iodinated contrast is contraindicated, exposure to radiation should be avoided (e.g., pregnant patients), or findings on CT are inconclusive. Normal adrenal glands and cortical adenomas have low-to-intermediate signal on T1- and T2-weighted imaging. Benign adrenal adenomas show a uniform low level of enhancement on gadolinium-enhanced images and rapid contrast washout.
The major advance for abdominal MRI imaging was the development of chemical shift imaging, which allows for detection of intracellular lipid in an adrenal mass. The MRI signal is produced from two main types of spinning protons—free water protons and fat protons. The net MRI signal comes from the sum of the protons; when fat and water protons are in phase, there is a higher signal. MRI identifies intracellular lipid because of the different resonant frequencies of fat and water protons in a given voxel—intravoxel fat–water signal cancelation. Thus, they cancel each other out during out-of-phase breath-hold gradient-echo MRI—termed “loss of signal.” With in-phase and opposed-phase T1-weighted scanning, the breath-hold, two-dimensional spoiled gradient-recalled echo technique is obtained with 4- to 5-mm slice thickness and 0-mm gap. The sensitivity and specificity of chemical shift imaging for benign adrenal adenoma are 81% to 100% and 94% to 100%, respectively [5–7]. If findings on chemical shift imaging are not consistent with a cortical adenoma, then pregadolinium and postgadolinium dynamic, multiphasic, three-dimensional spoiled gradient echo imaging with fat suppression can be performed. Contrast washout on MRI provides similar information to that found on CT—a maneuver first reported with MRI [8]. In addition to the axial images, coronal T1- and T2-weighted images following contrast administration can be helpful in the evaluation of large adrenal masses and impact on adjacent anatomy.
CT and MRI in ACC
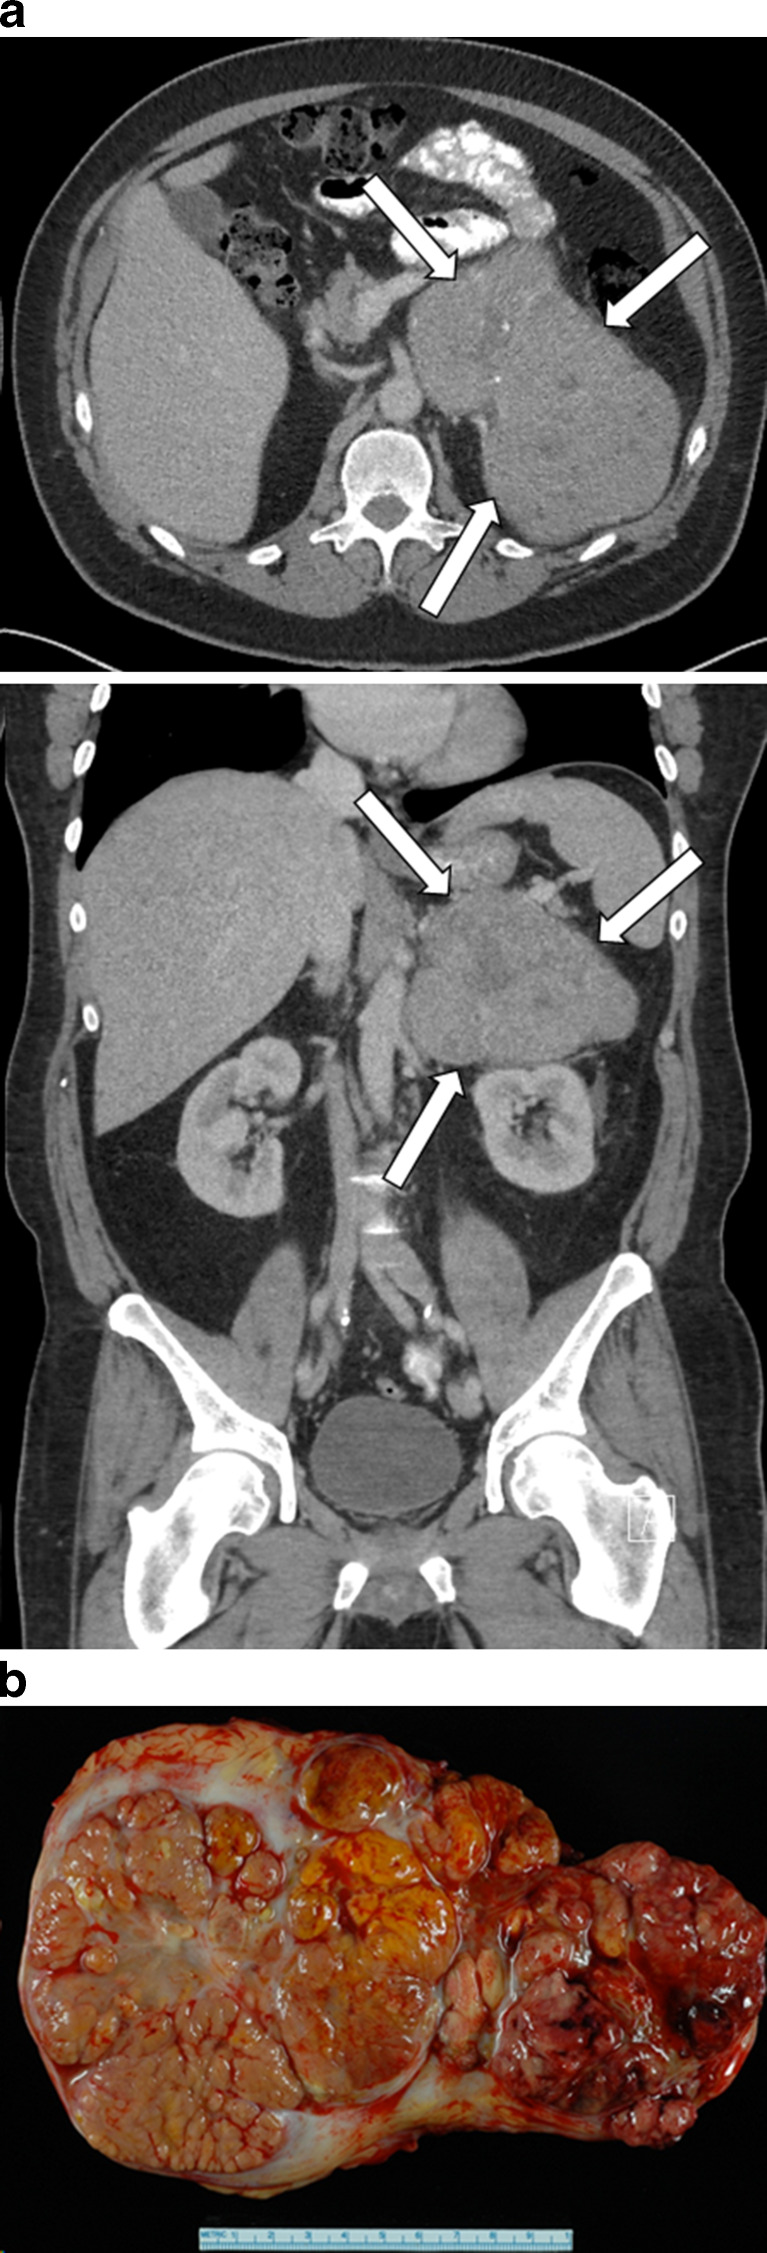
CT and MRI are relatively equivalent imaging modalities in distinguishing between benign and malignant adrenal masses [9]. In the setting of ACC, CT and MRI usually show a large (5–20 cm) mass that occupies the adrenal and periadrenal regions (Fig. 5). Imaging features of ACC include heterogeneity with areas of hemorrhage and necrosis, irregular margins, inhomogeneous contrast enhancement of solid components, and occasional calcifications (Fig. 5) [10–12]. Approximately 90% of ACCs are larger than 6 cm at the time of imaging [13]. Calcifications are more easily seen with CT than MRI. Hepatic, lymph node, and pulmonary metastases are common (Fig. 6). Associated tumor thrombus may be evident in the renal vein or inferior vena cava in up to 25% of patients (Fig. 7) [14]. Thus, in patients with known or suspected ACC, it is important to extend the images up through the base of the heart to assess for the presence of vena caval tumor thrombus and to image the lungs for possible pulmonary metastases (Fig. 6). In the setting of ACC, the unenhanced attenuation values on CT are usually more than 30 HU [15, 16]. With contrast administration, ACCs have heterogeneous enhancement. In general, the percentage contrast washout at 10 min is less than 50% [15, 16]; however, percentage contrast washout varies depending on which part of the mass is sampled.
Fig. 5.
a Axial computed tomographic image (top) and coronal computed tomographic image (bottom) of an incidentally discovered, 16 × 14 × 11-cm, nonfunctioning left adrenocortical carcinoma in a 49-year-old man. Computed tomography demonstrates heterogeneous areas, irregular margins, inhomogeneous contrast enhancement, and small calcifications. The precontrast attenuation was greater than 30 HU, and contrast washout was less than 50% at 15 min. b Gross pathology cut section. The tumor measured 19.8 × 12.3 × 8.8 cm, and findings on pathologic examination were consistent with adrenal cortical carcinoma. The patient was treated with adjuvant mitotane therapy and is alive without imaging evidence of recurrent disease 11 months postoperatively
Fig. 6.
Axial computed tomographic images of a 65-year-old man with nonfunctioning adrenocortical carcinoma. The top image shows an 18.7 × 13.1 × 15.1-cm left adrenal mass (arrows). The bottom image shows bilateral metastatic disease (arrows) to the lungs
Fig. 7.
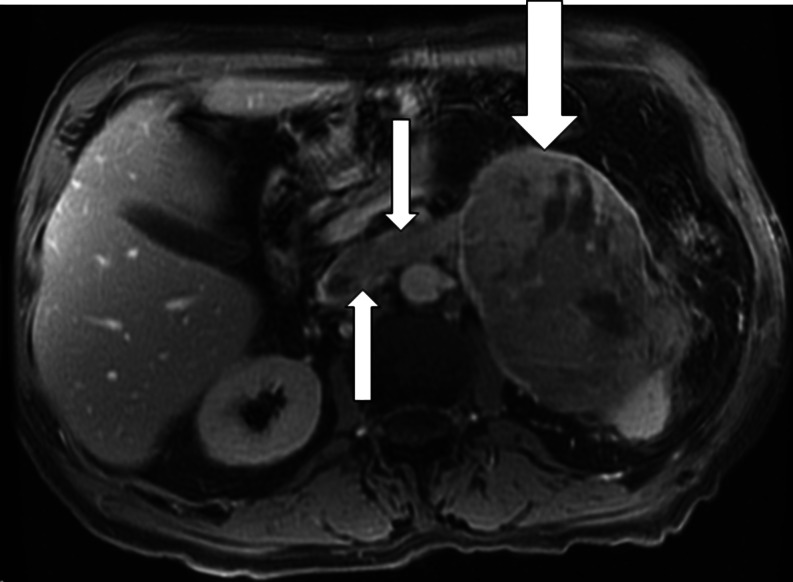
T2-weighted axial magnetic resonance image from a 72-year-old man with adrenocortical carcinoma. The left adrenal mass (large arrow) measures 12 × 8 × 8.7 cm, with tumor thrombus extending into the left adrenal and renal veins (small arrows). Three months after resection of this 330-g adrenocortical carcinoma, the patient died of diffuse metastatic disease
With MRI, ACC—heterogeneous on both T1- and T2-weighted images—has lower signal intensity on T1-weighted images and higher signal intensity on T2-weighted images than the liver; areas of hemorrhage have hyperintense signal on both T1- and T2-weighted images. However, ACC can contain foci of intracytoplasmic lipid, so that some areas within the tumor may have signal loss on out-of-phase imaging. MRI is superior to ultrasonography and CT in accurately identifying ACC tumor extension into the inferior vena cava (Fig. 7) [17].
Conclusion
Findings on CT and MRI are key in distinguishing between benign and malignant adrenal masses. ACC is usually a large (5–20 cm) mass with areas of hemorrhage and necrosis, irregular margins, and occasional calcifications. Unenhanced attenuation values on CT are usually more than 30 HU, and with contrast administration, ACCs have heterogeneous enhancement and slow contrast washout. Associated tumor thrombus may be evident in the renal vein or inferior vena cava in up to 25% of patients. CT and MRI provide the clinician and surgeon with key information to guide the medical and surgical management of ACC. A historical perspective is important. As technology advances over the next 30 years, imaging for ACC will continue to evolve. In the future, the CT and MRI of today will be regarded as primitive approaches to imaging for ACC—just as we currently view plain abdominal roentogram and intravenous pyelogram.
Acknowledgments
This paper was presented in part at the Third International Adrenal Cancer Symposium, Würzburg, Germany, February 17–19, 2011.
Disclosure
The author has no multiplicity of interest to disclose.
Abbreviations
- ACC
Adrenocortical carcinoma
- CT
Computed tomography
- FOV
Field of view
- Gy
Gray
- HU
Hounsfield units
- MDCT
Multiple-row detector CT
- MRI
Magnetic resonance imaging
- rem
Roentgen equivalent man
- SDCT
Single-row detector CT
- Sv
Sievert
References
- 1.Boland GW, Lee MJ, Gazelle GS, Halpern EF, McNicholas MM, Mueller PR. Characterization of adrenal masses using unenhanced CT: an analysis of the CT literature. AJR Am J Roentgenol. 1998;171(1):201–204. doi: 10.2214/ajr.171.1.9648789. [DOI] [PubMed] [Google Scholar]
- 2.Blake MA, Kalra MK, Sweeney AT, Lucey BC, Maher MM, Sahani DV, et al. Distinguishing benign from malignant adrenal masses: multi-detector row CT protocol with 10-minute delay. Radiology. 2006;238(2):578–585. doi: 10.1148/radiol.2382041514. [DOI] [PubMed] [Google Scholar]
- 3.Sangwaiya MJ, Boland GW, Cronin CG, Blake MA, Halpern EF, Hahn PF. Incidental adrenal lesions: accuracy of characterization with contrast-enhanced washout multidetector CT–10-minute delayed imaging protocol revisited in a large patient cohort. Radiology. 2010;256(2):504–510. doi: 10.1148/radiol.10091386. [DOI] [PubMed] [Google Scholar]
- 4.Brenner DJ, Hall EJ. Computed tomography–an increasing source of radiation exposure. N Engl J Med. 2007;357(22):2277–2284. doi: 10.1056/NEJMra072149. [DOI] [PubMed] [Google Scholar]
- 5.Outwater EK, Siegelman ES, Radecki PD, Piccoli CW, Mitchell DG. Distinction between benign and malignant adrenal masses: value of T1-weighted chemical-shift MR imaging. AJR Am J Roentgenol. 1995;165(3):579–583. doi: 10.2214/ajr.165.3.7645474. [DOI] [PubMed] [Google Scholar]
- 6.Israel GM, Korobkin M, Wang C, Hecht EN, Krinsky GA. Comparison of unenhanced CT and chemical shift MRI in evaluating lipid-rich adrenal adenomas. AJR Am J Roentgenol. 2004;183(1):215–219. doi: 10.2214/ajr.183.1.1830215. [DOI] [PubMed] [Google Scholar]
- 7.Haider MA, Ghai S, Jhaveri K, Lockwood G. Chemical shift MR imaging of hyperattenuating (>10 HU) adrenal masses: does it still have a role? Radiology. 2004;231(3):711–716. doi: 10.1148/radiol.2313030676. [DOI] [PubMed] [Google Scholar]
- 8.Krestin GP, Steinbrich W, Friedmann G. Adrenal masses: evaluation with fast gradient-echo MR imaging and Gd-DTPA-enhanced dynamic studies. Radiology. 1989;171(3):675–680. doi: 10.1148/radiology.171.3.2717737. [DOI] [PubMed] [Google Scholar]
- 9.Yip L, Tublin ME, Falcone JA, Nordman CR, Stang MT, Ogilvie JB, et al. The adrenal mass: correlation of histopathology with imaging. Ann Surg Oncol. 2010;17(3):846–852. doi: 10.1245/s10434-009-0829-2. [DOI] [PubMed] [Google Scholar]
- 10.Dunnick NR, Heaston D, Halvorsen R, Moore AV, Korobkin M. CT appearance of adrenal cortical carcinoma. J Comput Assist Tomogr. 1982;6(5):978–982. doi: 10.1097/00004728-198210000-00020. [DOI] [PubMed] [Google Scholar]
- 11.Fishman EK, Deutch BM, Hartman DS, Goldman SM, Zerhouni EA, Siegelman SS. Primary adrenocortical carcinoma: CT evaluation with clinical correlation. AJR Am J Roentgenol. 1987;148(3):531–535. doi: 10.2214/ajr.148.3.531. [DOI] [PubMed] [Google Scholar]
- 12.Hedican SP, Marshall FF. Adrenocortical carcinoma with intracaval extension. J Urol. 1997;158(6):2056–2061. doi: 10.1016/S0022-5347(01)68152-7. [DOI] [PubMed] [Google Scholar]
- 13.Copeland PM. The incidentally discovered adrenal mass. Ann Intern Med. 1983;98(6):940–945. doi: 10.7326/0003-4819-98-6-940. [DOI] [PubMed] [Google Scholar]
- 14.Chiche L, Dousset B, Kieffer E, Chapuis Y. Adrenocortical carcinoma extending into the inferior vena cava: presentation of a 15-patient series and review of the literature. Surgery. 2006;139(1):15–27. doi: 10.1016/j.surg.2005.05.014. [DOI] [PubMed] [Google Scholar]
- 15.Szolar DH, Korobkin M, Reittner P, Berghold A, Bauernhofer T, Trummer H, et al. Adrenocortical carcinomas and adrenal pheochromocytomas: mass and enhancement loss evaluation at delayed contrast-enhanced CT. Radiology. 2005;234(2):479–485. doi: 10.1148/radiol.2342031876. [DOI] [PubMed] [Google Scholar]
- 16.Slattery JM, Blake MA, Kalra MK, Misdraji J, Sweeney AT, Copeland PM, et al. Adrenocortical carcinoma: contrast washout characteristics on CT. AJR Am J Roentgenol. 2006;187(1):W21–W24. doi: 10.2214/AJR.04.1751. [DOI] [PubMed] [Google Scholar]
- 17.Tucci S, Jr, Martins AC, Suaid HJ, Cologna AJ, Reis RB. The impact of tumor stage on prognosis in children with adrenocortical carcinoma. J Urol. 2005;174(6):2338–2342. doi: 10.1097/01.ju.0000180645.89054.fd. [DOI] [PubMed] [Google Scholar]


