

Abstract
Ovarian cancer has a high mortality rate due, in part, to the lack of early detection and incomplete understanding of the origin of the disease. The hen is the only spontaneous model of ovarian cancer and can therefore aid in the identification and testing of early detection strategies and therapeutics. Our aim was to combine the use of the hen animal model and microarray technology to identify differentially expressed genes in ovarian tissue from normal hens compared with hens with ovarian cancer. We found that the transcripts up-regulated in chicken ovarian tumors were enriched for oviduct-related genes. Quantitative real-time PCR and immunohistochemistry confirmed expression of oviduct-related genes in normal oviduct and in ovaries from hens with early- and late-stage ovarian tumors, but not in normal ovarian surface epithelium. In addition, one of the oviduct-related genes identified in our analysis, paired box 2 has been implicated in human ovarian cancer and may serve as a marker of the disease. Furthermore, estrogen receptor 1 mRNA is over-expressed in early-stage tumors, suggesting that expression of the oviduct-related genes may be regulated by estrogen. We have also identified oviduct-related genes that encode secreted proteins that could represent putative serum biomarkers. The expression of oviduct-related genes in early-stage tumors is similar to what is seen in human ovarian cancer, with tumors resembling normal Müllerian epithelium. These data suggest that chicken ovarian tumors may arise from alternative sites, including the oviduct.
Electronic supplementary material
The online version of this article (doi:10.1007/s12672-010-0024-8) contains supplementary material, which is available to authorized users.
Keywords: Ovarian cancer, Microarray, Animal model, Hen
Introduction
Ovarian cancer is the fifth leading cause of cancer death in American women and the leading cause of death from gynecologic cancer [1]. In 2009, the American Cancer Society estimated that greater than 14,000 women died from the disease. The high mortality rate is due, in part, to limited early detection strategies and incomplete understanding of the origin of the disease.
Gene expression profiling studies using DNA-microarray technology can advance the understanding of the etiology and progression of ovarian cancer. The use of such technology has made it possible to analyze the expression of genes in small samples of tumor tissue on a global level. Thus far, gene expression profiling has provided prognostic and classification information, as well as predictions of responsiveness to chemotherapeutics [2]. Further insights gained from these types of studies could eventually enhance the clinical management of the disease by providing potential markers for early diagnosis as well as novel therapeutic strategies.
The hen is the only spontaneous animal model of ovarian cancer and can therefore aid in the identification and testing of early detection strategies and therapeutics. Hens have a high incidence of ovarian cancer and, similar to women, this incidence increases with age [3]. Several studies have reported that ovarian tumors of the hens express antigens that are frequently expressed in human ovarian tumors including cytokeratin, EGFR, HER-2/neu, COX-1, VEGF, and E-cadherin [4–9]. Barua et al. found that chicken tumors resemble all four phenotypes found in women, with serous and endometrioid tumors present at about equal frequencies [10]. A recent study also showed that approximately half of ovarian tumors in the hen exhibit mutations in p53 similar to ovarian adenocarcinomas in women [9].
These studies and others have demonstrated the usefulness of the hen as a model to study the etiology and progression of ovarian cancer. However, no studies to date have examined global gene expression in ovarian cancer of the hen. To this end, we combined the use of the hen animal model with microarray technology to identify differentially expressed genes in ovarian tissue from normal hens compared with hens with ovarian cancer. One advantage of this approach is that differentially expressed genes identified can be evaluated in early-stage tumors, providing information about changes that occur during early neoplastic events. We also evaluated expression of particular genes at different stages to assess changes associated with tumor progression.
Materials and Methods
Animals and Tissue Collection
Single-comb White Leghorn hens were individually caged with access to food and water ad libitum. Hens were maintained on a 15 h light and 9 h dark schedule. All animal procedures were approved by the Institutional Animal Care and Use Committee of Cornell University.
Normal ovarian tissue samples and ovarian tumor tissue samples from 2.5 to 4.5-year-old hens were collected and either frozen in liquid nitrogen or placed in RNAlater [11]. Additional samples were placed in cassettes in formalin for paraffin embedding for immunohistochemical analysis. Diagnosis of hens was made by gross observation and confirmed by analysis of hematoxylin-and-eosin-stained paraffin-embedded sections. Ovarian tumors were staged as previously described [11] (Table 1).
Table 1.
Stages of ovarian cancer in the hen [11]
| Stage | Description |
|---|---|
| 1 | Tumor restricted to ovary and only detectable by histology |
| 2 | Tumor restricted to ovary and observable at necropsy |
| 3 | Ovarian tumor with abdominal seeding |
| 4 | Ovarian tumor with abdominal seeding and ascites |
Microarray Analysis
Hens used for microarray analysis were between 2.5 and 3.5 years of age. Normal hens (n = 3) showed no gross or histopathological evidence of ovarian cancer, while cancer specimens (n = 3) were stage 2 or 3 (Table 1). Total RNA was extracted from the frozen normal ovarian tissue and ovarian tumor tissue using TRIZOL (Invitrogen, Carlsbad, CA), and RNA integrity was verified using the 2100 Expert Bioanalyzer (Agilent Technologies, Santa Clara, CA). Linear amplification and labeling were carried out to produce an antisense RNA (aRNA) target. The labeled aRNA was hybridized to GeneChip® chicken genome arrays (Affymetrix, Santa Clara, CA) and scanned by the GeneChip scanner 3000-7 G. Analysis of the raw data (including the .CEL files) was carried out at the DNA-microarray core facility (Cornell University, Ithaca, NY) using the Affymetrix GCOS software. A set of 273 differentially expressed genes was selected based on a t test p-value less than 0.01 and fold change greater than 1.5. These data have been deposited in the Gene Expression Omnibus (GEO) public repository (accession number GSE21706). Functional annotation analysis was subsequently carried out using DAVID Bioinformatics Resources 2008 [12, 13].
Real-Time Quantitative PCR
Total RNA was extracted from normal hen ovarian tissue (n = 8), ovarian tissue from hens with stage 1 (n = 3), stage 2 (n = 2), stage 3 (n = 6), and stage 4 (n = 7) tumors using the RNeasy Mini kit (Qiagen, Valencia, CA). Extracted RNA was reverse-transcribed into cDNA, and the cDNA was used for quantitative polymerase chain reaction (PCR) with SYBR Green to determine mRNA expression levels of several genes selected for further study based on the functional annotation analysis of microarray data (DAVID). These were the oviduct-related genes: Serpinb14, more commonly known as ovalbumin (Oval), paired box 2 (Pax2), ovomucoid (Ovm), Serpinb14b, more commonly known as serpin peptidase inhibitor clade B member 3 (Serpinb3), transferrrin, also known as lactotransferrin (Ltf), and LOC396449 which encodes riboflavin binding protein (RD). Chicken-specific primers (designed to span introns) were designed using OligoPerfect™ Designer (Invitrogen, Carlsbad, CA) or Primer Express software v2.0 (Applied Biosystems, Foster City, CA). The oligonucleotide sequences of primers are listed in Table 2. Control reagent was Quantum RNA Universal 18S primers (Ambion, Austin, TX). Control reactions containing no template and reactions lacking reverse transcriptase were also run. Total volume of reactions was 25 uL with a final concentration of ×1 Power SYBR Green PCR Master Mix (Applied Biosystems, Foster City, CA), 0.3 nM of primer pairs for the oviduct-related genes, and 0.1 nM of primer pairs for 18S. All sample reactions were run in duplicate using the ABI Prism 7,000 Sequence Detection System. The relative amount of mRNA in a particular sample was determined by the comparative threshold cycle (Ct) method using Sequence Detection System software (Applied Biosystems, Foster City, CA).
Table 2.
Primers used for real-time quantitative PCR analysis
| Gene | Gene accession no. | Forward primer | Reverse primer | Probe |
|---|---|---|---|---|
| OVAL | NM_205152 | cacaagcaatgcctttcaga | gacttcatcaggcaacagca | N/A |
| OVM | NM_001112662 | tcgtgctgttctctttcgtg | taggcacacagcaagcaatc | N/A |
| SERPINB3 | NM_001031001 | ggggcaagaggtaacactga | gtagcatttggcctggtgat | N/A |
| LTF | NM_205304 | ctacagtgccatccagagca | tgatgcagtcctttgtctg | N/A |
| RD | NM_205463 | gcctgcaaagatgattccat | gccaccatgtccttccttgtt | N/A |
| PAX2 | NM_204793 | cgagtttttgagcgtccttc | aaggtggtgcttgccatatc | N/A |
| ESR1 | NM_205183 | cagcattcgtgagaggatgtcta | acagtaccgggtctccttggt | taccaatgagaaagggagcctgtccatg |
| ESR2 | NM_204794 | ggaaatgctatgaagtgggaatg | acagtaccgggtctccttggt | tgggtatcgaatcctgcgcc |
Laser Capture Microdissection
Hens with early-stage (stage 1, as defined in Table 1) ovarian cancer were identified by analyzing paraffin-embedded sections that were stained with hematoxylin and eosin. Ovarian samples from these hens had also been embedded in Histo Prep (Fisher Scientific, Pittsburgh, PA) and snap-frozen in cryomolds. Frozen sections of ovary from these hens (n = 5) as well as sections of ovary and oviduct from normal hens (n = 5) were cut, placed on PEN-membrane slides (Leica Microsystems, Wetzler, Germany), stained briefly with hematoxylin, and processed in a solution of 70% ethanol. Slides were allowed to dry before laser capture of tissue. Normal oviduct, ovarian epithelial cells (OSE), tumor, and adjacent stromal tissue were captured using a laser capture microdissecting scope (Leica ASLMD, Leica Microsystems, Wetzler, Germany). Total RNA was extracted using the RNeasy Plus Micro kit (Qiagen, Valencia, CA) and was reverse-transcribed into cDNA. As described previously, the cDNA was used for quantitative PCR with SYBR Green to determine mRNA expression levels of the oviduct-related genes Oval, Pax2, Ovm, Serpinb3, Ltf, and Rd.
Expression levels of estrogen receptor 1 (estrogen receptor alpha; Esr1) and estrogen receptor 2 (estrogen receptor beta; Esr2) were also determined in these samples. Briefly, chicken-specific TaqMan primers and probes were designed using Primer Express software v2.0 (Applied Biosystems, Foster City, CA). The sequences of primers and probes can be seen in Table 2. TaqMan primers and probes for 18S (Applied Biosystems, Foster City, CA) were used as control. Total volume of reactions was 25 uL with a final concentration of ×1 TaqMan Universal PCR Master Mix (Applied Biosystems, Foster City, CA), 900 nM of estrogen receptor primer pairs (Esr1 and Esr2), 50 nM of 18S primer pair, and each respective TaqMan probe (250 nM of estrogen receptor probes (Esr1 and Esr2) and 200 nM of 18S probe). All sample reactions were run in duplicate, and the relative amount of RNA in a particular sample was determined as described above.
Immunohistochemistry
Previously collected ovarian samples (n = 6 normal; n = 14 tumors of various stages) had been fixed in formalin, embedded in paraffin, and cut at 4 μm. Paraffin sections were deparaffinized and rehydrated through a series of treatments with xylene and ethanol. Sections were boiled in citrate buffer for antigen retrieval and blocked in 10% goat serum in phosphate-buffered saline (PBS) for 30 min. Sections were then incubated with mouse anti-chicken ovalbumin (Sigma-Aldrich, St. Louis, MO) at a dilution of 1:500 and rabbit anti-human PAX2 (Abcam, Cambridge, MA) at a dilution of 1:50 overnight at 4°C. Control slides were incubated without primary antibody. This was followed by incubation in AlexaFluor 594 goat anti-mouse IgG secondary antibody (0.24 ug/ml) for ovalbumin and AlexaFluor 488 goat anti-rabbit IgG (0.24 ug/ml) for PAX2 for 1 h at 39°C. Normal ovarian samples (n = 6) and ovarian samples from hens with stage 1 (n = 3), stage 2 (n = 2), stage 3 (n = 4), and stage 4 (n = 5) cancer were incubated with both primary antisera. Slides were viewed using a Nikon eclipse E600, and pictures were taken with a Spot RT Slider camera.
Statistics
Relative expression values from real-time quantitative PCR analysis were log-transformed and analyzed for significance using proc GLM. Means were compared using Duncan's multiple range tests. Relative expression of estrogen receptor in microdissected tumor compared with the adjacent stroma was analyzed using proc TTEST. All tests were carried out using SAS version 9.2 with a significance level of p < 0.05.
Results
Up-Regulated Transcripts in Ovarian Tumors Are Enriched for Oviduct-Related Genes
Out of >32,000 transcripts represented on the chicken GeneChip, 273 were differentially expressed between normal ovarian tissue and ovarian tissue from hens with cancer. Of these, 153 transcripts were up-regulated and 120 were down-regulated in tumor tissue. A full list of these genes can be accessed through GEO (accession number GSE21706). Figure 1 is a heat map of the top 25 up-regulated and down-regulated genes. This information has also been provided in table form as Supplementary Tables 1 and 2 for the top 25 up-regulated and down-regulated genes, respectively. Functional annotation analysis (DAVID) revealed that the up-regulated transcripts are enriched for genes that are normally expressed in the oviduct. Several of these genes are associated with the annotation keywords allergen and egg white, including Oval, Ovm, Ltf, Rd, and Serpinb3. A literature search revealed several more oviduct-related genes identified in our microarray analysis (including meleagrin, lysozyme, gallicin 11, and beta-defensin 12) and also confirmed that these genes encode proteins that are either expressed in the chicken oviduct [14] or secreted by oviductal cells to form membranes of the developing egg [15, 16]. Pax2 is expressed in the female reproductive tract, including the oviduct, and is required for Müllerian duct development [17]. In total, ten out of the top 25 up-regulated genes (40%) are oviduct-related. These oviduct-related genes are consistently up-regulated in all three ovarian tumors as compared with normal ovary (Fig. 1).
Fig. 1.

Gene profile of 50 differentially expressed genes in chicken ovarian tumors. The top 25 up- and down-regulated genes are depicted. Genes were identified by Affymetrix ID (Gene ID), gene symbol, and gene name. Each column represents a single sample. The shades of red indicate induced genes and the shades of green indicate the repressed genes. Colored pixels indicate the magnitude of gene response
Real-Time Quantitative PCR Confirms Increased Expression of a Subset of Oviduct-Related Genes in Ovarian Cancer of the Hen
Quantitative PCR was performed for a subset of the ten oviduct-related genes: Oval, Pax2, Ovm, Serpinb3, Ltf, and Rd. These genes were selected based on our ability to design intron-spanning primers. All of these genes exhibited significantly higher (p < 0.01) expression in tumor tissue (particularly later stages) as compared with normal tissue validating the microarray results (Fig. 2). Moreover, there was a stage-dependent increase in expression of these genes in the tumors. In all cases, expression was significantly greater in advanced tumors (stages 3 and 4) as compared with the earliest tumors (stage 1) or normal ovary (Fig. 2). Furthermore, several of the genes exhibited significantly higher expression in stage 2 tumors compared with normal ovary, including Oval, Pax2, Ovm, and Ltf (Fig. 2). The limited expression of these genes in stage 1 tumors could be due to the fact that samples from these tumors are composed primarily of normal tissue with only scattered areas of neoplasia.
Fig. 2.

Real-time quantitative PCR analysis of OVAL (a), PAX2 (b), OVM (c), SERPINB3 (d), LTF (e), and RD (f) mRNA expression in normal ovary (n = 8), as well as stage 1 (n = 3), stage 2 (n = 2), stage 3 (n = 6), and stage 4 (n = 7) ovarian cancer. Means were compared using Duncan's multiple range tests. Different letters indicate significant differences (p < 0.01). Means that share the same letters are not significantly different. Bars indicate standard error
Expression of Oviduct-Related Genes in Early-Stage Ovarian Cancer Compared with Normal Oviduct and OSE
In order to investigate expression of these genes in early-stage ovarian tumors, as well as in oviduct and OSE, we performed laser capture microdissection. Oviduct and OSE from normal hens, as well as from neoplastic areas and adjacent stromal tissue from stage 1 ovarian cancers were microdissected from frozen ovarian sections. Supplementary Fig. 1 shows representative images of the microdissected oviduct, OSE, cancer, and stromal tissue. Quantitative real-time PCR was performed for the oviduct-related genes: Oval, Pax2, Ovm, Serpinb3, Ltf, and Rd as above. These oviduct-related genes are generally expressed in normal oviduct and early-stage ovarian tumors, but not normal OSE (Fig. 3). Specifically, expression of Pax2 (p < 0.001; Fig. 3b), Serpinb3 (p < 0.05; Fig. 3d), Ltf (p < 0.01; Fig. 3e), and Rd (p < 0.05; Fig. 3f) mRNA are significantly greater in early tumors compared with adjacent stroma and/or normal OSE. There is also a trend for higher Oval and Ovm mRNA expression in early-stage tumors compared with the surrounding stroma and normal OSE (Fig. 3a, c).
Fig. 3.
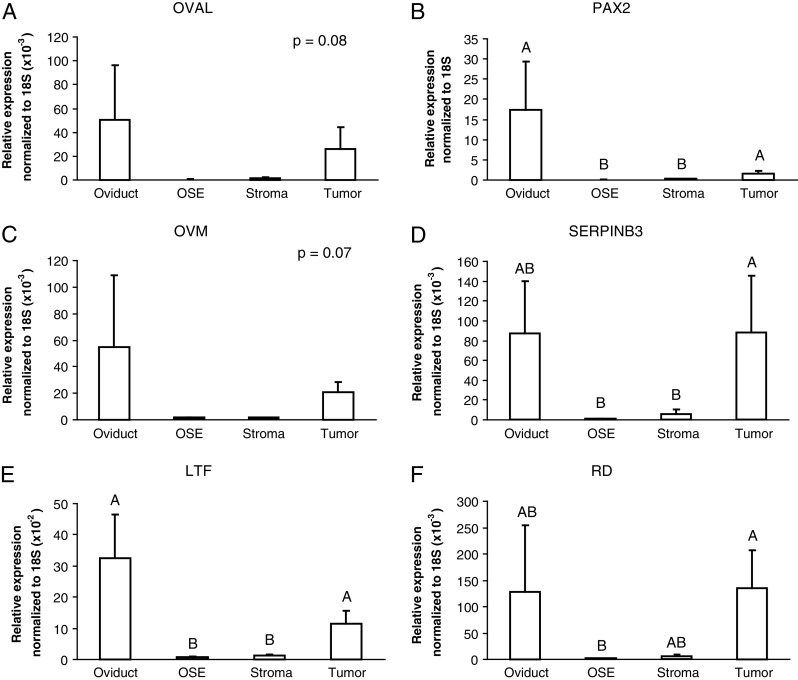
Real-time PCR analysis of OVAL (a), PAX2 (b), OVM (c), SERPINB3 (d), LTF (e), and RD (f) mRNA expression in microdissected oviduct (n = 5), OSE (n = 5), tumor (n = 5), and adjacent stroma (n = 5). Means were compared using Duncan's multiple range tests. Different letters indicate significant differences (p < 0.05). Means that share the same letter are not significantly different. Bars indicate standard error
Expression of Estrogen Receptors in Early-Stage Ovarian Cancer
We also determined expression of Esr1 and Esr2 in the microdissected neoplastic areas and adjacent stromal tissue. Relative expression of Esr1 mRNA was significantly higher in microdissected tumor tissue compared with adjacent stroma (p < 0.05; Fig. 4). Esr2 mRNA was not detectable in microdissected tumor or the adjacent stroma (data not shown).
Fig. 4.

Real-time PCR analysis of ESR1 mRNA expression in microdissected tumor (n = 5) and adjacent stroma (n = 5). Asterisk indicates significant difference (p < 0.05). Bars indicate standard error
Chicken Ovarian Tumors Express PAX2 Protein
Figure 5 illustrates that ovalbumin and PAX2 protein were expressed in early- (stage 1) and late-stage (stage 3) ovarian cancers of the hen. Ovalbumin and PAX2 protein expression were assessed in normal ovarian structures, including OSE, in normal ovaries and ovaries from hens with cancer. In addition, expression of ovalbumin and PAX2 was also determined in neoplastic areas in ovaries from hens with cancer. As expected, no ovalbumin expression was detected in normal ovary (Fig. 5a), but ovalbumin was expressed in an early-stage tumor while the surrounding stroma was negative (stage 1; Fig. 5c). As previously reported, ovalbumin expression was seen in a late-stage ovarian tumor (stage 3; Fig. 5e). There was little to no expression of PAX2 in the normal ovary (Fig. 5b). There was nuclear PAX2 expression localized to neoplastic cells in an early-stage tumor (Fig. 5d, arrow) and nuclear expression in a late-stage tumor (Fig. 5f). Control sections incubated without primary antibody were negative (insets Fig. 5a–f). Table 3 summarizes the results obtained for all of the ovarian tissue sections examined. All of the ovarian cancers expressed ovalbumin regardless of stage. Similar to ovalbumin, PAX2 was expressed in ovarian tumors of all stages, but fewer stage 4 tumors were positive.
Fig. 5.

Immunohistochemistry with antibodies against ovalbumin and PAX2. Ovalbumin protein expression in normal ovary (a), early-stage ovarian cancer (stage 1; c), and late-stage ovarian cancer (stage 3; e). PAX2 protein expression in normal ovary (b), early-stage ovarian cancer (stage 1; d), and late-stage ovarian cancer (stage 3; f). Arrow indicates area of neoplastic cells in the early-stage tumor (d). Control sections were incubated without primary antibody (insets a–f). Scale bar = 100 μm
Table 3.
Summary of ovalbumin and PAX2 protein expression in normal ovarian tissue (n = 6), and ovarian tissue from hens with stage 1 (n = 3), stage 2 (n = 2), stage 3 (n = 4), and stage 4 (n = 5) ovarian cancer
| Type | Ovalbumin + (%) | PAX2 + (%) |
|---|---|---|
| Normal | 0/6 (0) | 0/6 (0) |
| Stage 1 | 3/3 (100) | 2/3 (67) |
| Stage 2 | 2/2 (100) | 2/2 (100) |
| Stage 3 | 4/4 (100) | 3/4 (75) |
| Stage 4 | 5/5 (100) | 1/5 (20) |
Discussion
To our knowledge, we are the first to report analysis of gene expression of ovarian cancer in the hen on a global level. Through the current approach, we have identified genes that are differentially expressed in ovarian tissue from normal hens compared with tissue from hens with ovarian cancer. Furthermore, functional annotation analysis revealed that ten of the top 25 up-regulated genes (40%) in chicken ovarian tumors are oviduct-related. We have shown that these genes are expressed in early- and late-stage chicken ovarian tumors, as well as in the oviduct, but not OSE (Figs. 2 and 4), suggesting that chicken ovarian tumors resemble normal Müllerian epithelium, similar to tumors in women. Expression of oviduct-related genes in chicken, as well as human, ovarian tumors might be due to aberrant differentiation of OSE [18], or suggest alternative origins of these tumors including secondary Müllerian structures [19, 20] or the fallopian tubes [21], as has been proposed in women. The fallopian tubes have been proposed as the site of origin of type II ovarian tumors, which include high-grade serous carcinomas [22] that are characterized by p53 mutations and over-expression of the HER2/neu oncogene [23]. Interestingly, ovarian adenocarcinomas in the hen also exhibit mutations in p53 and over-expression of HER2/neu [9], resembling the high-grade serous carcinomas hypothesized to originate in the fallopian tubes in women.
Further evidence of a possible alternative site of origin of ovarian tumors comes from expression studies of paired box 2 (PAX2) in human ovarian tumors. Studies have shown that PAX2 mRNA and protein are expressed in the human reproductive tract and ovarian tumors [24, 25]. These studies also reported that OSE does not express PAX2 [24, 25]; however, one study did find expression of PAX2 in normal OSE [26]. PAX2 expression has been reported in both low-grade and high-grade ovarian tumors [24], although Tung et al. found that few high-grade ovarian tumors express PAX2 [25]. Although we did not evaluate PAX2 expression based on tumor grade, we did evaluate PAX2 expression in chicken ovarian tumors of all stages and found that fewer late-stage tumors express PAX2 protein (Table 3). Additionally, we have shown that PAX2 mRNA and protein are expressed in chicken ovarian tumors, but no Pax2 mRNA was detected in OSE (Fig. 3), although a few scattered positive cells were observed in the OSE by immunohistochemistry (Fig. 5). These results are generally supportive of an oviductal site of origin, but could indicate a role for de-differentiation of the OSE. We have also observed PAX2 mRNA and protein (Fig. 3 and Supplementary Fig. 2) expression in chicken oviduct, confirming that it is an oviduct-related protein. It is possible that PAX2 may be playing a role in the progression of ovarian cancer in the hen, since it has been shown to be required for human ovarian cancer cell survival [27]. Future studies are needed to elucidate the role of PAX2 in ovarian cancer of the hen. It should be noted that another PAX family member, PAX8, is similar to PAX2 in amino acid sequence and has also been implicated in the development of ovarian cancer [28]. PAX8 has yet to be identified in chicken, so it is not known how similar these sequences would be in the hen. We performed a BLAST search with the peptide sequence of the immunogen of our antibody and identified PAX2, but not PAX8, in the human. The BLAST search also identified PAX2 in other species, including the chicken. Therefore, assuming that chicken PAX8 exists and has a similar sequence to chicken PAX2 (as seen in humans), it is likely that our antibody is specific for PAX2.
Interestingly, a number of oviduct-related genes identified in our analysis are estrogen-regulated. It has long been known that estrogen is responsible for the differentiation of oviductal glands that synthesize the major egg-white proteins in the chicken oviduct [reviewed in 29]. Estrogen has been shown to have a direct effect on the synthesis of ovalbumin, lactotransferrin, ovomucoid, and lysozyme in the chicken oviduct [30]. In humans, PAX2 expression has also been shown to be activated by estrogen in endometrial cancer cells [31, 32]. Estrogen is thought to promote ovarian tumor progression by regulating cellular proliferation, motility, and invasion, and these effects are thought to be mediated by ESR1 [33]. We have shown that Esr1 mRNA expression is significantly higher in microdissected tumor tissue as compared with adjacent stroma (Fig. 4), suggesting that expression of the oviduct-related genes in these tumors may be regulated by estrogen.
As mentioned previously, some of the oviduct-related genes identified in our analysis encode proteins that are secreted by oviductal cells to form the membranes of the developing egg [15, 16]. The identification of up-regulated genes that encode secreted proteins in ovarian cancer provides the possibility of utilizing serum levels of these proteins as biomarkers for the malignancy. Several current and potential serum biomarkers of ovarian cancer in humans have been shown to be normally expressed in the oviduct including CA-125 [34], human epididymis protein 4 [35], and oviductal glycoprotein 1 [36, 37]. A number of the oviduct-related genes identified in chicken ovarian tumors encode proteins that are secreted and may represent serum biomarker candidates. In particular, the genes encoding PAX2, SERPINB3, LTF, and RD are expressed in early-stage chicken ovarian tumors (Fig. 3), suggesting these proteins may serve as putative early markers of the disease.
Our results support previous studies in the hen which reported increased expression of ovalbumin and E-cadherin in chicken ovarian tumors [8, 38]. Ovalbumin and E-cadherin are in the list of the top 25 up-regulated genes in ovarian tumor tissue compared with normal ovarian tissue with expression levels increased >200-fold and 40-fold, respectively (Supplementary Table 1). Our results also support previous studies in women which reported over-expression of E-cadherin [39] and claudin 3 [40] in human ovarian tumors. As mentioned previously, E-cadherin has been shown to be up-regulated in chicken ovarian tumors compared with normal ovarian tissue. Claudin 3 is also over-expressed in chicken ovarian tumors. Our microarray analysis revealed that it is in the top 25 up-regulated genes in chicken ovarian tumor tissue compared with normal ovarian tissue with expression levels increased >40-fold (Supplementary Table 1). In the current study, we focused on the genes up-regulated in ovarian tumors of the hen and have yet to study the down-regulated genes in depth. It is possible, however, that putative tumor suppressors have been uncovered in our results and further studies are warranted.
Our analysis has revealed up-regulation of oviduct-related genes in chicken ovarian tumors, particularly at early stages, compared with normal ovarian tissue. These results provide evidence that chicken ovarian tumors resemble normal Müllerian epithelium, similar to tumors in women and suggest a possible alternative site of origin of these tumors. Although we have not disproven the possibility of secondary Müllerian structures or the OSE as sites of origin, we hope that our data can stimulate additional work in this area. We have also shown that the oviduct-related genes may also be regulated by estrogen, highlighting the importance of estrogen-signaling in these tumors. In addition, a number of these genes are secreted and may prove to be possible serum biomarkers. Importantly, our studies further validate the use of the hen as a model for human ovarian cancer.
Electronic Supplementary Materials
Below is the link to the electronic supplementary material.
(PDF 118 kb)
Immunohistochemistry with PAX2 antibody. Nuclear PAX2 protein expressionin chicken oviduct (A). No PAX2 protein expression in the control section (B). Paraffin embeddedsections of oviduct (n=3) were boiled in citrate buffer for antigen retrieval and blocked in 10% goat serumin PBS for 30 min. Sections were then incubated with rabbit anti-human PAX2 (Abcam, Cambridge, MA)at a dilution of 1:50 overnight at 4°. Control slides were incubated without primary antibody. This wasfollowed by incubation in AlexaFluor 488 goat anti-rabbit IgG (0.24 ug/ml) for 1h at 39°. Slides wereviewed using a Nikon eclipse E600 and pictures were taken with a Spot RT Slider camera. Scale bar =100um. (GIF 1.25 MB)
(PDF 21.5 kb)
(PDF 20.7 kb)
Acknowledgements
The project described was supported, in part, by grant number F31GM078742 from the National Institute of General Medical Sciences. The content is solely the responsibility of the authors and does not necessarily represent the views of the National Institute of General Medical Sciences or the National Institutes of Health.
Conflict of Interest
The authors declare that they have no conflict of interest.
References
- 1.The American Cancer Society (2009) What are the key statistics about ovarian cancer? http://www.cancer.org/cancer/ovariancancer/detailedguide/ovarian-cancer-key-statistics
- 2.Konstatinopoulos PA, Spentzos D, Camistra SA. Gene-expression profiling in epithelial ovarian cancer. Nat Clin Pract Oncol. 2008;5:577–587. doi: 10.1038/ncponc1178. [DOI] [PubMed] [Google Scholar]
- 3.Fredrickson TN. Ovarian tumors of the hen. Environ Health Perspect. 1987;73:35–51. doi: 10.2307/3430596. [DOI] [PMC free article] [PubMed] [Google Scholar]
- 4.Rodriguez-Burford C, Barnes MN, Berry W, et al. Immunohistochemical expression of molecular markers in an avian model: a potential model for preclinical evaluation of agents for ovarian cancer chemoprevention. Gynecol Oncol. 2001;81:373–379. doi: 10.1006/gyno.2001.6191. [DOI] [PubMed] [Google Scholar]
- 5.Urick ME, Johnson PA. Cyclooxygenase 1 and 2 mRNA and protein expression in the Gallus domesticus model of ovarian cancer. Gynecol Oncol. 2006;103:673–678. doi: 10.1016/j.ygyno.2006.05.012. [DOI] [PubMed] [Google Scholar]
- 6.Hales DB, Zhuge Y, Lagman JA, et al. Cyclooxygenases expression and distribution in the normal ovary and their role in ovarian cancer in the domestic hen (Gallus domesticus) Endocr. 2008;33:235–244. doi: 10.1007/s12020-008-9080-z. [DOI] [PMC free article] [PubMed] [Google Scholar]
- 7.Urick ME, Giles JR, Johnson PA. VEGF expression and the effect of NSAIDs on ascites cell proliferation in the hen model of ovarian cancer. Gynecol Oncol. 2008;110:418–424. doi: 10.1016/j.ygyno.2008.05.018. [DOI] [PubMed] [Google Scholar]
- 8.Ansenberger K, Zhuge Y, Lagman JA, et al. E-cadherin expression in ovarian cancer in the laying hen, Gallus domesticus, compared to human ovarian cancer. Gynecol Oncol. 2009;113:362–369. doi: 10.1016/j.ygyno.2009.02.011. [DOI] [PMC free article] [PubMed] [Google Scholar]
- 9.Hakim AA, Barry CP, Barnes HJ, et al. Ovarian adenocarcinomas in the laying hen and women share similar alterations in p53, ras, and HER-2/neu. Cancer Prev Res. 2009;2:114–121. doi: 10.1158/1940-6207.CAPR-08-0065. [DOI] [PubMed] [Google Scholar]
- 10.Barua A, Bitterman P, Abramowicz JS, et al. Histopathology of ovarian tumors in laying hens: a preclinical model of human ovarian cancer. Int J Gynecol Cancer. 2009;19:531–539. doi: 10.1111/IGC.0b013e3181a41613. [DOI] [PMC free article] [PubMed] [Google Scholar]
- 11.Urick ME, Giles JR, Johnson PA. Dietary aspirin decreases the stage of ovarian cancer in the hen. Gynecol Oncol. 2009;112:166–170. doi: 10.1016/j.ygyno.2008.09.032. [DOI] [PubMed] [Google Scholar]
- 12.Dennis G, Jr, Sherman BT, Hosack DA, et al. DAVID: database for annotation, visualization, and integrated discovery. Genome Biol. 2003;4:P3. doi: 10.1186/gb-2003-4-5-p3. [DOI] [PubMed] [Google Scholar]
- 13.Huang DW, Sherman BT, Lempicki RA. Systematic and integrative analysis of large gene lists using DAVID bioinformatics resources. Nat Protoc. 2009;4:44–57. doi: 10.1038/nprot.2008.211. [DOI] [PubMed] [Google Scholar]
- 14.Abdel Mageed AM, Isobe N, Yoshimura Y. Expression of avian β-defensins in the oviduct and effects of lipopolysaccharide on their expression in the vagina of hens. Poult Sci. 2008;87:979–984. doi: 10.3382/ps.2007-00283. [DOI] [PubMed] [Google Scholar]
- 15.Mann K. The chicken egg white proteome. Proteomics. 2007;7:3558–3568. doi: 10.1002/pmic.200700397. [DOI] [PubMed] [Google Scholar]
- 16.Mann K. Proteomic analysis of the chicken egg vitelline membrane. Proteomics. 2008;8:2322–2332. doi: 10.1002/pmic.200800032. [DOI] [PubMed] [Google Scholar]
- 17.Kobayashi A, Behringer RR. Developmental genetics of the female reproductive tract in mammals. Nat Rev Genet. 2003;4:969–980. doi: 10.1038/nrg1225. [DOI] [PubMed] [Google Scholar]
- 18.Auersperg N, Wong AS, Choi KC, et al. Ovarian surface epithelium: biology, endocrinology, and pathology. Endocr Rev. 2001;22:255–288. doi: 10.1210/er.22.2.255. [DOI] [PubMed] [Google Scholar]
- 19.Dubeau L. The cell of origin of ovarian epithelial tumors and the ovarian surface epithelium dogma: does the emperor have no clothes? Gynecol Oncol. 1999;72:437–442. doi: 10.1006/gyno.1998.5275. [DOI] [PubMed] [Google Scholar]
- 20.Dubeau L. The cell of origin of ovarian epithelial tumors. Lancet Oncol. 2008;9:1191–1197. doi: 10.1016/S1470-2045(08)70308-5. [DOI] [PMC free article] [PubMed] [Google Scholar]
- 21.Jarboe EA, Folkins AK, Drapkin R, et al. Tubal and ovarian pathways to pelvic epithelial cancer: a pathological perspective. Histopathology. 2008;53:127–138. doi: 10.1111/j.1365-2559.2007.02938.x. [DOI] [PubMed] [Google Scholar]
- 22.Karst AM, Drapkin R. Ovarian cancer pathogenesis: a model in evolution. J Oncol. 2010;2010:932371. doi: 10.1155/2010/932371. [DOI] [PMC free article] [PubMed] [Google Scholar]
- 23.IeM S, Kurman RJ. Ovarian tumorigenesis: a proposed model based on morphological and molecular genetic analysis. Am J Pathol. 2004;164:1511–1518. doi: 10.1016/s0002-9440(10)63708-x. [DOI] [PMC free article] [PubMed] [Google Scholar]
- 24.Tong G, Chiriboga L, Hamele-Bena D, et al. Expression of PAX2 in papillary serous carcinoma of the ovary: immunohistochemical evidence of fallopian tube or secondary Müllerian system origin? Mod Pathol. 2007;20:856–863. doi: 10.1038/modpathol.3800827. [DOI] [PubMed] [Google Scholar]
- 25.Tung CS, Mok SC, Tsang YTM. PAX2 expression in low malignant potential ovarian tumors and low-grade ovarian serous carcinomas. Mod Pathol. 2009;22:1243–1250. doi: 10.1038/modpathol.2009.92. [DOI] [PMC free article] [PubMed] [Google Scholar]
- 26.Zhai QJ, Azcan A, Hamilton C, et al. PAX2 expression in non-neoplastic, primary neoplastic and metastatic neoplastic tissue: a comprehensive immunohistochemical study. Appl Immunohistochem Mol Morphol. 2010;18:323–332. doi: 10.1097/PAI.0b013e3181d712ef. [DOI] [PubMed] [Google Scholar]
- 27.Muratovska A, Zhou C, He S, et al. Paired-box genes are frequently expressed in cancer and often required for cancer cell survival. Oncogene. 2003;22:7989–7997. doi: 10.1038/sj.onc.1206766. [DOI] [PubMed] [Google Scholar]
- 28.Bowen NJ, Logani S, Dickerson EB, et al. Emerging roles for PAX8 in ovarian cancer and endosalpingeal development. Gynecol Oncol. 2007;104:331–337. doi: 10.1016/j.ygyno.2006.08.052. [DOI] [PubMed] [Google Scholar]
- 29.Dougherty DC, Sanders MM. Estrogen action: revitalization of the chick oviduct model. Trends Endocrinol Metab. 2005;16:414–419. doi: 10.1016/j.tem.2005.09.001. [DOI] [PubMed] [Google Scholar]
- 30.Palmiter RD. Regulation of protein synthesis in chick oviduct. J Biol Chem. 1972;247:6450–6461. [PubMed] [Google Scholar]
- 31.Wu H, Chen Y, Liang J, et al. Hypomethylation-linked activation of PAX2 mediates tamoxifen-stimulated endometrial carcinogenesis. Nature. 2005;438:981–987. doi: 10.1038/nature04225. [DOI] [PubMed] [Google Scholar]
- 32.Shang Y. Molecular mechanisms of oestrogen and SERMs in endometrial carcinogenesis. Nat Rev Cancer. 2006;6:360–368. doi: 10.1038/nrc1879. [DOI] [PubMed] [Google Scholar]
- 33.Cunat S, Hoffmann P, Pujol P. Estrogens and epithelial ovarian cancer. Gynecol Oncol. 2004;94:25–32. doi: 10.1016/j.ygyno.2004.03.026. [DOI] [PubMed] [Google Scholar]
- 34.Jacobs I, Bast RC., Jr The CA125 tumor-associated antigen: a review of the literature. Hum Reprod. 1989;4:1–12. doi: 10.1093/oxfordjournals.humrep.a136832. [DOI] [PubMed] [Google Scholar]
- 35.Drapkin R, von Horsten HH, Lin Y, et al. Human epididymis protein 4 (HE4) is a secreted glycoprotein that is overexpressed by serous and endometrioid ovarian carcinomas. Cancer Res. 2005;65:2162–2169. doi: 10.1158/0008-5472.CAN-04-3924. [DOI] [PubMed] [Google Scholar]
- 36.Woo MMM, Gilks CB, Verhage HG, et al. Oviductal glycoprotein, a new differentiation-based indicator present in early ovarian epithelial neoplasia and cortical inclusion cysts. Gynecol Oncol. 2004;94:315–319. doi: 10.1016/j.ygyno.2004.01.047. [DOI] [PubMed] [Google Scholar]
- 37.Maines-Bandiera S, Woo MMM, Borrugian M, et al. Oviductal glycoprotein (OVGP1, MUC9): a differentiation-based mucin present in serum of women with ovarian cancer. Int J Gynecol Cancer. 2010;20:16–22. doi: 10.1111/IGC.0b013e3181bcc96d. [DOI] [PubMed] [Google Scholar]
- 38.Giles JR, Shivaprasad HL, Johnson PA. Ovarian tumor expression of an oviductal protein in the hen: a model for human serous ovarian adenocarcinoma. Gynecol Oncol. 2004;95:950–953. doi: 10.1016/j.ygyno.2004.07.061. [DOI] [PubMed] [Google Scholar]
- 39.Hudson LG, Zeineldin R, Stack MS. Phenotypic plasticity of neoplastic ovarian epithelium: unique cadherin profiles in tumor progression. Clin Exp Metastasis. 2008;25:643–655. doi: 10.1007/s10585-008-9171-5. [DOI] [PMC free article] [PubMed] [Google Scholar]
- 40.Morin PJ. Claudin proteins in human cancer: promising new targets for diagnosis and therapy. Cancer Res. 2005;65:9603–9606. doi: 10.1158/0008-5472.CAN-05-2782. [DOI] [PubMed] [Google Scholar]
Associated Data
This section collects any data citations, data availability statements, or supplementary materials included in this article.
Supplementary Materials
(PDF 118 kb)
Immunohistochemistry with PAX2 antibody. Nuclear PAX2 protein expressionin chicken oviduct (A). No PAX2 protein expression in the control section (B). Paraffin embeddedsections of oviduct (n=3) were boiled in citrate buffer for antigen retrieval and blocked in 10% goat serumin PBS for 30 min. Sections were then incubated with rabbit anti-human PAX2 (Abcam, Cambridge, MA)at a dilution of 1:50 overnight at 4°. Control slides were incubated without primary antibody. This wasfollowed by incubation in AlexaFluor 488 goat anti-rabbit IgG (0.24 ug/ml) for 1h at 39°. Slides wereviewed using a Nikon eclipse E600 and pictures were taken with a Spot RT Slider camera. Scale bar =100um. (GIF 1.25 MB)
(PDF 21.5 kb)
(PDF 20.7 kb)