Abstract
The divergence of the common dendritic cell progenitor1-3 (CDP) into the conventional type 1 and type 2 dendritic cell (cDC1 and cDC2, respectively) lineages4,5 is poorly understood. Some transcription factors act in the commitment of already specified progenitors–such as BATF3, which stabilizes Irf8 autoactivation at the +32 kb Irf8 enhancer4,6–but the mechanisms controlling the initial divergence of CDPs remain unknown. Here we report the transcriptional basis of CDP divergence and describe the first requirements for pre-cDC2 specification. Genetic epistasis analysis7 suggested that Nfil3 acts upstream of Id2, Batf3 and Zeb2 in cDC1 development but did not reveal its mechanism or targets. Analysis of newly generated NFIL3 reporter mice showed extremely transient NFIL3 expression during cDC1 specification. CUT&RUN and chromatin immunoprecipitation followed by sequencing identified endogenous NFIL3 binding in the −165 kb Zeb2 enhancer8 at three sites that also bind the CCAAT-enhancer-binding proteins C/EBPα and C/EBPβ. In vivo mutational analysis using CRISPR-Cas9 targeting showed that these NFIL3–C/EBP sites are functionally redundant, with C/EBPs supporting and NFIL3 repressing Zeb2 expression at these sites. A triple mutation of all three NFIL3-C/EBP sites ablated Zeb2 expression in myeloid, but not lymphoid progenitors, causing the complete loss of pre-cDC2 specification and mature cDC2 development in vivo. These mice did not generate T helper 2 (TH2) cell responses against Heligmosomoides polygyrus infection, consistent with cDC2 supporting TH2 responses to helminths9-11. Thus, CDP divergence into cDC1 or cDC2 is controlled by competition between NFIL3 and C/EBPs at the −165 kb Zeb2 enhancer.
cDC1 development requires the transcription factors ID2, BATF3, IRF8 and NFIL3, whereas plasmacytoid dendritic cell (pDC) development requires ZEB2 and E2-212-15 (encoded by Tcf4). By contrast, the transcriptional basis for cDC2 development is less well understood. IRF4 was first considered necessary for cDC2 development16, but later reported to control only a limited set of genes associated with cDC2s17,18, including Cd4 and Ccr7. cDC1 and cDC2 develop from distinct specified progenitors arising from the CDP4,5, which in turn develops from the monocyte/dendritic cell progenitor3,19 (MDP) that also produces the specified monocyte progenitor20 (cMoP). The transcriptional basis for MDP and CDP divergence has not been determined.
Progenitors of all dendritic cells require C/EBPα for development21,22. For the cDC1 lineage, Irf8, Nfil3 and Id2 are required for the accumulation of the pre-cDC1 progenitors, whereas Batf3 is not4. BATF3 supports cDC1 development after pre-cDC1 specification by forming a complex with IRF8 that binds to AP-1–IRF composite elements in the +32 kb Irf8 enhancer to stabilize the high level of Irf8 expression4. The role of Id2 in cDC1 development is still poorly understood. Unlike Irf8 and Batf3, Id2 is not inherently required for cDC1 identity, since cDC1s continue to develop in the absence of Id2 in the context of Zeb2 deficiency7. The function of Nfil3 in cDC1 development is currently unknown, and no direct NFIL3 target genes have been identified. Our previous genetic epistasis analysis suggests that Nfil3 acts upstream of Id2, Batf3 and Zeb2 in cDC1 development7.NFIL3 has been reported to act both as an activator23 and as a repressor24, allowing for a wide range of possible actions. Here we sought to define the mechanism of NFIL3 in controlling cDC1 specification. We also uncovered the basis for cDC2 specification and generated a mouse model in which the cDC2 lineage is developmentally ablated.
Transient NFIL3 induction specifies cDC1
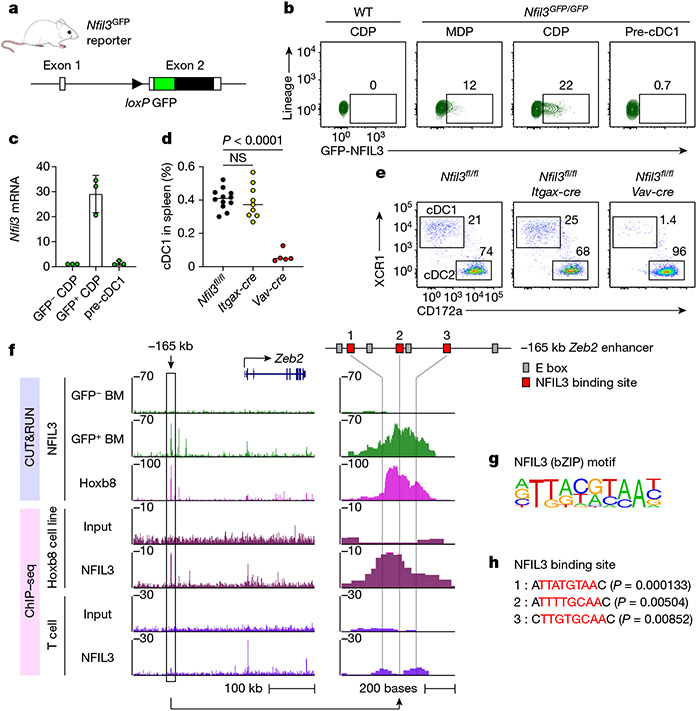
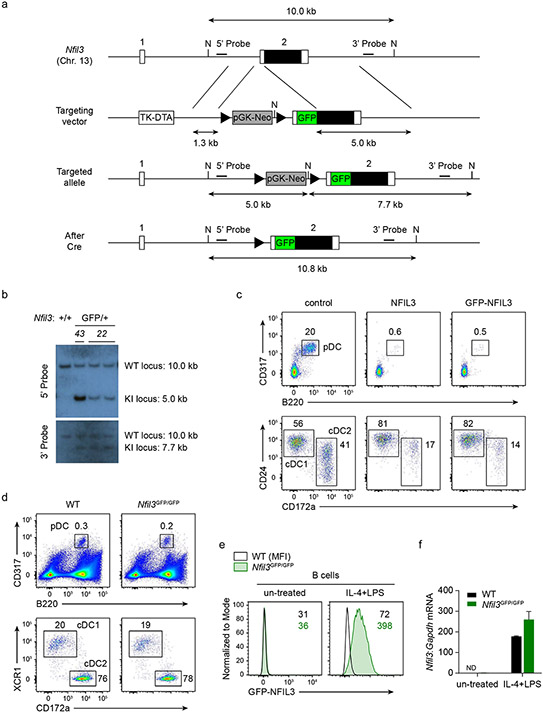
We engineered the endogenous Nfil3 locus to express a GFP–NFIL3 fusion protein (Fig. 1a and Extended Data Fig. 1a,b). This fusion protein functioned like native NFIL3 in driving cDC1 development, blocking cDC2 and pDC development (Extended Data Fig. 1c,d) and supporting cDC1 development in vivo (Extended Data Fig. 1e,f). Nfil3GFP reporter mice showed normal transcriptomes for both activated B cells and cDC1s, indicating that the GFP–NFIL3 fusion protein does not alter the transcriptional activity of NFIL3 (Extended Data Fig. 1g). The GFP–NFIL3 signal reflected the Nfil3 mRNA level across many immune lineages (Extended Data Fig. 2a,b), indicating its faithful behaviour as an NFIL3 reporter.
Fig. 1 ∣. Transient NFIL3 expression drives cDC1 specification.
a, Schematic of the Nfil3GFP reporter mice. Filled and open boxes denote coding and noncoding exons of Nfil3, respectively. b, Representative flow cytometry plots showing GFP–NFIL3 expression in MDPs, CDPs and pre-cDC1 progenitors from the BM of Nfil3GFP/GFP mice. The percentage of each cell type expressing GFP–NFIL3 is shown. c, Nfil3 transcripts normalized to Gapdh, measured by quantitative PCR with reverse transcription (RT–qPCR), in GFP–NFIL3− CDP, GFP–NFIL3+ CDP and pre-cDC1 from Nfil3GFP/GFP mice. Data are pooled from three independent experiments (n = 3 for each cell type). d, Frequency of splenic cDC1 in Nfil3fl/fl, Nfil3fl/fl Itgax-cre and Nfil3fl/fl Vav-cre mice. Data are pooled from five independent experiments (n = 12 for Nfil3fl/fl, 9 for Nfil3fl/fl Itgax-cre and 5 for Nfil3fl/fl Vav-cre mice). Nfil3fl/fl versus Nfil3fl/fl Itgax-cre, P = 0.9067. e, Representative flow cytometry plots showing splenic cDC1s and cDC2s in Nfil3fl/fl, Nfil3fl/fl Itgax-cre and Nfil3fl/fl Vav-cre mice. Percentages of each cell type are indicated. f, CUT&RUN and ChIP–seq tracks display NFIL3 binding around the Zeb2 locus in GFP–NFIL3− BM cells, GFP–NFIL3+ BM cells, the NFIL3-expressing Hoxb8 cell line or T cells, visualized with the UCSC genome browser. g, Homer NFIL3 motif. h, FIMO analysis depicting P-values of the three NFIL3 binding sites in the −165 kb Zeb2 enhancer. The Homer NFIL3 motif (shown in g) is used in FIMO analysis. Red residues indicate core NFIL3 motif. Data in c are mean±s.d. Centre values in d indicate median. NS, not significant. Brown–Forsythe and Welch ANOVA with Dunnett’s T3 multiple comparisons test is used in d.
At the steady state, the strongest GFP–NFIL3 expression was seen in the CDP, where approximately 20% of cells were brightly GFP-positive (Fig. 1b and Extended Data Figs. 2c, d and 3a). We noted that GFP–NFIL3 expression during cDC1 development was transient, beginning with low expression in common myeloid progenitors (CMPs) and MDPs, strong induction in CDPs, and extinction in specified pre-cDC1 progenitors (Fig. 1b and Extended Data Fig. 2c,d). In agreement, Nfil3 mRNA was detected only in GFP–NFIL3+ CDPs, but not in GFP–NFIL3− CDPs or in pre-cDC1s (Fig. 1c). GFP–NFIL3+ CDPs were strongly biased for development toward the cDC1 lineage compared with GFP–NFIL3− CDPs (Extended Data Fig. 3b, c).
Analysis using mixed bone marrow (BM) chimeras showed that cDC1 development has a cell-intrinsic requirement for Nfil3 (Extended Data Fig. 3d,e). Similar to germline deficient Nfil3−/− mice, cDC1 did not develop in Nfil3fl/fl Vav-cre mice, but did develop in Nfil3fl/fl Itgax-cre mice, in which Nfil3 is inactivated only after the pre-cDC1 stage of development (Fig. 1d,e). These results indicate that NFIL3 is expressed in a transient pulse to drive cDC1 specification, but is not required subsequently to maintain cDC1 identity.
NFIL3 binds to the −165 kb Zeb2 enhancer
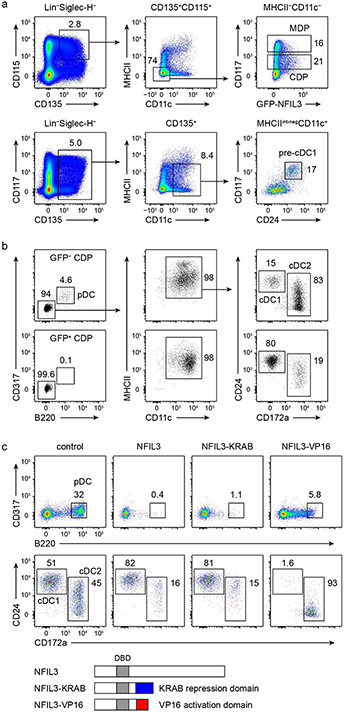
NFIL3 can be an activator23 or repressor24, but which activity operates during cDC1 development is not known. To resolve this question, we compared chimeric proteins comprising the NFIL3 DNA-binding domain fused with either the KRAB repression domain25 or the VP16 activation domain26 (Extended Data Fig. 3f,g). NFIL3–KRAB acted like native NFIL3 to induce cDC1 development, indicating that direct NFIL3 targets may include genes that are repressed during cDC1 specification. The transcription factors repressed during pre-cDC1 specification include Cdca7, Atxn1, Erg, Tfec, Eng, Nfe2, Zeb2 and Myb7.
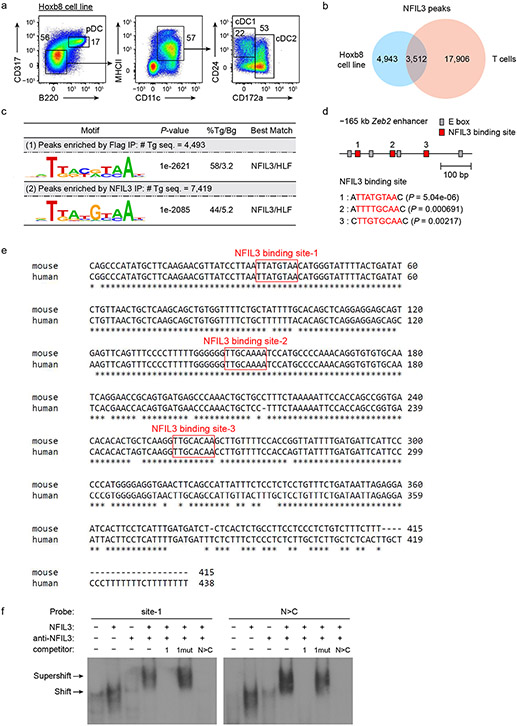
To identify potential NFIL3 targets, we performed NFIL3 CUT&RUN and chromatin immunoprecipitation with sequencing (ChIP-seq) in GFP–NFIL3+ BM cells and BM-derived Hoxb8-immortalized cell lines27 that exhibit dendritic cell developmental potential (Fig. 1f and Extended Data Fig. 4a-d). We first identified an NFIL3 peak in the NFIL3-expressing Hoxb8 cells, but not in T cells28, located at the −165 kb Zeb2 enhancer8 (Fig. 1f and Extended Data Fig. 4e). This same NFIL3 peak was also found with endogenous NFIL3 binding in GFP–NFIL3+ BM cells (Fig. 1f). In this enhancer, there are three sites with an NFIL3 binding consensus sequence, which are conserved between human and mouse (Fig. 1f, g and Extended Data Fig. 4f). Since NFIL3 binding site 1 has the lowest P-value of the three as determined by FIMO analysis29 (Fig. 1h), we used the site 1 sequence as a probe in electrophoretic mobility shift assay (EMSA) and confirmed direct NFIL3 binding (Extended Data Fig. 4g). These results suggest that NFIL3 may drive pre-cDC1 specification by repressing Zeb2 expression through binding to one or more of these sites in the −165 kb Zeb2 enhancer.
Mutating the Zeb2 enhancer ablates cDC2
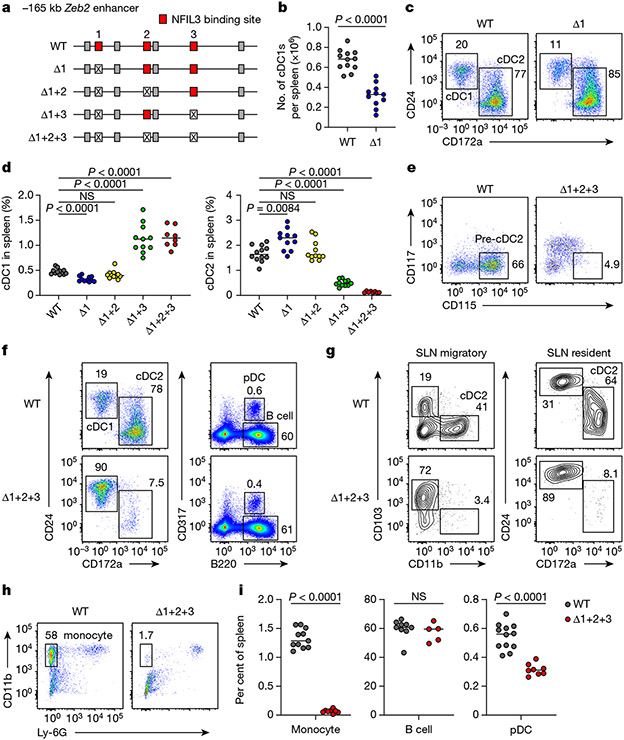
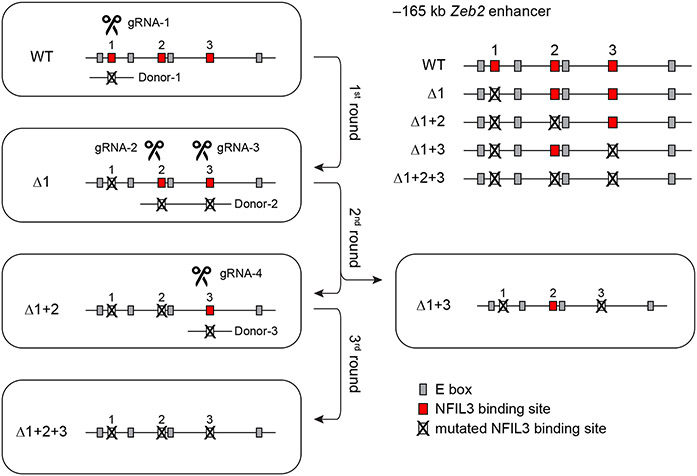
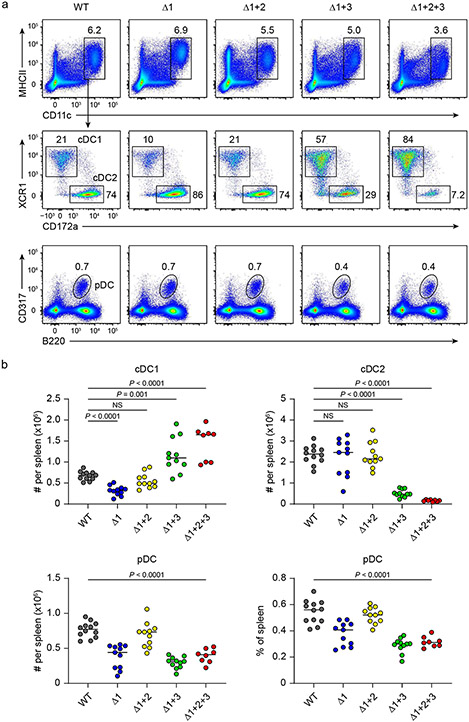
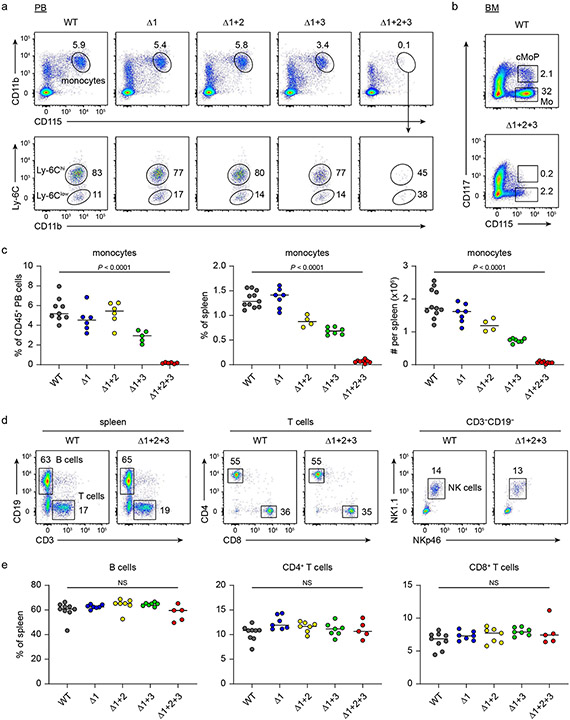
To test the role of these NFIL3 binding sites in cDC1 development in vivo, we used CRISPR–Cas9 editing to introduce mutations in various combinations (Fig. 2a and Extended Data Fig. 5a) that eliminate NFIL3 binding. We first targeted site 1 (Δ1 mice) to test whether this site alone mediated NFIL3-dependent cDC1 development. Consistent with a role for this site in suppressing Zeb2, Δ1 mice had reduced cDC1 development, but showed only a 50% reduction in cDC1 number (Fig. 2b,c). This partial reduction suggested that sites 2 or 3 might also participate in repression of Zeb2. To test this hypothesis, we evaluated mice with mutations in both site 1 and site 2 (Δ1+2 mice), or in both site 1 and site 3 (Δ1+3 mice). Rather than further reducing cDC1 development, Δ1+2 mice showed cDC1 numbers that reverted back to normal levels as in wild-type (WT) mice (Fig. 2d and Extended Data Fig. 5b,c). In contrast, Δ1+3 mice showed enhanced cDC1 development and reduced cDC2 development (Fig. 2d and Extended Data Fig. 5b,c). Finally, mice with all three sites mutated (Δ1+2+3 mice) also had increased cDC1 development, similar to Δ1+3 mice, but showed a complete loss of cDC2 development (Fig. 2d-g and Extended Data Figs. 5b,c and 6a-e). We previously found that deletion of the entire −165 kb Zeb2 enhancer abrogated development of B cells, pDCs and monocytes8. By contrast, Δ1+2+3 mice had pDCs and B cells, but still showed a monocyte deficiency (Fig. 2f,h,i and Extended Data Figs. 6f-h and 7a-e). Small intestine lamina propria macrophages were still present in the Δ1+2+3 mice (Extended Data Fig. 7f,g), in agreement with embryonically derived macrophages developing independently of the −165 kb Zeb2 enhancer8. These results suggest that the NFIL3 binding sites are not required for Zeb2 expression for B cell and pDC development, but may be required for binding to one or more factors other than NFIL3 that support Zeb2 expression for cDC2 and monocyte development.
Fig. 2 ∣. Mutation of three NFIL3 binding sites in the −165 kb Zeb2 enhancer abrogates cDC2 and monocyte development.
a, Schematic of WT, Δ1, Δ1+2, Δ1+3 and Δ1+2+3 mice. Red, crossed and grey boxes denote NFIL3 binding sites, mutated NFIL3 binding sites and E-box motifs, respectively. b, The number of splenic cDC1 in WT and Δ1 mice. Data are pooled from five independent experiments (n = 12 for WT and 11 for Δ1 mice). c, Representative flow cytometry plots showing splenic cDC1s and cDC2s in WT and Δ1 mice. The percentage of each cell type is indicated. d, Frequency of splenic cDC1 and cDC2 in WT, Δ1, Δ1+2, Δ1+3 and Δ1+2+3 mice. Data are pooled from five independent experiments (n = 12 for WT, 11 for Δ1, Δ1+2 and Δ1+3, and 8 for Δ1+2+3 mice). WT versus Δ1+2 cDC1, P= 0.2003, WT versus Δ1+2 cDC2, P = 0.9348. e, Representative flow cytometry plots showing BM pre-cDC2s in WT and Δ1+2+3 mice. Data shown are from one of five similar experiments. f, Representative flow cytometry plots showing splenic cDCs, pDCs and B cells in WT and Δ1+2+3 mice. g, Representative flow cytometry plots showing migratory and resident cDC2s in inguinal skin-draining lymph nodes (SLNs) from WT and Δ1+2+3 mice. Data shown are from one of three similar experiments. h, Representative flow cytometry plots showing splenic monocytes in WT and Δ1+2+3 mice. i, Frequency of splenic monocytes, B cells and pDCs in WT and Δ1+2+3 mice. Data are pooled from five independent experiments for monocytes and pDCs, and three for B cells (monocytes: n = 11 for WT, 8 for Δ1+2+3 mice; B cells: n = 9 for WT, 5 for Δ1+2+3 mice; pDCs: n = 12 for WT, 8 for Δ1+2+3 mice). WT versus Δ1+2+3 B cell, P = 0.4376. Centre values in scatter plots indicate median. b,i, Unpaired, two-tailed Mann–Whitney test. d, Brown–Forsythe and Welch ANOVA with Dunnett’s T3 multiple comparisons test.
C/EBPs bind to the −165 kb Zeb2 enhancer
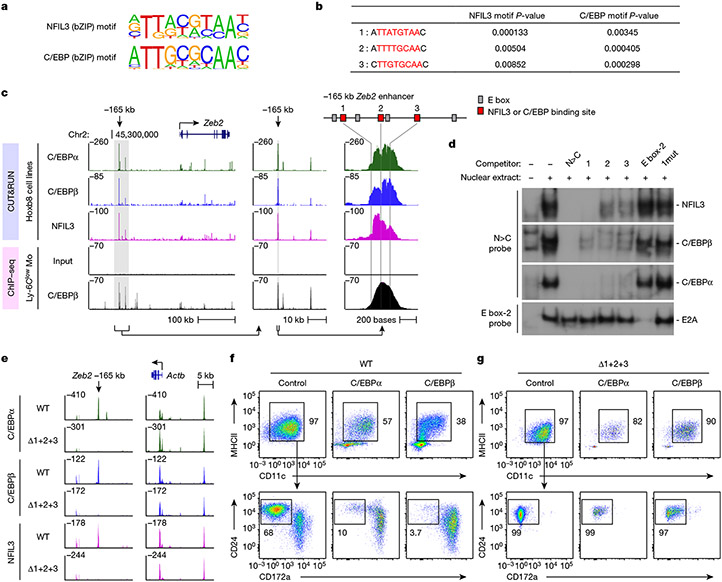
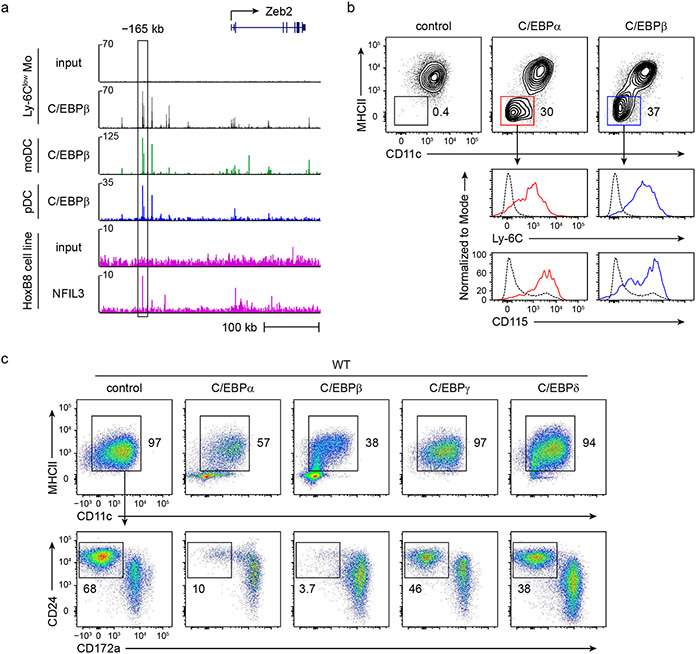
NFIL3 binds similar sequences as C/EBP family proteins30,31 and in vitro over-expression studies suggest that NFIL3 can compete for a C/EBPβ binding site in the ovarian Ptgs2 promoter32. C/EBPα is known to be required for the emergence of all dendritic cell progenitors21,22, and C/EBPβ is required for Ly-6Clow monocyte development33. We next explored whether C/EBP factors bind to the three NFIL3 binding sites in the −165 kb Zeb2 enhancer to support Zeb2 expression for cDC2 and monocyte development. FIMO analysis29 predicts that all three NFIL3 binding sites should also bind C/EBP family proteins (Fig. 3a,b). Indeed, CUT&RUN and ChIP–seq34 analysis confirm C/EBPα and C/EBPβ binding to the −165 kb Zeb2 enhancer (Fig. 3c and Extended Data Fig. 8a). The region bound by C/EBPα, C/EBPβ and NFIL3 overlap with the locations of the three NFIL3–C/EBP binding motifs. Using EMSA probe competition, we showed that each of these sites can bind to NFIL3, C/EBPα and C/EBPβ (Fig. 3d). Further, CUT&RUN analysis for C/EBPα, C/EBPβ and NFIL3 binding in Δ1+2+3 Hoxb8 cell lines showed a complete lack of binding of these factors to the −165 kb Zeb2 enhancer, but showed normal binding to unrelated genomic regions (Fig. 3e).
Fig. 3 ∣. C/EBPs bind to the −165 kb Zeb2 enhancer to support cDC2 and monocyte development.
a, Homer NFIL3 and C/EBP motifs. b, FIMO analysis depicting P-values of the three NFIL3–C/EBP binding sites in the −165 kb Zeb2 enhancer. The Homer NFIL3 and C/EBP motifs (shown in a) were used in FIMO analysis. c, CUT&RUN and ChIP–seq tracks display C/EBPα, C/EBPβ and NFIL3 binding around the Zeb2 locus in Hoxb8 cell lines or Ly-6Clow monocytes, visualized with UCSC genome browser. d, EMSA showing NFIL3, C/EBPβ and C/EBPα binding at −165 kb Zeb2 enhancer. The N>C probe contains an optimized NFIL3 motif and flanking sequence of the NFIL3–C/EBP binding site 3 from the −165 kb Zeb2 enhancer. The competitors 1, 2 and 3 indicate DNA fragments encompassing NFIL3–C/EBP binding sites 1, 2 and 3. The competitor 1mut has the same sequence as competitor 1 except that the NFIL3–C/EBP binding site 1 was mutated. Data shown are one of two similar experiments. For gel source data, see Supplementary Figure 1. e, CUT&RUN tracks display C/EBPα, C/EBPβ and NFIL3 binding at the −165 kb Zeb2 enhancer and around the Actb locus in WT or Δ1+2+3 Hoxb8 cell lines, visualized with Integrative Genomics Viewer. f,g, Representative flow cytometry plots showing cDCs and monocytes differentiated from WT (f) or Δ1+2+3 (g) CDPs retrovirally expressing C/EBPα or C/EBPβ (LAP isoform) (pre-gate: CD317−B220− cells). Data shown are from one of four similar experiments.
We proposed that these three NFIL3–C/EBP binding sites support Zeb2 enhancer activity in myeloid progenitors, so that Δ1+2+3 mice do not express Zeb2, which leads to the uniform cDC1 specification and loss of monocyte development. To test this idea, we evaluated the requirement of these sites for enhancer activity using reporter assays4. We found that site 1 contributed the greatest individual activity, but the complete loss of enhancer activity occurred only when all three sites were mutated (Extended Data Fig. 8b).
We next identified the specific C/EBP family members that support Zeb2 expression at these sites by examining four C/EBP proteins that are expressed in myeloid lineages7,35. Retroviral expression of C/EBPα and C/EBPβ, but not C/EBPγ or C/EBPδ into WT CDPs caused a marked reduction in their potential for cDC1 development and enhanced cDC2 and monocyte development (Fig. 3f and Extended Data Fig. 8c-e). However, expression of C/EBPα and C/EBPβ into Δ1+2+3 CDPs did not enhance cDC2 or monocyte development (Fig. 3g and Extended Data Fig. 8e), suggesting that C/EBPα and C/EBPβ bind to the three NFIL3-C/EBP binding sites to support cDC2 and monocyte development. In agreement, both Cebpa and Cebpb were expressed in CDPs7 (Extended Data Fig. 8f). Other evidence also supports an in vivo role for C/EBPα and C/EBPβ in cDC2 development. First, we showed that Cre-mediated conditional deletion of Cebpb in early dendritic cell progenitors substantially reduced cDC2 development in vivo (Extended Data Fig. 8g,h). Second, conditional deletion of Cebpa from hematopoietic stem and progenitor cells has been reported to reduce Zeb2 expression22 (Extended Data Fig. 8i). In summary, C/EBPα and C/EBPβ can bind to the three NFIL3–C/EBP binding sites in the −165 kb Zeb2 enhancer to support cDC2 and monocyte development. These data do not exclude the possibility that other factors besides C/EBPα and C/EBPβ may also act at these same sites to support Zeb2 expression.
Convergent pDC development
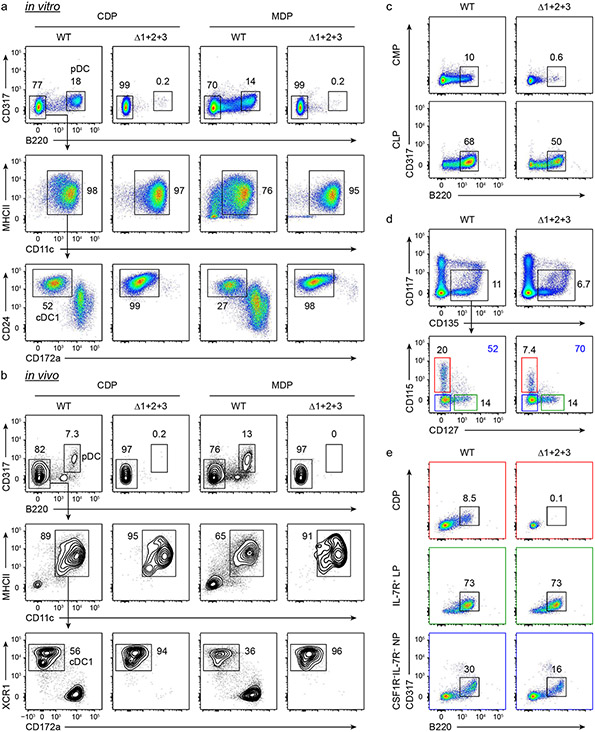
pDCs have been proposed to represent convergent differentiation arising from both lymphoid and myeloid progenitors36,37, although some controversy remains38. Here, we unexpectedly uncovered evidence that there are distinct molecular requirements for pDC development from these two branches. Although Δ1+2+3 mice retained pDC development, MDPs and CDPs from Δ1+2+3 mice completely lacked pDC potential when cultured in vitro or transferred in vivo (Extended Data Fig. 9a,b). In addition, Δ1+2+3 mice had reduced pDC numbers when compared with WT mice (Fig. 2i and Extended Data Fig. 6f,g). Thus, we explored whether the pDCs present in Δ1+2+3 mice developed exclusively from lymphoid progenitors. To test this hypothesis, we compared the pDC output of common lymphoid progenitors (CLPs) and CMPs between WT and Δ1+2+3 mice (Extended Data Fig. 9c). Using WT progenitors, pDCs developed from both CLPs and CMPs. By contrast, using Δ1+2+3 progenitors, pDCs developed only from CLPs, but not from CMPs. In agreement, lymphoid pDC progenitors37 (IL-7R+ LPs) were present in the Δ1+2+3 mice (Extended Data Fig. 9d) and could develop into pDCs as efficiently as the WT IL-7R+ LPs (Extended Data Fig. 9e). These results support the idea that pDCs arise from both myeloid and lymphoid pathways. The myeloid pathway requires NFIL3–C/EBP sites in the −165 kb Zeb2 enhancer to maintain Zeb2 expression, whereas the lymphoid pathway supports Zeb2 expression using other sites, possibly E boxes8 that bind E2A and E2-2. Nonetheless, pDCs that remain in Δ1+2+3 mice produced substantially less interferon-α (IFNα) compared with pDCs from WT mice (Extended Data Fig. 6h), in agreement with reports that lymphoid-derived pDCs produce less IFNα than myeloid-derived pDCs36.
Zeb2 is required for cDC2 specification
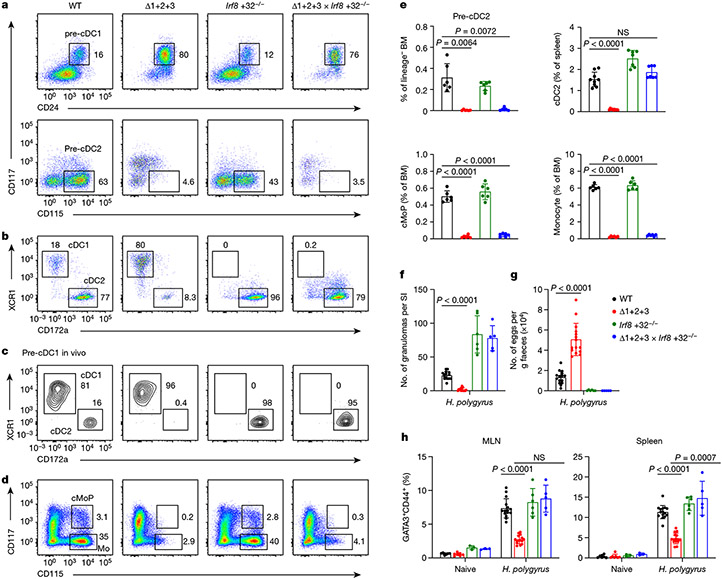
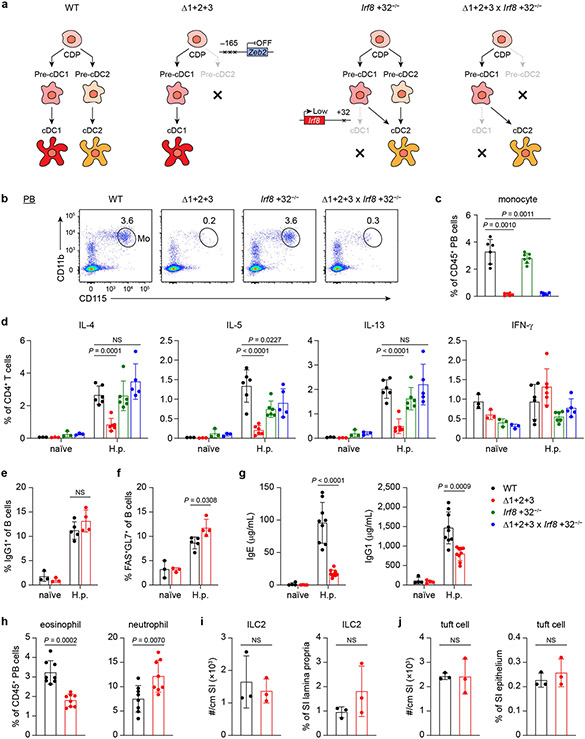
Since NFIL3 is required for cDC1 specification but not for cDC1 maintenance (Fig. 1d,e), we tested whether Zeb2 is required only for cDC2 specification. To address this question, we took advantage of Irf8 +32−/− mice, in which specified pre-cDC1 progenitors are all diverted into the cDC2 lineage6. We crossed Δ1+2+3 mice with Irf8 +32−/− mice and evaluated BM pre-cDC progenitors and peripheral cDC development (Fig. 4a,b). Pre-cDC2s were absent in double-cross Δ1+2+3 × Irf8 +32−/− mice (Fig. 4a), similar to in Δ1+2+3 mice, but peripheral cDC2 populations were restored (Fig. 4b). Previously, we showed that pre-cDC1s isolated from Irf8 +32−/− mice can develop into mature cDC2s in vitro6. Here we confirmed that the pre-cDC1s isolated from Δ1+2+3 × Irf8 +32−/− mice also developed into cDC2s after adoptive transfer into WT mice (Fig. 4c and Extended Data Fig. 10a). These results show that Zeb2 expression is required only for pre-cDC2 specification, but not for maintenance of mature cDC2s. In contrast to cDC2, monocyte development was not restored in double-cross Δ1+2+3 × Irf8 +32−/− mice (Fig. 4d,e and Extended Data Fig. 10b,c).
Fig. 4 ∣. Zeb2 is only required for the specification of cDC2, which support TH2 responses to H. polygyrus infection.
a, Representative flow cytometry plots showing BM pre-cDC1s and pre-cDC2s in WT, Δ1+2+3, Irf8 +32−/− and Δ1+2+3 × Irf8 +32−/− mice. b, Representative flow cytometry plots showing splenic cDC1s and cDC2s from the indicated mice. c, Representative flow cytometry plots showing in vivo developmental potential of pre-cDC1s from the indicated mice. Recipient spleens were analysed for CD45.2+ donor-derived cDCs. Data shown are from one of three similar experiments. d, Representative flow cytometry plots showing BM cMoPs and monocytes (Mo) from the indicated mice. e, Frequency of BM pre-cDC2s, splenic cDC2s, BM cMoPs and BM monocytes in the indicated mice. Data are pooled from four independent experiments (splenic cDC2: n = 9 for WT, Δ1+2+3, 7 for Irf8 +32−/−, Δ1+2+3 × Irf8 +32−/− mice; BM pre-cDC2, cMoP and monocyte: n = 6 for each genotype). WT versus Δ1+2+3 × Irf8 +32−/− splenic cDC2, P = 0.1408. f–h, Number of granulomas in small intestine (SI) (f) or faecal eggs (g), and frequency of TH2 cells in MLN and spleen (h) from the indicated naive mice or mice infected with H. polygyrus for 14 days. Data are pooled from four independent experiments (n = 7 for WT, Δ1+2+3, 3 for Irf8 +32−/−, Δ1+2+3 × Irf8 +32−/− naive mice; n = 15 for H. polygyrus-infected WT, Δ1+2+3, 6 for Irf8 +32−/−, 5 for Δ1+2+3 × Irf8 +32−/− mice). Frequency of WT versus Δ1+2+3 × Irf8 +32−/− TH2 cells in MLN of H. polygyrus-infected mice, P = 0.0577. Data are mean ± s.d. e–g, Brown–Forsythe and Welch ANOVA with Dunnett’s T3 multiple comparisons test. h, Ordinary two-way ANOVA with Dunnett’s multiple comparisons test.
cDC2 support TH2 responses to helminths
Previous studies evaluating the role of cDC2 in immune responses used methods that either eliminated subsets of cDC2 or additionally affected other cDC lineages9-11,39. The newly generated Δ1+2+3 mice, together with the double-cross Δ1+2+3 × Irf8 +32−/− mice enabled us to test the contribution of cDC2s and monocytes to the TH2 response against helminths.
We first infected WT and Δ1+2+3 mice with Heligmosomoides polygyrus (H.polygyrus). Compared with WT mice, the Δ1+2+3 mice did not form granulomas in the small intestine and had increased egg burden in faeces (Fig. 4f,g), consistent with an impaired type 2 immune response and increased fecundity of adult worms. In addition, TH2 responses were diminished as measured by GATA3 expression in CD4+ T cells from mesenteric lymph node (MLN) and spleen (Fig. 4h) and production of the TH2-associated cytokines IL-4, IL-5 and IL-13 (Extended Data Fig. 10d). IgG1+ B cells and germinal centre B cells were present at normal numbers in MLNs of Δ1+2+3 mice (Extended Data Fig. 10e,f), but there was a substantial decrease in IgE and IgG1 in the serum after infection (Extended Data Fig. 10g). The deficiency in TH2 responses is not owing to a defect in eosinophils, neutrophils, group 2 innate lymphoid cells (ILC2s) or tuft cells, which, unlike cDC2s, all develop in Δ1+2+3 mice (Extended Data Fig. 10h-j).
Notably, TH2 responses were restored in double-cross Δ1+2+3 × Irf8 +32−/− mice after infection with H. polygyrus, including restoration of GATA3+ TH2 cells and production of TH2 associated cytokines (Fig. 4f-h and Extended Data Fig. 10d). These results indicated that cDC2s, but not monocytes, are required for TH2 responses against H. polygyrus infection.
Discussion
Specification of CDPs into progenitors of the two branches of cDCs provides the ability to make diverse immune responses that protect the host against different kinds of pathogens40. However, the basis for CDP diversification was poorly understood. In pursuing the mechanism of action of NFIL3 in cDC1 development, we were led to the −165 kb Zeb2 enhancer8 by CUT&RUN and ChIP–seq analysis. We find that this enhancer uses distinct cis-acting elements to support Zeb2 expression in lymphoid versus myeloid progenitors. E-proteins probably support Zeb2 expression in lymphoid progenitors. In myeloid progenitors, the three NFIL3–C/EBP binding sites allow C/EBP factors to support Zeb2 expression for cDC2 development. In a fraction of CDPs, NFIL3 is induced and binds these same sites to repress Zeb2, resulting in cDC1 specification. The similarity of C/EBP and NFIL3 motifs has been noted previously31,32, but our study demonstrates that direct competition between these factors can control developmental divergence in vivo.
Models of lineage ablation have contributed to our understanding of the unique functions of each dendritic cell subset41. However, generation of cDC2-deficient mouse model was hindered by incomplete understanding of cDC2 development. Batf3 and Tcf4 are known requirements for cDC1 and pDC development42,43. By contrast, no analogous transcription factors were known that strictly control cDC2 development, leading to suggestions that cDC2 development is a ‘default’ pathway44. Here we have identified two requirements for cDC2 development, Zeb2 itself and the three C/EBP binding sites in the −165 kb Zeb2 enhancer. The cDC2-deficient mouse model generated here may be useful for investigating the in vivo functions of the cDC2 lineage.
Methods
Generation of Nfil3GFP reporter mice
The targeting vector was designed to fulfil the following requirements. Egfp was fused to the N-terminus of Nfil3 connected by a 5′-GGSG-3′ linker sequence. A loxP sequences-flanked neomycin selection cassette (pGK-Neo) was inserted 411 bp upstream of the Nfil3 coding sequence in the intron. Silent mutations were introduced into amino acids 45–48 of the Nfil3 coding sequence to prevent Cas9 re-cutting after homologous recombination. Oligonucleotide primers used in the construction are described in Supplementary Table 1.
The targeting vector was assembled from four fragments. Fragment 1 containing the vector backbone was amplified from the Zbtb46GFP targeting construct45 using the primers Frag-1-F and Frag-1-R. The 5′ homology arm region was amplified from C57BL/6 genomic DNA using primers 5′ HA-F and 5′ HA-R. The pGK-Neo cassette was amplified from the Zbtb46GFP targeting construct using primers Neo-F and Neo-R. Fragment 2 containing 5′ homology arm region and pGK-Neo cassette was assembled by overlapping PCR using primers 5′ HA-F and Neo-R. The 411 bp fragment upstream of Nfil3 coding sequence was amplified from C57BL/6 genomic DNA using primers intron-F and intron-R. The guide RNA (gRNA) recognition sequence was mutated using primers guide-mut-F and guide-mut-R on the MSCV-GFP-Nfil3-IRES-hCD4 retroviral construct used in this study. GFP-linker-Nfil3 fragment was amplified from the mutated construct using primers GFP-F and Nfil3-R. Fragment 3 containing the 411 bp upstream fragment and GFP-linker-Nfil3 fragment was assembled by overlapping PCR using primers intron-F and Nfil3-R. Fragment 4 containing the remaining 3′ homology arm region was amplified from C57BL/6 genomic DNA using primers Frag-4-F and Frag-4-R. Fragments 1-4 were digested with SalI + NotI, NotI + NdeI, NdeI + XbaI and XbaI + SalI, respectively, and ligated with T4 DNA ligase. Finally, the plasmid was digested with NotI + MfeI to remove the extra part of 5′ homology arm, and a short fragment annealed from primers NM-F and NM-R, was inserted by T4 DNA ligation to yield the final Nfil3GFP targeting construct.
The gRNA gaagatttgctcctgaacga was ordered from IDT and conjugated with purified Cas9 protein to form the RNP complex. PacI linearized targeting construct and RNP complex were electroporated into JM8.N4 mouse embryonic stem cells (C57BL/6N background; Knockout Mouse Project Repository). After selection with G418, targeted clones were screened by Southern blot analysis of NdeI-digested genomic DNA. Southern probes were amplified using primers 5′probe-F + 5′probe-R and 3′probe-F + 3′probe-R, respectively. Correctly targeted clones were injected into blastocysts, and male chimeras were bred to female C57BL/6J mice (stock no. 000664; The Jackson Laboratory). Confirmation of germline transmission was assessed by PCR using the primers GLT-F and GLT-R to generate amplicons of 208 bp (targeted).
To remove the neomycin selection cassette, male F1 mice generated from ES cell clone 22 were bred to female CMV-cre mice (stock no. 006054; The Jackson Laboratory) and then interbred to remove Cre-expressing allele. Deletion of loxP-flanked pGK-Neo cassette and progeny genotype was assessed by PCR using the primers GN3-F and GN3-R to generate amplicons of 1151 bp (targeted) or 425 bp (WT).
Generation of NFIL3-C/EBP binding site-mutant mice
NFIL3-C/EBP binding site-mutant mice were generated as illustrated in Extended Data Fig. 5a. gRNAs proximal to the three NFIL3–C/EBP binding sites in the −165 kb Zeb2 enhancer were identified using Benchling (https://www.benchling.com/crispr/). gRNA and ssODN donor sequences used in the targeting are listed in the Supplementary Table 2. gRNA with the desired sequences were ordered from IDT and conjugated with purified Cas9 protein to form the RNP complex by the Genetic Editing and iPS Cell (GEiC) centre at Washington University in St Louis. Day 0.5 single-cell zygotes were isolated and CRISPR reagents were introduced via electroporation by the Department of Pathology and Immunology Transgenic Mouse Core at Washington University in St Louis. Around 60 single-cell zygotes were electroporated with 8 μM of RNP complex using 1 mm gap cuvette (BioRad). Electroporated zygotes were then transferred into the oviducts of day 0.5 pseudo-pregnant recipient mice. For the second and third round of targeting, embryos were generated via IVF, electroporated, cultured overnight then transferred into day 0.5 pseudo-pregnant recipients.
The resulting pups were screened by PCR using primers Mut-screen-F and Mut-screen-R (Supplementary Table 1), followed by NotI (site 1), SalI (site 2) or BglII (site 3) digestion and Sanger sequencing to identify those that had successful mutation of the NFIL3–C/EBP binding site of interest. Mice with the desired mutation were then outcrossed to WT C57BL/6J mice, and the resulting heterozygous mice were intercrossed to generate homozygous NFIL3–C/EBP binding site-mutant mice.
Mice
WT C57BL/6J (stock no. 000664), CMV-cre (stock no. 006054), Itgax-cre (stock no. 008068) and Vav-cre (stock no. 008610) mice were obtained from the Jackson Laboratory. B6-Ly5.1/Cr mice (strain code 564) were obtained from Charles River. Irf8 +32−/− mice (stock no. 032744; The Jackson Laboratory) were generated in house and described previously6. Mice harbouring floxed alleles of Nfil3 (Nfil3fl/fl mice) and Cebpb (Cebpbf/fl mice) were described previously46,47. Nfil3−/− mice were provided by A. Look and T. Mak48. All mice were maintained on the C57BL/6J background in our specific-pathogen free facility following institutional guidelines and with protocols approved by the AAALAC-accredited Animal Studies Committee at Washington University in St Louis. All animals were maintained on 12-h light cycles and housed at 21 °C and 50% humidity. Experiments were performed with mice at 6–12 weeks of age, with sex-matched littermates whenever possible.
Helminths
H. polygyrus third-stage larvae (L3) were generated as described49. H. polygyrus L3 viability was checked by microscope for motility, and their numbers were quantified before use. Mice were gavaged with 200 H. polygyrus L3 using 20-gauge × 38 mm plastic feeding tubes (Instech). Fourteen days after inoculation, faecal samples were collected from individual mice to enumerate egg burden by saturated NaCl salt flotation method using a McMaster counting chamber.
Antibodies and flow cytometry
Flow cytometry and cell sorting were completed on a FACSAria Fusion instrument (BD). Flow cytometry data was collected using BD Facs-Diva software and analysed using FlowJo analysis software. Surface staining was performed at 4 °C in the presence of Fc block (2.4G2) in magnetic-activated cell sorting (MACS) buffer (PBS + 0.5% BSA + 2 mM EDTA), except for CMP, GMP staining and CDPs (CD115+CD127−), IL-7R+ LPs (CD115−CD127+), IL-7R−CSF1R− NPs (CD115−CD127−) sorting experiments in Extended Data Fig. 9d,e, which case the cells were blocked with rat serum. Intracellular FOXP3 and GATA3 staining were performed using Foxp3 staining kit (00-5523-00; eBioscience). For analysis of intracellular expression of IL-4, IL-5, IL-13 or IFN-γ in T cells, MLN cells were restimulated with phorbol myristate acetate (PMA) (50 ng ml−1) and Ionomycin (1 μM) for 5 h in the presence of brefeldin A (1 μg ml−1). The resulting cells were stained for surface markers, fixed with PBS containing 2% paraformaldehyde, permeabilized with MACS buffer containing 0.5% saponin, and then stained for the indicated cytokines in MACS buffer containing 0.5% saponin. The antibodies used for flow cytometry were listed in Supplementary Table 3. For sequential gating and sorting strategies, see Supplementary Figure 1.
Isolation and culture of BM progenitor cells
BM progenitors were isolated as described4. For CD117hi BM progenitor, MDP, CDP, pre-cDC1 and cMoP sorting experiments, BM was isolated and depleted of CD3-, CD19-, CD105-, CD127-, TER-119-, Ly-6G- and B220-expressing cells by incubating with the corresponding biotinylated antibodies, followed by depletion with MagniSort Streptavidin Negative Selection Beads (Thermo Fisher). The remaining lineage− BM cells were then stained with fluorescent antibodies before sorting. CD117hi BM progenitors were identified as lineage− CD117hi cells; MDPs were lineage−Siglec-H−CD117hiCD135+CD115+MHCII−CD11c− BM cells; CDPs were lineage−Siglec-H−CD117intCD135+CD115+MHCII−CD11c− BM cells; pre-cDC1s were lineage−Siglec-H−CD117intCD135+MHCIIint-neg CD11c+CD24+ BM cells; cMoPs were lineage−CD117+CD115+CD135− Ly-6C+CD11b− BM cells. For CLP and CMP sorting experiments, BM was depleted of CD3-, CD19-, CD11b-, TER-119-, Ly-6G- and B220-expressing cells. CLPs were identified as lineage−CD135+CD127+CD117intSca-1int BM cells; CMPs were lineage−CD117hiSca-1−CD16/CD32intCD34+ BM cells. For CDPs (CD115+CD127−), IL-7R+ LPs (CD115−CD127+) and IL-7R−CSF1R− NPs (CD115−CD127−) sorting experiments in Extended Data Fig. 9d,e, BM was depleted of CD3-, CD19-, CD105-, TER-119-, Ly-6C-, NK1.1- and B220-expressing cells. CDPs (CD115+CD127−) were identified as lineage−CD117int-negCD135+CD16/CD32−CD115+CD127− BM cells; IL-7R+ LPs were lineage−CD117int-negCD135+CD16/CD32−CD115−CD127+ BM cells; IL-7R−CSF1R− NPs were lineage−CD117int-negCD135+CD16/CD32−CD115−CD127− BM cells. For sequential gating/sorting strategies, see Supplementary Figure 1.
Cells were sorted into Iscove’s Modified Dulbecco’s Medium (IMDM) supplemented with 10% FBS, 1% penicillin-streptomycin solution, 1% sodium pyruvate, 1% MEM non-essential amino acid, 1% L-glutamine solution, and 55 μM β-mercaptoethanol (complete IMDM). For dendritic cell cultures, sorted cells were cultured in complete IMDM supplemented with 5% Flt3L-conditioned medium for 4–8 days. For monocyte cultures, cMoPs were cultured in complete IMDM supplemented with 20 ng ml−1 M-CSF (Peprotech) for 3 days.
Dendritic cell preparation
Spleen, MLNs and SLNs were minced and digested in 5 ml of complete IMDM with 250 μg ml−1 of collagenase B (Roche) and 30 U ml−1 of DNaseI (Sigma) for 30 min at 37°C with stirring. After digestion, single-cell suspensions were passed through 70 μm strainers and red blood cells were lysed with ammonium chloride-potassium bicarbonate lysis buffer.
Small intestine lamina propria preparation
Duodenum was collected and opened with a razor blade. The tissues were cleaned with PBS and gently vortexed in PBS supplemented with 2% FBS. After washing, the tissues were incubated in 10 ml DTT buffer (1× HBSS with 10 mM HEPES, 5 mM DTT, 2% FBS) for 20 min once, 10 ml EDTA buffer (1× HBSS with 10 mM HEPES, 5 mM EDTA, 2% FBS) for 20 min twice, and 10 ml Ca2+Mg2+ HBSS with 2% FBS and 10 mM HEPES for 10 min once, sequentially. The EDTA fractions were pooled for epithelium tuft cell analysis by flow cytometry. After incubation, the tissues were cut into 1 mm pieces and digested for 20 min in 10 ml Ca2+Mg2+ HBSS supplemented with 2% FBS, 10 mM HEPES, 25 μg ml−1 Liberase (Roche) and 5 μg ml−1 DNase I (Roche). All incubations and digestions were performed with 240 rpm shaking at 37 °C. After digestion, the supernatants were passed through a 100 μm filter, and washed with 10 ml FACS buffer. The cell pellet was resuspended in 4 ml 40% Percoll (Sigma), underlaid with 4 ml 70% Percoll, and centrifuged at 2,000 rpm with minimum acceleration and no deceleration for 20 min at 25 °C. The interphase fraction was collected and washed with 10 ml FACS buffer, and the resulting cells were analysed by flow cytometry.
Adoptive transfer and BM chimeras
For adoptive transfer, pre-cDC1s (1.5–13 × 104), CDPs and MDPs (0.8–8 × 10⁴) were sort purified and intravenously injected into sub-lethally (600 rads) irradiated CD45.1+ (B6-Ly5.1/Cr) recipient mice. Mice were analysed 5 days (pre-cDC1) or 7 days (CDP and MDP) after adoptive transfer. For Cebpb-knockout analysis, Cebpbfl/fl CD117hi BM progenitors were sort purified and transduced with Cre-expressing retrovirus overnight before being washed and intravenously injected into sub-lethally (600 rads) irradiated CD45.1+ (B6-Ly5.1/Cr) recipient mice. Mice were analysed 7 days after adoptive transfer. For mixed BM chimeras, equal mix of CD45.1+ WT BM and CD45.2+ Nfil3++ or Nfil3−/− BM were intravenously injected into lethally (1,050 rads) irradiated CD45.1+ (B6-Ly5.1/Cr) recipient mice. Mice were analysed 8 weeks after transplantation.
ELISA
For IFNα ELISA, 2 × 10⁴ splenic pDCs were sort purified and stimulated with CpG-A 2216 (6 μg ml−1) for 16 h. Supernatants were analysed with an IFNα Mouse ELISA Kit (Invitrogen). Total IgE ELISA was performed with a Mouse IgE ELISA Set (BD) and Reagent Set B (BD). For total IgG1 ELISA, plates were coated with 2.5 μg ml−1 of rat anti-mouse IgG1 (A85-3; catalogue (cat.) no. 553445; BD), blocked, detected with biotin rat anti-mouse IgG1 (A85-1; cat. no. 550331; BD; 1:10,000 dilution) and Streptavidin HRP (cat. no. 554066; BD; 1:1,000 dilution). IgG1 standard was purified mouse IgG1 anti-NFIL3 antibody (sc-374451; Santa Cruz Biotechnology).
Retroviral analysis
Transfection, transduction and retroviral analysis of −165 kb Zeb2 enhancer reporters8 were performed as described50, with modifications. The −165 kb Zeb2 enhancer regions were amplified from genomic DNA of WT and Δ1+2+3 mice using primers 165-F and 165-R to generate WT and Δ1+2+3 reporter constructs. The AgeI-HpaI fragments from WT and Δ1+2+3 reporter constructs were interchanged to generate Δ1 and Δ2+3 reporter constructs. Δ2, Δ3, Δ1+2 and Δ1+3 reporter constructs were generated by overlapping PCR using primers site2-mF, site2-mR, site3-mF and site3-mR.
Retroviral vector MSCV-Neo-Flag-ER-Hoxb8 was provided by H. W. Virgin. Retroviral vector for E2A has been described previously8. Oligonucleotide primers used to generate retroviral vectors for Hoxb8, NFIL3, GFP–NFIL3, NFIL3–KRAB, NFIL3-VP16, C/EBPα, C/EBPβ (LAP isoform), C/EBPγ and C/EBPδ are described in Supplementary Table 1.
Generation of Hoxb8 hematopoietic progenitor cell line
BM cells were isolated from 6-week-old WT or Δ1+2+3 mice and CD3-, CD19-, CD105-, TER-119-, Ly-6G- and B220-expressing lineage-committed cells were depleted. The lineage− BM cells were cultured in complete IMDM supplemented with 50 ng ml−1 SCF (Peprotech), 25 ng ml−1 IL-3 (Peprotech), 25 ng ml−1 IL-6 (Peprotech) and 5% Flt3L-conditioned medium for 2 days and then retrovirally transduced with MSCV-Neo-Flag-ER-Hoxb8 or MSCV-Neo-ER-Hoxb8. Three days after infection, 1 μM β-oestradiol (Sigma) and 1 mg ml−1 G418 were added to select and maintain growth of ER-Hoxb8-transduced cells.
CUT&RUN and data analysis
NFIL3, C/EBPα and C/EBPβ CUT&RUN51 was performed with a CUTANA ChIC/CUT&RUN Kit (EpiCypher) per manufacturer's protocol, with modifications.
For NFIL3 CUT&RUN in GFP–NFIL3− and GFP–NFIL3+ BM cells, Nfil3GFP/GFP mice were injected once daily, subcutaneously, with 10 μg recombinant Flt3L-Ig (BE0098; Bio X Cell) for three consecutive days to expand GFP–NFIL3+ dendritic cell progenitor cell numbers. 0.7 × 10⁶ GFP–NFIL3− and GFP–NFIL3+ BM cells were sort purified 24 h after the third dose of Flt3L-Ig treatment and depleted of CD3-, CD19-, B220-, CD105-, TER-119-, Ly-6G-, CD4-, CD8b-, CD11b-, Ly-6C- and MHCII-expressing cells. Anti-NFIL3 antibody (sc-9550X; Santa Cruz Biotechnology) was used for NFIL3 CUT&RUN in GFP–NFIL3− and GFP–NFIL3+ BM cells.
For NFIL3, C/EBPα and C/EBPβ CUT&RUN in WT or Δ1+2+3 Hoxb8 cell lines, the cell lines were generated with MSCV-Neo-ER-Hoxb8 retrovirus. NFIL3 CUT&RUN was performed in Hoxb8 cell lines stably expressing Flag–NFIL3 using anti-Flag antibody (F1804; Sigma); C/EBPα CUT&RUN was performed in Hoxb8 cell lines stably expressing C/EBPα using anti-C/EBPα antibody (8178S; Cell Signaling Technology); C/EBPβ CUT&RUN was performed in Hoxb8 cell lines transduced with empty retrovirus using anti-C/EBPβ antibody (sc-7962X; Santa Cruz Biotechnology). 0.5 × 10⁶ cells were used for each sample and 0.05 ng Escherichia coli spike-in DNA was added into each sample as spike-in control.
Libraries for CUT&RUN were prepared with a NEBNext Ultra II DNA Library Prep Kit for Illumina (New England Biolabs), with modifications described previously52 which aim to preserve short DNA fragments. Briefly, all CUT&RUN DNA were treated with End Prep module at 20 °C for 30 min and 50 °C for 60 min to reduce the melting of short DNA. Ligation was performed by adding 3.8 pmol of adaptor and incubated at 20 °C for 15 min. To clean up the reaction, 1.75× volumes of AMPure XP beads (Beckman Coulter) were added to capture short ligation products. PCR amplification was performed for 14 cycles. The resulting libraries were cleaned up using double-sided size selection (0.8× volumes, followed by 1.2× volumes of AMPure XP beads) to purify PCR products in the range of 150–350 bp. Libraries with different indexes were pooled and sequenced with an Illumina NovaSeq 6000 as paired-end reads extending 150 bases.
The adaptor sequences were removed by Trimmomatic53 before alignment. To visualize CUT&RUN datasets performed in GFP–NFIL3−, GFP–NFIL3+ BM cells and WT Hoxb8 cells with UCSC genome browser, the CUT&RUN reads were aligned and mapped to the mouse reference genome (GRCm38/mm10) by Bowtie2 software. The duplicated reads were discarded using ‘make tag directory’ in Homer with the parameter -tbp 1. Data were visualized with makeUCSCfile in Homer. Peaks from individual conditions were identified by findPeaks in Homer with a 200-bp window. To visualize CUT&RUN datasets performed in WT or Δ1+2+3 cells with Integrative Genomics Viewer, the customized bowtie2 indexes (mm10_chr2: 44749545-45351482) were created for WT and Δ1+2+3 genomes, specifically, for Zeb2 locus alignment.
ChIP–seq and data analysis
NFIL3 ChIP–seq in Hoxb8 cell line was performed as described54, with modifications. The Hoxb8 cell line made with MSCV-Neo-Flag-ER-Hoxb8 retrovirus and stably expressing Flag-NFIL3 was generated by retrovirally transducing with MSCV-Flag-NFIL3-IRES-GFP vector and sorting for expression of GFP. Thirty million cells were crosslinked with 1% formaldehyde for 5 min, quenched with 1/20 volume of 2.5 M glycine and washed twice with PBS. To obtain nuclei, cell pellets were incubated in 1 ml lysis buffer 1 (50 mM HEPES, pH 7.5, 140 mM NaCl, 1 mM EDTA, 10% glycerol, 0.5% NP40 and 0.25% Triton X-100) supplemented with protease inhibitors for 10 min, and 1 ml lysis buffer 2 (10 mM Tris-HCl, pH 8.0, 200 mM NaCl, 1 mM EDTA and 0.5 mM EGTA) supplemented with protease inhibitors for 10 min. To shear chromatin, nuclei pellets were gently rinsed with shearing buffer D3 (10 mM Tris-HCl, pH 7.6, 1 mM EDTA, and 0.1% SDS) twice, and then sonicated at 4 °C in shearing buffer D3 for 17 min, of 10% duty cycle, 75 Watts intensity peak incident power and 200 cycles per burst, with an ME220 focused-ultrasonicator (Covaris). A 5% fraction of lysate were kept for input, and the remaining lysate were immunoprecipitated overnight at 4 °C with Dynabeads Protein G (Invitrogen) that had been pre-incubated with 5 μg of anti-NFIL3 antibody (sc-9550X; Santa Cruz Biotechnology). Beads containing protein-DNA complexes were washed and DNA fragments were reverse-crosslinked and eluted as previously described54.
Libraries for ChIP-seq were prepared with a ThruPLEX DNA-seq kit (Rubicon Genomics), cleaned up with AMPure XP beads, and sequenced with an Illumina HiSeq 2500 as single ‘reads’ extending 50 bases.
ChIP-seq datasets were aligned and mapped to the mouse reference genome (GRCm38/mm10) by Bowtie software. The duplicated reads were discarded using ‘make tag directory’ in Homer with the parameter -tbp 1. Data were visualized with the makeUCSCfile in Homer. NFIL3 peaks were identified by findPeaks in Homer with a 200-bp window.
EMSA
Oligonucleotide pairs were annealed to generate probes that were labelled with 32P-dCTP using Klenow polymerase (Supplementary Table 1). HEK293FT cells were transiently transfected with retroviral vectors for NFIL3, C/EBPβ (LAP isoform), C/EBPα, E2A or empty vector using TransIT-LT1. After 48 h, cells were lysed with buffer A (10 mM HEPES-KOH, pH 7.9, 1.5 mM MgCl2 and 10 mM KCl) containing 0.2% NP40 and protease inhibitors. Nuclei were pelleted, resuspended in buffer C (20 mM HEPES-KOH, pH 7.9,420 mM NaCl, 1.5 mM MgCl2, 0.2 mM EDTA and 25% glycerol) containing protease inhibitors, and centrifuged to obtain nuclear extracts. Protein concentration of nuclear extracts was determined by the Bradford assay. EMSA assays were performed as previously described54, with modifications. 2.5 × 10⁴ cpm of labelled probes were mixed with 1 μg of nuclear extract in EMSA buffer containing 20 mM HEPES-KOH, pH 7.9, 50 mM KCl, 1 mM EDTA, 2 mM DTT, 2 mM MgCl2, 0.25 mg ml−1 BSA, 5% glycerol and 50 μg ml−1 poly(dI-dC). For NFIL3 supershift, 100 ng of rabbit anti-NFIL3 antibody (sc-28203; Santa Cruz Biotechnology) was used. Reactions were incubated at 30 °C (NFIL3, C/EBPβ and C/EBPα) or 4 °C (E2A) for 30 min and separated on 3.5% (NFIL3) or 5% (C/EBPβ, C/EBPα and E2A) polyacrylamide gels at 150 V at room temperature. The results were analysed by autoradiography.
For the EMSA probe competition experiment shown in Fig. 3d, 40-bp 32P-labelled DNA probe containing an optimized NFIL3 motif and flanking sequence of the NFIL3-C/EBP binding site 3 from the −165 kb Zeb2 enhancer, (N>C probe), was used for NFIL3, C/EBPβ and C/EBPα EMSA. A 28 bp 32P-labelled DNA probe encompassing E box-2 from the −165 kb Zeb2 enhancer was used for E2A EMSA. NFIL3, C/EBPβ, C/EBPα or E2A binding specificity was demonstrated by competition using 200-fold excess of indicated non-radioactively labelled probes. The competitors 1, 2 and 3 indicate DNA fragments encompassing NFIL3–C/EBP binding sites 1, 2 and 3. The competitor 1mut has the same sequence as competitor 1 except that the NFIL3–C/EBP binding site 1 was mutated. NFIL3 EMSA was performed with 100 ng of anti-NFIL3 antibody.
RT–qPCR
DNase-treated total RNA was prepared with NucleoSpin RNA XS Kit (Macherey-Nagel) and first-str and cDNA synthesis was performed with SuperScript IV Reverse Transcriptase (Invitrogen) using Oligo (dT)25. Relative quantification of gene expression was performed on a StepOnePlus Real-Time PCR System (Applied Biosystems) using Luminaris Color HiGreen High ROX qPCR Master Mix (Thermo Scientific). PCR conditions were 2 min at 50 °C, 10 min at 95 °C, followed by 40 3-step cycles consisting of 15 s at 95 °C, 30 s at 60 °C and 30 s at 72 °C. Oligonucleotide primers used are listed in Supplementary Table 1.
RNA-seq and data analysis
Splenic cDC1s were sort purified after CD11c enrichment (CD11c Micro-Beads UltraPure, mouse; Miltenyi Biotec) and B cells were stimulated with IL-4 (20 ng ml−1) + lipopolysaccharide (LPS) (5 μg ml−1) for 24 h. RNA-seq libraries were prepared with 10 ng of total RNA using the SMARTer Ultra Low RNA kit for Illumina Sequencing (Takara-Clontech) per manufacturer's protocol and sequenced on an Illumina NovaSeq 6000 as paired-end reads extending 150 bases.
RNA-seq reads were aligned to mouse reference genome (GRCm38/mm10) with STAR version 2.5.1a. Gene counts were derived from the number of uniquely aligned unambiguous reads by Subread:featureCount version 1.4.6-p5. All gene counts were then imported into the R/Bio-conductor package EdgeR and TMM normalization size factors were calculated to adjust for samples for differences in library size. PCA was performed using OriginPro 2021b software.
Statistics
Statistical analysis was performed using GraphPad Prism software version 9. Brown–Forsythe and Welch ANOVA with Dunnett’s T3 multiple comparisons test; unpaired, two-tailed Mann–Whitney U test; ordinary two-way ANOVA with Dunnett’s multiple comparisons test; and unpaired, multiple t-tests with Welch correction were used to determine significant differences between samples. Data shown in scatter plots with bar are mean ± s.d. Centre values in scatter plots correspond to the median.
Extended Data
Extended Data Figure 1. Generation of Nfil3GFP fusion protein reporter mice.
a, Schematic diagrams of the mouse Nfil3 WT allele, the targeting vector and targeted allele. Filled and open boxes denote coding and noncoding exons of Nfil3, respectively. N indicate NdeI site. Triangles indicate loxP sequences. TK, thymidine kinase promoter; DTA, diphtheria toxin A; pGK-Neo, neomycin selection cassette. b, Southern blot analysis of Nfil3+/+ and Nfil3GFP/+. Genomic DNA was isolated from mouse liver, digested with NdeI, electrophoresed, and hybridized with Digoxigenin-labeled probes indicated in a. Southern blot with 5’ probe gave a 10.0 and a 5.0 kb band for WT and targeted allele. Southern blot with 3’ probe gave a 10.0 and a 7.7 kb band for WT and targeted allele respectively. Progeny from ES cell clone 22 were bred to CMV-Cre mice to remove the neomycin selection cassette, and used in the following study. c, Flow cytometric analysis showing pDCs and cDCs differentiated from WT CD117hi BM progenitors retrovirally expressing NFIL3 and GFP-NFIL3. The CD24+ CD172a− cDC1s and CD172a+ cDC2s are pre-gated as CD317− B220− MHCII+ CD11c+ cells. Data shown are one of two similar experiments. d, Representative flow plots showing pDCs and cDCs among live splenocytes from WT and Nfil3GFP/GFP mice, cDCs are pre-gated as CD317− B220− MHCII+ CD11c+ cells. Data shown are one of three similar experiments. e, Representative flow plots showing GFP-NFIL3 expression in B cells from Nfil3GFP/GFP mice. Whole splenocytes were cultured with medium or were stimulated with IL-4 (20 ng/mL) and LPS (5 μg/mL) for 24 h. B cells were pre-gated as CD19+ cells. Data shown are one of two similar experiments. f, Nfil3 transcripts, measured by RT-qPCR, in B cells sorted from e.
Extended Data Figure 2. Nfil3 acts as a repressor to drive cDC1 specification.
a, Gating strategy for MDP, CDP and pre-cDC1 progenitors in BM. b, Flow cytometric analysis showing pDCs and cDCs differentiated from GFP negative and positive CDPs sorted from Nfil3GFP/GFP mice. Data shown are one of four similar experiments. c, Flow cytometric analysis showing pDCs and cDCs differentiated from WT CD117hi BM progenitors retrovirally expressing NFIL3, NFIL3-KRAB or NFIL3-VP16. The cDCs are pre-gated as CD317− B220− MHCII+ CD11c+ cells. Data shown are one of three similar experiments. Schematic diagrams of NFIL3, NFIL3-KRAB and NFIL3-VP16 are depicted below the plots. DBD denotes DNA-binding domain.
Extended Data Figure 3. ChIP-seq identifies NFIL3 binding in the −165 kb Zeb2 enhancer.
a, Flow cytometric analysis showing DC potential of Hoxb8 cell line. The cells were washed twice with cold PBS to remove residual β-estradiol and cytokines before standard Flt3L culture for 7 days. b, Venn diagram showing numbers of specific or overlapping NFIL3 ChIP-seq peaks in Flag-NFIL3 expressing Hoxb8 cell line or T cells. c, De novo DNA motif analysis using NFIL3 peaks in the Flag-NFIL3 expressing Hoxb8 cell line or T cells. # Tg seq. and % Tg/Bg denote the number of total target sequences and percentage of target sequences/percentage of background sequences, respectively. d, FIMO analysis depicting P-values of the three predicted NFIL3 binding sites in the −165 kb Zeb2 enhancer. The motif used in FIMO analysis is de novo NFIL3 motif obtained from NFIL3 peaks in Flag-NFIL3 expressing Hoxb8 cell line (shown in c). e, Alignment of human, genome draft hg19, and mouse, genome draft mm10, for the −165 kb Zeb2 enhancer regions. Red boxes indicate NFIL3 binding sites. f, EMSA with nuclear extracts of HEK293FT cells transfected with an empty vector or an NFIL3-encoding vector. A 37 bp 32P-labelled DNA probe encompassing the NFIL3 binding site-1 from the −165 kb Zeb2 enhancer was synthesized as site-1 probe. A 40 bp 32P-labelled DNA probe containing an optimized NFIL3 motif and flanking sequence of the NFIL3/C/EBP binding site-3 from the −165 kb Zeb2 enhancer was synthesized as N>C probe. NFIL3 binding specificity was demonstrated by competition with non-radioactively labeled probes and supershift with the anti-NFIL3 antibody. The competitor 1 indicates site-1, and the competitor 1mut has the same sequence as site-1 except that the NFIL3/C/EBP binding site-1 was mutated.
Extended Data Figure 4. Targeting strategy of NFIL3 binding site mutant mice.
gRNA-1 and donor-1 were introduced into WT zygotes to mutate NFIL3 binding site-1. Δ1 mice were generated from the first round of targeting. gRNA-2, gRNA-3 and donor-2 were introduced into Δ1 homozygous zygotes to mutant NFIL3 binding site-2 and 3. Δ1+2 and Δ1+3 mice were generated from the second round of targeting. gRNA-4 and donor-3 were introduced into Δ1+2 heterozygous zygotes to mutate NFIL3 binding site-3. Δ1+2+3 mice were generated from the third round of targeting.
Extended Data Figure 5. Mutation of three NFIL3 binding sites in the −165 kb Zeb2 enhancer abrogates cDC2 development.
a, Representative flow plots showing cDCs and pDCs among live splenocytes from WT, Δ1, Δ1+2, Δ1+3 and Δ1+2+3 mice. cDCs are pre-gated as CD317− B220− MHCII+ CD11c+ cells. b, Number of splenic cDC1, cDC2, pDC, and frequency of splenic pDC in WT, Δ1, Δ1+2, Δ1+3 and Δ1+2+3 mice. Data are pooled from five independent experiments (n = 12 for WT, n = 11 for Δ1, Δ1+2, Δ1+3, and n = 8 for Δ1+2+3 mice). NS, not significant; b: Brown–Forsythe and Welch ANOVA with Dunnetťs T3 multiple comparisons test.
Extended Data Figure 6. Mutation of three NFIL3 binding sites in the −165 kb Zeb2 enhancer abrogates monocyte development.
a, Representative flow plots showing monocytes among live CD45+ peripheral blood cells from WT, Δ1, Δ1+2, Δ1+3 and Δ1+2+3 mice (pre-gate: CD45+ Ly-6G− cells). b, Representative flow plots showing cMoPs and monocytes in the BM of WT and Δ1+2+3 mice (pre-gate: lineage− Siglec-H− CD135− MHCII− CD11c− cells). Data shown are one of five similar experiments. c, Frequency of peripheral blood monocytes, splenic monocytes, and number of splenic monocytes in WT, Δ1, Δ1+2, Δ1+3 and Δ1+2+3 mice. Data are representative of four similar experiments for peripheral blood monocyte, and pooled from five independent experiments for splenic monocytes (peripheral blood monocytes: n = 9 for WT, n = 6 for Δ1, Δ1+2, n = 5 for Δ1+3 and n = 6 for Δ1+2+3 mice; splenic monocytes: n = 11 for WT, n = 7 for Δ1, n = 4 for Δ1+2, n = 7 for Δ1+3 and n = 8 for Δ1+2+3 mice). d, Representative flow plots showing B cells, T cells and NK cells among live splenocytes from WT and Δ1+2+3 mice. T cells are pre-gated as CD3+ CD19− cells and NK cells are pre-gated as CD3− CD19− cells. Data are representative of five independent experiments for B cells, T cells, and of three independent experiments for NK cells. e, Frequency of splenic B cells, CD4+ T cells and CD8+ T cells in WT, Δ1, Δ1+2, Δ1+3 and Δ1+2+3 mice. Data are pooled from three independent experiments (n = 9 for WT, n = 7 for Δ1, Δ1+2, Δ1+3, and n = 5 for Δ1+2+3 mice). NS, not significant; c, e: Brown–Forsythe and Welch ANOVA with Dunnett’s T3 multiple comparisons test.
Extended Data Figure 7. C/EBP factors bind to the −165 kb Zeb2 enhancer to support cDC2 and monocyte development.
a, ChIP-seq tracks display C/EBPβ binding around the Zeb2 locus in Ly-6Clow monocytes, moDCs and pDCs. b, Representative flow plots showing monocyte-like cells differentiated from Flt3L cultures of WT CDPs retrovirally expressing C/EBPα or C/EBPβ (LAP isoform) (pre-gate: CD317− B220− cells). cDCs expressing empty-retroviral vectors are shown as controls (dashed black lines) for Ly-6C and CD115 expression in MHCII− CD11c− cells. Data shown are one of two similar experiments. c, Representative flow plots showing cDCs differentiated from Flt3L cultures of WT CDPs retrovirally expressing C/EBPα, C/EBPβ, C/EBPγ or C/EBPδ (pre-gate: CD317− B220− cells). Data shown are one of three similar experiments.
Extended Data Figure 8. Myeloid and lymphoid pathways of pDC development are distinguished by different requirements in the −165 kb Zeb2 enhancer.
a, Representative flow plots showing pDCs and cDCs differentiated from sort purified CDPs and MDPs of WT and Δ1+2+3 mice, assessed after 5 days of culture with Flt3L. Data shown are one of three similar experiments. b, Representative flow plots showing in vivo developmental potential of CDPs and MDPs from WT and Δ1+2+3 mice. CDPs and MDPs (8 × 10³ - 8 × 10⁴) were sort purified and i.v. injected into sub-lethally irradiated CD45.1 recipients (B6-Ly5.1/Cr mice). After 7 days, recipient spleens were analyzed for the presence of CD45.2+ donor-derived pDCs and cDCs (pre-gate: CD45.2+ CD45.1− cells). Data shown are one of two (CDP) or three (MDP) similar experiments. c, Representative flow plots showing pDCs differentiated from sort purified CMPs and CLPs of WT and Δ1+2+3 mice, assessed after 7 (CMPs) or 5 (CLPs) days of culture with Flt3L. Data shown are one of two (CMP) or three (CLP) similar experiments. d, Representative flow plots showing CDPs (CD115+ CD127−), IL-7R+ LPs (CD115− CD127+) and IL-7R− CSF1R− NPs (CD115− CD127−) in the BM of WT and Δ1+2+3 mice (pre-gate: lineage− CD16/CD32− CD135+ CD117int-neg cells). Data shown are one of three similar experiments. e, Representative flow plots showing pDCs differentiated from sort purified CDPs, IL-7R+ LPs and IL-7R−CSF1R− NPs (as in d) of WT and Δ1+2+3 mice, assessed after 4 days of culture with Flt3L. Data shown are one of three similar experiments.
Extended Data Figure 9. Zeb2 is not required for the maintenance of cDC2, who support TH2 responses to H. polygyrus infection.
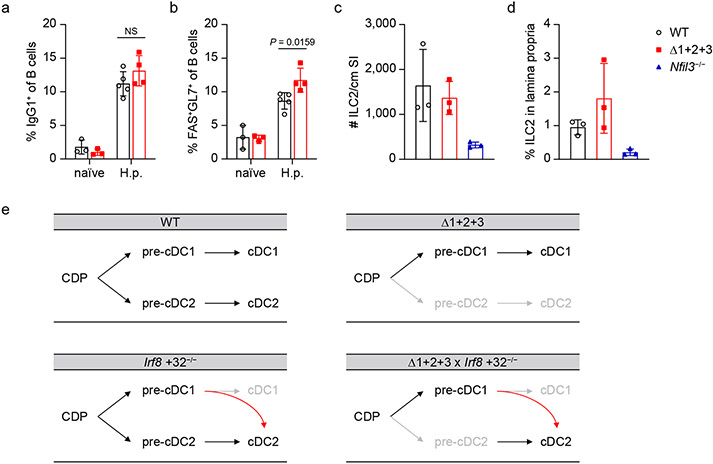
a, b, Frequency of IgG1+ class-switched B cells (a) or FAS+ GL7+ germinal center B cells (b) of total CD19+ B cells in MLN from WT or Δ1+2+3 naïve mice or mice infected for 14 days with H. polygyrus (H.p.) (200 L3 stage larvae). Data shown are one of two similar experiments (n = 3 for WT or Δ1+2+3 naïve mice, n = 5 for H.p. infected WT mice and n = 4 for H.p. infected Δ1+2+3 mice). c, d, Number of ILC2s per cm small intestine (c) and frequency of ILC2s in small intestine lamina propria CD45+ cells (d) of WT, Δ1+2+3 and Nfil3−/− mice (n = 3 for each genotype). ILC2s are gated as CD45+ CD11c− CD11b− CD3− CD4− CD90.2+ KLRG1+ cells. e, Diagrams showing DC development in WT, Δ1+2+3, Irf8 +32−/− and Δ1+2+3 × Irf8 +32−/− mice. Mean ± s.d.; NS, not significant; a, b: unpaired, multiple t tests with Welch correction.
Extended Data Fig. 10 ∣. Zeb2 is not required for the maintenance of cDC2, which support TH2 responses to H. polygyrus infection.
a, Diagrams showing DC development in WT, Δ1+2+3, Irf8 +32−/− and Δ1+2+3 × Irf8 +32−/− mice. b, Representative flow plots showing monocytes among CD45+ peripheral blood cells from WT, Δ1+2+3, Irf8 +32−/− and Δ1+2+3 × Irf8 +32−/− mice. c, Frequency of peripheral blood monocytes in WT, Δ1+2+3, Irf8 +32−/− and Δ1+2+3 × Irf8 +32−/− mice. Data are pooled from two independent experiments (n = 6 for WT, Δ1+2+3, n = 7 for Irf8 +32−/− and n = 6 for Δ1+2+3 × Irf8 +32−/− mice). d, Frequency of IL-4, IL-5, IL-13 or IFN-γ expressing CD4+ T cells in MLNs from WT, Δ1+2+3, Irf8 +32−/− and Δ1+2+3 × Irf8 +32−/− naïve mice or mice infected with H.p. for 14 days (pre-gate: TCRβ+CD4+ cells). Data are pooled from two independent experiments (n = 3 for naïve mice, n = 6 for H.p. infected WT, Δ1+2+3, Irf8 +32−/− mice and n = 5 for H.p. infected Δ1+2+3 × Irf8 +32−/− mice). WT versus Δ1+2+3 × Irf8 +32−/− IL-4 expressing CD4+ T cells in H.p. infected mice P = 0.1044, WT versus Δ1+2+3 × Irf8 +32−/− IL-13 expressing CD4+ T cells in H.p. infected mice P = 0.8243. e, f, Frequency of IgG1+ class-switched B cells (e) or FAS+GL7+ germinal center B cells (f) of total CD19+ B cells in MLNs from WT or Δ1+2+3 naïve mice or mice infected with H.p. for 14 days (n = 3 for WT or Δ1+2+3 naïve mice, n = 5 for H.p. infected WT mice and n = 4 for H.p. infected Δ1+2+3 mice). WT versus Δ1+2+3 IgG1+ class-switched B cells in H.p. infected mice P = 0.2145. g, Total serum IgE and IgG1 in naïve WT, Δ1+2+3 mice or mice infected with H.p. for 14 days. Data are pooled from two independent experiments (n = 4 for naïve mice and n = 9 for H.p. infected mice). h, Frequency of peripheral blood eosinophils and neutrophils in WT and Δ1+2+3 mice (n = 8 for each genotype). i, Number of ILC2s per cm small intestine and frequency of ILC2s in small intestine lamina propria CD45+ cells of WT and Δ1+2+3 mice (n = 3 for each genotype). WT versus Δ1+2+3 ILC2 number P > 0.9999, frequency P = 0.4000. j, Number of tuft cells per cm small intestine and frequency of tuft cells in small intestine epithelium CD45− cells of WT and Δ1+2+3 mice (n = 3 for each genotype). WT versus Δ1+2+3 tuft cell number P = 0.7000, frequency P = 0.7000. Mean ± s.d.; NS, not significant; c: Brown–Forsythe and Welch ANOVA with Dunnett’s T3 multiple comparisons test; d: ordinary two-way ANOVA with Dunnett’s multiple comparisons test; e–g: unpaired, multiple t tests with Welch correction; h–j: unpaired, two-tailed Mann–Whitney test.
Supplementary Material
Acknowledgements
This work is supported by the US National Institutes of Health (R01AI150297, R01CA248919); D.-H.K. is supported by the National Research Foundation of Korea (NRF-2020R1A6A3A03037855); S.T.F. is a Cancer Research Institute Irvington Fellow supported by the Cancer Research Institute; R.W. is supported by the National Institutes of Health (5T32GM007200, F30CA247262); S.J.V.D. is supported by the National Institutes of Health (R01HL148033); M.S.D. is supported by NIH/NIDDK (R01DK122790-01A1); and M.K. is supported by AMED CREST (JP19gm1310002). We thank J. M. White at the Department of Pathology and Immunology Transgenic Mouse Core at Washington University in St Louis, and the Genetic Editing and iPS Cell (GEiC) centre at Washington University in St Louis for the generation of mouse models; the Genome Technology Access Center at the McDonnell Genome Institute at Washington University School of Medicine for help with genomic analysis; M. J. Murphy for advice on EMSA probe design; A. Look and T. Mak for providing Nfil3−/− mice; V. Durai for advice on embryonic stem cell targeting; H. W. Virgin for providing Hoxb8 construct; V. K. Kuchroo for providing NFIL3 ChIP–seq data in T cells; J. F. Urban Jr for providing H. polygyrus L3 larvae; and K. Saylor for technical assistance in breeding the Cebpbfl/fl mice. This research was supported in part by the Intramural Research Program of the NIH, National Cancer Institute, Center for Cancer Research. The content of this publication does not necessarily reflect the views or policies of the Department of Health and Human Services, nor does mention of trade names, commercial products or organizations imply endorsement by the US Government. This work benefitted from data assembled by the ImmGen consortium.
Footnotes
Online content
Any methods, additional references, Nature Research reporting summaries, source data, extended data, supplementary information, acknowledgements, peer review information; details of author contributions and competing interests; and statements of data and code availability are available at https://doi.org/10.1038/s41586-022-04866-z.
Reporting summary
Further information on research design is available in the Nature Research Reporting Summary linked to this paper.
Competing interests M.S.D. is a consultant for Inbios, Vir Biotechnology, Senda Biosciences, and Carnival Corporation, and on the Scientific Advisory Boards of Moderna and Immunome. The Diamond laboratory has received unrelated funding support in sponsored research agreements from Moderna, Vir Biotechnology, Kaleido, and Emergent BioSolutions. K.M.M. is on the Scientific Advisory Board for Harbour Biomed.
Supplementary information The online version contains supplementary material available at https://doi.org/10.1038/s41586-022-04866-z.
Data availability
The CUT&RUN, ChIP–seq and RNA-seq data generated in the current study are available in the Gene Expression Omnibus database with the accession number GSE188579. ChIP–seq datasets for NFIL3 in T cells were provided by V. K. Kuchroo28. ChIP–seq datasets for C/EBPβ in Ly-6Clow monocytes34 (GSE80031) and gene expression microarray datasets for Cebpa KO hematopoietic stem and progenitor cells22 (GSE146288) were downloaded and reanalyzed. Source data are provided with this paper.
References
- 1.Naik SH et al. Development of plasmacytoid and conventional dendritic cell subtypes from single precursor cells derived in vitro and in vivo. Nat. Immunol 8, 1217–1226 (2007). [DOI] [PubMed] [Google Scholar]
- 2.Onai N. et al. Identification of clonogenic common Flt3+ M-CSFR+ plasmacytoid and conventional dendritic cell progenitors in mouse bone marrow. Nat. Immunol 8, 1207–1216 (2007). [DOI] [PubMed] [Google Scholar]
- 3.Liu K. et al. In vivo analysis of dendritic cell development and homeostasis. Science 324, 392–397 (2009). [DOI] [PMC free article] [PubMed] [Google Scholar]
- 4.Grajales-Reyes GE et al. Batf3 maintains autoactivation of Irf8 for commitment of a CD8alpha(+) conventional DC clonogenic progenitor. Nat. Immunol 16, 708–717 (2015). [DOI] [PMC free article] [PubMed] [Google Scholar]
- 5.Schlitzer A. et al. Identification of cDC1- and cDC2-committed DC progenitors reveals early lineage priming at the common DC progenitor stage in the bone marrow. Nat. Immunol 16, 718–728 (2015). [DOI] [PubMed] [Google Scholar]
- 6.Durai V. et al. Cryptic activation of an Irf8 enhancer governs cDC1 fate specification. Nat. Immunol 20, 1161–1173 (2019). [DOI] [PMC free article] [PubMed] [Google Scholar]
- 7.Bagadia P. et al. An Nfil3-Zeb2-Id2 pathway imposes Irf8 enhancer switching during cDC1 development. Nat. Immunol 20, 1174–1185 (2019). [DOI] [PMC free article] [PubMed] [Google Scholar]
- 8.Huang X. et al. Differential usage of transcriptional repressor Zeb2 enhancers distinguishes adult and embryonic hematopoiesis. Immunity 54, 1417–1432 (2021). [DOI] [PMC free article] [PubMed] [Google Scholar]
- 9.Kumamoto Y. et al. CD301b+ dermal dendritic cells drive T helper 2 cell-mediated immunity. Immunity 39, 733–743 (2013). [DOI] [PMC free article] [PubMed] [Google Scholar]
- 10.Gao Y. et al. Control of T helper 2 responses by transcription factor IRF4-dependent dendritic cells. Immunity 39, 722–732 (2013). [DOI] [PMC free article] [PubMed] [Google Scholar]
- 11.Tussiwand R. et al. Klf4 expression in conventional dendritic cells is required for T helper 2 cell responses. Immunity 42, 916–928 (2015). [DOI] [PMC free article] [PubMed] [Google Scholar]
- 12.Murphy TL et al. Transcriptional control of dendritic cell development. Annu. Rev. Immunol 34, 93–119 (2016). [DOI] [PMC free article] [PubMed] [Google Scholar]
- 13.Cisse B. et al. Transcription factor E2-2 is an essential and specific regulator of plasmacytoid dendritic cell development. Cell 135, 37–48 (2008). [DOI] [PMC free article] [PubMed] [Google Scholar]
- 14.Scott CL et al. The transcription factor Zeb2 regulates development of conventional and plasmacytoid DCs by repressing Id2. J. Exp. Med 213, 897–911 (2016). [DOI] [PMC free article] [PubMed] [Google Scholar]
- 15.Wu X. et al. Transcription factor Zeb2 regulates commitment to plasmacytoid dendritic cell and monocyte fate. Proc. Natl Acad. Sci. USA 113, 14775–14780 (2016). [DOI] [PMC free article] [PubMed] [Google Scholar]
- 16.Tamura T. et al. IFN regulatory factor-4 and -8 govern dendritic cell subset development and their functional diversity. J. Immunol 174, 2573–2581 (2005). [DOI] [PubMed] [Google Scholar]
- 17.Bajana S, Roach K, Turner S, Paul J & Kovats S IRF4 promotes cutaneous dendritic cell migration to lymph nodes during homeostasis and inflammation. J. Immunol 189, 3368–3377 (2012). [DOI] [PMC free article] [PubMed] [Google Scholar]
- 18.Bajana S, Turner S, Paul J, Ainsua-Enrich E & Kovats S IRF4 and IRF8 Act in CD11c+ cells to regulate terminal differentiation of lung tissue dendritic cells. J Immunol 196, 1666–1677 (2016). [DOI] [PMC free article] [PubMed] [Google Scholar]
- 19.Fogg DK et al. A clonogenic bone marrow progenitor specific for macrophages and dendritic cells. Science 311, 83–87 (2006). [DOI] [PubMed] [Google Scholar]
- 20.Hettinger J. et al. Origin of monocytes and macrophages in a committed progenitor. Nat. Immunol 14, 821–830 (2013). [DOI] [PubMed] [Google Scholar]
- 21.Welner RS et al. C/EBPα is required for development of dendritic cell progenitors. Blood 121, 4073–4081 (2013). [DOI] [PMC free article] [PubMed] [Google Scholar]
- 22.Anirudh S. et al. TNFα rescues dendritic cell development in hematopoietic stem and progenitor cells lacking C/EBPα. Cells 9, 1223 (2020). [DOI] [PMC free article] [PubMed] [Google Scholar]
- 23.Zhang W. et al. Molecular cloning and characterization of NF-IL3A, a transcriptional activator of the human interleukin-3 promoter. Mol. Cell. Biol 15, 6055–6063 (1995). [DOI] [PMC free article] [PubMed] [Google Scholar]
- 24.Cowell IG, Skinner A & Hurst HC Transcriptional repression by a novel member of the bZIP family of transcription factors. Mol. Cell. Biol 12, 3070–3077 (1992). [DOI] [PMC free article] [PubMed] [Google Scholar]
- 25.Gilbert LA et al. Genome-scale CRISPR-mediated control of gene repression and activation. Cell 159, 647–661 (2014). [DOI] [PMC free article] [PubMed] [Google Scholar]
- 26.Cress WD & Triezenberg SJ Critical structural elements of the VP16 transcriptional activation domain. Science 251, 87–90 (1991). [DOI] [PubMed] [Google Scholar]
- 27.Wang GG et al. Quantitative production of macrophages or neutrophils ex vivo using conditional Hoxb8. Nat. Methods 3, 287–293 (2006). [DOI] [PubMed] [Google Scholar]
- 28.Zhu C. et al. An IL-27/NFIL3 signalling axis drives Tim-3 and IL-10 expression and T-cell dysfunction. Nat. Commun 6, 6072 (2015). [DOI] [PMC free article] [PubMed] [Google Scholar]
- 29.Grant CE, Bailey TL & Noble WS FIMO: scanning for occurrences of a given motif. Bioinformatics 27, 1017–1018 (2011). [DOI] [PMC free article] [PubMed] [Google Scholar]
- 30.Haas NB, Cantwell CA, Johnson PF & Burch JB DNA-binding specificity of the PAR basic leucine zipper protein VBP partially overlaps those of the C/EBP and CREB/ATF families and is influenced by domains that flank the core basic region. Mol. Cell. Biol 15, 1923–1932 (1995). [DOI] [PMC free article] [PubMed] [Google Scholar]
- 31.Ozkurt IC & Tetradis S Parathyroid hormone-induced E4BP4/NFIL3 down-regulates transcription in osteoblasts. J. Biol. Chem 278, 26803–26809 (2003). [DOI] [PubMed] [Google Scholar]
- 32.Li F, Liu J, Jo M & Curry TE Jr. A role for nuclear factor interleukin-3 (NFIL3), a critical transcriptional repressor, in down-regulation of periovulatory gene expression. Mol. Endocrinol 25, 445–459 (2011). [DOI] [PMC free article] [PubMed] [Google Scholar]
- 33.Tamura A. et al. C/EBPβ is required for survival of Ly6C− monocytes. Blood 130, 1809–1818 (2017). [DOI] [PMC free article] [PubMed] [Google Scholar]
- 34.Thomas GD et al. Deleting an Nr4a1 super-enhancer subdomain ablates Ly6Clow monocytes while preserving macrophage gene function. Immunity 45, 975–987 (2016). [DOI] [PMC free article] [PubMed] [Google Scholar]
- 35.Heng TS et al. The Immunological Genome Project: networks of gene expression in immune cells. Nat. Immunol 9, 1091–1094 (2008). [DOI] [PubMed] [Google Scholar]
- 36.Sathe P, Vremec D, Wu L, Corcoran L & Shortman K Convergent differentiation: myeloid and lymphoid pathways to murine plasmacytoid dendritic cells. Blood 121, 11–19 (2013). [DOI] [PubMed] [Google Scholar]
- 37.Rodrigues PF et al. Distinct progenitor lineages contribute to the heterogeneity of plasmacytoid dendritic cells. Nat. Immunol 19, 711–722 (2018). [DOI] [PMC free article] [PubMed] [Google Scholar]
- 38.Dress RJ et al. Plasmacytoid dendritic cells develop from Ly6D+ lymphoid progenitors distinct from the myeloid lineage. Nat. Immunol 20, 852–864 (2019). [DOI] [PubMed] [Google Scholar]
- 39.Satpathy AT et al. Notch2-dependent classical dendritic cells orchestrate intestinal immunity to attaching-and-effacing bacterial pathogens. Nat. Immunol 14, 937–948 (2013). [DOI] [PMC free article] [PubMed] [Google Scholar]
- 40.Anderson DA III, Dutertre CA, Ginhoux F & Murphy KM Genetic models of human and mouse dendritic cell development and function. Nat. Rev. Immunol 21, 101–115 (2020). [DOI] [PMC free article] [PubMed] [Google Scholar]
- 41.Durai V & Murphy KM Functions of murine dendritic cells. Immunity 45, 719–736 (2016). [DOI] [PMC free article] [PubMed] [Google Scholar]
- 42.Cervantes-Barragan L. et al. Plasmacytoid dendritic cells control T-cell response to chronic viral infection. Proc. Natl Acad. Sci. USA 109, 3012–3017 (2012). [DOI] [PMC free article] [PubMed] [Google Scholar]
- 43.Hildner K. et al. Batf3 deficiency reveals a critical role for CD8α+ dendritic cells in cytotoxic T cell immunity. Science 322, 1097–1100 (2008). [DOI] [PMC free article] [PubMed] [Google Scholar]
- 44.Shortman K. How does batf3 determine dendritic cell development? Immunol Cell Biol 93, 681–682 (2015). [DOI] [PubMed] [Google Scholar]
- 45.Satpathy AT et al. Zbtb46 expression distinguishes classical dendritic cells and their committed progenitors from other immune lineages. J. Exp. Med 209, 1135–1152 (2012). [DOI] [PMC free article] [PubMed] [Google Scholar]
- 46.Motomura Y. et al. The transcription factor E4BP4 regulates the production of IL-10 and IL-13 in CD4+ T cells. Nat. Immunol 12, 450–459 (2011). [DOI] [PMC free article] [PubMed] [Google Scholar]
- 47.Sterneck E, Zhu S, Ramirez A, Jorcano JL & Smart RC Conditional ablation of C/EBPβ demonstrates its keratinocyte-specific requirement for cell survival and mouse skin tumorigenesis. Oncogene 25, 1272–1276 (2006). [DOI] [PMC free article] [PubMed] [Google Scholar]
- 48.Kamizono S. et al. Nfil3/E4bp4 is required for the development and maturation of NK cells in vivo. J. Exp. Med 206, 2977–2986 (2009). [DOI] [PMC free article] [PubMed] [Google Scholar]
- 49.Camberis M, Le Gros G & Urban J Jr Animal model of Nippostrongylus brasiliensis and Heligmosomoides polygyrus. Curr. Protoc. Immunol 19, 12 (2003). [DOI] [PubMed] [Google Scholar]
- 50.Kim S. et al. High amount of transcription factor IRF8 engages AP1–IRF composite elements in enhancers to direct type 1 conventional dendritic cell identity. Immunity 53, 759–774.e9 (2020). [DOI] [PMC free article] [PubMed] [Google Scholar]
- 51.Skene PJ, Henikoff JG & Henikoff S Targeted in situ genome-wide profiling with high efficiency for low cell numbers. Nat. Protoc 13, 1006–1019 (2018). [DOI] [PubMed] [Google Scholar]
- 52.Zhu Q, Liu N, Orkin SH & Yuan GC CUT&RUNTools: a flexible pipeline for CUT&RUN processing and footprint analysis. Genome Biol. 20, 192 (2019). [DOI] [PMC free article] [PubMed] [Google Scholar]
- 53.Bolger AM, Lohse M & Usadel B Trimmomatic: a flexible trimmer for Illumina sequence data. Bioinformatics 30, 2114–2120 (2014). [DOI] [PMC free article] [PubMed] [Google Scholar]
- 54.Iwata A. et al. Quality of TCR signaling determined by differential affinities of enhancers for the composite BATF–IRF4 transcription factor complex. Nat. Immunol 18, 563–572 (2017). [DOI] [PMC free article] [PubMed] [Google Scholar]
Associated Data
This section collects any data citations, data availability statements, or supplementary materials included in this article.
Supplementary Materials
Data Availability Statement
The CUT&RUN, ChIP–seq and RNA-seq data generated in the current study are available in the Gene Expression Omnibus database with the accession number GSE188579. ChIP–seq datasets for NFIL3 in T cells were provided by V. K. Kuchroo28. ChIP–seq datasets for C/EBPβ in Ly-6Clow monocytes34 (GSE80031) and gene expression microarray datasets for Cebpa KO hematopoietic stem and progenitor cells22 (GSE146288) were downloaded and reanalyzed. Source data are provided with this paper.


