

Abstract
Although Venezuelan equine encephalitis virus (VEEV) is a life-threatening pathogen with a capacity for epidemic outbreaks, there are no FDA-approved VEEV antivirals for humans. VEEV cytotoxicity is partially attributed to the formation of a tetrameric complex between the VEEV capsid protein, the nuclear import proteins importin-α and importin-β, and the nuclear export protein CRM1, which together block trafficking through the nuclear pore complex. Experimental studies have identified small molecules from the CL6662 scaffold as potential inhibitors of the viral nuclear localization signal (NLS) sequence binding to importin-α. However, little is known about the molecular mechanism of CL6662 inhibition. To address this issue, we employed all-atom replica exchange molecular dynamics simulations to probe, in atomistic detail, the binding mechanism of CL6662 ligands to importin-α. Three ligands, including G281–1485 and two congeners with varying hydrophobicities, were considered. We investigated the distribution of ligand binding poses, their locations, and ligand specificities measured by the strength of binding interactions. We found that G281–1485 binds non-specifically without forming well-defined binding poses throughout the NLS binding site. Binding of less hydrophobic congener becomes strongly on-target with respect to the NLS binding site, but remains non-specific. However, a more hydrophobic congener is a strongly specific binder and the only ligand out of three to form a well-defined binding pose, while partially overlapping with the NLS binding site. Based on free energy estimates we argue that all three ligands weakly compete with the viral NLS sequence for binding to importin-α in an apparent compromise to preserve host NLS binding. We further show that all-atom replica exchange binding simulations is a viable tool for studying ligands binding non-specifically without forming well-defined binding poses.
Introduction
Venezuelan equine encephalitis virus (VEEV) is a highly infectious and emerging zoonotic alphavirus found in the Americas with a potential for epidemic outbreaks and use as a bioweapon.1,2 Although VEEV infection typically produces flu-like symptoms that last about a week, severe neurological disease including encephalitis presents in approximately 14% of cases with <1% of cases being fatal. VEEV outbreaks have been reported in Latin American countries and the United States.3 Despite its prevalence and epidemic potential, no FDA-approved vaccines or antivirals exist for human treatment.2
After infection of its host cell, VEEV interferes with the nuclear pore complex (NPC) and disrupts nucleocytoplasmic trafficking.2 The VEEV capsid protein contains both a nuclear localization signal (NLS), which binds to the nuclear transport protein importin-α (impα), that alongside importin-β aids in the delivery of cargo to the cell nucleus through the NPC, and a nuclear export signal (NES), which binds to the nuclear export protein CRM1.4,5 VEEV capsid protein forms a tetrameric complex with impα, importin-β, and CRM1, and this complex putatively clogs the NPC hindering normal nucleocytoplasmic trafficking and cellular function, inevitably leading to cell death.5 Formation of this tetrameric complex is critical for virus activity, and both NLS and NES sequences must be localized on the VEEV capsid protein to result in viral cytotoxicity and pathogenesis.5,6 Therefore, weakening the binding of VEEV capsid to either impα or CRM1 is expected to have a therapeutic effect,7 relieving VEEV symptoms as demonstrated in several studies.8,9
In line with this mechanism of viral infection, several small compounds from the CL6662 scaffold family have been considered for antiviral activity against VEEV.10 This scaffold was provided by the Queensland Compound Library Open Scaffolds collection11 and its members were selected based on their ability to inhibit the binding of the VEEV capsid to impα.10 Their half-maximum inhibitory concentration IC50 is < 25μM suggesting a moderate to good inhibitory activity.10 In particular, the CL6662 compound G281–1564 is promising with its IC50=25 μM, half-maximum effective concentration EC50=10.8 μM, and CC50 >100 μM, which is the concentration resulting in 50% cytotoxicity. Another drug from the CL6662 scaffold with somewhat elevated hydrophobicity due to the addition of two carbons, G281–1485, shows IC50 approximately two-fold less (12 μM) and smaller EC50 (=7.5 μM), but elevated cytotoxicity (CC50=55.1 μM). Importantly, the two compounds exhibited specicity for VEEV capsid proteinś NLS sequence over that from simian virus SV40.10 These preliminary results suggest that antiviral treatment of VEEV infections is possible. However, before these drugs can be considered for optimization, more information is needed concerning their physicochemical mechanism of inhibition. For instance, do these drugs specifically bind to impα and is this binding on-target, i.e., does the ligand bind primarily to the NLS peptide binding site? What are the interactions between ligand and protein responsible for binding? Is it possible to modify the interactions to enhance binding affinity? Do the inhibitors bind to the capsid NLS sequence?
All-atom molecular dynamics simulations are positioned to answer the questions stated above. Traditionally, ligand binding affinities are studied using free energy perturbation (FEP) simulations.12–14 However, the binding sites or poses for VEEV inhibitors are unknown, precluding a straightforward FEP application. To circumvent this problem, we have chosen an alternative approach, performing replica-exchange molecular dynamics simulations with solute tempering (REST) to elucidate in all-atom detail the mechanism governing ligand binding. Previously, we used this approach to study interactions of Alzheimer’s biomarkers and inhibitors with Aβ peptides.15–17 Here, we apply a similar methodology for the inhibitors from the CL6662 scaffold family binding to impα. Because the CL6662 scaffold has already demonstrated the inhibition of VEEV capsid protein binding to impα, we focus on the interactions between ligands and the impα region proximal to the NLS binding site. Our goal is to determine the distribution of ligand binding poses, their overlap with the NLS binding site, and the nature and strength of binding interactions. In addition to G281–1485 (referred to as I0) and G281–1564 (I1) inhibitors, we examined a novel, more hydrophobic modification of G281–1485 (I2). To test our strategy and exclude the possibility that the inhibitors mask the NLS sequence before binding to impα, we studied docking of the inhibitors to NLS peptides. This investigation confirmed preferential binding of the inhibitors to impα. Overall, we found that G281–1485 is a non-specific moderately on-target binder, which does not form a well-defined binding pose. Binding of less hydrophobic G281–1564 becomes strongly on-target, but still remains non-specific, whereas a more hydrophobic variant of G281–1485 is a specific, weakly on-target binder. Based on free energy estimates we expect a weak competition between VEEV NLS sequence and the inhibitors.
Models and Methods
Simulation system
A simulation system shown in Fig. 1a,b consisted of one ligand and an importin-α (impα) protein solvated with explicitly treated water at the NaCl concentration of 0.15 M. The structure of impα was taken from the PDB entry 3VE6. This impα protein is from Mus musculus, but has 98% sequence similarity and a tted RMSD of 0.69 Å to the human analog (PDB ID 3FEY18) as computed with the RCSB PDB pairwise structure alignment tool.19 Thus, choosing 3VE6 facilitates comparisons with future studies probing NLS binding. The protein was truncated at residue 211 to reduce computational costs, but to retain all residues interacting with the NLS sequence in 3VE6. The truncated impα was restrained to 3VE6 by applying soft harmonic restraints to Cα atoms outside of the confining sphere (see below). The restraints were necessary, because monomeric impα without self-inhibitory domain has low conformational stability.20 Therefore, apart from minor random fluctuations, the truncated impα structure was consistent with 3VE6. In all, we considered three inhibitors shown in Fig. 1a. The rst, G281–1485 referred to as I0, was discovered experimentally and has been found to inhibit VEEV capsid binding to impα.10 We also considered its modified less hydrophobic version, G281–1564 (I1), in which two methyl groups are removed. This ligand has been also reported experimentally to produce an inhibitory effect.10 In the third ligand I2, the amine in L2 was replaced with a methyl group, thus reducing I0 polarity. All ligands correspond to S-isomers. The minNLS binding site in Fig. 1 includes impα amino acids forming contacts with minNLS sequence K6KPK9 from VEEV capsid protein in the PDB structure 3VE6.21 The amino acids comprising the minNLS binding site are Ser35, Phe68, Trp72, Thr75, Asn76, Ala78, Ser79, Gly80, Thr81, Ser82, Thr85, Gln111, Trp114, Asn118, Asp122, Asn158, and Trp161.
Figure 1:

(a) Structure of inhibitors G281–1485 (I0), G281–1564 (I1), and I2. Locations, where the inhibitors are modified relative to I0, are highlighted in yellow. Ligand structural groups are marked. (b) All-atom REST simulations probe binding of G281–1485 (I0, in orange) inhibitor to impα. To enhance sampling of bound states, we impose a confining sphere with the radius R = 18 Å around VEEV minNLS binding site. Impα conformation is restrained to PDB structure 3VE6. (c) The complex formed by VEEV NLS peptide bound to impα (PDB code 3VE6). In (b) and (c) amino acids constituting the minNLS binding site are colored in ice blue. Three tryptophan amino acids are marked and presented in licorice. The hydrophobic cavity formed by non-minNLS amino acids Leu34, Pro40, Ile42 is in black. The rest of impα structure is in grey cartoon representation. NLS peptide in (c) is shown in cyan except for Lys7 and Lys9 side chains in yellow, which are intercalated between Trp side chains.
We used the all-atom CHARMM36m force field to model the protein,22 whereas the ligands were parameterized using the CHARMM General Forcefield (CGenFF).23,24 The solvent was comprised of 7,715 water molecules and salt composed of 22 chloride ions and 27 sodium ions, with the additional sodium ions neutralizing the system net charge. In total, the I0 system contained 26,461 atoms, with the other systems differing only with respect to the ligand. The initial unit cell dimensions were approximately 58 Å × 58 Å × 77 Å.
Replica-Exchange simulations
To sample ligand binding, we used isobaric-isothermal replica exchange with solute tempering (REST) molecular dynamics.25 Because REST formalism is presented elsewhere,25,26 we provide a brief outline here. In all, the temperatures for R = 5 replicas were distributed exponentially from T0 = 310 K to TR−1 = 510 K. An exchange between the replicas r and r + 1 simulated at the temperatures m and m + 1 occurs with the probability ω = min[1, e−Δ], where Δ = βm(Hm(Xr+1) − Hm(Xr)) + βm+1(Hm+1(Xr) − Hm+1(Xr+1)), β = (RT)−1, H is the enthalpy, and X defines system coordinates. Solvent-solvent and solutesolvent interactions in a replica r at a temperature Tm were scaled by the factors Tm/T0 and (Tm/T0)1/2, respectively. This scaling excludes solvent-solvent energy contributions from ω and reduces the number of replicas without affecting the temperature range or exchange rates. A ligand was tempered as “hot” solute, whereas the rest of the system was considered as cold solvent. Replica exchanges were attempted every 2 ps, with a success rate of about 0.25.
Simulations were performed using NAMD27 with a 1 fs integration step and periodic boundary conditions. Covalent bonds associated with hydrogen atoms were constrained by the SHAKE algorithm. Electrostatic interactions were computed using Ewald summations, and van der Waals interactions were smoothly switched off from 8 to 12 Å. Underdamped Langevin dynamics with a damping coefficient γ = 5ps−1 was used to control temperature, and the Nosé-Hoover Langevin piston method with piston period and decay of 200 and 100 fs, respectively, was used toffset pressure at 1 atm. The x, y, and z dimensions were coupled. The center of mass of the ligand was confined to the sphere with the radius R = 18 Å and repulsive walls implemented using soft harmonic potential (Fig. 1b). The sphere was centered at the point slightly offset from the center of the VEEV NLS binding site observed in the 3VE6 structure. Fig. 1b shows that the sphere includes the entire minNLS binding site and its surrounding amino acids, and 67% of its volume is protein-free. The minimal distance between the sphere surface and periodic boundary is 3.7Å. Confining sphere effectively increases inhibitor concentration without introducing ligand-ligand interactions and, therefore, the relative changes between binding properties of inhibitors should be consistent with those at low inhibitor concentrations enabling us to combine them with the experimental evaluations of absolute binding affinity. Additionally, harmonic restraints were applied to protein Cα atoms outside of the sphere to restrain impα to its PDB fold and prevent potential self-interactions across periodic boundaries.
Initial structures were prepared for each of the four REST trajectories as follows. The ligand was initially placed within its confining sphere. The system was energy minimized, heated to 310 K, and pre-equilibrated at 310 K for 2 ns using the NPT ensemble. Then, additional 1 ns pre-equilibration was performed for each of the five replicas at their respective REST temperatures applying energy scaling as prescribed by REST. At each temperature, structures at 700 ps, 800 ps, 900 ps, and 1 ns were taken as initial conditions for the four trajectories. Thus, all replicas and trajectories featured unique initial conditions. In total, 4 μs of sampling or 800 ns per temperature was collected for each ligand. Equilibration intervals were determined separately for different ligands (see Supporting Information (SI)). We retained all data for I0 simulations, but excluded the first 40 ns of I1 data and the first 120 ns of I2 data per trajectory and temperature. Thus, the total equilibrium sampling at 310 K used for analysis was 800 ns for I0, 640 ns for I1, and 320 ns for I2.
The simulations probing ligand-free impα utilized the same setup as the simulations for the inhibitors, but without resorting to REST sampling. Instead, we performed constant temperature 310K NPT simulations producing three 80 ns trajectories.
Computation of structural probes
To facilitate analysis of binding interactions, the ligands were partitioned into seven ligand groups shown in Fig. 1a. To detect interactions between ligand groups and amino acids, we considered the minimal separation between any pair of their heavy atoms. If these atoms are separated by less than 4.5 Å, a contact between an amino acid and ligand group is formed. Using this definition, we computed the probabilities Pb(l) for ligand groups l to make any contact with impα. Similarly, we computed a contact vector PC(i) reporting the probability of a ligand to bind to amino acid i. Note that these contact definitions are not adjusted by amino acid or ligand group sizes. A ligand is considered bound to impα if it forms any contact with its amino acids. Hydrogen bonding was measured via VMD28 with the donor (D) - acceptor (A) cuto distance of 3.5 Å and a minimum DHA angle of 135°. The change in protein solvent accessible surface area (ASA) caused by ligand binding is evaluated using VMD28 by determining protein ASA before and after ligand binding. The ASA is further decomposed into the contributions provided by polar and apolar protein heavy atoms. The angles between Trp72, Trp114, and Trp161 side chains were calculated by measuring the angles between the normals to the planes defined by the atoms CD1, CZ2, and CE3. In this work, we follow the recent review29 and understand specific binding as localization of a ligand to a specific protein site. All structural probes are reported as averages computed after equilibration at T0 = 310 K.
Conformational clustering
Clustering of ligand conformations was performed using the method of Daura et al30 by computing the root mean-squared deviations (RMSD) between ligand poses. Prior to ligand clustering, the impα structures with ligands were adjusted based on minimal RMSD alignments of the sidechains from the minNLS binding site. After protein alignment the RMSDs between all ligand poses were computed. In all, we considered 10,000 protein-aligned ligand poses for each ligand, which were sampled periodically from equilibrated portions of REST simulations. Ligand clusters were defined with the RMSD cuto value R0 = 2 Å and only the clusters capturing at least 1% of all ligand binding structures referred to as populated were retained for analysis.
Results
Interaction of G281–1485 inhibitor with importin-α
Using REST simulations, we studied the interactions of G281–1485 (I0) inhibitor (Fig. 1) with importin-α (impα) protein.10 To accelerate conformational sampling, we imposed a confining sphere of the radius R = 18 Å centered near the minNLS binding site (see Models and Methods for minNLS definition). The sphere allowed the ligand to bind freely to the minNLS site on impα and surrounding regions. Given inhibitor confinement to the sphere, its probability of binding to the minNLS site is elevated to Pb(I0) = 0.91 ± 0.01. Table 1 shows the probabilities of binding Pb(l) for ligand groups l (defined in Fig. 1a). The highest Pb(l) are observed for the fused rings L7 and L4, whereas the interactions of the tail groups L1 and L2 with the minNLS binding site are 30 to 50% weaker. To probe ligand-impα interactions, we computed the probabilities of contacts Pc(i) between I0 and impα amino acids i (see Models and Methods). The ten amino acids with the highest Pc(i) shown in Table 2 constitute the top binding amino acids, including five from the minNLS binding site - Ser79, Asn76, Gly80, Ser35, and Trp114. If the fraction of minNLS amino acids in the top binding ones is a measure of the ligand targeting the minNLS site, then according to Table 2 it is 0.5 implying that I0 is a moderately on-target inhibitor. Notably, only three top binding amino acids, Ser79, Asn76, and Pro40, reveal strong binding interactions with Pc(i) > 0.5. Then, classifying binding as specific when at least 50% of top binding amino acids have Pc(i) > 0.5, we determine that I0 binds non-specifically to impα (see Models and Methods). We emphasize that our classifications are solely for distinguishing the binding behavior of the inhibitors within the scope of our paper. As such it is not a general purpose classification scheme.
Table 1:
| Ligand | LI | L2 | L3 | L4 | L5 | L6 | L7 |
|---|---|---|---|---|---|---|---|
| I0 | 0.42 ± 0.03 | 0.45 ± 0.05 | 0.50 ± 0.04 | 0.66 ± 0.04 | 0.46 ± 0.01 | 0.55 ± 0.03 | 0.78 ± 0.03 |
| I1 | 0.43 ± 0.02 | 0.52 ± 0.03 | 0.54 ± 0.07 | 0.75 ± 0.04 | 0.59 ± 0.05 | 0.67 ± 0.05 | 0.84 ± 0.04 |
| I2 | 0.44 ± 0.05 | 0.55 ± 0.12 | 0.64 ± 0.05 | 0.80 ± 0.07 | 0.36 ± 0.04 | 0.45 ± 0.05 | 0.83 ± 0.07 |
Binding probabilities are given by Pb(l).
Ligand groups are identified in Fig. 1a.
Table 2:
Top binding amino acids with the strongest affinities toward ligandsa
| rank | I0 | I1 | I2 | |||
|---|---|---|---|---|---|---|
| amino acid | P c (i) | amino acid | Pc(i) | amino acid | Pc(i) | |
| 1 | Ser79 | 6.69±0.03 | Ser79 | 0.71±0.07 | Ser79 | 0.80±0.06 |
| 2 | Asn76 | 0.56±0.02 | Trp114 | 0.57±0.08 | Asn76 | 0.77±0.07 |
| 3 | Pro40 | 0.51±0.03 | Asn76 | 0.55±0.06 | Pro40 | 0.70±0.07 |
| 4 | Ile42 | 0.49±0.03 | Ile42 | 0.43±0.06 | Ile42 | 0.66±0.06 |
| 5 | Gly80 | 0.47±0.04 | Trpl61 | 0.42±0.05 | Gly80 | 0.65±0.07 |
| 6 | Leu34 | 0.46±0.03 | Pro40 | 0.42±0.05 | Leu34 | 0.63±0.08 |
| 7 | Ser35 | 0.35±0.02 | Asn118 | 0.41±0.07 | Thr81 | 0.53±0.05 |
| 8 | Trp114 | 0.34±0.07 | Trp72 | 0.41±0.08 | Gln39 | 0.51±0.07 |
| 9 | Gln39 | 0.31±0.08 | Ser35 | 0.41±0.04 | Arg36 | 0.51±0.07 |
| 10 | Arg36 | 0.30±0.07 | Gly80 | 0.40±0.05 | Glu37 | 0.48±0.07 |
amino acids in bold belong to minNLS binding site
The three hydrophobic amino acids in Table 2, Pro40, Ile42 and Leu34, form an apolar cavity near the loop connecting impα helices 2 and 3 of the first armadillo repeat as shown in Fig. 1c.31 Overall, out of 10 top binding amino acids five are polar and five are hydrophobic suggesting that I0 utilizes mixed binding interactions. This observation is supported by computing the impα accessible surface area (ASA) lost due to inhibitor binding. The total lost protein ASA is 182±3 Å2, of which hASA = 98±1 Å2 is attributed to apolar atoms and pASA = 84 ± 2 Å2 to polar. We also examined the hydrogen bonds (HBs) between I0 and impα. None of HBs has the probability of occurrence exceeding 0.03 and the average number of HB is merely 0.14. Thus, despite the presence of several donor and acceptor groups in the ligand, HBs play minor role in binding. These findings are consistent with non-specific I0 binding. Docking of I0 to impα is further evaluated in SI and Discussion.
To check the composition of the bound ensemble we assessed the probability distribution of RMSD values P(RMSD) computed between all pairs of bound structures. Fig. S9a shows an approximately unimodal P(RMSD) peaking at RMSD ≃ 10 Å, suggesting generally a homogeneous and dispersed distribution of binding poses. To determine dominant bound poses, we performed clustering of I0 conformations bound to impα as described in Models and Methods. There are 10 clusters for I0 (denoted as CL0-CL9) with the populations > 0.01 comprising 29% of bound structures. The largest cluster CL0 has the population of 0.07 and its centroid is shown in Fig. 2. Excluding Trp114 thefficentroid forms contacts with all top ten binding amino acids, including all top five suggesting that it captures well the overall I0 binding sinteractions. Consistent with the analysis of binding interactions above, Fig. 2 demonstrates that I0 rings L7 and L4 in the CL0 centroid are positioned over four, mostly polar minNLS binding amino acids, Ser35, Ser79, Asn76, and Gly80. Therefore, I0 is expected to interfere with the VEEV NLS access to its binding site (see Fig. S8). Simultaneously, I0 forms contacts with five, mostly hydrophobic non-minNLS amino acids, Leu34, Arg36, Gln39, Pro40, and Ile42. These apolar amino acids line up a hydrophobic cavity shown in Figs 1 or 2. These observations support moderately on-target binding of I0.
Figure 2:

I0 inhibitor centroid from the largest cluster CL0, which represents well the I0 interactions with impα. Amino acids constituting the minNLS binding site are in ice blue, except for the minNLS amino acids bound to I0 which are in purple. The non-minNLS amino acids binding I0 are in dark grey, of which three apolar amino acids, Leu34, Pro40, Ile42, forming a hydrophobic cavity are in black. Three tryptophan amino acids are presented in licorice and marked. The rest of impα structure is in grey cartoon representation. Ligand groups are colored as follows: L1 in red, L2 in orange, L3 in yellow, L4 in green, L5 in aqua, L6 in tan, and L7 in blue.
Further support for I0 interference with VEEV NLS binding comes from recent computational analysis of alanine mutagenesis, which identified impα amino acids with high affinity to VEEV NLS.21 The top 10 amino acids, which contribute energetically the most to binding (|ΔΔG| > 0.5 kcal/mol), are, in descending order, Asp122, Trp114, Trp161, Asn118, Asn76, Asp200, Thr85, Asn158, Trp72, and Gln111. In our REST simulations, out of these ten residues two (in italic) are listed among top binding amino acids in Table 2. Interestingly, I0 fails to block access to Glu122, which is the impα amino acid with the highest affinity to the NLS sequence.31 Thus, I0 interferes with the NLS binding to two amino acids, Asn76 and Trp114, which represent 20% of the high NLS affinity amino acids. The observed behavior of I0 is consistent with a moderately on-target ligand binding, which is apparently sufficient for inhibiting activity observed experimentally.10
Among the top ten high NLS affinity amino acids there are three tryptophans - Trp72, Trp114, and Trp161. In the VEEV NLS-impα complex (PDB access code 3VE6), the three tryptophan side chains positioned side by side create two “cages” for the side chains of Lys7 and Lys9 from the VEEV NLS conserved motif K6KPK95 (Fig. 1c). To investigate the I0 impact on these “cages”, we computed the distributions of the angles γ72−114 and γ161−114 formed between the normals to the Trp72 and Trp114 and to Trp161 and Trp114 side chains, respectively. The probability distributions, P(γ72−114) and P(γ161−114), are shown in Fig. 3a. As a control, we computed the same distributions observed in a ligand-free impα (see Models and Methods). According to this gure, the distribution P(γ161−114) implicates two rotational states for Trp114 and Trp161. Specifically, P(γ161−114) is bimodal with the maxima at γ161−114 = 40 and 140°. P(γ72−114) is weakly bimodal with the well defined maximum at γ72−114 = 100° and additional maximum at 70°. Conspicuously, the distributions seen in Fig. 3d computed for a ligand-free impα are unimodal, in which P(γ161−114) peaks at 40° and P(γ72−114) at 110°. For comparison, in the 3VE6 PDB structure the angles between Trp side chains are γ161−114 = 113° and γ72−114 = 13°. Thus, binding of I0 disorders the orientations of Trp side chains, but does not make them compatible with the VEEV NLS peptide pose.
Figure 3:

Probability distributions P(γ72−114) (in magenta) and P(γ161−114) (in orange) map the orientations of Trp114 side chain with respect to the side chains of Trp72 and Trp161 upon binding of I0 (a), I1 (b), I2 (c) inhibitors and in the ligand-free impα (d). The probability distributions P(γ72−161) between the side chains of Trp72 and Trp161 (in opal) indicate that these side chains always maintain approximately antiparallel orientation in all panels. The angles between the Trp side chains are defined in Models and Methods. The figure shows that the I0 and I2 probability distributions are qualitativey similar, whereas I1 distributions are distinct from them resembling those in the ligand-free impα.
Finally, we examined the fluctuations in I0 bound poses. To this end, in SI we computed the root mean squared fluctuations (RMSF) in I0 atoms after aligning impα. Note that the alignment did not include bound I0, thus the resulting RMSF capture the spread of I0 bound poses. Fig. S10 presents the averaged RMSF for seven ligand groups. It is seen that all ligand groups except the tail l = 1 exhibit similar RMSF values, while the average RMSF across all ligand atoms is 9.7 Å. These ndings agree with non-specific binding of I0 to impα.
Probing binding of G281–1485 variants to importin-α
G281–1564 (I1) inhibitor:
G281–1564 (I1) inhibitor was derived from G281–148510 (Fig. 1a) as described in Models and Methods and is less hydrophobic than I0. REST simulations indicate that I1 binds to minNLS site with stronger affinity Pb(I1) = 0.94±0.01. Assuming the two-state behavior the I0→I1 modification changes the ligand binding free energy ΔGb by ΔΔGb = −RTln[(Pb(I1)/(1−Pb(I1)))((1−Pb(I0))/Pb(I0))] = −0.3±0.2 kcal/mol. This formalism for computing ΔΔGb assumes no interactions between a ligand and a protein in the unbound state.32 Because the ligand is small compared to the confining sphere, this assumption is largely true. Furthermore, since we compute the free energy difference ΔΔGb, the non-interaction approximation is partially cancelled out from ΔΔGb. Our ΔΔGb suggests that the affinity of I1 is marginally strosnger. Consistent with enhanced binding affinity, all I1 groups in Table 1 show elevated Pb(l) with those exceeding I0 values by more than 0.1 being L5 and L6. Similar to I0 the fused rings L4 and L7 feature the strongest binding affinities elevated to about 0.8. Interestingly, the lowest gain in affinity is observed for the tail L1 and L3, whose hydrophobicities are reduced by the modification. The list of top binding amino acids in Table 2 reveals a similarity between I0 and I1 binding locations. Indeed, out of ten top I0 and I1 binding amino acids, seven are common, albeit with different rankings. The largest gains in Pc(i) among I1 top binding amino acids are seen for Asn118 (ΔPc(Asn118) = +0.24) and the two tryptophans, Trp114 (+0.23) and Trp161 (+0.17). These changes can be explained by the increase in the average number of HBs between I1 and impα reaching 0.24, which is almost two-fold higher than for I0. Most of the new HBs (occurring with the probability > 0.01) are indeed observed between I1 and Trp114, Trp161, or Asn118. The decrease in Pc(i) for hydrophobic non-minNLS Pro40 and Ile42 (−0.10 and −0.06) can be rationalized by the reduced I1 hydrophobicity. Since among top ten I1 binding amino acids eight belong to the minNLS binding site, we classify I1 as strongly on-target binder. However, despite elevated HB formation and stronger interactions with few amino acids only three top binding amino acids have Pc(i) > 0.5 indicating that I1 remains a non-specific binder. Docking of I1 to impα is reported in SI.
Compared to I0 the loss in protein ASA due to I1 binding increases to 189±6 Å2 consistent with I1 stronger affinity to impα. Thus, elimination of apolar atoms does not compromise I1 binding, but enhances it due to stronger HBs. Following the analysis for I0, we examined the conformations of tryptophan side chains. In contrast to I0, the probability distribution P(γ161−114) in Fig. 3b is approximately unimodal with the maximum at γ161−114 = 40° and the average at 64°. The distribution P(γ72−114) also becomes unimodal implicating approximately perpendicular orientation of Trp72 and Trp114 (the average γ72−114 is 98°). Thus, opposite to I0 the binding of I1 largely restricts the rotation of Trp114 side chain with respect to Trp161 and Trp72 (see also Fig. 4). This outcome is consistent with stronger interactions of I1 with Trp amino acids, particularly, with Trp114, which displays specific interactions with I1 (Pc(Trp114) > 0.5 in Table 2). Thus, reduced conformational freedom of Trp114 supports strongly on-target binding of I1. Surprizingly, the orientations of Trp side chains observed upon I1 binding resemble those seen for the ligand-free impα. Thus, I1 binding may create a polar water-like environment. More importantly, Trp orientations seen for I1 are incompatable with those representing the VEEV NLS peptide binding pose. The analysis of RMSF distribution across I1 ligand groups in Fig. S10 suggests that the amplitudes of I1 and I0 fluctuations are similar consistent with non-specific binding of both. Indeed, the average RMSF for I1 is 8.9 Å being only 0.8 Å lower than for I0.
Figure 4:

I1 inhibitor centroid from the largest cluster CL0, which represents well the I0 interactions with impα. The coloring and representation of impα amino acids and ligand groups follow Fig. 2. The gure reveals a notable shift of I1 binding pose toward minNLS amino acids, including three tryptophan residues.
The composition of bound ensemble is assessed by the probability distribution of RMSD values P(RMSD) computed between all pairs of bound structures. Similar to I0, Fig. S9b shows an unimodal distribution peaking at RMSD ≃ 7 Å implicating a homogeneous, broad distribution of I1 binding poses. Clustering I1 binding poses identi es 11 bound clusters with the populations > 0.01, which together represent 31% of all bound states. The largest cluster CL0 has the population of 0.09. Thus, similar to I0, the distribution of bound I1 structures appears non-specific. CL0 centroid accurately represents I1 binding, because it forms contacts with nine top ten binding amino acids listed in Table 2. This centroid shown in Fig. 4 forms contacts with seven minNLS amino acids, mostly polar Ser35, Asn76, Ser79, Gly80 and three aromatic Trp72, Trp114, and Trp161. In addition, the centroid interacts with the hydrophobic cavity formed by Pro40, Ile42, and Leu34. The CL0 centroid reveals a shift in inhibitor poses toward the minNLS site and, particularly, to tryptophans thus supporting strong on-target binding. The RMSD comparing the CL0 centroids for I0 and I1 is surprisingly high being 9.5 Å. The reason for the high RMSD follows from the inspection of I0 and I1 poses in Fig. 5, where the fused ring L7 has opposite positions coupled with different tail L1 poses.
Figure 5:
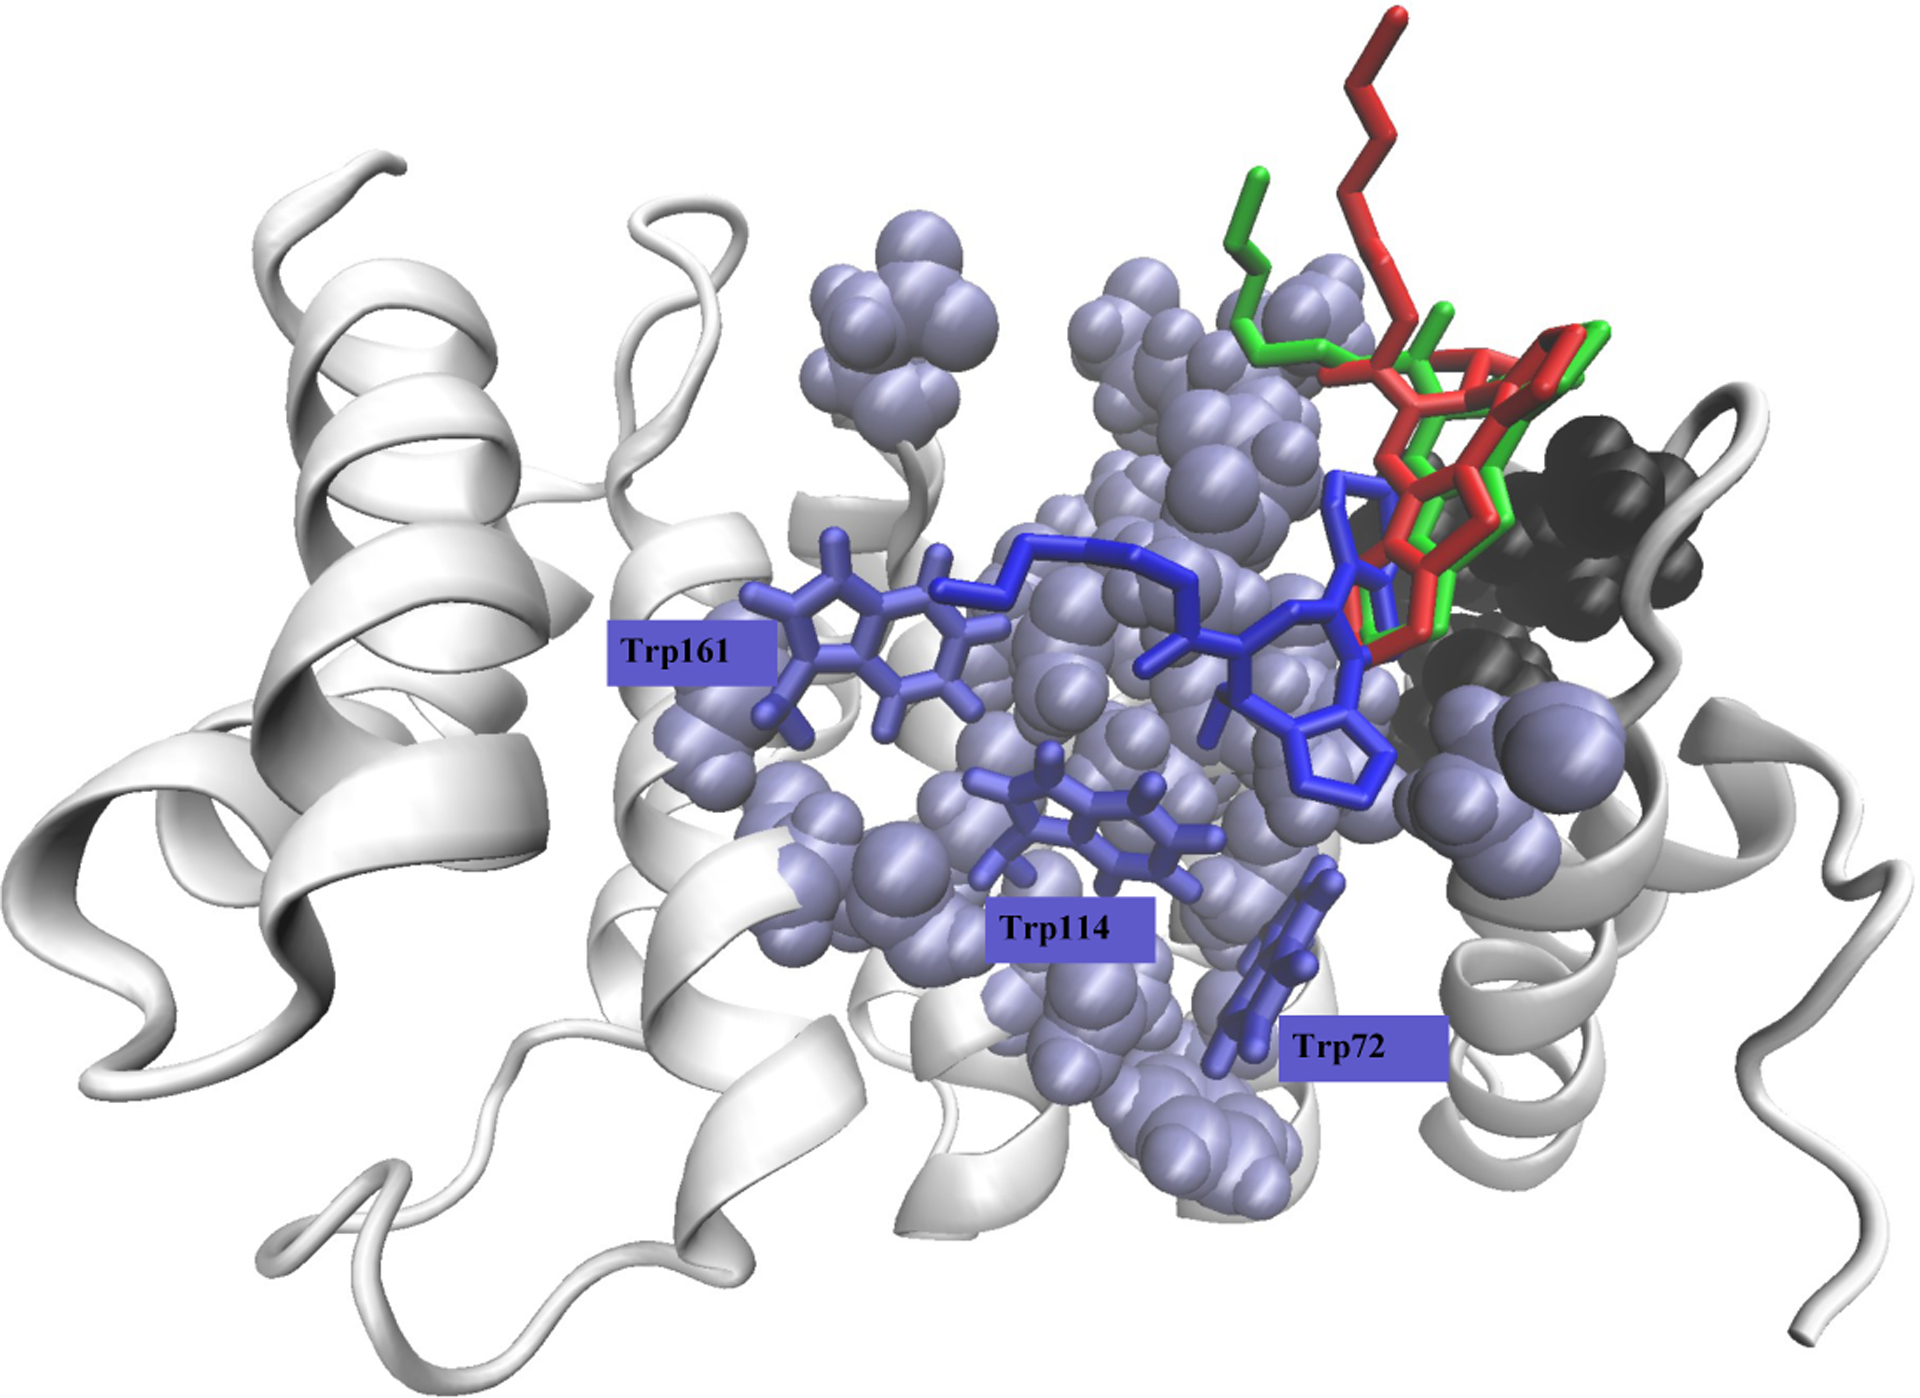
Superposition of I0 (in red), I1 (in blue), and I2 (in green) bound poses observed in the largest clusters CL0. The coloring and representation of impα amino acids follow Fig. 1b. The gure reveals distinct binding poses of the three ligands. Note that the CL0 clusters of I0 and I1 represent less than 10% of bound structures, whereas the I2 CL0 population is 27%.
Comparison of I0 and I1 binding suggests several conclusions. First, both I0 and I1 are classified as non-specific binders forming weak interactions. Second, although both ligands bind to many shared impα amino acids, their poses, particularly orientations, differ considerably. Third, the ligands I0 and I1 induce distinct orientations of tryptophan side chains and the ones produced by I1 resemble those seen in the ligand-free impα. Fourth, the changes in I1 binding are driven by enhanced ligand-impα HBs. Fifth, I1 binding is strongly on-target compared to moderately on-target binding of I0.
I2 inhibitor:
Inhibitor I2, which has no experimental analog, was derived from G281–1485 (I0) as described in Models and Methods (Fig. 1a). As a result I2 is more hydrophobic than I0. It follows from REST simulations that I2 binds to the minNLS site with the probability Pb(I2) = 0.93±0.03. Assuming a two-state behavior, we estimate that the I0→I2 modification changes the ligand binding free energy ΔGb by ΔΔGb = −RTln[(Pb(I2)/(1 − Pb(I2)))((1 − Pb(I0))/Pb(I0))] = −0.2 ± 0.3 kcal/mol (see SI). Thus, the affinities of both ligands are effectively the same. Table 1 shows that in contrast to I1, the changes in I2 group binding affinities are not uniform. Considering the groups with |ΔPb(l)| ≥ 0.1, we nd that the binding affinity increases for l =L2, L3, and L4, but drops for L5 and L6. According to Fig. 1a L2-L4 groups surround the modification site, which increases ligand hydrophobicity. Nevertheless, similar to I0 and I1, the fused rings L4 and L7 still feature the strongest binding affinities elevated to ≥ 0.8. Thus, I0→I2 redistributes the groups with frequent contacts toward the modification site.
Table 2 reveals a strong similarity among I0 and I2 top binding amino acids, of which eight are common, and the rankings for the top six remain unchanged, albeit with significantly higher Pc(i) values for I2. The ve amino acids in Table 2 featuring the largest gains in Pc(i) are Thr81 (+0.24), Asn76 (+0.22), Arg36 (+0.21), Gln39 (+0.20), and Pro40 (+0.19). Out of these three amino acids do not belong to minNLS, and the last one together with Ile42 (+0.17) and Leu34 (+0.17) form the non-minNLS hydrophobic cavity (Fig. 1c). The largest drop in affinity among top binding amino acids is seen for Trp161 (−0.12). These changes in amino acid affinities are opposite to those for I1, for which the largest increases in Pc(i) are observed for Trp amino acids and Asn118 coupled with reduced Pc(i) for non-minNLS Pro40 and Ile42. Consequently, in contrast to I0 or I1, the top binding I2 amino acids do not include any Trp, signaling a shift in the binding away from minNLS to the non-minNLS cleft (Fig. 1c). Our analysis also demonstrates that I2 forms very few HBs upon binding. Indeed, the average number of ligand-impα HBs is 0.07, which is about two- or three-fold lower than for I0 and I1, respectively. The reduced HB propensity is the result of elimination of an amino group. Since among top ten I2 binding amino acids only four belong to the minNLS binding site, we classify I2 as a weakly on-target binder. Strikingly, all top binding amino acids except one exhibit Pc(i) > 0.5 indicating that I2 is a strongly specific binder. Thus, the consequences of I1 and I2 modifications are clearly divergent, because I2 is a specific weakly on-target binder, whereas I1 and I0 are moderately to strongly on-target non-specific binders. The results of docking I2 to impα are presented in SI.
For I2, the total lost protein ASA is 201±9 Å2, which is 10% more than for I0, whereas the loss in hydrophobic ASA increases to hASA = 106±3 Å2. The increase in hASA is consistent with the stronger hydrophobicity of I2. We next examined the conformations of tryptophan side chains. Both probability distributions P(γ161−114) and P(γ72−114) in Fig. 3c are bimodal and reach maxima at γ161−114 = 40 and 140° or at γ72−114 = 60 and 110°, respectively. Hence, the I2 distributions resemble those of I0, but differ from I1 and ligand-free impα (Fig. 3). Consequently, the Trp orientations observed upon I2 binding are incompatable with those characteristic of the VEEV NLS peptide binding pose. The analysis of RMSF distribution across I2 ligand groups in Fig. S10 demonstrates suppressed I2 uctuations in the bound state compared to I0 and I1. In fact, the average RMSF for I2 is 7.3 Å, which is 2.4 Å smaller than for I0. This drop in RMSF is three-fold larger than the difference in RMSF between I0 and I1 in line with the specific binding of I2.
To further probe I2 binding, we performed clustering of its bound structures. Clustering nds 11 bound clusters with the populations > 0.01, which together represent 53% of all bound states. Strikingly, the largest cluster CL0 shown in Fig. 6 has the population of 0.27 representing more than half of populated (>0.01) and more than a quarter of all binding poses. In contrast to I0 and I1, the probability distribution of RMSD values P(RMSD) computed between all pairs of bound structures in Fig. S9c shows a bimodal distribution peaking at RMSD ≃ 2 Å and 6 Å and implicating an inhomogeneous distribution of I2 binding poses. The rst peak at 2 Å reffects the emergence of well-populated CL0 cluster. Thus, the I2 binding cluster distribution differs sharply from those for I0 and I1 by being polarized and exhibiting a single, well populated CL0. This I2 feature is consistent with its strongly specific binding. Because CL0 centroid shown in Fig. 6 forms contacts with all ten top binding amino acids listed in Table 2, it accurately represents I2 binding. Importantly, the centroid interacts with the hydrophobic cavity formed by Leu34, Pro40, and Ile42. Since the RMSD value computed between I2 and I1 centroids is 8.8 Å, their structural similarity is low. Indeed, in Fig. 5 I1 and I2 centroids adopt approximately mirror poses, in which the fused rings L4 and L7 have opposite orientations and the tail L1 has distinctly different positions. Strikingly, the pairwise RMSD comparing I2 and I0 centroids shown in Fig. 5 is merely 2.5 Å implicating their similarity. In fact, the notable difference in I2 and I0 poses is the conformation of the tail L1 and L2, which binds to minNLS Thr81 in I2, but not so in I0 pose (Table 2). More importantly, the I2 centroid implicates a shift in the inhibitor poses away from the minNLS site and Trp cages toward the non-minNLS hydrophobic cleft in line with weakly on-target binding. These changes are coupled with the strong specificity of I2 binding.
Figure 6:

I2 inhibitor centroid from the largest cluster CL0, which represents well the I2 interactions with impα. The coloring and representation of impα amino acids and ligand groups follow Fig. 2. The gure reveals a notable shift of I2 binding away from the minNLS site and Trp cages toward the non-minNLS hydrophobic cleft.
The comparative summary of I2 binding is as follows. First, I2 differs from I0 and I1 by being a strongly specific, weakly on-target binder forming a distinctive binding pose stabilized by strong interactions with impα. Second, I0 and I2 binding poses are unexpectedly similar and the difference in their binding comes from greater specificity of I2 and a shift of I2 toward non-minNLS residues. Third, the driving factor of I2 specificity is its increased hydrophobicity, whereas the contribution of HBs to I2 binding is negligible.
Discussion
It is important to put our findings in broader perspective. First, from a methodological viewpoint, our study investigates mostly non-specific ligands forming broadly distributed binding sites on a protein target. Studying such ligands with free energy perturbation and umbrella sampling simulations33,34 or with docking35 is challenging, because those ligands exhibit neither well-defined binding sites, nor poses, nor binding pathways. From this view-point, our work shows that exhaustive REST binding simulations are useful for investigating such ligands.
Second, expanding the previous point SI compares the predictions of 4 μsec REST sampling per ligand with exhaustive AutoDock Vina (ADV) simulations.35,36 The analysis implies a consistency between REST simulations and ADV in predicting binding sites, specifically, in that all three ligands are on-target binders, albeit with varying degree of overlap with minNLS site. Also, REST and ADV agree in assessing the changes in binding specificity of the inhibitors. However, the ADV poses are structurally distinct from REST centroids due to high RMSD values ranging from 5 to 9 Å. Note that these high RMSD values were computed as minima over the ten best ADV poses against the REST centroids, which capture accurately average binding interactions in all-atom simulations. Although ultimate determination of REST and ADV accuracy rests with future experiments, recent study has indicated that molecular dynamics significantly improves ADV predictions.37 Therefore, REST simulations are likely to present an efficent option for exploring binding poses of the inhibitors, which do not populate a single protein binding site.
Third, to gain more insight into the mechanism of inhibition, we compare the changes in binding free energy ΔΔGb with the inhibitor binding free energy ΔGb. Assuming applicability of Clark’s equation,38 which effectively neglects any cooperativity effects in ligand binding, the inhibitor EC50 ≈ KD, where KD is an inhibitor dissociation constant. Since ΔGb = −RTln(c0/KD), where c0 = 1 M is the standard concentration, and I0 EC50 = 7.5±4.6 μM, we nd ΔGb ≈ −7 kcal/mol. Importantly, small absolute ΔΔGb ≲ 0.3 kcal/mol for the inhibitors is consistent with EC50 = 10.8 ± 4.3 μM for I1, which is similar to I0 given its large experimental error.10 Then, with small ΔΔGb any changes in inhibitors’ activities cannot be attributed to their affinities, but evidently to the differences in on-target binding and specificity. Previous studies have estimated that a typical free energy of binding of monopartite NLS (e.g., SV40 or human c-myc proto-oncogene) to impα is ΔGb ~ −10 kcal/mol.39 Assuming that the affinity of VEEV NLS to impα should be on par with a typical NLS, we propose that our inhibitors weakly compete with viral NLS (see the end of the next point for more discussion on this topic).
Fourth, our analysis of the three inhibitors provides atomistic underpinnings for their binding mechanisms. It shows that reducing the G281–1485 VEEV inhibitor’s hydrophobicity strengthens hydrogen bonding and makes binding strongly on-target, but still fails to provide binding specificity. In contrast, an increase in inhibitor hydrophobicity leads to strong specific binding, albeit weakly on-target. Interestingly, the distributions of tryptophan angles observed for I0 and I2 are similar, but differ from those seen for I1. However, none of these distributions are compatable with the orientations of Trp side chains seen upon VEEV NLS peptide binding to impα (PDB structure 3VE6). With respect to weakly on-target I2 we note that among all inhibitors it binds with highest affinity to four minNLS amino acids (which are all among the top binding residues in Table 2). Therefore, despite being weakly on-target, I2 might still show good inhibitory activity. This conjecture is supported by the argument made above that VEEV inhibitors weakly compete with viral NLS peptide by merely shifting its binding equilibrium away from impα major NLS binding site. Moreover, docking studies in SI probing the entire impα surface support on-target binding of I2. Therefore, putative I2 inhibitory activity may represent an alternative strategy in inhibitor design, which does not directly strengthen on-target binding but facilitates specific binding.
It is noteworthy that compared to I0 a strongly on-target I1 inhibitor has at least two-fold higher CC50 value than I0.10 Similarly, I0 IC50 value is two-fold lower than of I1, which seems inconsistent with stronger on-target binding of I1. To resolve these question, we note that the precise molecular interpretation of IC50 values based on AlphaScreen or of CC50 values10 is di cult. In fact, if we consider I0 and I1 EC50 values as a measure of their impact on VEEV, then within the errors they are almost identical (see above). In addition, the exact in vivo mechanism of inhibition is unknown, and it may not be confined to blocking of viral NLS binding to impα alone (see below). Furthermore, the inhibitor binding pose in minNLS binding site may also impact inhibition, and I0 and I1 have indeed different poses with the RMSD of 9.5Å. Thus, our study evaluates one component of inhibition mechanism, i.e., binding to impα, but others could be involved too. It must be noted that binding of the inhibitors to impα might be inherently cytotoxic due to interference with host protein traffic. However, one may speculate that weak competition of inhibitors against host and viral NLS is bene cial. Such inhibitors would cause limited cytotoxicity, but still induce sufficient impact on viral NLS to allow host immunity to defeat the virus. Further studies are needed to clarify this question.
Fifth, since the exact mode of inhibiting mechanism of I0-I2 ligands is unknown, we must consider their direct interactions with viral NLS before its binding to impα. In SI we used ADV to probe I0 binding to VEEV NLS sequence K6KPK9. We found that the affinity of I0 to the NLS peptide K6KPK9 is about 50% weaker than to impα. We repeated these computations using the full 12-mer VEEV NLS sequence from 3VE6 and found that I0 still binds far weaker to NLS than to impα. ADV does not afford conformational sampling of the target, therefore our results should be treated with caution. However, they suggest that the inhibitors primarily target impα and not the VEEV NLS sequence. All-atom REST simulations examining inhibitor binding to NLS sequences are still needed to confirm this conclusion. Similarly, it is conceivable that the inhibitors interfere with impα association with impβ, but this scenario is unlikely following the experiments on inhibitor binding to VEEV capsid:impα:impβ complex.10 Indeed, if this is the case, then I0 and I1 would not be specific to VEEV capsid but would affect SV40 binding as well. Yet, I0 and I1 show specificity to VEEV.10 It is also possible that the minor NLS binding site in impα is involved in inhibitor activity. This option was considered by ADV docking the inhibitors to the full structure of impα in SI, Tables S2–S4. The results show that among ten best binding poses of I1 and I2 none are associated with minor NLS binding site. For I0 only one out of 10 poses ranked #9 is found in the minor binding site. Thus, ADV studies do not support the involvement of minor NLS binding site in inhibitor activity.
Finally, although I0 and I1 ligands show selective inhibition of VEEV over SV40,10 the three inhibitors studied here may still have therapeutic signi cance beyond VEEV. The viral cytotoxic mechanism, which blocks the nuclear transport by targeting impα, is apparently utilized by other New World alphaviruses, such as eastern and western equine encephalitis viruses.2 Interestingly, non-alphaviruses such as HIV-1,40 the aviviruses dengue and Zika,41 and SARS-CoV-242 also interact with impα during their infectious cycle. Moreover, these interactions are inhibited by ivermectin8,40–42 and mifepristone.8 CC50 for ivermectin is 8–22 μM and 50–165 μM for mifepristone8 implying that their cytotoxicities are comparable to those reported for our inhibitors.10 Therefore, we hypothesize that the three inhibitors we probed might be relevant to other viral infections. In this context, one must keep in mind that the inhibition mechanism may not be solely centered on blocking viral NLS binding to impα as highlighted above. If so, blocking viral NLS binding to impα represents only one of components of the virus inhibition produced by the three inhibitors studied here.
Conclusions
In this paper we employed all-atom replica exchange molecular dynamics to explore, in atomistic detail, the binding of three inhibitors, G281–1485 (I0) and its two congeners I1 and I2 with varying hydrophobicities to impα. We found that I0 binds non-specifically to impα without adopting well-defined poses. Binding of less hydrophobic congener I1 is strongly on-target with respect to the NLS binding site albeit still non-specific. However, a more hydrophobic congener I2 is strongly specific forming a well-defined binding pose partially overlapping with the NLS binding site. Free energy estimates suggest that all three ligands weakly compete with the viral NLS for binding to impα. We propose that I2, a more hydrophobic variant of G281–1485, is a good candidate for experimental evaluations. There are three, more general implications of our work. First, to study ligands binding without acquiring specific poses, REST simulation with a confining sphere is a useful alternative to absolute FEP, umbrella, or docking approaches. REST simulations would generate a binding ensemble with the distribution of binding poses and associated weights. These binding poses may be used for drug optimization. Second, our work points to a limitation of docking. While AutoDock simulations locate the binding sites in agreement with the REST simulations, there is a major disagreement in ligand poses between docking and allatom REST. Thus, docking studies of the ligands binding non-specifically are questionable. Third, our REST simulations implicate minor differences between the binding affinities of three inhibitors. Coupled with the estimated absolute binding free energy of I0, they suggest that all three inhibitors offer weak competition against binding NLS sequences to impα. This outcome may reffect a compromise imposed on the inhibitors that their antiviral activity be limited to partial inhibition of VEEV NLS binding, while preserving binding of host NLS to impα.
Supplementary Material
Acknowledgments:
Research reported in this publication was supported by the National Institute of Allergy and Infectious Diseases of the National Institutes of Health under award number R01AI143817 (D.K.K., M.P., K.K.H.). The content is solely the responsibility of the authors and does not necessarily represent the official views of the National Institutes of Health. The funders had no role in study design, data collection and analysis, decision to publish, or preparation of the manuscript.
The CGenFF program was provided courtesy of SilcsBio, LLC.
Footnotes
Supporting Information:
Supporting Information (SI) provides details concerning the model and methods and additional data. In particular, SI presents convergence analysis and docking results. This material is available free of charge via the Internet at http://pubs.acs.org.
Notes: The authors declare no con ict of interest.
Data and software availability:
NAMD is available at https://www.ks.uiuc.edu/Research/namd/. VMD is available at https://www.ks.uiuc.edu/Research/vmd/. Initial structures, topology les, REST con guration les, gures data, generated datasets, and codes are available at https://github.com/bdel ng/Binding-of-Venezuelan-Equine-Encephalitis-Virus-Inhibitors-to-Importin-Alpha.
References
- (1).Zacks MA; Paessler S Encephalitic alphaviruses. Vet. Microbiol 2010, 140, 281–286. [DOI] [PMC free article] [PubMed] [Google Scholar]
- (2).Lundberg L; Carey B; Kehn-Hall K Venezuelan equine encephalitis virus capsid the clever caper. Viruses 2017, 9, 279. [DOI] [PMC free article] [PubMed] [Google Scholar]
- (3).Aguilar PV; Estrada-Franco JG; Navarro-Lopez R; Ferro C; Haddow AD; Weaver SC Endemic Venezuelan equine encephalitis in the Americas: Hidden under the dengue umbrella. Future Virol. 2011, 6, 721–740. [DOI] [PMC free article] [PubMed] [Google Scholar]
- (4).Atasheva S; Garmashova N; Frolov I; Frolova E Venezuelan equine encephalitis virus capsid protein inhibits nuclear import in mammalian but not in mosquito cells. J. Virol 2008, 82, 4028–4041. [DOI] [PMC free article] [PubMed] [Google Scholar]
- (5).Atasheva S; Fish A; Fornerod M; Frolova EI Venezuelan equine encephalitis virus capsid protein forms a tetrameric complex with CRM1 and importin α/β that obstructs nuclear pore complex function. J. Virol 2010, 84, 4158–4171. [DOI] [PMC free article] [PubMed] [Google Scholar]
- (6).Atasheva S; Kim DY; Frolova EI; Frolov I Venezuelan equine encephalitis virus variants lacking transcription inhibitory functions demonstrate highly attenuated phenotype. J. Virol 2015, 89, 71–82. [DOI] [PMC free article] [PubMed] [Google Scholar]
- (7).Kosyna FK; Depping R Controlling the gatekeeper: Therapeutic targeting of nuclear transport. Cells 2018, 7, 221. [DOI] [PMC free article] [PubMed] [Google Scholar]
- (8).Lundberg L; Pinkham C; Baer A; Amaya M; Narayanan A; Wagsta KM; Jans DA; Kehn-Hall K Nuclear import and export inhibitors alter capsid protein distribution in mammalian cells and reduce Venezuelan equine encephalitis virus replication. Antiviral Res. 2013, 100, 662–672. [DOI] [PubMed] [Google Scholar]
- (9).Lundberg L; Pinkham C; de la Fuenta C; Brahms A; Shafagati N; Wagsta KM; Jans DA; Tamir S; Kehn-Hall K Selective inhibitor of nuclear export (SINE) compounds alter New World alphavirus capsid localization and reduce viral replication in mammalian cells. PLoS Negl. TRop. Dis 2016, 10, e0005122. [DOI] [PMC free article] [PubMed] [Google Scholar]
- (10).Thomas DR; Lundberg L; Pinkham C; Shechter S; DeBono A; Baell J; Wagstaff KM; Hick CA; Kehn-Hall K; Jans DA Identi cation of novel antivirals inhibiting recognition of Venezuelan equine encephalitis virus capsid protein by the importin α/β1 heterodimer through high-throughput screening. Antiviral Res. 2018, 151, 8–19. [DOI] [PubMed] [Google Scholar]
- (11).Simpson M; Poulsen SA An overview of Australia’s compound management facility: The Queensland Compound Library. ACS Chem. Biol 2014, 9, 28–33. [DOI] [PubMed] [Google Scholar]
- (12).Wang J; Deng Y; Roux B Absolute binding free energy calculations using molecular dynamics simulations with restraining potentials. Biophys. J 2006, 91, 2798–2814. [DOI] [PMC free article] [PubMed] [Google Scholar]
- (13).Deng Y; Roux B Computations of standard binding free energies with molecular dynamics simulations. J. Phys. Chem. B 2009, 113, 2234–2246. [DOI] [PMC free article] [PubMed] [Google Scholar]
- (14).Song LF; Merz KM Evolution of alchemical free energy methods in drug discovery. J. Chem. Inf. Model 2020, 60, 5308–5318. [DOI] [PubMed] [Google Scholar]
- (15).Lockhart C; Kim S; Klimov DK Explicit solvent molecular dynamics simulations of Aβ peptide interacting with ibuprofen ligands. J. Phys. Chem. B 2012, 116, 12922–12932. [DOI] [PubMed] [Google Scholar]
- (16).Lockhart C; Klimov D Molecular interactions of Alzheimer’s biomarker FDDNP with Aβ peptide. Biophys. J 2012, 103, 2341–2351. [DOI] [PMC free article] [PubMed] [Google Scholar]
- (17).Parikh ND; Klimov DK Molecular mechanisms of Alzheimer’s biomarker FDDNP binding to Aβ amyloid bril. J. Phys. Chem. B 2015, 119, 11568–11580. [DOI] [PubMed] [Google Scholar]
- (18).Dias SMG; Wilson KF; Rojas KS; Ambrosio ALB; Cerione RA The molecular basis for the regulation of the cap-binding complex by the importins. Nat. Struct. Mol. Biol 2009, 16, 930–937. [DOI] [PMC free article] [PubMed] [Google Scholar]
- (19).Prlić A; Bliven S; Rose PW; Bluhm WF; Bizon C; Godzik A; Bourne PE Pre-calculated protein structure alignments at the RCSB PDB website. Bioinformatics 2010, 26, 2983–2985. [DOI] [PMC free article] [PubMed] [Google Scholar]
- (20).Diaz-Garcia C; Hornos F; Giudici AM; Camara-Artigas A; Luque-Ortega JR; Arbe A; Rizzuti B; Alfonso C; Forwood JK; Iovanna JL et al. Human importin α3 and its N-terminal truncated form, without the importin-β-binding domain, are oligomeric species with a low conformational stability in solution. BBA General Subjects 2020, 1864, 129609. [DOI] [PubMed] [Google Scholar]
- (21).Shechter S; Thomas DR; Lundberg L; Pinkham C; Lin S-C; Wagstaff KM; Debono A; Kehn-Hall K; Jans DA Novel inhibitors targeting Venezuelan equine encephalitis virus capsid protein identified using in silico structure-based-drug-design. Sci. Rep 2017, 7, 17705. [DOI] [PMC free article] [PubMed] [Google Scholar]
- (22).Huang J; Rauscher S; Nawrocki G; Ran T; Feig M; de Groot BL; Grubmuller H; MacKerell AD, J. CHARMM36m: An improved force field for folded and intrinsically disordered proteins. Nat. Methods 2016, 14, 71–73. [DOI] [PMC free article] [PubMed] [Google Scholar]
- (23).Best RB; Zhu X; Shim J; Lopes PEM; Mittal J; Feig M; MacKerell AD Optimization of the additive CHARMM all-atom protein force eld targeting improved sampling of the backbone ϕ,ψ and side-chain χ1 and χ2 dihedral angles. J. Chem. Theory Comput 2012, 8, 3257–3273. [DOI] [PMC free article] [PubMed] [Google Scholar]
- (24).Vanommeslaeghe K; Raman EP; MacKerell AD Automation of the CHARMM general force field (CGenFF) II: Assignment of bonded parameters and partial atomic charges. J. Chem. Inf. Model 2012, 52, 3155–3168. [DOI] [PMC free article] [PubMed] [Google Scholar]
- (25).Wang L; Friesner RA; Berne BJ Replica Exchange with Solute Scaling: A More Efficient Version of Replica Exchange with Solute Tempering (REST2). J. Phys. Chem. B 2011, 115, 9431–9438. [DOI] [PMC free article] [PubMed] [Google Scholar]
- (26).Smith AK; Lockhart C; Klimov DK Does Replica Exchange with Solute Tempering efficiently sample Aβ peptide conformational ensembles? J. Chem. Theor. Comp 2016, 12, 5201–5214. [DOI] [PubMed] [Google Scholar]
- (27).Hardy JCPDJ; Maia JDC; Stone JE; Ribeiro JV; Bernardi RC; Buch R; Fiorin G; Hénin J; Jiang W; McGreevy R et al. Scalable molecular dynamics on CPU and GPU architectures with NAMD. J. Chem. Phys 2020, 153, 044130. [DOI] [PMC free article] [PubMed] [Google Scholar]
- (28).Humphrey W; Dalke A; Schulten K VMD: Visual molecular dynamics. J. Mol. Graph 1996, 14, 33–38. [DOI] [PubMed] [Google Scholar]
- (29).Frutiger A; Tanno A; Hwu S; Tiefenauer RF; Voros J; Nakatsuka N Nonspecific Binding: Fundamental Concepts and Consequences for Biosensing Applications. Chem. Rev 2021, 121, 8095–8160. [DOI] [PubMed] [Google Scholar]
- (30).Daura X; Gademann K; Jaun B; Seebach D; van Gunsteren WF; Mark AE Peptide Folding: When Simulation Meets Experiment. Angew. Chem. Int. Ed 1999, 38, 236–240. [Google Scholar]
- (31).Christie M; Chang C-W; R na G; Smith KM; Stewart AG; Takeda AA-S; Fontes MRM; Stewart M; Vértessy BG; Forwood JK et al. Structural biology and regulation of protein import into the nucleus. J. Mol. Biol 2016, 428, 2060–2090. [DOI] [PubMed] [Google Scholar]
- (32).Lopez AJ; Quoika PK; Linke M; Hummer G; K nger J Quantifying proteinprotein interactions in molecular simulations. J. Phys. Chem. B 2020, 124, 4673–4685. [DOI] [PMC free article] [PubMed] [Google Scholar]
- (33).Gumbart JC; Roux B; Chipot C Standard binding free energies from computer simulations: What is the best strategy? J. Chem. Theory Comput 2012, 9, 794–802. [DOI] [PMC free article] [PubMed] [Google Scholar]
- (34).Schindler CEM; Baumann H; Blum A; Bose D; Buchstaller H-P; Burgdorf L; Cappel D; Chekler E; Czodrowski P; Dorsch D et al. Large-scale assessment of binding free energy calculations in active drug discovery projects. J. Chem. Inf. Model 2020, 60, 5457–5474. [DOI] [PubMed] [Google Scholar]
- (35).Trott O; Olson AJ AutoDock Vina: Improving the speed and accuracy of docking with a new scoring function, efficient optimization, and multithreading. J. Comput. Chem 2010, 31, 455–461. [DOI] [PMC free article] [PubMed] [Google Scholar]
- (36).Eberhardt J; Santos-Martins D; Tillack AF; Forli S AutoDock Vina 1.2.0: New docking methods, expanded force field, and Python bindings. J. Chem. Inf. Model 2021, 61, 3891–3898. [DOI] [PMC free article] [PubMed] [Google Scholar]
- (37).Guterres H; Im W Improving protein-ligand docking results with high-throughput molecular dynamics simulations. J. Chem. Inf. Model 2020, 60, 2189–2198. [DOI] [PMC free article] [PubMed] [Google Scholar]
- (38).Clark AJ The reaction between acetyl choline and muscle cells. J. Physiol 1926, 61, 530–546. [DOI] [PMC free article] [PubMed] [Google Scholar]
- (39).Hodel MR; Corbett AH; Hodel AE Dissection of a nuclear localization signal. J. Biol. Chem 2001, 276, 1317–1325. [DOI] [PubMed] [Google Scholar]
- (40).Wagsta KM; Sivakumaran H; Heaton SM; Harrich D; Jans DA Ivermectin is a specific inhibitor of importin α/β-mediated nuclear import able to inhibit replication of HIV-1 and dengue virus. Biochem. J 2012, 443, 851–856. [DOI] [PMC free article] [PubMed] [Google Scholar]
- (41).Yang SNY; Atkinson SC; Wang C; Lee A; Bogoyevitch MA; Borg NA; Jans DA The broad spectrum antiviral ivermectin targets the host nuclear transport importin α/β1 heterodimer. Antiviral Res. 2020, 177, 104760. [DOI] [PubMed] [Google Scholar]
- (42).Caly L; Druce JD; Catton MG; Jans DA; Wagsta KM The FDA-approved drug ivermectin inhibits the replication of SARS-CoV-2 in vitro. Antiviral Res. 2020, 178, 104787. [DOI] [PMC free article] [PubMed] [Google Scholar]
Associated Data
This section collects any data citations, data availability statements, or supplementary materials included in this article.