Abstract
Self-healing is a new strategy for crack defect which is the main reason for the failure of composites. As an extrinsic self-healing system, the microvascular network system is capable of multiple healing cycles and rapid healing of large area damage. However, the embedment of micropipe network will affect the performance of matrix material. In this article, a microvascular network of self-healing material is optimized using non-dominated sorting genetic algorithm II. Two objective functions head loss and void volume fraction are considered. Finite element analysis and Hardy Cross iteration are performed to achieve the quantization of objective functions. One hundred sixty-five optimized solutions were obtained, and the void volume fraction was within the limits of [4.19%, 5.13%], whereas the head loss was within the limits of [9.63×10⁻⁷ m, 6.51×10⁻⁶ m]. According to the optimization results, the network was prepared and tested to validate the design and feasibility. The test result shows that the void volume fraction of the prepared network is 3.77%, lower than the designed value 4.43% which has a little effect on the matrix material. The network is interconnected and the healing agent can flow freely in it. The embedded network does not reduce the performance of epoxy resin. The optimization of microvascular network balances the mechanical properties and self-repairing properties of the matrix material.
Keywords: Self-healing material, microvascular network, NSGA-II, finite element analysis, Hardy Cross iteration
Introduction
Polymer composites are more and more widely used as a structural material in various applications, such as aerospace, transportation, and electronics, due to their high strength to weight ratio, corrosion resistance, versatility in manufacturability, and good vibration damping. However, polymer composites are susceptible to crack growth in production, transportation, and normal use. The accumulation of crack degrades the mechanical performance of composites, which would shorten the lifetime and result in catastrophic failure. One strategy to resume the performance of the composite is to provide a mechanism to deliver a sustainable supply of the healing agent after damage. Self-healing material is capable of repairing damages automatically without external manual intervention, and the material can be repaired the first time after damage. 1 The structural integrity of materials is restored to avoid accidents, and the lifetime of the material is prolonged.
In recent years, self-healing materials have become a research hotspot and have received widespread acceptance. 2 Self-healing strategies for composites are classified into two categories according to the repair method: intrinsic system and extrinsic system.3–5 Intrinsic self-healing systems accomplish the damage repair of the materials through the reversible chemical reaction existing in the composites matrix. The commonly used chemical reactions include the Diels–Alder reaction, hydrogen bond, disulfide bond, N–O bond, or ionic interactions. The extrinsic systems are further divided into microcapsules,6–8 hollow fibers, 9 and microvascular network according to the carrier of healing agent.10–13 In contrast to intrinsic healing, all extrinsic self-healing systems need a carrier within the matrix to store healing agents that are subsequently released upon damage initiation for self-repair. When there is a crack, the carrier of the extrinsic system, such as the microcapsules, hollow fiber, and microvascular network, will be broken, and then the healing agent flows out and repairs the damage. Intrinsic systems can achieve multiple healing of damage, but there is a special requirement (e.g. inherent reversibility of bonding) for the materials, and it is difficult to produce. For extrinsic systems, microcapsule and hollow fiber self-healing systems have high healing efficiency for the large capacity of healing agent, but cannot achieve multiple healing. For a given crack, the healing process of microcapsule and hollow fiber can only be performed once. The microvascular network system is also an extrinsic system that has the advantages of intrinsic, microcapsule, and hollow fiber self-healing system due to the characteristics of carrier structure, including multiple healing cycles, rapid healing, and large area healing. Toohey et al.14,15 designed a self-healing coating which showed repeated healing through a three-dimensional microvascular network embedded in the coating. Williams et al.16,17 designed and manufactured a vascularized composite sandwich panel that is capable of repairing the impact damage. The author has also carried out numerical simulation research on the optimization of a double-input, double-output microvascular network. 18
However, the microvascular network of the self-healing system needs to be embedded in the matrix material, which will affect the performance of the matrix material. On the one hand, the presence of a microvascular network destroys the material’s structural integrity. On the other hand, the compatibility between the network and the matrix will also affect the performance of the material. To minimize the impact on material performance, recent studies have performed a lot of work in the design and optimization of the self-healing microvascular networks.19–21 The design and optimization of the network must balance the repairing ability of the network and the structural performance of the matrix material. A large amount of optimization algorithm, such as simulated annealing (SA), tabu search (TS), and genetic algorithms (GA), are introduced to solve optimization problems. Compared to other optimization algorithms, the GA is adopted because of the following advantages. First, there is no need for any prior knowledge in the optimization process of GA. Second, the GA can deal with the multi-objective function problem easily. Third, the elapsed time of GA is less over a large combinatorial.22–24
In this article, an orthogonal network is designed and optimized using a multi-objective GA. According to the optimization result, the network was prepared using a new method and its performance was verified through a series of experiments. The structure of this work is distributed as follows. Section “Problem description” describes the research problem in detail. The optimization procedure of the microvascular network is introduced in section “Non-dominated sorting genetic algorithm II.” The optimization results are presented in section “Result and discussion.” The manufacturing process of the microvascular network and validation of the performance of the network are introduced in section “Preparation and validation study.” Section “Conclusion” gives a brief summary of this article.
Problem description
Self-healing materials can be repaired automatically when damage occurs. To repair any part of the material, the microvascular network should be evenly distributed in the matrix material. In this study, a rectangular cube with a size of 100 mm × 100 mm × 4 mm is considered as the matrix. An orthogonal network with 4 × 4 channels is embedded in the matrix. The microvascular network model is simplified and shown in Figure 1. S and T are the inlet and outlet of the network. The dotted line with labels 1–40 represents the microchannels. The diameters of the network are selected from a limited set of discrete values . The set of all discrete channels of the microvascular network is .
Figure 1.
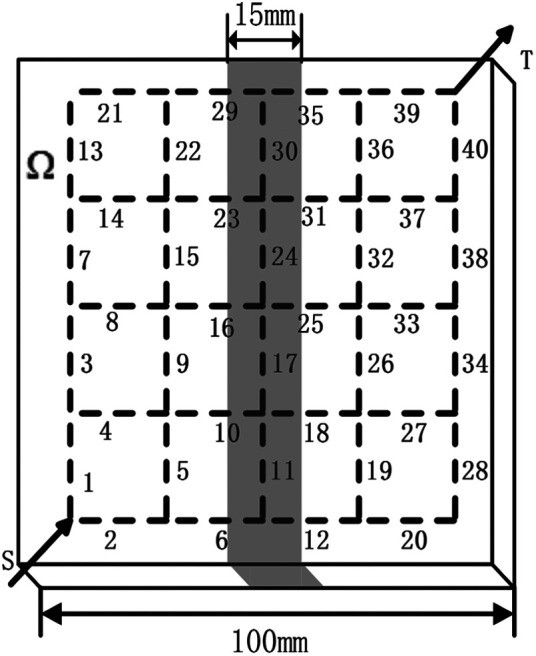
The simplified microvascular network model. S is the inlet and T is the outlet.
In this article, two important topics, namely, void volume fraction (VVF) and head loss (HL), are considered as the objective functions of microvascular network optimization. To reduce the effect on the properties of the matrix and ensure each microchannel has an active flow, the purpose is to minimize the VVF and the HL. It is obvious that two optimization topics are conflicting. Therefore, this optimization problem belongs to a multi-target problem.
Non-dominated sorting genetic algorithm II
Inspired by biological genetic characteristics, GA had been developed to solve the optimization problem. GA is a search method to find optimal solutions by applying genetic operators simulating natural evolutionary processes. The simple genetic algorithm is often used to solve single target problem. But, in this work, the objective functions include (1) minimizing the VVF and (2) minimizing the HL. Obviously, this is a multi-objective function optimization problem, and simple GA may not search the optimal solution. For such a multi-objective optimization problem, Deb et al. 25 proposed an improved GA, known as the non-dominated sorting genetic algorithm (NSGA-II). It considers all objectives at the same time, and the idea of Pareto optimality is used to select a set of best candidates. It can successfully obtain the optimal solutions for a conflicting objective function optimization problem.
In general, the NSGA-II procedure initiates by randomly creating a population. An offspring is then created by applying the evolutionary operators, namely, the crossover and the mutation. After that, the algorithm enters a loop to obtain better candidate solutions. At each generation, the rule of non-dominated fonts is used to divide the combined parent–children population into the Pareto Frontier. In addition, the NSGA-II adds a crowding distance to increase the diversity of the candidate solutions.
VVF
The microvascular network replaces the original matrix material which has a direct influence on the stiffness and strength properties of the composite. To minimize the effect of the matrix, the VVF of network is set not more than . The threshold is obtained by finite element (FE) analysis using the three-point bending test.26,27 The model with a size 100 mm × 15 mm × 4 mm is a part of the network model (e.g. the part represented by gray in Figure 1). Then, the failure load is obtained by the three-point bending test. It is worth noting that the diameter of the microvascular network contains the wall thickness of the network because the network is not the bearing part.
The model is meshed as shown in Figure 2, with a total 60,000 elements. The matrix material is epoxy resin. Its elasticity modulus is 3.93 GPa, Poisson’s ratio is 0.34, and the maximum bending stress is 87.12 MPa. The downward red arrows are load applied on the surface of the model, and blue is the supported constraint on the lower surface of the model. The distance between the two constraints is 64 mm. The stress concentration is generated while all movement directions are constrained at both support parts. Different constraints were applied at two ends to avoid stress concentration. Therefore, the moving degree of freedom in the y direction at the right support parts is not constrained, and the other moving degree of freedom is constrained.
Figure 2.

Simulation model of the microvascular network.
Figure 3 shows the simulation result of the three-point bending test. The curve was obtained by fitting the simulation results. When the VVF is small, the failure load fluctuates. Then, with the increase in the VVF, the failure load decreases gradually, which indicates a decline in material performance. In particular, when the VVF is more than 5.13%, the failure load decreases rapidly. Hence, the boundary condition is set to 5.13%. However, it does not mean that 5.13% is the best value, but the maximum allowed. The distribution of the different diameters could make the network to have smaller VVF and HL at the same time, which is also the significance of the optimization.
Figure 3.
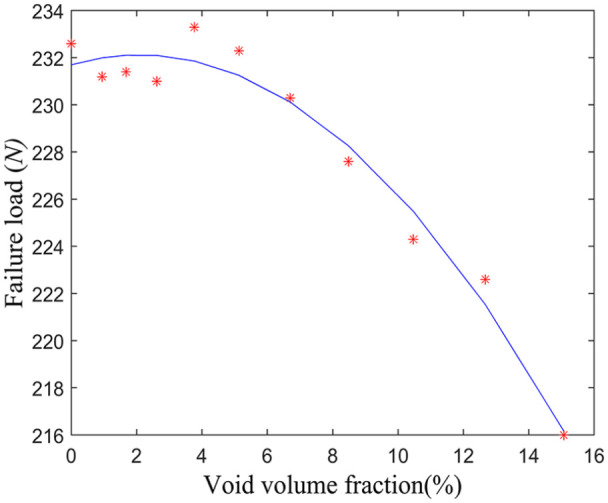
Simulation results of the microvascular network.
Within the boundary condition, the void volume of the network to the matrix material should be minimized. The VVF is defined as
| (1) |
where k is the channel number of the network, is the kth channel diameter, p is the channel wall thickness, and V is the volume of composite matrix.
HL
Because of the small diameter, the flow of liquid in the network becomes extremely difficult. Therefore, a flow efficient network needs to make the energy which drives the fluid through the microchannels to a minimum. HL is the mechanical energy lost during the movement of liquid. In this work, the flow efficient network is quantified through the HL. Then, the HL is defined as an objective function such that
| (2) |
where U is the resistance factor and m and n are the flow exponents. Taking water at temperature 25 °C as an example, n = 1.852 and m = 4.87. is the volume of liquid in the kth channel. The calculating equation of U is
| (3) |
C is determined by wall roughness. In the practical application, for each channel, equation (2) is usually written as , where .
The flow is obtained through Hardy Cross iteration. 28 The central idea of Hardy Cross iterative is to ignore the interaction between each loop. Establish the resistance equation along each loop. For each channel (resistance factor is r), set initial flow and fixed flow (the small amount of iteration). The modified flow rate Q is written as
| (4) |
HL is calculated as
| (5) |
Compared with , is a small amount. By taking on the first-order approximation, the resistance equation can be written as
| (6) |
After finishing, the relationship between the fixed flow and the initial flow is written as
| (7) |
In addition, the flow of liquid in the network always follows the two principles below:
-
The flow on the node conforms to the continuity principle. Assume that the inflow is positive and the outflow is negative. Then, the algebra sum of the flow is zero. The mathematical expression is
(8) where u is the node number.
-
The HL on the node is unique. Assume that clockwise is positive and counterclockwise is negative. Then, the algebra sum of the HL along the loop from any node is zero. The mathematical expression is
(9) where v is the loop number.
NSGA-II optimization
In this work, NSGA-II is used to achieve the optimization of the network topology for its excellent multi-objective search capability. The NSGA-II guarantees the diversity of the initial population by randomly creating a set of individuals , and its size is . There is a completely different chromosome code between each individual D in the population. In the iterative process, an offspring population is then created using evolutionary operators including crossover and mutation. The crossover can maintain the superior genes of the parent population, and the mutation can jump out of the local optimum. The objective functions and are calculated to evaluate the individual’s excellence. Both offspring and parent individuals are placed into a new group and sorted according to the principle of non-dominated sorting. The non-dominated individuals are put into the Pareto Frontier , and the crowding distance is calculated. The best Pareto Frontier is chosen to create the next-generation population until the size equals .
The specific steps of NSGA-II are as follows.
Pseudo codes of the NSGA-II
Step 1: Generate a random set of individuals with size .
Step 2: Calculate the objective functions and to evaluate the individual’s excellence.
Step 3: Randomly select two individuals in and choose the better one to the mating pool according to the non-dominated rule and crowding distances.
Step 4: Apply evolutionary operators to create offspring population , and the size is equal to .
Step 5: Put offspring and parent individuals into a new group .
Step 6: Divide the new group into the Pareto Frontier using the non-dominated sorting rule.
Step 7: For , do:
until , then
Step 8: Whether to end and return ?
Step 9: Set t = t + 1, go back to Step 2.
In this article, the population size is set to 800. The proportions of crossover and mutation in the optimization are 0.8 and 0.2, respectively, to ensure the inheritance of the good genes and prevent falling into local optimum. The iteration number is not more than 12,000.
Results and discussion
A single-inlet, single-outlet network with 4 × 4 channels is considered in the optimization. Then, there are 2n(n − 1) = 40 channels in total, and there are two channels for inlet and outlet of the network. All channels are l = 20 mm in length. The inlet and outlet are located on the diagonal of the microvascular network, respectively. The set of possible inner diameter choices is .
Figure 4 shows the optimization Pareto Frontiers at generations t = 1000, 2000, 4000, 6000, 8000, 10,000, and 12,000, respectively. As the iterations grow, the number of Pareto solutions increases from 72 to 165 gradually and ultimately hardly changes. The VVF increases from range [4.72%, 5.13%] to [4.19%, 5.13%], while the HL increases from range [1.29 × 10⁻⁷ m, 2.64 × 10⁻⁶ m] to [9.63 × 10⁻⁷ m, 6.51 × 10⁻⁶ m] at generations t = 1000 and t = 12,000. The range among all the objectives becomes wider and the optimization results are getting better. Of course, the volume fraction of all the optimized individuals is not more than 5.13%.
Figure 4.
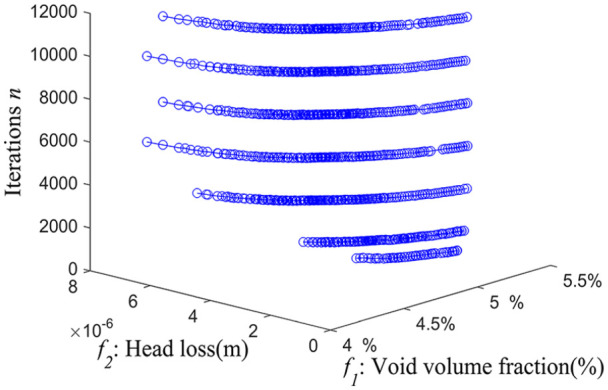
Optimal Pareto Frontiers at generations t = 1000, 2000, 4000, 6000, 8000, 10,000, and 12,000, respectively.
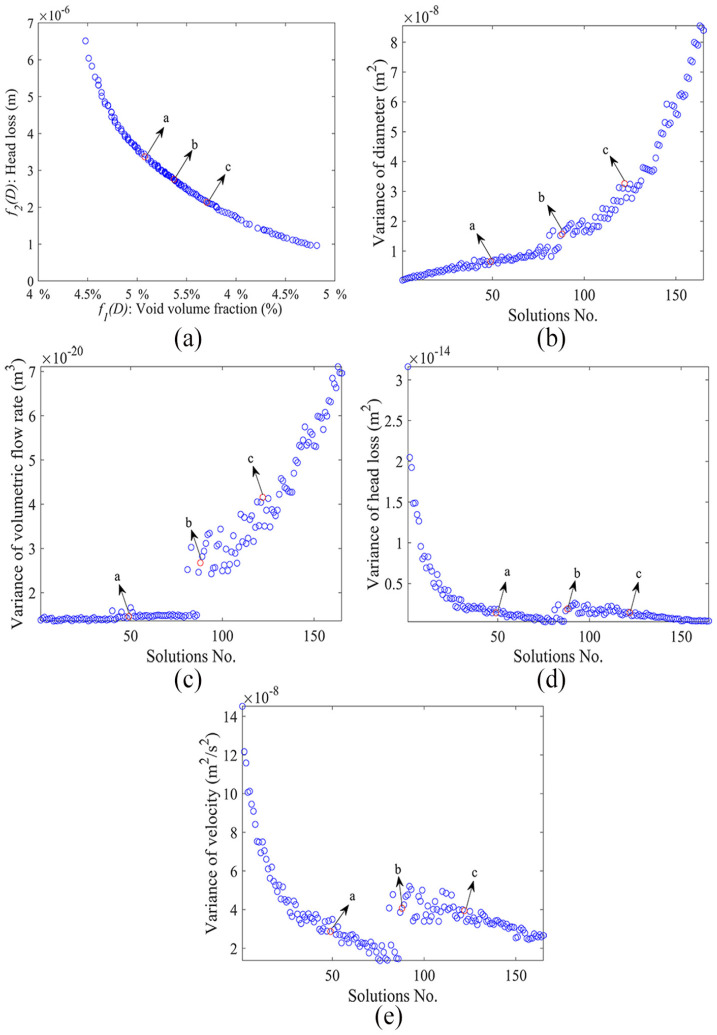
The optimization results are usually Pareto solutions, which means all the results are optimal solutions. Then, four parameters (diameter, volumetric flow rate, HL, and velocity) are considered to select the suitable solution for an active flow and minimum void volume. Surely, the diameter and HL are the main factors. The smaller the variance (the chance in each parameter) of each parameter, the more stable the solution and the less the effect of the network on the matrix material. Optimization results for competing objectives and after 12,000 generations are presented in Figure 5(a) (the population size ). The variances of four parameters are shown in Figure 5(b)–(e). It is worth noting that the optimization variances are plotted after sort-rows according to the VVF.
Figure 5.
Optimization results for competing objectives and after 12,000 generations are presented in Figure 5(a) (the population size ). The variances of four parameters are shown in Figure 5(b)–(e). The X axis represents the number of solutions after sort-rows according to the VVF.
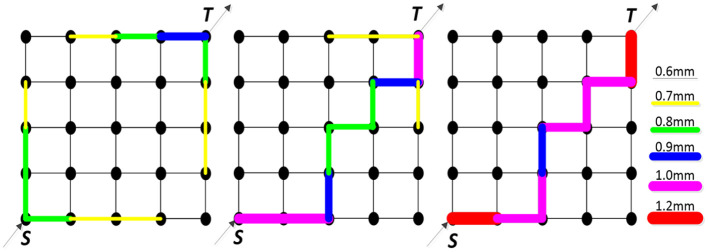
Figure 5(b) shows the changes of four parameters. As the VVF increases, the variance of diameter and volumetric flow rate are increasing and the HL and velocity are declining. Considering all the variations of four parameters, Pareto solutions a, b, and c obtained through the optimization were picked for further study, and its topology structure is shown in Figure 6. The different widths and colors (black, yellow, green, blue, magenta) of lines represent the channels with different diameters (0.6, 0.7, 0.8, 0.9, 1.0, and 1.2 mm). In the optimization process, eight kinds of standard diameter are used in this study. But individuals (a), (b), and (c) do not contain all the eight kinds of diameters. The result shows that the following:
Figure 6.
Topology of the network of the selected Pareto solutions (a), (b), and (c). The different widths and colors (black, yellow, green, blue, magenta) of lines represent the channels with different diameters (0.6, 0.7, 0.8, 0.9, 1.0, and 1.2 mm).
The VVF of Pareto solutions a, b, and c is 4.43%, 4.56%, and 4.68% in order, and the corresponding HL is 3.37 × 10⁻⁶, 2.69 × 10⁻⁶, and 2.13 × 10⁻⁶ m, respectively.
The channel with a larger diameter is generally distributed in the entrance/exit direction.
Preparation and validation study
Preparation of microvascular network
Since the diameters of the same network are small and different, it is very difficult to prepare the network. According to the optimization result, the Pareto solution (a) in section “Result and discussion” is selected to produce the material object of the network. The material used to produce the network is very critical. On the one hand, the network must have enough strength to ensure it will not be destroyed when embedding the matrix material. On the other hand, the network must be destroyed to repair the material when the material is damaged. A ceramic material YH-067 that was produced by Hong Kong Yi-hui Group Limited was used to produce the network. After solidification, the material became harder and brittle, which satisfied the requirement of the network. Its heat-resistance temperature is as high as 1730 C, which ensures the network will not be damaged when the preform is removed at a high temperature. The specific preparation process of the network in this study is as follows. The produced material object of network is shown in Figure 7:
Figure 7.
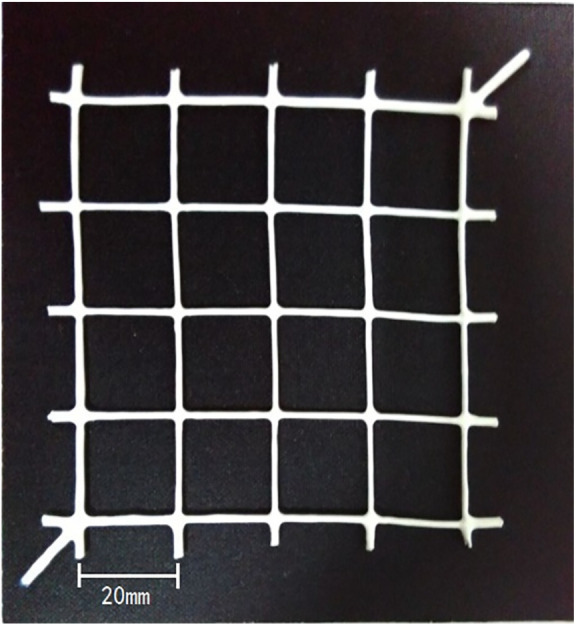
Material object of network.
Step 1: Produce the network preform using three-dimensional (3D) printing technology. The size of the preform is the same as the hollow part of the network. Eventually the preform will be removed by gasification.
Step 2: The ceramic material YH-067 is evenly coated on the preform. The ceramic material YH-067 will eventually be prepared as the wall of the network.
Step 3: After drying, heat the network to 80 C for 2 h and then heat up to 150 C for 2 h which will help solidify the ceramic material.
Step 4: Finally, heat the network to 800 C until the preform is gasified, and the ceramic material YH-067 will be left to form a hollow network.
Validation study
Three sets of experiment are used to test the network: (1) the VVF obtained by measuring the volume of the network; (2) the interconnectivity of the microvascular networks via infrared (IR) thermal imaging technology; and (3) the material performance through the three-point bending test.
Validation of the VVF
The VVF is corresponding to the volume of the network. The diameter of each channel is measured by Vernier caliper. By measuring the corresponding upper, middle, and lower parts of each channel and taking the average, the diameter of all channels can be obtained. The calculated volume of network is 1507.9 mm3. The VVF is 3.70%, lower than the designed value 4.43% and with respect to the imposed constraints.
The interconnectivity of the microvascular networks
The interconnectivity of the microvascular network was accomplished by injecting hot water into the network and obtaining images of the network using an IR camera. Figure 8 shows the flow of hot water and all circulation networks. The flow direction of water can be known by the IR thermal imaging system. The hot water is injected into the network at t = 0. With the aid of IR camera, Figure 8(a) and (b) shows the network at t = 8 s and t = 20 s, respectively. The result shows that the network is interconnected and the healing agent could flow freely in it. The flow direction is consistent with the topology of flow rate.
Figure 8.
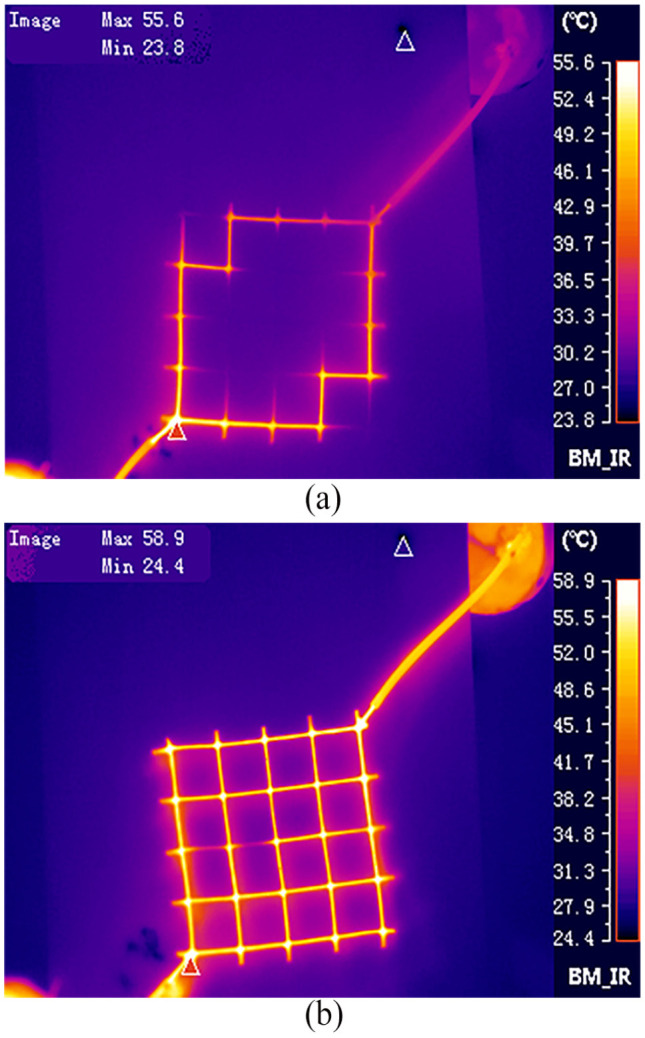
Infrared thermography of network injected with hot water. (a) t = 8 s and (b) t = 20 s.
The material performance test
The performance of epoxy resins with the network is obtained by the three-point bending test. Therefore, three-point bend specimen with microvascular network should be produced first. In other words, the network should embed in the resin matrix. Because YH-067 is an inorganic material and epoxy resins are organic material, the silane coupling agent is needed to improve its boundary. The silane coupling agents KH-560 and KH-550 are mixed evenly on the network in the ratio of 1:3. After drying, the network is embedded in the epoxy resin matrix. The matrix material with network is cut to get the appropriate size of the specimen. The specimen size is 100 mm × 15 mm × 4 mm, which is the same size as the three-point bending simulation in section “VVF.”
The load–displacement curve and failure load of each specimen can be obtained through the three-point bending test. A monotonic load is applied to the specimen by three-point loading at room temperature. The distance between the two supported points of the test is also 64 mm. The speed of pressing head is controlled to 1 mm/min to ensure that the specimen is not damaged and the experiment is carried out smoothly. Figure 9 shows the experimentation of the three-point bending test.
Figure 9.
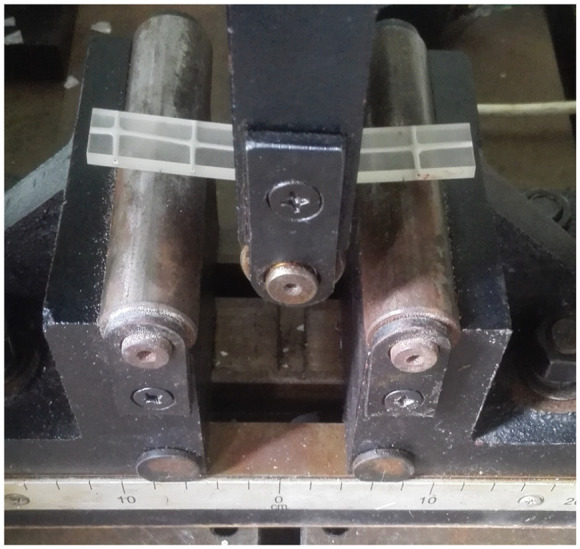
Three-point bending test.
Table 1 shows the test result of each specimen. The failure load of specimen without network is basically distributed within a range from 170 to 260 N, with an average of 217.8 N. The failure load of specimen with network is basically distributed within a range from 210 to 290 N, with an average of 260.7 N. Compared with the specimen without network, the failure load of the specimen with network does not decrease but increases slightly in certain instances, which means that the embedded network does not reduce the performance of epoxy resin. It is because the stress concentration of the resin matrix under pressure is released to a certain extent by the entry of the network. This result is similar to the simulation results in section “VVF.”
Table 1.
Failure load test result of each specimen.
| Without network |
With network |
||
|---|---|---|---|
| Specimen no. | Failure load (N) | Specimen no. | Failure load (N) |
| 1 | 224.4 | 11 | 211.6 |
| 2 | 195.7 | 12 | 237.0 |
| 3 | 224.3 | 13 | 283.6 |
| 4 | 231.4 | 14 | 285.4 |
| 5 | 257.1 | 15 | 285.9 |
| 6 | 233.2 | ||
| 7 | 235.9 | ||
| 8 | 224.0 | ||
| 9 | 173.6 | ||
| 10 | 178.4 | ||
| Mean value | 217.8 | Mean value | 260.7 |
Conclusion
In this article, a microvascular network carrier for self-healing materials is studied. The NSGA-II is used for the multi-objective optimization problem, which includes the VVF and HL. The quantization of the objective functions is achieved by FE technique and Hardy Cross iteration. The microvascular network is prepared and tested to validate the optimization result obtained by NSGA-II. The optimization results and experimental results show the following:
As the iterations grow, the number of Pareto solutions increases from 72 to 165 gradually and ultimately hardly changes. Then, a group of Pareto solutions are obtained, and the VVF is within the limits of [4.19%, 5.13%], whereas the HL is within the limits of [9.63 × 10⁻⁷ m, 6.51 × 10⁻⁶ m]. The channel with a larger diameter is generally distributed in the entrance/exit direction.
The material object of network was prepared and tested to validate the design and optimization of NSGA-II. The test result shows that the VVF of the prepared network is 3.77%, lower than the designed value 4.43% and with respect to the imposed constraints. The network is interconnected and the healing agent can flow freely. The flow direction is consistent with the topology of flow rate. Compared with the specimen without network, the failure load of the specimen with network is increased, which means that the embedded network does not reduce the performance of the epoxy resin.
Author biographies
Peng Li is a doctor and associate professor with East China Jiaotong University, the research interests include smart structures and swarm intelligent optimization algorithms.
Genzhu Liu is a postgraduate with East China Jiaotong University, the research field is self-healing material.
Yuan Liu is a postgraduate with East China Jiaotong University, the research fields are self-healing material and swarm intelligent optimization algorithms.
Jingyong Huang is a postgraduate with East China Jiaotong University, the research field is self-healing material.
Footnotes
The author(s) declared no potential conflicts of interest with respect to the research, authorship, and/or publication of this article.
Funding: The author(s) disclosed receipt of the following financial support for the research, authorship, and/or publication of this article: This work was supported by National Natural Science Foundation of China (Grant No. 51365012).
ORCID iD: Peng Li  https://orcid.org/0000-0002-7096-2104
References
- 1.Hamilton AR, Sottos NR, White SR. Mitigation of fatigue damage in self-healing vascular materials. Polymer 2012; 53(24): 5575–5581. [Google Scholar]
- 2.Trask RS, Norris CJ, Bond IP. Stimuli-triggered self-healing functionality in advanced fibre-reinforced composites. J Intell Mater Syst Struct 2014; 25(1): 87–97. [Google Scholar]
- 3.Patrick JF, Sottos NR, White SR. Microvascular based self-healing polymeric foam. Polymer 2012; 53(19): 4231–4240. [Google Scholar]
- 4.Guimard NK, Oehlenschlaeger KK, Zhou J, et al. Current trends in the field of self-healing materials. Chem Phys 2012; 213: 131–143. [Google Scholar]
- 5.Mauldin TC, Kessler MR. Self-healing polymers and composites. Metallurg Rev 2013; 55(6): 317–346. [Google Scholar]
- 6.Yuan YC, Rong MZ, Zhang MQ, et al. Self-healing polymeric materials using epoxy/mercaptan as the healant. Macromolecules 2008; 41(14): 5197–5202. [Google Scholar]
- 7.Liao LP, Zhang W, Xin Y, et al. Preparation and characterization of microcapsule containing epoxy resin and its self-healing performance of anticorrosion covering material. Sci Bullet 2011; 56(4–5): 439–443. [Google Scholar]
- 8.Haiyan L, Rongguo W, Wenbo L. Preparation and self-healing performance of epoxy composites with microcapsules and tungsten (VI) chloride catalyst. J Reinforced Plast Compos 2012; 31(13): 924–932. [Google Scholar]
- 9.Pang JWC, Bond IP. A hollow fibre reinforced polymer composite encompassing self-healing and enhanced damage visibility. Compos Sci Tech 2005; 65(11): 1791–1799. [Google Scholar]
- 10.Robertson WS. Local strain concentrations in a microvascular network. Experiment Mech 2010; 50(2): 255–263. [Google Scholar]
- 11.Hamilton AR, Sottos NR, White SR. Self-healing of internal damage in synthetic vascular materials. Adv Mater 2010; 22(45): 5159–5163. [DOI] [PubMed] [Google Scholar]
- 12.Phillips DM, Pierce MR, Baur JW. Mechanical and thermal analysis of microvascular networks in structural composite panels. Compos Part A 2011; 42(11): 1609–1619. [Google Scholar]
- 13.Soghrati S, Thakre PR, White SR, et al. Computational modeling and design of actively-cooled microvascular materials. Int J Heat Mass Trans 2012; 55(19–20): 5309–5321. [Google Scholar]
- 14.Toohey KS, Sottos NR, Lewis JA, et al. Self-healing materials with microvascular networks. Nat Mater 2007; 6(8): 581–585. [DOI] [PubMed] [Google Scholar]
- 15.Toohey KS, Sottos NR, White SR. Characterization of microvascular-based self-healing coatings. Experiment Mech 2009; 49(5): 707–717. [Google Scholar]
- 16.Williams HR, Trask RS, Bond IP. Self-healing composite sandwich structures. Smart Mater Struct 2007; 16(4): 1198–1207. [Google Scholar]
- 17.Williams HR, Trask RS, Bond IP. Self-healing sandwich panels: restoration of compressive strength after impact. Compos Sci Tech 2008; 68(15–16): 3171–3177. [Google Scholar]
- 18.Li P, Liu Y, Zou T, et al. Optimal design of microvascular networks based on non-dominated sorting genetic algorithm II and fluid simulation. Adv Mech Eng 2017; 9(7): 1687814017708175. [Google Scholar]
- 19.Olugebefola SC, Aragon AM, Hansen CJ, et al. Polymer microvascular network composites. J Compos Mater 2010; 44(22): 2587–2603. [Google Scholar]
- 20.Aragón AM, Saksena R, Kozola BD, et al. Multi-physics optimization of three-dimensional microvascular polymeric components. J Computat Phys 2013; 233(1): 132–147. [Google Scholar]
- 21.Aragón AM, Smith KJ, Geubelle PH, et al. Multi-physics design of microvascular materials for active cooling applications. J Computat Phys 2011; 230(13): 5178–5198. [Google Scholar]
- 22.Aragón AM, Wayer JK. Design of microvascular flow networks using multi-objective genetic algorithms. Comp Methods Appl Mech Eng 2008; 197(49): 4399–4410. [Google Scholar]
- 23.Soghrati S, Aragón AM, Geubelle PH. Design of actively-cooled microvascular materials: a genetic algorithm inspired network optimization. Struct Multidisc Optimizat 2014; 49(4): 1–13. [Google Scholar]
- 24.Li P, Wang Y, Hu J, et al. Sensors distribution optimization for impact localization using NSGA-II. Sens Rev 2015; 35(4): 409–418. [Google Scholar]
- 25.Deb K, Pratap A, Agarwal S, et al. A fast and elitist multiobjective genetic algorithm: NSGA-II. IEEE Trans Evolution Computat 2002; 6(2): 182–197. [Google Scholar]
- 26.Knipprath C, Mccombe GP, Trask RS, et al. Predicting self-healing strength recovery using a multi-objective genetic algorithm. Compos Sci Tech 2012; 72(6): 752–759. [Google Scholar]
- 27.Li YF, Jobe O, Yu CC, et al. Experiment and analysis of bolted GFRP beam–beam connections. Compos Struct 2015; 127(127): 480–493. [Google Scholar]
- 28.Ding ZR, Shan XX, Jiang J. Fluid mechanics, vol. 3. Beijing, China: Higher Education Press, 2013. [Google Scholar]


