

Abstract
Background:
Lack of guideline-directed medical therapy (GDMT) in patients undergoing peripheral vascular interventions (PVIs) may increase mortality and amputation risk.
Objective:
To study the association between GDMT and mortality/amputation and to examine GDMT variability amongst providers and health systems.
Methods:
We performed an observational study using patients in the Vascular Quality Initiative registry undergoing PVI between 2017 and 2018. Two-year all-cause mortality and major amputation data were derived from Medicare claims data. Compliance with GDMT was defined as receiving a statin, antiplatelet therapy, and ACE-inhibitor/angiotensin receptor blocker if hypertensive. Propensity 1:1 matching was applied for GDMT vs. no GDMT and survival analyses were performed to compare outcomes between groups.
Results:
Of 15,891 patients undergoing PVIs, 48.8% received GDMT and 6,120 patients in each group were matched. Median follow up was 9.6 [4.5–16.2] months for mortality and 8.4 [3.5–15.4] for amputation. Mean age was 72.0±9.9 years. Mortality risk was higher amongst patients who did not receive GDMT versus those on GDMT (31.2% vs. 24.5%, P-value <.001; Hazard Ratio (HR) 1.37, 95% Confidence Interval (CI) 1.25–1.50), as well as, risk of amputation (16.0% vs. 13.2%, P-value <.001, HR=1.20, 95% CI 1.08–1.35). GDMT rates across sites and providers ranging from 0% to 100%, with lower performance translating into higher risk.
Conclusion:
Almost half of the patients receiving PVI in this national quality registry were not on GDMT, and this was associated with increased risk of mortality and major amputation. Quality improvement efforts in vascular care should focus on GDMT in patients undergoing PVI.
Keywords: Peripheral Artery Disease, Quality of Care, Outcomes Research, Guideline Directed Medical Therapy
CONDENSED ABSTRACT
There is lack of evidence-based guideline-directed medical therapy (GDMT) following peripheral vascular interventions (PVIs) in patients with peripheral artery disease (PAD) could leave them at increased risk of death and amputation. From a national, Medicare linked vascular quality registry, 12,240 patients undergoing PVI were 1:1 propensity matched for receiving no GDMT vs. GDMT at discharge. Almost half of the patients in a receiving a PVI were not on GDMT at discharge, and this was associated with increased subsequent mortality and amputation risk.
INTRODUCTION
Over 8.5 million Americans have peripheral artery disease (PAD), a generalized atherosclerotic condition that can manifest as lower-extremity pain or tissue loss.(1) While management of patients’ symptoms can be addressed with exercise, claudication medications or revascularization options, long-term cardiovascular risk management is necessary for all PAD patients.(2) To lower patients’ cardiovascular risk, key Class I recommendations consist of – besides introducing lifestyle changes – providing PAD patients with statin therapy, antiplatelet therapy, and hypertension medication, in particular angiotensin-converting enzyme (ACE) inhibitors and angiotensin receptor blockers (ARBs) as found efficacious in vascular populations, when appropriate. (3,4)(2)
At least 1 in 5 patients with a PAD diagnosis experiences death, myocardial infarction, stroke, or amputation in the year following their PAD work-up.(5) Revascularization options to manage PAD symptoms, including endovascular peripheral vascular interventions (PVIs), may be preference-sensitive; or specifically indicated as a limb salvage strategy amongst those with CLI.(2) There has been a rapid rise in the volume of PVIs over the past decade,(6,7) standing in contrast with the clinical inertia for implementing guideline-directed medical therapy (GDMT) in PAD.(8–10) Such inertia significantly varies across health systems delivering PAD care, independent of patient characteristics - suggesting that this undertreatment is potentially modifiable.(9,10) While the benefit of GDMT in real-world PAD populations has been demonstrated in single-center studies and in work using electronic medical record data,(11) as well as its predictors of underusage,(12) there has been no national documented data on the impact of lack of real-world GDMT usage at the time of discharge post-PVIs on long term clinical outcomes.
We therefore used national registry data from the Vascular Quality Initiative (VQI), linked with Medicare claims data to study the association between receipt of GDMT (statin, antiplatelet therapy, and ACE/ARB in hypertensive patients)(2) and long-term mortality and amputation. We additionally quantified the mortality and amputation risk as a function of the variability in GDMT rates across health systems and providers.
METHODS
Study Procedures and Patients
The Society of Vascular Surgery and American College of Cardiology national VQI registry is an ongoing procedural quality registry, capturing the quality of care and outcomes of patients undergoing PAD procedures. The PVI module was used for this study. Vascular centers subscribing to the registry have dedicated trained data collectors who prospectively enter consecutive endovascular PVIs into the data portal, capturing quality of care data (including discharge medications and procedural data) into the registry. Specialties subscribing to the registry and represented in the Vascular Implant Surveillance and Interventional Outcomes Network (VISION) platform are only available at the aggregate level due to patient safety organization status of the registry.
To augment the quality of the outcomes data, VQI linked their platform with national Medicare fee-for-service claims data through their VISION platform housed at Weill Cornell Medicine, Cornell University, NY. Direct matching of VQI records was performed by a Centers for Medicare and Medicaid Services contractor to link the data through verification of social security numbers, in addition to indirect matching using facility identification, state, patients’ date of birth, sex, procedural dates, and zip codes. The methodology used for the matching algorithm has demonstrated >90% sensitivity and >99% specificity in prior validation efforts using non-vascular populations.(13) Recent work described the validation efforts specifically for the linking between the VQI registry data to Medicare claims data with a 93% matching rate and a higher than 99% accuracy of the linkage algorithms used.(14,15)
We included endovascular PVIs performed between January 1, 2017 and December 31, 2018, in patients 18 years or older. In case of multiple PVIs within one single patient, the first occurrence was included. Exclusion criteria were: (1) patients who underwent PVIs with an indication for acute limb ischemia; (2) patients without Medicare fee-for-service coverage; (3) patients treated at centers with missingness rates higher than the upper limit (3rd quartile + 1.5*interquartile); (4) patients with missing GDMT information; (5) patients missing at least 1 of the covariates used for the propensity score calculation. The study was approved by the Yale University and Weill Cornell Medicine Institutional Review Boards.
Exposure
As defined in recent guidelines,(2) receipt of all of the three following medications upon discharge was considered GDMT: being on any statin, antiplatelet therapy (including any P2Y12 inhibitor, aspirin, or aspirin-containing drugs), and ACE/ARB if hypertensive.(13) Data definitions are described in Table S1. Exclusions from the denominator for the receipt of each medication were applied if the patients were not eligible to receive that medication (i.e. for patients who were not hypertensive) or if there were documented medical reasons for non-eligibility. If a patient had a contraindication or if the measure was not applicable, they were classified as having achieved this quality metric. Patients without hypertension but on ACE/ARB therapy for other reasons were also classified as having received this quality metric.
Outcomes
All-cause mortality was derived from the Centers for Medicare and Medicaid Services vital status files. Amputation was also derived from Medicare claims files and included major amputations at either leg with Current Procedural Terminology codes 27590–27592 (amputation, thigh), 27880–27882 (amputation leg), and 28805 (amputation foot). Beneficiaries had a median follow-up of 9.6 months (Interquartile range [IQR] 4.5–16.2) for mortality and 8.4 months (IQR 3.5–15.4) for major amputation. Patients were followed up to 24 months after the index procedure or up to December 31, 2018, whichever occurred first. At 24 months 4.6% of patients were lost-to-follow-up.
Other Variables
Other variables included socio-demographics, medical history including cardiovascular risk factors, anatomical lesion treatment information, and device type as abstracted from patients’ medical records by trained data collectors in each of the participating VQI centers.
Statistical Analysis
Patient characteristics were described for the overall sample and by GDMT status. Continuous variables were summarized as means and standard deviations, and medians and interquartile ranges and categorical variables as frequencies and percentages. Standardized differences were calculated to derive the effect sizes of the differences between the groups. For all descriptive comparisons, standardized differences below 10% or below 20% were considered negligible or small, respectively.(16) Specialty representation (vascular surgery, interventional cardiology, and interventional radiology) was summarized at the aggregate level for the overall cohort, and by sites represented.
Propensity score matching was used to balance characteristics between comparison groups and reduce confounding in our observational data. We chose for propensity matching, which maximizes the balancing of covariates, with straightforward interpretation, at the expense of excluding unmatched individuals, as our primary method, (17–20) and chose the propensity score inverse probability method which retains data from all participants for purposes of our sensitivity analyses.(19) For our first aim, risk of all-cause mortality and major amputation by GDMT status was described in the propensity-matched cohort using complete case analysis. A propensity score was derived for each patient based on the probability of receiving no GDMT vs. GDMT using a logistic regression model including 22 variables (denoted with asterisk, Table 1).(21) Matching (1:1) to the nearest neighbor without replacement was performed using a caliper width of 0.2 of the standard deviation of the logit of the propensity score. Distributions of the propensity scores for the no GDMT vs. GDMT cohorts were inspected, prior and after matching. Using the propensity-matched sample, patient characteristics were again compared by GDMT status and standardized differences were derived.
Table 1.
Characteristics For the Overall Cohort and By No GDMT vs. GDMT Groups Before and After Propensity Matching.
| Before Propensity Matching | After Propensity Matching | |||||||
|---|---|---|---|---|---|---|---|---|
|
| ||||||||
| Total N=15,891 | No GDMT N=8,136 | GDMT N=7,755 | Standardized Differences | Total N=12,240 | No GDMT N=6,120 | GDMT N=6,120 | Standardized Differences | |
|
| ||||||||
| Demographics | ||||||||
| Age in years, mean (SD)** | 72.0 (10.1) | 72.4 (10.7) | 71.6 (9.3) | 0.088 | 72.0 (9.9) | 71.9 (10.4) | 72.1 (9.4) | −0.015 |
| Age in years, median (IQR) | 72.0 [66.0; 79.0] | 73.0 [66.0; 80.0] | 72.0 [66.0; 78.0] | 72.0 [66.0; 79.0] | 72.0 [66.0; 79.0] | 72.0 [66.0; 79.0] | ||
| Female sex** | 6,215 (39.1) | 3,322 (40.8) | 2,892 (37.3) | 0.072 | 4,757 (38.9) | 2,358 (38.5) | 2,399 (9.2) | 0.014 |
| Race** | ||||||||
| White | 12,577 (79.1) | 6,315 (77.6) | 6,262 (80.7) | 0.072 | 9,718 (79.4) | 4,858 (79.4) | 4,860 (79.4) | 0.014 |
| Black or African American | 2,467 (15.5) | 1,366 (16.8) | 1,101 (14.2) | 1,887 (15.3) | 930 (15.2) | 947 (15.7) | ||
| Asian | 157 (1.0) | 89 (1.1) | 68 (0.9) | 117 (1.0) | 62 (1.0) | 55 (0.9) | ||
| American Indian or Alaskan Native | 99 (0.6) | 55 (0.7) | 44 (0.6) | 71 (0.6) | 37 (0.6) | 34 (0.6) | ||
| Other or Unknown | 591 (3.7) | 311 (3.8) | 280 (3.6) | 457 (3.7) | 233 (3.8) | 224 (3.7) | ||
| Hispanic ethnicity** | 635 (4.0) | 336 (4.1) | 299 (3.9) | 0.014 | 490 (4.0) | 251 (4.1) | 239 (3.9) | 0.010 |
| Primary insurer** | ||||||||
| Medicare | 15,106 (95.1) | 7,755 (95.3) | 7,351 (94.8) | 0.029 | 11,643 (95.1) | 5,824 (95.2) | 5,824 (95.2) | 0.009 |
| Medicaid | 94 (0.6) | 45 (0.6) | 49 (0.6) | 73 (0.6) | 35 (0.6) | 35 (0.6) | ||
| Commercial | 621 (3.9) | 298 (3.7) | 323 (4.2) | 468 (3.8) | 232 (.8) | 232 (3.8) | ||
| Other | 70 (0.4) | 38 (0.5) | 32 (0.4) | 56 (0.5) | 29 (0.5) | 29 (0.5) | ||
| Living at home (vs. nursing home or homeless)** | 15,002 (94.4) | 7,535 (92.6) | 7,467 (96.3) | 0.161 | 11,700 (95.6) | 5,843 (95.5) | 5,857 (95.7) | 0.010 |
| Medical history and risk factors | ||||||||
| Smoking status** | ||||||||
| Never | 3,872 (24.4) | 2,193 (27.0) | 1,681 (21.7) | 0.123 | 2,926 (23.9) | 1,494 (23.8) | 1,472 (24.1) | 0.007 |
| Prior | 7,882 (49.6) | 3,891 (47.8) | 3,991 (51.5) | 6,102 (49.9) | 3,056 (49.9) | 3,046 (49.8) | ||
| Current | 4,135 (26.0) | 2,052 (25.2) | 2,083 (26.9) | 3,216 (26.2) | 1,610 (26.3) | 1,602 (26.2) | ||
| Hypertension** | 14,530 (91.4) | 7,729 (95.0) | 6,801 (87.7) | 0.262 | 11,536 (94.2) | 5,722 (93.5) | 5,814 (95.0) | 0.065 |
| Congestive heart failure** | 4,073 (25.6) | 2,206 (27.1) | 1,867 (24.1) | 0.070 | 3,137 (25.6) | 1,562 (25.5) | 1,575 (25.7) | 0.005 |
| Coronary artery disease** | 6,133 (38.6) | 2,957 (36.3) | 3,176 (41.0) | 0.095 | 4,792 (39.2) | 2,385 (39.0) | 2,407 (39.3) | 0.007 |
| Prior coronary artery bypass grafting** | 3,777 (23.8) | 1,777 (21.8) | 2,000 (25.8) | 0.093 | 2,968 (24.2) | 1,492 (24.4) | 1,476 (24.1) | 0.006 |
| Prior percutaneous coronary intervention** | 4,216 (26.5) | 1,913 (23.5) | 2,301 (29.7) | 0.140 | 3,277 (26.8) | 1,649(26.9) | 1,628 (26.8) | 0.008 |
| Diabetes** | 8,866 (55.8) | 4,370 (53.7) | 4,496 (58.0) | 0.086 | 6,864 (56.1) | 3,405 (55.6) | 3,459 (56.5) | 0.018 |
| Chronic kidney disease (eGFR<60)** | 6,664 (41.9) | 3,866 (47.5) | 2,796 (36.1) | 0.235 | 5,060 (41.3) | 2,512 (41.0) | 2,548 (41.6) | 0.012 |
| Cerebrovascular disease** | 2,749 (17.3) | 1,431 (17.6) | 1,318 (17.0) | 0.016 | 2,100 (17.2) | 1,040 (17.0) | 1,060 (17.3) | 0.009 |
| Chronic lung disease** | 4,616 (29.0) | 2,358 (29.0) | 2,258 (29.1) | 0.003 | 3,605 (29.5) | 1,792 (29.3) | 1,813 (29.6) | 0.008 |
| PAD history | ||||||||
| Carotid disease** | 1,586 (10.0) | 722 (8.9) | 864 (11.1) | 0.076 | 1,250 (10.2) | 628 (10.3) | 622 (10.2) | 0.003 |
| Prior amputation** | 2,777 (17.5) | 1,577 (19.4) | 1,200 (15.5) | 0.103 | 2,151 (17.6) | 1,071 (17.5) | 1,080 (17.6) | 0.004 |
| Prior peripheral procedure** | 6,658 (41.9) | 3,237 (39.8) | 3,421 (44.1) | 0.088 | 5,192 (42.4) | 2,5602 (42.5) | 2,590 (42.3) | 0.004 |
| Bilateral Symptoms** | 6,021 (37.9) | 2,855 (35.1) | 3,166 (40.8) | 0.121 | 4,692 (38.3) | 2,369 (38.7) | 2,336 (38.2) | 0.016 |
| Rutherford class 4 to 6** | 9,367 (58.9) | 5,302 (65.2) | 4,065 (52.4) | 0.261 | 7,180 (58.7) | 3,573 (58.4) | 3,607 (58.9) | 0.011 |
| Peripheral Vascular Intervention Characteristics | ||||||||
| Procedure urgency** | ||||||||
| Elective | 13,457 (84.7) | 6,801 (83.6) | 6,656 (85.8) | 0.077 | 10,397 (84.9) | 5,205 (85.0) | 5,192 (84.6) | 0.015 |
| Urgent | 2,158 (13.6) | 1,161 (14.3) | 997 (12.9) | 1,660 (13.6) | 818 (13.5) | 831 (13.8) | ||
| Emergent | 276 (1.7) | 174 (2.1) | 102 (1.3) | 183 (1.5) | 89 (1.4) | 97 (1.6) | ||
| Aorta/iliac artery treated | 4,966 (31.3) | 2,271 (27.9) | 2,695 (34.8) | 0.148 | 3,841 (31.4) | 1,830 (29.9) | 2,011 (33.9) | 0.067 |
| Common onto external iliac artery treated | 763 (4.8) | 355 (4.4) | 408 (5.3) | 0.042 | 600 (4.9) | 295 (4.8) | 305 (5.0) | 0.022 |
| Profunda artery treated | 208 (1.3) | 99 (1.2) | 109 (1.4) | 0.017 | 168 (1.4) | 82 (1.3) | 82 (1.3) | 0.000 |
| SFA/Popliteal artery treated | 9,585 (60.3) | 4,961 (61.0) | 4,624 (59.6) | 0.028 | 7,374 (60.3) | 3,692 (60.3) | 3,682 (60.2) | 0.004 |
| Below knee artery treated | 4,993 (31.4) | 2,903 (35.7) | 2,090 (27.0) | 0.189 | 3,834 (31.3) | 2,010 (32.9) | 1,824 (29.8) | 0.066 |
| Plain balloon | 11,949 (75.2) | 6,217 (76.4) | 5,732 (73.9) | 0.058 | 9,203 (75.2) | 4,614 (75.4) | 4,589 (75.0) | 0.009 |
| Stent graft | 1,276 (8.0) | 606 (7.4) | 670 (8.6) | 0.044 | 1,018 (8.3) | 486 (7.9) | 532 (8.7) | 0.027 |
| Atherectomy | 3,273 (20.6) | 1,683 (20.7) | 1,590 (20.5) | 0.005 | 2,540 (20.8) | 1,284 (21.0) | 1,256 (20.5) | 0.011 |
| Special balloon | 5,432 (34.2) | 2,664 (32.7) | 2,768 (35.7) | 0.062 | 4,218 (34.5) | 2,056 (33.6) | 2,162 (35.3) | 0.036 |
| Stent | 7,128 (44.9) | 3,436 (42.2) | 3,692 (47.6) | 0.108 | 5,490 (44.9) | 2,673 (43.7) | 2,817 (46.0) | 0.047 |
| Bailout stent | 279 (1.8) | 137 (1.7) | 142 (1.8) | 0.011 | 214 (1.7) | 103 (1.7) | 111 (1.8) | 0.010 |
| Bailout stent graft | 36 (0.2) | 16 (0.2) | 20 (0.3) | 0.013 | 27 (0.2) | 13 (0.2 | 14 (0.2) | 0.003 |
|
| ||||||||
| Discharge Medications | ||||||||
| Aspirin | 13,041 (82.1) | 6,124 (75.3) | 6,920 (89.2) | 0.372 | 10,105 (82.6) | 4,688 (76.6) | 5,417 (88.5) | 0.338 |
| P2Y12 | 11,658 (73.4) | 5,536 (68.1) | 6,125 (79.0) | 0.249 | 9,039 (73.97) | 4,247 (69.4) | 4,770 (77.9) | 0.197 |
| Statin therapy | 13,166 (82.9) | 5,411 (66.5) | 7,755 (100.0) | 1.003 | 10,205 (83.4) | 4,085 (66.7) | 6,120 (100.0) | 0.997 |
| ACE-Inhibitor or ARB therapy | 8,477 (53.3) | 1,412 (17.4) | 7,065 (91.1) | 2.201 | 6,976 (56.7) | 1,084 (17.7) | 5,892 (96.3) | 2.607 |
All values are presented as n (%), unless otherwise specified. Abbreviations: GDMT:, Guideline Directed Medical Therapy; SD, standard deviation; IQR, interquartile range; eGFR, Estimated Glomerular Filtration Rate; ACE, angiotensin-converting enzyme inhibitor; ARB, angiotensin receptor blocker. Cells with counts <11 are denoted by *.
denotes variables included in calculation of propensity weight for receiving guideline directed medical therapy vs. no GDMT.
Kaplan-Meier curves for all-cause mortality and amputation were constructed by GDMT status and differences were tested using the Log Rank test. Hazard ratios (HR) and 95% confidence intervals (CI) were derived from hierarchical Cox-proportional hazards models with an intercept random effect for site and provider for the association between receipt of GDMT and all-cause mortality and major amputation. For the analyses including the endpoint major amputation, censoring was applied at the time of death for those who did not survive and who were without major amputation.
The following sensitivity analyses related to the first aim were performed to demonstrate the robustness of our main analyses. First, our main analyses were replicated using a propensity matched cohort with imputed missing covariate data. Missing values were imputed using the multiple imputation by chained equations method.(22,23) Second, inverse propensity score weighted Kaplan Meier survival curves and Cox proportional hazards models with a random effect for site and provider were replicated in the unmatched cohort with imputed covariate information.(19) The distribution of Kernel Density estimates for the inverse propensity scores was visualized. Third, the hierarchical Cox proportional hazards models were repeated in the complete case matched cohort now examining the dose response-relationship between the number of GDMT medications and mortality and amputation, respectively excluding those who were not eligible to receive such medications due to medical reasons or because they did not have hypertension, as applicable. Next, to examine the robustness of the association between GDMT and prognostic outcomes in PAD, we evaluated each GDMT medication separately and replicated the survival analyses.
For our second aim, performance rates of delivery of GDMT by enrolling sites and providers were ranked and divided into quartiles. The association between GDMT performance (highest performing quartile as reference vs. other levels) and mortality and major amputation were evaluated replicating our survival analyses in the inverse propensity weighted cohort with imputed covariate information.
Analyses were performed with STATA version 17 (StataCorp. 2021. Stata Statistical Software: Release 17. College Station, TX: StataCorp LLC), and with R(24) (version 2.2–16, R Foundation for Statistical Computing, Vienna, Austria). Due to confidentiality reasons, cell sizes smaller than 11 were masked.
RESULTS
A total of 223 sites contributed data to this study (Figure S1). Specialties represented in VISION performing the PVI procedures were vascular surgery (37.6%), interventional radiology (14.2%) and interventional cardiology (13.7%), respectively (Figure S2a–d). After applying the inclusion and exclusion criteria, we retained 15,891 individuals (Figure S3a) of which 48.8% were receiving GDMT. The cohort derivation flows for the sensitivity analyses are visualized in Figures S3b–c. An overview of contributing patients undergoing PVIs by site and by GDMT status is provided in Table S2.
After applying propensity-score matching, we matched 6,120 patients who were not on GDMT with 6,120 patients who were on GDMT. Following the propensity score matching, all standardized differences for the comparisons by GDMT status were ≤0.10 as a threshold for negligible-small differences, indicating relatively balanced groups (Table 1, Figure 1, Figure S4, S5). The mean age of the matched cohort was 72.0±9.9 years, with 38.9% female, 79.4% Whites, 15.3% Blacks or African Americans, 1.0% Asians, and 4.0% were Hispanic. For comorbidities, 26.2% were current smokers, 94.2% had hypertension, 56.1% had diabetes, 25.6% had heart failure, and 39.2% had coronary artery disease. Almost 1 in 5 had a history of amputation (17.6%), 10.2% had carotid artery stenosis, and 42.4% had undergone a prior peripheral intervention.
Figure 1.
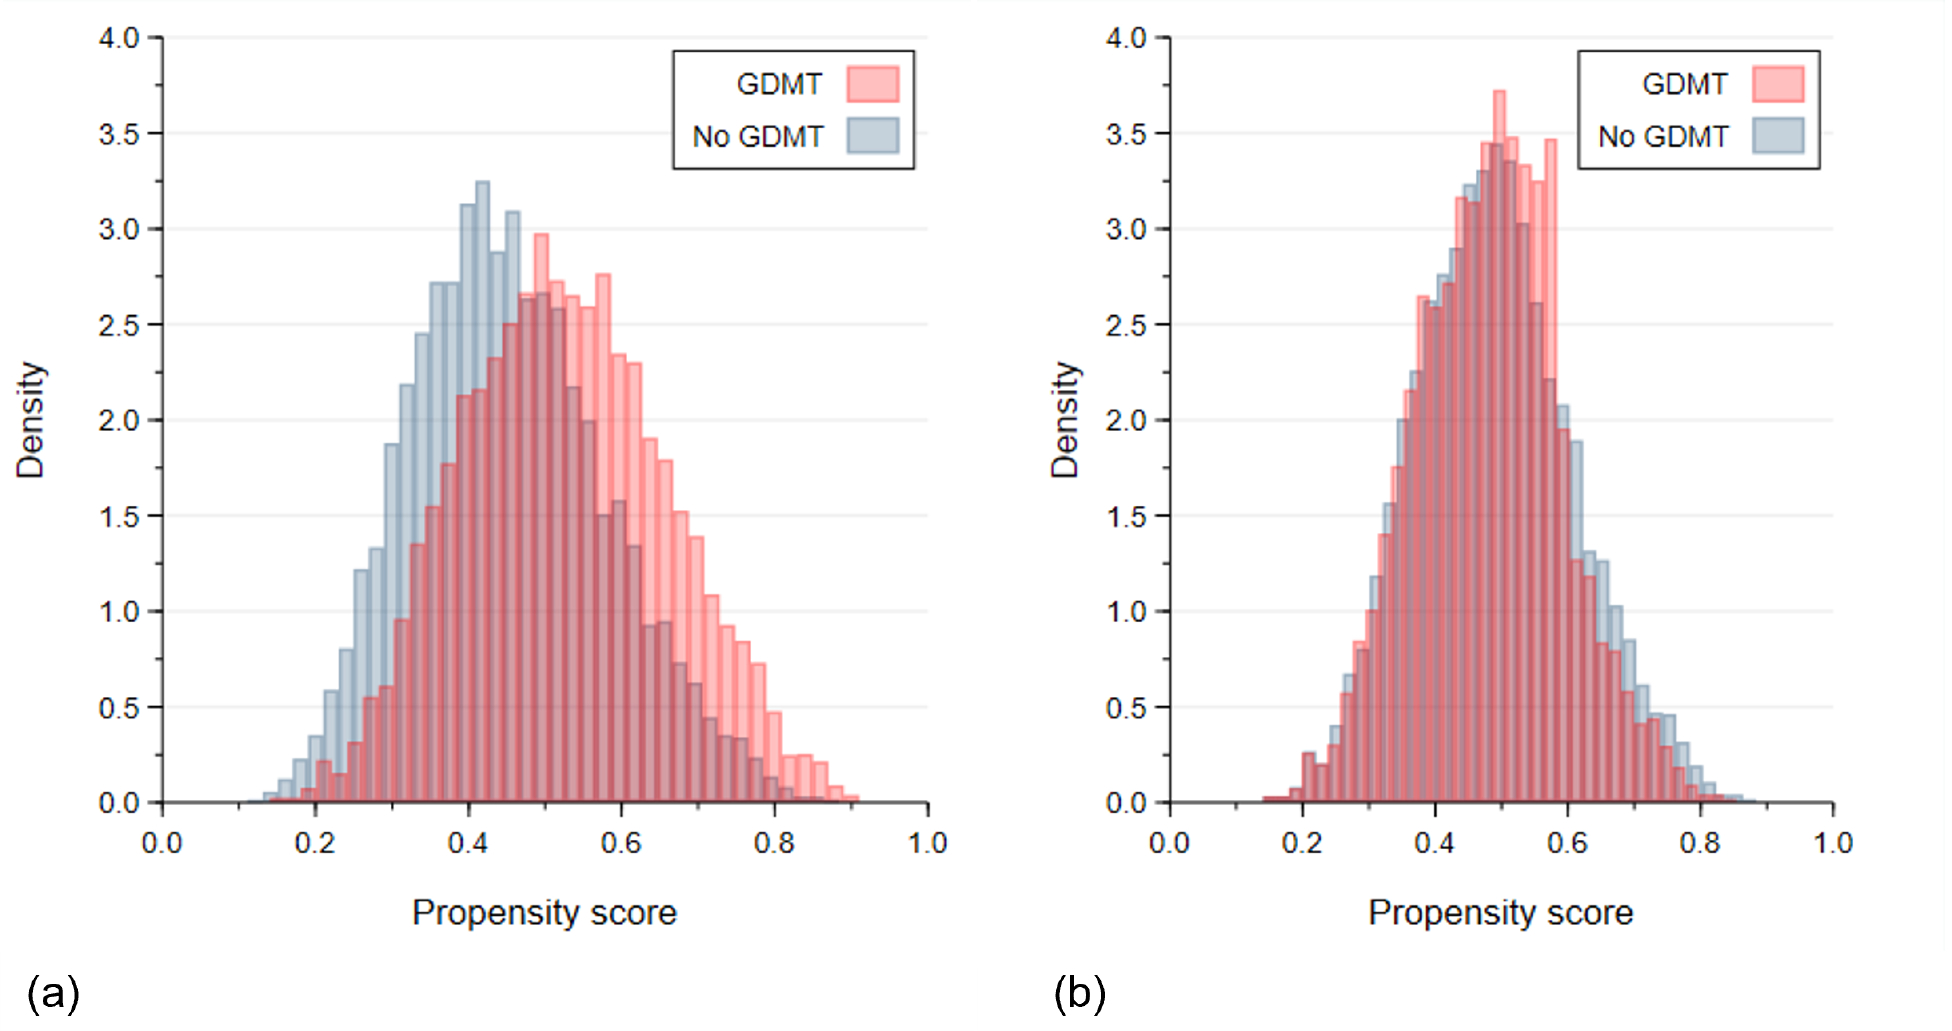
Distributions of the Propensity Scores for No GDMT vs. GDMT (a) Before and (b) After Propensity Matching. Abbreviations: GDMT, guideline directed medical therapy.
The individual discharge medications are listed in Table 1 with highest prescription rates for statins (83.4%) and aspirin (82.6%) and lowest for ACE/ARB inhibitors (56.7%) (Central Illustration).
Central Illustration.
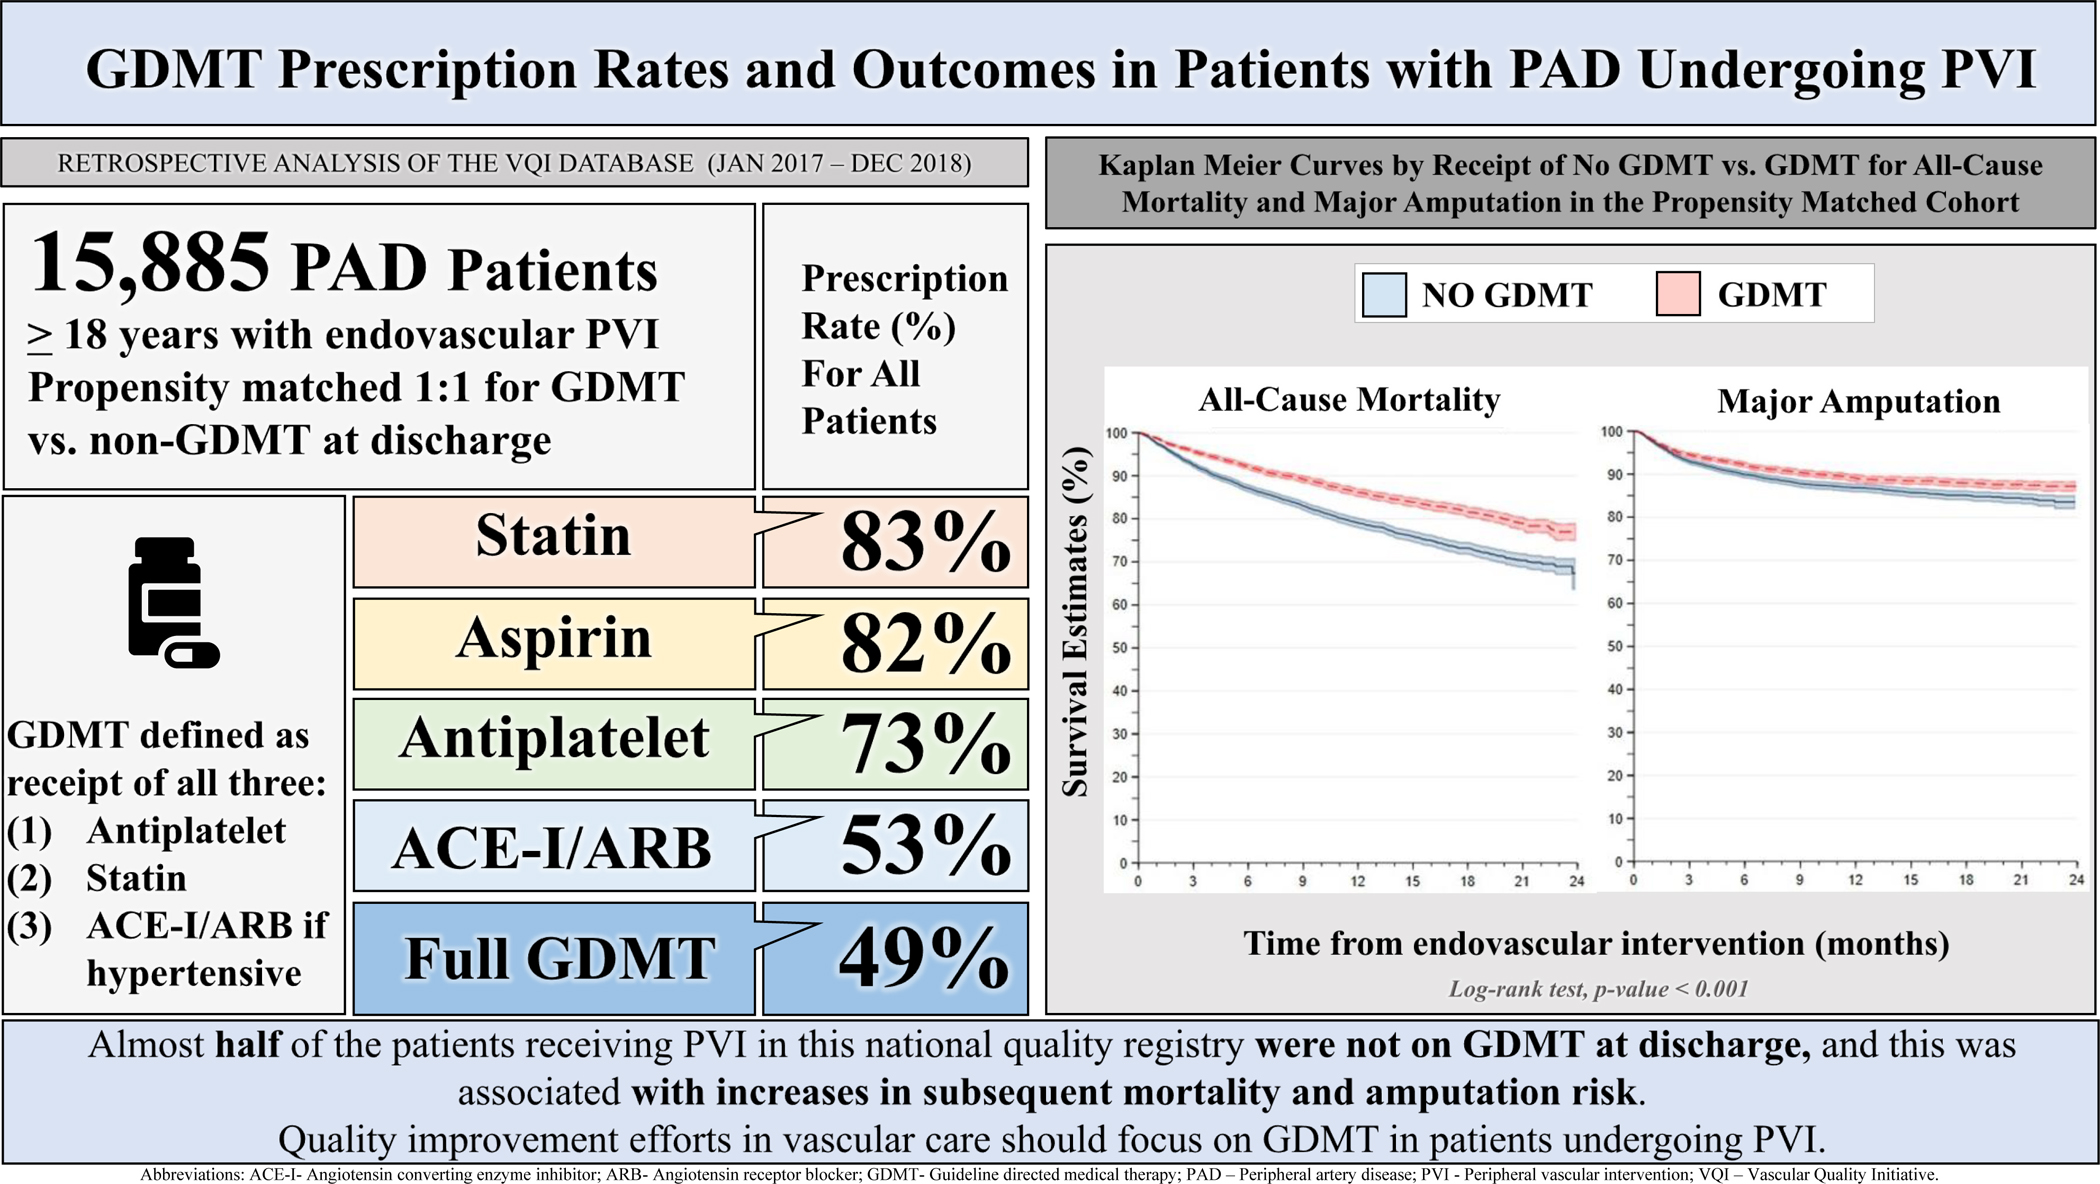
Guideline Directed Medical Therapy (GDMT) Prescription Rates and Outcomes in Patients with Peripheral Artery Disease Undergoing Peripheral Vascular Intervention.
Levels of major amputation by GDMT status are described in Table S3. As compared with patients on GDMT, the risk of all-cause mortality at follow up was higher amongst those who did not receive GDMT (31.2% vs. 24.5%, p-value <0.001; HR=1.37; 95% CI 1.25–1.50) (Figure 2a, Table S4). Similarly, the risk of major amputation at follow up was higher for those without GDMT vs. those who received GDMT (16.0% vs. 13.2%, p-value <0.001, HR=1.20; 95% CI 1.08–1.35) (Figure 2b, Table S5).
Figure 2.
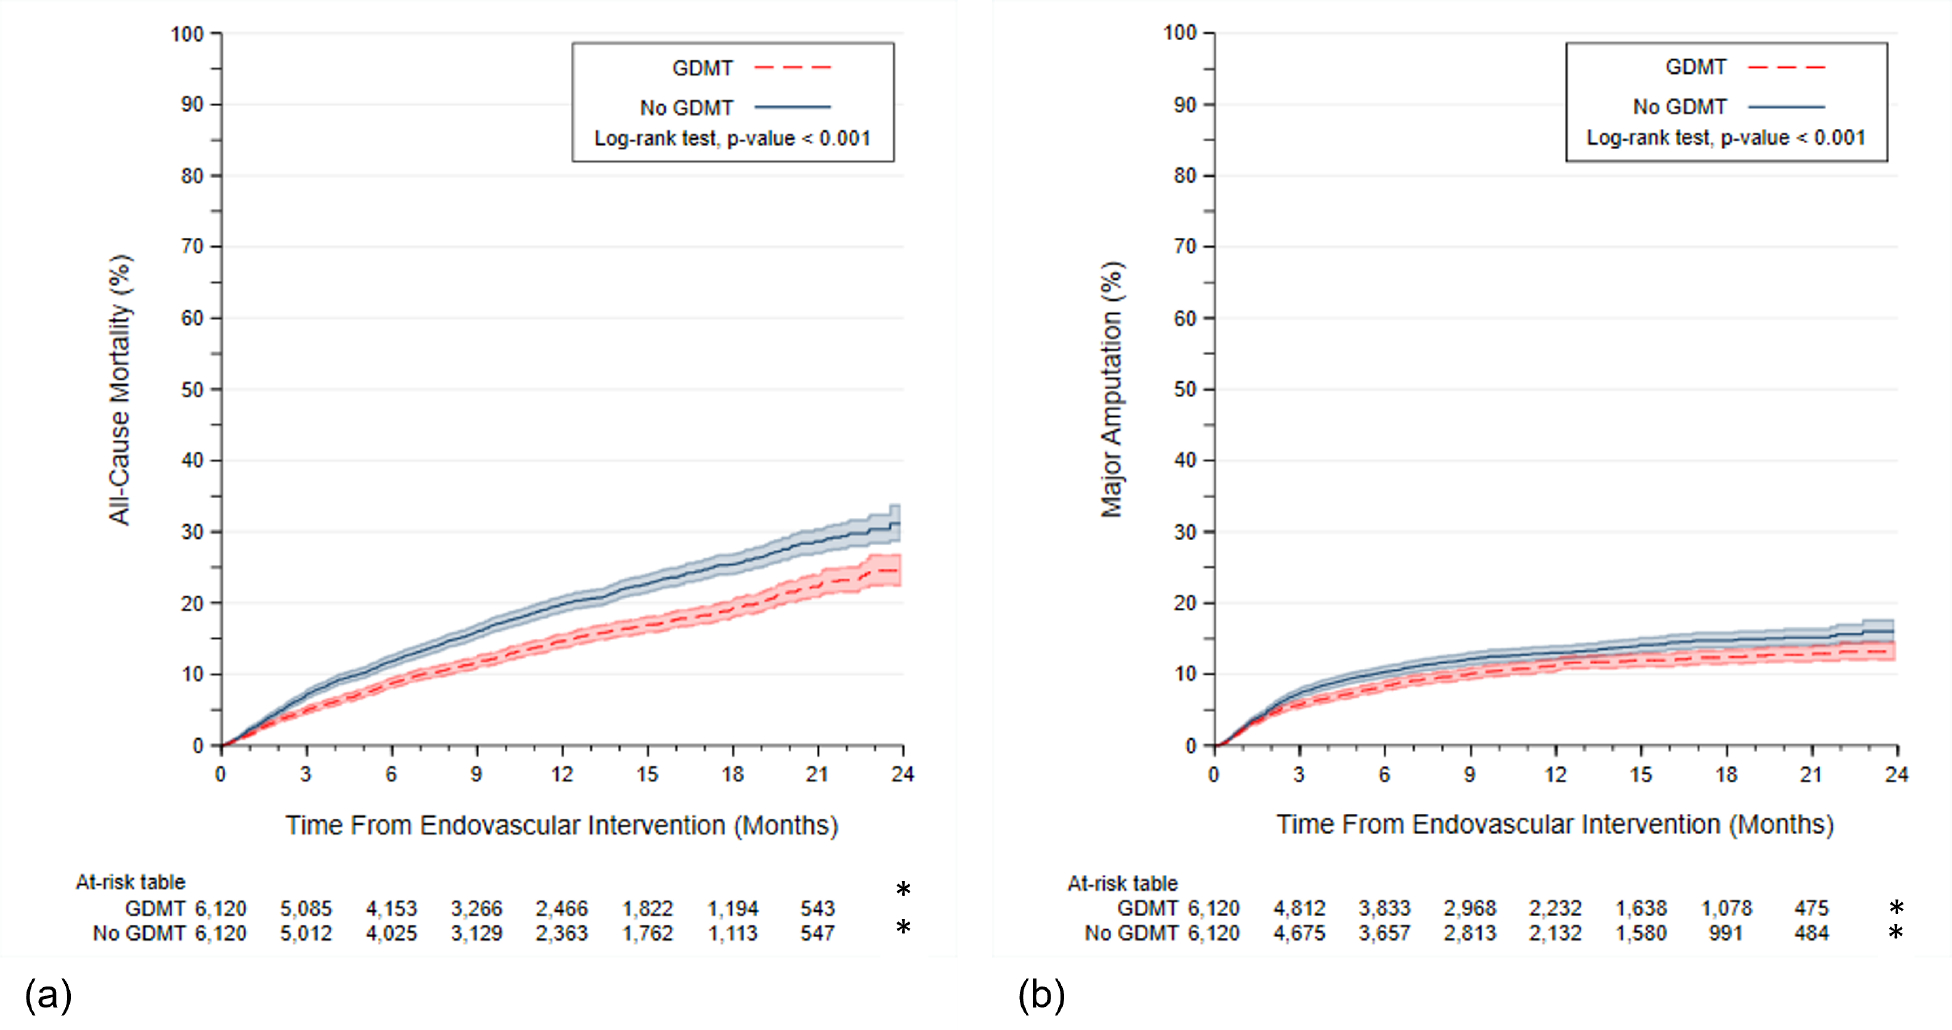
Kaplan Meier Curves by Receipt of No GDMT vs. GDMT for (a) All-Cause Mortality and (b) Major Amputation in the Propensity Matched Cohort (n=12,240). Abbreviations: GDMT, guideline directed medical therapy. Cells with counts <11 are denoted by *.
Missing covariate information was below 10%, with the highest level of missingness reported for chronic kidney disease (6.4%). Propensity matched analyses were replicated using imputed covariate data and corroborated our main analyses. When repeating our main analysis on the imputed cohort using the inverse propensity weight adjusted results, our findings were replicated- indicating a greater risk of all-cause mortality for those not on GDMT (vs. GDMT) (32.4% vs. 24.6%; HR=1.40; 95% CI 1.33–1.48), as well as for major amputation (15.6% vs. 13.2%, HR=1.15; 95% CI 1.08–1.24).
When stratifying the analysis by the number of medications contributing to GDMT, we observed a dose-response relationship for both all-cause mortality and major amputation (p-values <0.001), which was also reflected in the risk estimates associated with both endpoints, with fewer medications added, resulting in incremental risk (Figure 3a–b, Table S6–S7). No receipt vs. receipt of each of the individual elements of GDMT were also associated with a higher risk of all-cause mortality and major amputation (P-values log rank test <0.001) (Figure S6).
Figure 3.
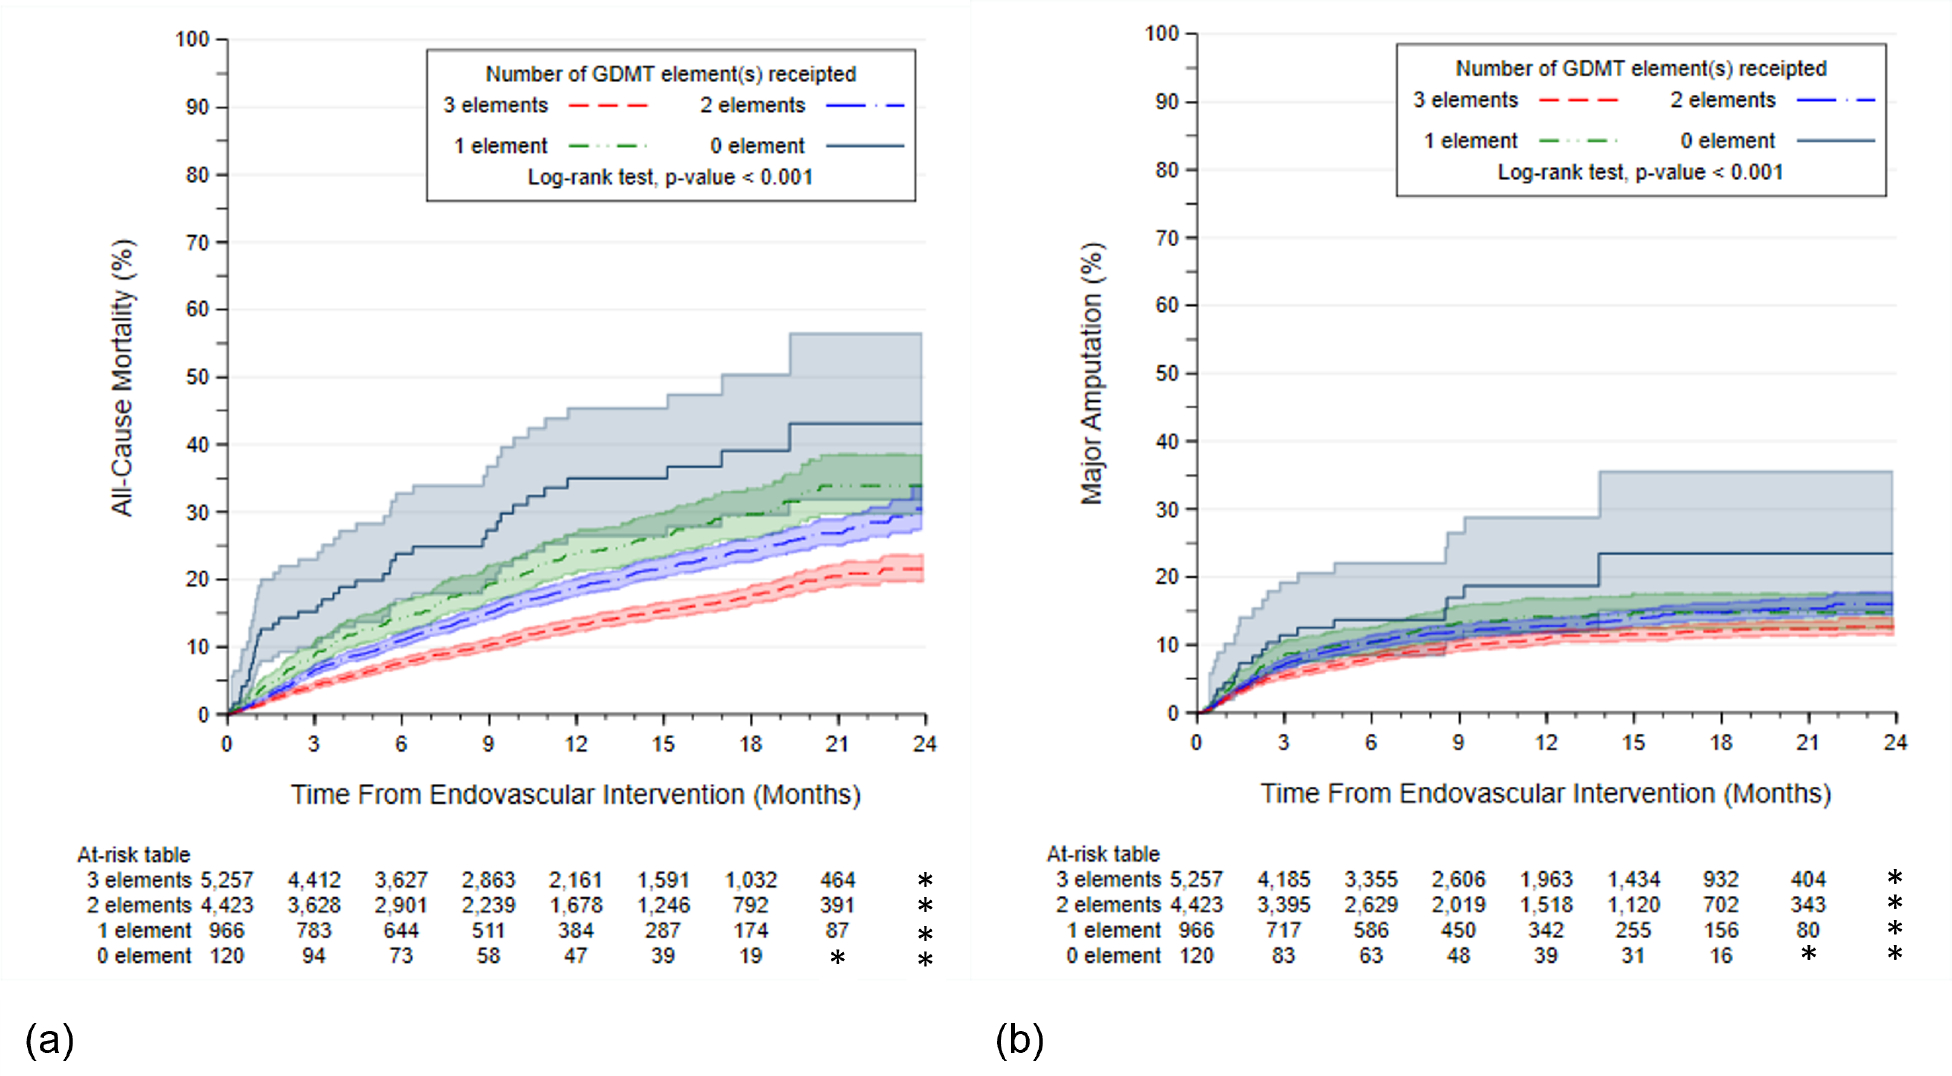
Kaplan Meier Curves by Receipt of 0, 1, 2, or 3 elements of GDMT (a) All-Cause Mortality and (b) Major Amputation in the Propensity Matched Cohort (n=12,240). Abbreviations: GDMT, guideline directed medical therapy. Cells with counts <11 are denoted by *.
Next, the GDMT performance rates by site and providers ranged from 0% to 100 (Figure 4). As compared with the highest performing quartile (56.2–100%), site performance for GDMT in the lower quartiles were associated with higher risks of mortality (quartile 3, 47.2–56.2%, HR=1.18, 95% CI 0.99–1.40; quartile 2, 37.8–47.2%, HR=1.06, 95% CI 0.89–1.26; quartile 1, 0–37.8%, HR=1.48, 95% CI 1.22–1.79), with the lowest vs. highest quartile reaching statistical significance. A similar association was found for major amputation; as compared with the highest performing quartile (56.2–100%), site performance for GDMT in the lower quartiles were associated with higher risks of major amputation (quartile 3, 47.2–56.2%, HR=1.21, 95% CI 0.96–1.52; quartile 2, 37.8–47.2%, HR=1.17, 95% CI 0.93–1.47; quartile 1, 0–37.8%, HR=1.58, 95% CI 1.23–2.03), with the lowest vs. highest quartile reaching statistical significance.
Figure 4.
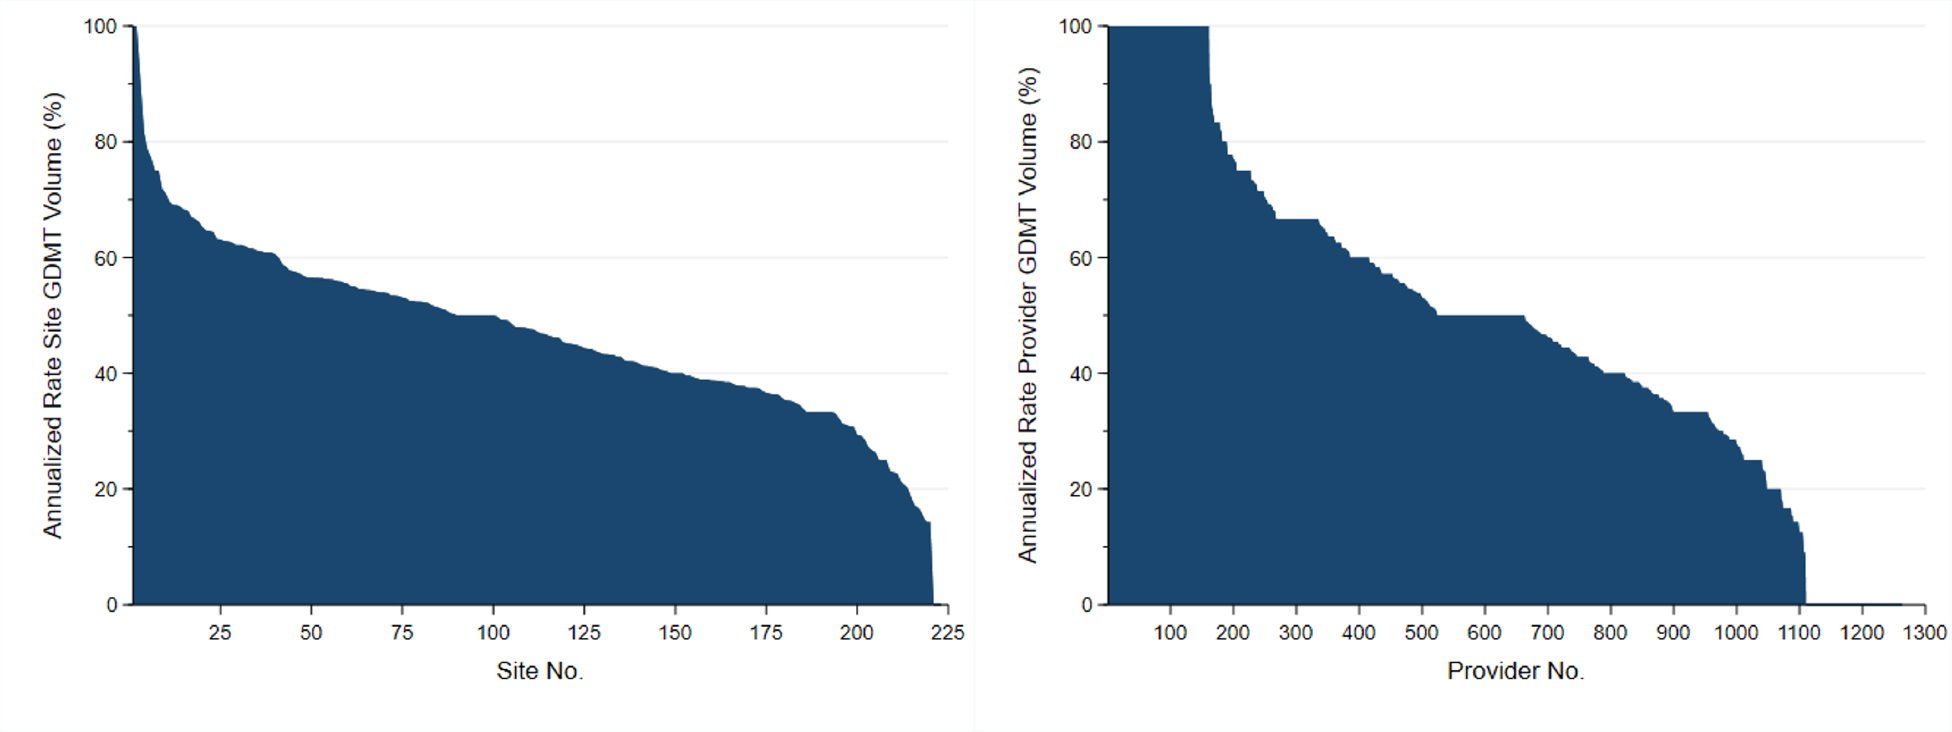
Variability in GDMT Rates by Sites and Providers in the Cohort Before Matching. Abbreviations: GDMT, guideline directed medical therapy.
As compared with the highest performing quartile (66.7–100%), provider performance for GDMT in the lower quartiles were associated with higher risks of mortality (quartile 3, 33.3–66.7%, HR=1.04, 95% CI 0.87–1.24; quartile 2, 33.3–50.0%, HR=1.24, 95% CI 1.05–1.46; quartile 1, 0–33.3%, HR=1.61, 95% CI 1.35–1.93), with the lowest two quartiles vs. the highest quartile reaching statistical significance.
A similar association was found for major amputation; as compared with the highest performing quartile (66.7–100%), provider performance for GDMT in the lower quartiles were associated with higher risks of mortality (quartile 3, 33.3–66.7%, HR=1.01, 95% CI 0.80–1.27; quartile 2, 33.3–50.0%, HR=1.33, 95% CI 1.07–1.64; quartile 1, 0–33.3%, HR=1.67, 95% CI 1.32–2.12), with the lowest two quartiles vs. the highest quartile reaching statistical significance.
DISCUSSION
In a large national quality registry, half of the patients who underwent PVI for PAD did not receive maximized GDMT for cardiovascular risk management, rates that are comparable (31.7–47.4%) with observations in prior cohorts.(9,10,12) Not being on GDMT was associated with an almost 40% increased risk of two-year mortality, and an almost 20% increased risk of major amputation following the receipt of the PVI, as compared with those receiving GDMT. Wide ranges in terms of GDMT performance across sites and providers were noted for GDMT discharge rates. There was a ‘dose response’ association based on number of GDMT medication use meaning that the fewer medications patients received, the higher their risk of mortality and major amputation.
We uniquely addressed medical management surrounding the interventional therapy at a national level and quantified the association of medical management with future outcomes. Prior work in this space included evaluation of outcomes at a single center level using electronic medical records,(11) or focused on males only, or evaluation of just one aspect of risk management, (e.g. statin intensification)(25) and not as part of the PAD interventional pathway. It was not until recently that the VQI registry was linked with Medicare claims data, allowing opportunities to examine the widespread impact of the quality of vascular specialty care for long-term prognostic outcomes in patients with PAD.
The rapid growth in volumes of PVIs(6,7) stands in stark contrast with the lingering care inertia and fragmented organization of PAD patients’ chronic disease management.(8–10) The market for PVIs in the United States is valued at around 7 billion dollars(26) with further growth expected due to the rise in chronic PAD prevalence.(27) In contrast, despite decades worth of work documenting the undertreatment of cardiovascular risk factors and fragmentation of PAD care, GDMT is not currently provided to even half of PAD patients who receive PVIs.(8,11) Patients with PAD have disproportionately worse outcomes as compared with those who suffer from cerebrovascular or coronary artery disease, and both of these entities have national GDMT quality achievement programs.(5) PAD currently has no national quality programs affecting reimbursement. The administration of PVIs, typically reserved for refractory PAD symptoms or to support limb-salving efforts for CLI,(28) have not seen any national quality regulatory efforts, including the establishment of endorsed appropriateness use criteria,(29) or public reporting quality metrics for medical therapy upon discharge, which may potentially explain the widely observed variability in adoption of GDMT across practices and providers.(30) Designing and testing these quality improvement metrics and reinforcement structures are necessary to generate evidence on interventions that may be able to improve these rates across health systems and providers. As prior evidence of such successful interventions have demonstrated, these have to be designed in a multifactorial way with elements including case management, audit and feedback with incentives, decision support tools, and educational materials.(31)
Admissions for PVIs are not a good value, from a societal, health system, and patient perspective, if they are not paired with maximized GDMT. It is estimated that the median cost for an admission with a PVI is $79,888.(32) If a patient is discharged without secondary prevention medications, our results indicate that there may be a close to 40% increased risk of death, and a 20% increased risk of a major amputation in the next two years following that procedure. The increased risk associated with lack of GDMT may potentially be substantial, not even taking into account adding novel anticoagulant or lipid lowering therapies that have been approved for PAD.(33,34) In addition, the population under study had a current smoking rate of 26% and no quality metrics were available on addressing this risk factor and its association with prognostic outcomes following PVI. As smoking increases the risk of adverse outcomes following PVI,(35) and smoking continuous to be a chronic risk factor for those managing PAD, additional efforts are also needed to address this modifiable risk.(36) Collectively, the current context of undertreatment, rising volume of costly technical care, and the availability of generic GDMT medications requires a change in policy that ensures that PVIs are a good investment and return in value. As GDMT rates were highly variable across centers and providers, it is suggesting that performance can be improved, and potentially higher value care can be delivered.
To realize such value-based PAD care, a real paradigm shift is needed, analogous to the policy shifts and quality reporting pathways that have been successfully created for coronary and cerebrovascular artery disease.(29,30) We need to look beyond the lower-extremity procedural intervention, and realize integrated vascular care with case management strategies that can provide holistic, high-quality evidence-based care to successfully address PAD patients’ multitude of risk factors.(37) Shifting to novel models of PAD care go hand in hand with much needed public reporting strategies on PAD quality of care metrics, and defining benchmarks for quality PAD care that may impact reimbursement. One such metric that may have an immediate and widespread impact on lives and limbs is the requirement of discharging patients on maximal GDMT following the receipt of PVI.
Limitations
Our work has the following limitations. First, we limited our quality metrics to three medications only, and the potential impact for gains realized may be even larger if extended to metrics like smoking cessation, or trials of exercise therapy, or novel anticoagulants or alternative lipid lowering therapies, including PCSK-9 Inhibitors and Ezetimibe.(33,34) Important to keep in mind also, is that the current Class I evidence for GDMT medications may require further updating given power concerns, heterogeneous populations, and unknowns about specific regimens. (28,38) Next, while ACE/ARBs are amongst the most commonly used antihypertensives that have been specifically evaluated in vascular patients,(3,4) patients on other antihypertensives or with antihypertensive use beyond discharge were not captured through the registry. Future iterations of the VQI registry would need to expand the antihypertensive medication data-element definitions to update these numbers in the future. Another limitation is the potential for unmeasured residual confounding due to the observational nature of our study, and the potential for missing data and underreporting. Even though we used propensity methods to balance differences between the comparators, unmeasured variables, such as social determinants of health, not included in the propensity weights, could have further contributed to confounding. The lack of adjudicated cause-specific mortality data, unknown information about the duration of exposure to the GDMT, and reliance on all-cause mortality may have diluted effects associated with GDMT. Cause-specific mortality in cardiovascular revascularization populations is often preferred, and in addition, establishing underlying cause of death vs. terminal condition is challenging in Medicare populations due to the multiple comorbid conditions they present with.(39) In addition, while older age is one of the risk factors for PAD, there are groups of patients with PAD that are younger, with a more vulnerable socio-economic risk profile as compared with the Medicare population we studied, and as such, our risk estimates may not extend to the entire spectrum of PAD. Finally, subscribing centers to the VQI registry may represent centers that already provide higher quality care as compared with non-subscribing centers, and as such, our estimates may be an underestimation of the true gap and magnitude of the effect. Related to this concern, may be the possibility that GDMT care is a marker for overall higher quality of care that may help explain our findings.
CONCLUSIONS
Half of the patients receiving PVI do not receive optimal GDMT and face an almost 40% increased risk of mortality, and an almost 20% increased risk of major amputation in the two years following their procedure. GDMT rates were highly variable across sites and providers, suggesting that they are modifiable, and performance can be improved. Offering PVIs without optimal GDMT is a low value proposition for the patient, their families, health systems, and society at large. Urgent action is needed to ensure the delivery of high-value PAD care as part of the interventional pathway.
Supplementary Material
CLINICAL PERSPECTIVES.
WHAT IS KNOWN?
There is lack of evidence-based guideline-directed medical therapy (GDMT) following peripheral vascular interventions (PVIs) in patients with peripheral artery disease (PAD), which could leave them at increased risk of death and amputation.
WHAT IS NEW?
GDMT around PVI discharge, a critical evaluation point for PAD risk management, was studied in the national, Medicare-linked Vascular Quality Initiative. In 12,240 patients undergoing PVI, almost half of the patients in a receiving a PVI were not on GDMT at discharge, which left them at risk of increased subsequent mortality and amputation.
WHAT IS NEXT?
National quality and reporting systems should be developed and tested to improve GDMT rates in patients with PAD, as part of the PVI pathway.
Acknowledgments
The VISION registry was supported by an FDA grant (U01FD006936).
Dr. Smolderen reports unrestricted research grants from Cardiva Medical Inc., Cook Medical, Inc., Merck & Co., Inc., Shockwave Medical Inc., and Janssen Pharmaceutical Companies of Johnson&Johnson. She is a consultant for Optum Labs, Inc., and Abbott Laboratories.
Dr. Mena-Hurtado reports grant funding from Shockwave Medical, Inc. and is a consultant for Abbott Laboratories, Cook Medical, Inc., and Optum Labs, Inc.
Dr. Mao is supported by a K01-award by the NHLBI K01HL159315–01.
Dr. Goodney is supported by research grants from the American Heart Association (AHA SRFN #18SFRN33900147 and an FDA grant (U01FD006936).
ABBREVIATIONS AND ACRONYMS
- ACE
Angiotensin-Converting Enzyme
- ARB
Angiotensin Receptor Blocker
- CI
Confidence Interval
- CLI
Critical Limb Ischemia
- GDMT
Guideline Directed Medical Therapy
- HR
Hazard Ratio
- PAD
Peripheral Artery Disease
- PVI
Peripheral Vascular Intervention
- VISION
Vascular Implant Surveillance and Interventional Outcomes Network
- VQI
Vascular Quality Initiative
Footnotes
The other authors have no disclosures.
Publisher's Disclaimer: This is a PDF file of an unedited manuscript that has been accepted for publication. As a service to our customers we are providing this early version of the manuscript. The manuscript will undergo copyediting, typesetting, and review of the resulting proof before it is published in its final form. Please note that during the production process errors may be discovered which could affect the content, and all legal disclaimers that apply to the journal pertain.
REFERENCES
- 1.Virani SS, Alonso A, Aparicio HJ et al. Heart Disease and Stroke Statistics-2021 Update: A Report From the American Heart Association. Circulation 2021;143:e254–e743. [DOI] [PubMed] [Google Scholar]
- 2.Gerhard-Herman MD, Gornik HL, Barrett C et al. 2016 AHA/ACC Guideline on the Management of Patients With Lower Extremity Peripheral Artery Disease: A Report of the American College of Cardiology/American Heart Association Task Force on Clinical Practice Guidelines. Circulation 2016. [DOI] [PMC free article] [PubMed] [Google Scholar]
- 3.Heart Outcomes Prevention Evaluation Study I, Yusuf S, Sleight P et al. Effects of an angiotensin-converting-enzyme inhibitor, ramipril, on cardiovascular events in high-risk patients. N Engl J Med 2000;342:145–53. [DOI] [PubMed] [Google Scholar]
- 4.Buchner N, Banas B, Kramer BK. Telmisartan, ramipril, or both in patients at high risk of vascular events. N Engl J Med 2008;359:426. [DOI] [PubMed] [Google Scholar]
- 5.Steg PG, Bhatt DL, Wilson PW et al. One-year cardiovascular event rates in outpatients with atherothrombosis. JAMA 2007;297:1197–206. [DOI] [PubMed] [Google Scholar]
- 6.Goodney PP, Tarulli M, Faerber AE, Schanzer A, Zwolak RM. Fifteen-year trends in lower limb amputation, revascularization, and preventive measures among medicare patients. JAMA Surg 2015;150:84–6. [DOI] [PMC free article] [PubMed] [Google Scholar]
- 7.O’Brien-Irr MS, Harris LM, Dosluoglu HH, Dryjski ML. Procedural trends in the treatment of peripheral arterial disease by insurer status in New York State. J Am Coll Surg 2012;215:311–321 e1. [DOI] [PubMed] [Google Scholar]
- 8.Saxon JT, Safley DM, Mena-Hurtado C et al. Adherence to Guideline-Recommended Therapy-Including Supervised Exercise Therapy Referral-Across Peripheral Artery Disease Specialty Clinics: Insights From the International PORTRAIT Registry. Journal of the American Heart Association 2020;9:e012541. [DOI] [PMC free article] [PubMed] [Google Scholar]
- 9.Llanos-Chea F, Jelani QU, Trejo-Paredes C et al. Lack of Guideline-Directed Medical Therapy in Patients Undergoing Endovascular Procedures for Critical Limb Ischemia. J Am Coll Cardiol 2021;77:1374–1375. [DOI] [PubMed] [Google Scholar]
- 10.Jelani QU, Llanos-Chea F, Bogra P et al. Guideline-Directed Medical Therapy in Patients with Chronic Kidney Disease Undergoing Peripheral Vascular Intervention. Am J Nephrol 2021:1–9. [DOI] [PubMed] [Google Scholar]
- 11.Armstrong EJ, Chen DC, Westin GG et al. Adherence to guideline-recommended therapy is associated with decreased major adverse cardiovascular events and major adverse limb events among patients with peripheral arterial disease. Journal of the American Heart Association 2014;3:e000697. [DOI] [PMC free article] [PubMed] [Google Scholar]
- 12.Altin SE, Castro-Dominguez YS, Kennedy KF et al. Predictors of Underutilization of Medical Therapy in Patients Undergoing Endovascular Revascularization for Peripheral Artery Disease. JACC Cardiovasc Interv 2020;13:2911–2918. [DOI] [PubMed] [Google Scholar]
- 13.Mao J, Etkin CD, Lewallen DG, Sedrakyan A. Creation and Validation of Linkage Between Orthopedic Registry and Administrative Data Using Indirect Identifiers. J Arthroplasty 2019;34:1076–1081 e0. [DOI] [PubMed] [Google Scholar]
- 14.Mao J, Moore KO, Columbo JA, Mehta KS, Goodney PP, Sedrakyan A. Validation of an indirect linkage algorithm to combine registry data with Medicare claims. J Vasc Surg 2022. [DOI] [PMC free article] [PubMed] [Google Scholar]
- 15.Columbo JA, Kang R, Trooboff SW et al. Validating Publicly Available Crosswalks for Translating ICD-9 to ICD-10 Diagnosis Codes for Cardiovascular Outcomes Research. Circ Cardiovasc Qual Outcomes 2018;11:e004782. [DOI] [PMC free article] [PubMed] [Google Scholar]
- 16.Cohen J Statistical power analysis for the behavioral sciences. Hillsdale, NJ: Erlbaum, 1988. [Google Scholar]
- 17.Austin PC. Some methods of propensity-score matching had superior performance to others: results of an empirical investigation and Monte Carlo simulations. Biom J 2009;51:171–84. [DOI] [PubMed] [Google Scholar]
- 18.Austin PC. Optimal caliper widths for propensity-score matching when estimating differences in means and differences in proportions in observational studies. Pharm Stat 2011;10:150–61. [DOI] [PMC free article] [PubMed] [Google Scholar]
- 19.Elze MC, Gregson J, Baber U et al. Comparison of Propensity Score Methods and Covariate Adjustment: Evaluation in 4 Cardiovascular Studies. J Am Coll Cardiol 2017;69:345–357. [DOI] [PubMed] [Google Scholar]
- 20.Deb S, Austin PC, Tu JV et al. A Review of Propensity-Score Methods and Their Use in Cardiovascular Research. Can J Cardiol 2016;32:259–65. [DOI] [PubMed] [Google Scholar]
- 21.Austin PC. The relative ability of different propensity score methods to balance measured covariates between treated and untreated subjects in observational studies. Med Decis Making 2009;29:661–77. [DOI] [PubMed] [Google Scholar]
- 22.Leyrat C, Seaman SR, White IR et al. Propensity score analysis with partially observed covariates: How should multiple imputation be used? Stat Methods Med Res 2019;28:3–19. [DOI] [PMC free article] [PubMed] [Google Scholar]
- 23.Mitra R, Reiter JP. A comparison of two methods of estimating propensity scores after multiple imputation. Stat Methods Med Res 2016;25:188–204. [DOI] [PubMed] [Google Scholar]
- 24.Therneau TM. Coxme: Mixed Effects Cox Models. 2020.
- 25.Arya S, Khakharia A, Binney ZO et al. Association of Statin Dose With Amputation and Survival in Patients With Peripheral Artery Disease. Circulation 2018;137:1435–1446. [DOI] [PMC free article] [PubMed] [Google Scholar]
- 26.Ugalmugle S, Swain R. Peripheral Interventions Market Size By Product (Catheters, Sheath, Stents {Bare-metal Stents, Drug-eluting Stents}, Guide Wires, Atherectomy Devices, Embolic Devices, Thrombectomy Devices, IVC Filters), By Application (Peripheral Artery Disease, Venous Thromboembolism), By End-use (Hospitals, Catheterization Laboratories, Ambulatory Surgical Centres), Industry Analysis Report, Regional Outlook, Application Potential, Price Trends, Competitive Market Share & Forecast, 2021 – 2027. 2021.
- 27.Song P, Rudan D, Zhu Y et al. Global, regional, and national prevalence and risk factors for peripheral artery disease in 2015: an updated systematic review and analysis. Lancet Glob Health 2019;7:e1020–e1030. [DOI] [PubMed] [Google Scholar]
- 28.Gerhard-Herman MD, Gornik HL, Barrett C et al. 2016 AHA/ACC Guideline on the Management of Patients With Lower Extremity Peripheral Artery Disease: A Report of the American College of Cardiology/American Heart Association Task Force on Clinical Practice Guidelines. Circulation 2017;135:e726–e779. [DOI] [PMC free article] [PubMed] [Google Scholar]
- 29.Patel MR, Dehmer GJ, Hirshfeld JW et al. ACCF/SCAI/STS/AATS/AHA/ASNC 2009 Appropriateness Criteria for Coronary Revascularization: a report by the American College of Cardiology Foundation Appropriateness Criteria Task Force, Society for Cardiovascular Angiography and Interventions, Society of Thoracic Surgeons, American Association for Thoracic Surgery, American Heart Association, and the American Society of Nuclear Cardiology Endorsed by the American Society of Echocardiography, the Heart Failure Society of America, and the Society of Cardiovascular Computed Tomography. J Am Coll Cardiol 2009;53:530–53. [DOI] [PubMed] [Google Scholar]
- 30.Endorsement Summary: Cardiovascular Measures. National Quality Forum, 2012. [Google Scholar]
- 31.Machline-Carrion MJ, Soares RM, Damiani LP et al. Effect of a Multifaceted Quality Improvement Intervention on the Prescription of Evidence-Based Treatment in Patients at High Cardiovascular Risk in Brazil: The BRIDGE Cardiovascular Prevention Cluster Randomized Clinical Trial. JAMA Cardiol 2019;4:408–417. [DOI] [PMC free article] [PubMed] [Google Scholar]
- 32.Harris K, Mena-hurtado C, Burg M, Smolderen K. Depression and Anxiety Disorders in Peripheral Artery Disease Admissions: Associations With Post-Revascularization Amputation and Resource Utilization. American Heart Association - Quality of Cardiovascular Care and Outcomes Research. Virtual, 2021. [Google Scholar]
- 33.Anand SS, Bosch J, Eikelboom JW et al. Rivaroxaban with or without aspirin in patients with stable peripheral or carotid artery disease: an international, randomised, double-blind, placebo-controlled trial. Lancet 2018;391:219–229. [DOI] [PubMed] [Google Scholar]
- 34.Bonaca MP, Nault P, Giugliano RP et al. Low-Density Lipoprotein Cholesterol Lowering With Evolocumab and Outcomes in Patients With Peripheral Artery Disease: Insights From the FOURIER Trial (Further Cardiovascular Outcomes Research With PCSK9 Inhibition in Subjects With Elevated Risk). Circulation 2018;137:338–350. [DOI] [PubMed] [Google Scholar]
- 35.Reitz KM, Althouse AD, Meyer J et al. Association of Smoking With Postprocedural Complications Following Open and Endovascular Interventions for Intermittent Claudication. JAMA Cardiol 2022;7:45–54. [DOI] [PMC free article] [PubMed] [Google Scholar]
- 36.Patel KK, Jones PG, Ellerbeck EF et al. Underutilization of Evidence-Based Smoking Cessation Support Strategies Despite High Smoking Addiction Burden in Peripheral Artery Disease Specialty Care: Insights from the International PORTRAIT Registry. Journal of the American Heart Association 2018;7:e010076. [DOI] [PMC free article] [PubMed] [Google Scholar]
- 37.Kolte D, Parikh SA, Piazza G et al. Vascular Teams in Peripheral Vascular Disease. J Am Coll Cardiol 2019;73:2477–2486. [DOI] [PubMed] [Google Scholar]
- 38.Antithrombotic Trialists C Collaborative meta-analysis of randomised trials of antiplatelet therapy for prevention of death, myocardial infarction, and stroke in high risk patients. BMJ 2002;324:71–86. [DOI] [PMC free article] [PubMed] [Google Scholar]
- 39.Specifications Manual for National Hospital Quality Measures, version 2.0 Joint Commission on Accreditation of Healthcare Organizations. [Google Scholar]
Associated Data
This section collects any data citations, data availability statements, or supplementary materials included in this article.