

Abstract
Purpose
Integrin αv is a key regulator in the pathophysiology of hepatic fibrosis. In this study, we evaluated the potential utility of an integrin αvβ3 positron emission tomography (PET) radiotracer, 18F-labeled cyclic arginine-glycine-aspartic acid penta-peptide ([18F]F-FPP-RGD2), for detecting hepatic integrin αv and function in nonalcoholic steatohepatitis (NASH) model rats using integrin αv siRNA.
Methods
NASH model rats were produced by feeding a choline-deficient, low-methionine, high-fat diet for 8 weeks. PET/computerized tomography imaging and quantification of integrin αv protein, serum aspartate aminotransferase, and alanine aminotransferase were performed 1 week after single intravenous injection of integrin αv siRNA.
Results
Integrin αv siRNA (0.1 and 0.5 mg/kg) dose-dependently decreased hepatic integrin αv protein concentrations in control and NASH model rats. The hepatic mean standard uptake value of [18F]F-FPP-RGD2 was decreased dose-dependently by integrin αv siRNA. The mean standard uptake value was positively correlated with integrin αv protein levels in control and NASH model rats. Serum aspartate aminotransferase and alanine aminotransferase concentrations were also decreased by siRNA injection and correlated with liver integrin αv protein expression levels in NASH model rats.
Conclusion
This study suggests that [18F]F-FPP-RGD2 PET imaging is a promising radiotracer for monitoring hepatic integrin αv protein levels and hepatic function in NASH pathology.
Keywords: Nonalcoholic steatohepatitis (NASH), Arginine-glycine-aspartic (RGD), Positron emission tomography (PET), Small interfering RNA (siRNA), Integrin
Introduction
Nonalcoholic steatohepatitis (NASH) is a condition with chronic liver inflammation, which leads to the transformation of hepatic stellate cells (HSCs) to myofibroblasts. The pathology of NASH and the mechanism of how fibrosis progresses have been well documented [1]. Among these, the activation of HSCs is well known as a key event in hepatic fibrosis [2]. Activation of HSCs produces proteins, such as integrin, which play an important role in the process of transforming HSCs into fibrotic myofibroblasts.
Integrins are heterodimeric cell surface receptors, which comprise different 18 α subunits and 8 β subunits. These different pairs of integrins are closely related to the initiation, maintenance, and resolution of fibrosis [3–5]. Elevated integrin αvβ3 expression has been observed in activated HSC in hepatic cells [6] and in the NASH model [7–9]. These findings suggest that integrin αvβ3 plays a critical role in the development and progression of NASH pathology. Nonclinical and clinical reports have shown the antifibrotic effect of integrin-targeting treatments. ProAgio induces apoptosis of αHSCs in the fibrotic liver by targeting integrin αvβ3 [6, 10]. Integrin αvβ6 has also been reported to be a key player in the progression of fibrosis. In patients with liver fibrosis, integrin αvβ6 mRNA expression levels are increased and correlate with the stage of fibrosis [11]. These reports suggest that integrin αv plays a pivotal role in the regulation of the fibrotic process. Additionally, therapeutic targeting of integrins may be a promising avenue for the treatment of patients with a broad range of fibrotic diseases, such as NASH.
We have previously evaluated integrin positron emission tomography (PET) imaging using 18F-labeled cyclic arginine-glycine-aspartic acid penta-peptide ([18F]F-FPP-RGD2), integrin αvβ3 PET probe, in liver fibrosis animal models [12, 13]. The hepatic [18F]F-FPP-RGD2 uptake value was increased before the onset of fibrosis, and well correlated with hepatic integrin αv and β3 protein expression and pathological fibrosis score in diet-induced NASH model mice [12]. Moreover, both hepatic mean standard uptake value (SUV) and volume of distribution (VT), quantified by compartment analysis, were higher than that of control rats and positively correlated with hepatic integrin αv and β3 protein levels in diet-induced NASH model rats, severer than the pathological condition of mice [13]. These studies provide a potential of [18F]F-FPP-RGD2 PET imaging for noninvasive evaluation of integrin αv protein and pathophysiology in NASH liver.
In this study, we investigated the potential utility of integrin αvβ3 PET radiotracer, [18F]F-FPP-RGD2, for the detection of hepatic integrin αv and function in NASH model rats using integrin αv siRNA. We performed suppression of hepatic integrin αv protein using intravenous liquid nanoparticle (LNP) formulation including siRNA, which targets liver-specific integrin αv, developed by Shionogi & Co., Ltd (Osaka, Japan).
Materials and Methods
Animals
Twenty-three male RccHan®: WIST rats (Wistar Hannover Rcc rats, 7 weeks old) were purchased from Japan SLC, Inc. (Shizuoka, Japan). The rats were housed in a light- and temperature-controlled room (lights on at 07:00 h and off at 19:00 h). They were allowed free access to tap water and fed a normal diet (CE-2; CLEA, Tokyo, Japan) or a choline-deficient, low-methionine, high-fat diet (CDHFD; no choline, 45% fat, 0.1% methionine, and 1% cholesterol) prepared by Oriental Yeast Co., Ltd. (Tokyo, Japan) for 8 weeks. Eight weeks after feeding, control or NASH model rats received a single intravenously administration of LNP formulation including siRNA at a dosage of 0 (phosphate-buffered saline; PBS), 0.1, or 0.5 mg/kg. The experiments were approved by the Institutional Animal Care and Use Committee of Osaka University Graduate School of Medicine (approval number: 29–030-002, 21 July 2017).
Radiochemistry
[18F]F-FPP-RGD2 was synthesized as previously reported [14] to a mean molar activity of 166.5 ± 60.5 GBq/μmol. The RGD dimeric peptide PEG3-c[RGDyK]2 was obtained from Peptides International (Louisville, KY, USA). The radiochemical purity of all radiosynthesis, which was analyzed by high-performance liquid chromatography on a COSMOSIL 5C18 MS-II column (Nacalai Tesque, Inc. Kyoto, Japan), was higher than 99%.
PET/Computed Tomography Scans
All dynamic PET/computed tomography (CT) scans were performed by a Triumph LabPET-12 PET/CT instrument (TriFoil Imaging, Chatsworth, CA, USA), which was designed for small animals in the laboratory, and a PET camera with an intrinsic axial resolution of 1.38 mm (full width at half maximum) [15]. The injection tube was catheterized into the tail vein for PET probe injection under 2% isoflurane anesthesia, and the rats were placed on a heated pad on the scanner bed. All PET/CT scans of the control or NASH model group were conducted 1 week after the administration of PBS or siRNA, respectively. The scans were started immediately after intravenous [18F]F-FPP-RGD2 (8.4 ± 1.0 MBq) administration at 0.5 mL/30 s by a syringe pump (Legato 210; KD Scientific, Holliston, MA, USA) via a cannula inserted into the tail vein. PET scans were conducted with a 90-min dynamic scan mode, and then a CT scan was conducted to acquire anatomical information and correct the PET images for attenuation.
PET Image Analysis
CT images were reconstructed using the filtered back-projection method (512 slices). PET images were reconstructed into 24 frames of increasing length (6 × 10, 4 × 60, 11 × 300, and 3 × 600 s) using the three-dimensional maximum-likelihood expectation–maximization algorithm and CT-based attenuation correction. To obtain time-activity curves (TACs), volumes of interest for the liver (1280 mm3) were manually defined for each rat on their CT images using PMOD PET data analysis software (v3.905; PMOD Technologies Ltd., Zurich, Switzerland). TACs for the liver were constructed by normalizing decay-corrected measurements and are expressed as mean standardized uptake values (SUVs), where SUV = radioactivity concentration (kBq/cm3) × body mass (g)/amount of radioactivity injected (MBq)/1000.
Plasma AST and ALT Analysis
After PET/CT scanning, rats were euthanized by exsanguination under isoflurane anesthesia. Plasma samples were collected and assayed for AST and ALT concentrations by enzymatic methods using commercially available kits (Sekisui Medical, Tokyo, Japan) and a Hitachi 7170 autoanalyzer (Hitachi, Tokyo, Japan) in accordance with the manufacturer’s instructions.
Hepatic Integrin αv Protein Analysis
Hepatic integrin αv subunit protein levels were determined using a JESS Automated Western Blotting system (Protein Simple, San Jose, CA, USA). Liver tissue was homogenized in RIPA Lysis and Extraction Buffer (Thermo Fisher Scientific K.K., Tokyo, Japan) which contained Halt Protease Inhibitor Cocktail (Thermo Fisher Scientific K.K., Tokyo, Japan), and 0.2 mg/mL protein in lysates was separated by a 12–230 kDa Separation Module (Protein Simple). Hepatic integrin αv protein was detected using a mouse monoclonal antibody against CD51 (integrin αv) (Cat. No. 611013; BD Biosciences, San Jose, CA, USA) and the Anti-Mouse Detection Module (Protein Simple) in accordance with the manufacturer’s instructions.
Statical Analysis
All statistical analyses were performed using GraphPad Prism statistical software (version 6; GraphPad Software, San Diego, CA, USA). All results are expressed as the mean ± standard deviation (SD). Statistical comparisons between the three groups were made using Dunnett’s test. Spearman’s rank correlation was used for correlation analysis between two variables (i.e., integrin αv protein expression, SUV, AST, and ALT), and Spearman’s rank correlation coefficient was represented rs. Statistical significance (two-tailed) was set at P < 0.05.
Results
Effects of siRNA on the Body, Liver, and Liver/Body Weight Ratio
Liver weight and the liver/body weight ratio in the NASH model group were significantly higher than those in the control group (both P < 0.01, Table 1). In contrast, there were no significant differences in body, liver, and liver/body weight ratio within the control or NASH model groups, which suggested no physiological effect of siRNA injection (Table 1).
Table 1.
Body weight, liver weight, and liver/body weight ratio
| Group | Dose of siRNA (mg/kg) |
Parameters | ||||||||
|---|---|---|---|---|---|---|---|---|---|---|
| Body weight (g) | Liver weight (g) | Liver/body weight ratio | ||||||||
| Control | PBS | 255.7 | ± | 15.1 | 9.26 | ± | 1.4 | 0.036 | ± | 0.004 |
| 0.1 | 278.4 | ± | 37.7 | 9.94 | ± | 1.1 | 0.036 | ± | 0.001 | |
| 0.5 | 265.3 | ± | 28.8 | 9.27 | ± | 0.9 | 0.035 | ± | 0.002 | |
| NASH model | PBS | 235.0 | ± | 21.3 | 16.9 | ± | 2.5** | 0.071 | ± | 0.005** |
| 0.1 | 243.1 | ± | 28.4 | 17.2 | ± | 2.7** | 0.071 | ± | 0.008** | |
| 0.5 | 238.8 | ± | 26.1 | 18.9 | ± | 2.4** | 0.079 | ± | 0.003** | |
Values are expressed as mean ± SD (n = 3–5). **P < 0.01, compared with the respective control group
NASH nonalcoholic steatohepatitis, PBS phosphate-buffered saline, siRNA small interfering RNA
Effects of siRNA on Liver Integrin αv Protein Levels
The suppression effects of siRNA injection on integrin αv protein levels in the liver were examined. Liver integrin αv protein levels in the NASH model group were significantly higher than those in the control group (P < 0.01, Fig. 1). Moreover, liver integrin αv levels in the control and NASH model groups were significantly decreased by siRNA injection (0.1 and 0.5 mg/kg) compared with PBS injection rats (P < 0.01, Fig. 1).
Fig. 1.

Effects of siRNA on hepatic integrin αv protein expression. Hepatic integrin αv protein expression in control (a) and NASH model groups (b). Vertical axis values indicate integrin αv protein expression relative to mean integrin αv protein expression in control rats with PBS injection. *P < 0.05; **P < 0.01 compared with the PBS treatment group in control or NASH model rats. Values are expressed as mean ± SD (n = 3–5). PBS phosphate-buffered saline, siRNA small interfering RNA
Effects of siRNA on Liver [18F]F-FPP-RGD2 Uptake
[18F]F-FPP-RGD2 uptake in the liver in the control and NASH model groups was evaluated 1 week after the injection of PBS or siRNA (0.1 and 0.5 mg/kg). Figure 2a shows that the TACs of [18F]F-FPP-RGD2 in the NASH model groups were higher than those in the control groups, which decreased by siRNA injection. The mean standard uptake value between 60 and 90 min (SUV60-90 min) in the control group was decreased by siRNA dose injection (0.5 mg/kg; P < 0.05, Fig. 2c). Moreover, the mean SUV60-90 min in NASH model rats was significantly lower than that in PBS-treated rats in the control group (0.1 mg/kg, P < 0.05; 0.5 mg/kg, P < 0.01, Fig. 2d). Figure 3 shows representative color-coded SUV60-90 min images of [18F]F-FPP-RGD2 PET in the control and NASH model groups 1 week after the injection of PBS or siRNA (0.1 and 0.5 mg/kg).
Fig. 2.

Time-activity curves of the liver and mean SUV60-90 min. Hepatic time-activity curves of [18F]F-FPP-RGD2 in the control group (a) and NASH model group (b) after siRNA (0, 0.1, and 0.5 mg/kg intravenously) administration. Hepatic mean SUV60-90 min in the control group (c) and NASH model group (d). *P < 0.05; **P < 0.01 compared with the PBS treatment group in control or NASH model rats. Values are expressed as mean ± SD (n = 3–5). PBS phosphate-buffered saline, siRNA small interfering RNA
Fig. 3.

Representative color-coded PET/CT images. Representative PET/CT fusion images at 60–90 min after [18F]F-FPP-RGD2 administration. PBS phosphate-buffered saline, siRNA small interfering RNA
Correlation Analysis Between Integrin αv Protein Levels and the SUV of [18F]F-FPP-RGD2 in the Liver
We determined whether liver integrin αv protein levels are correlated with the SUV of [18F]F-FPP-RGD2 in the liver after the injection of PBS or siRNA (0.1 and 0.5 mg/kg). We performed a correlation analysis between liver integrin αv protein levels and the mean SUV60-90 min of [18F]F-FPP-RGD2 in the liver in the same rats. Liver integrin αv protein levels were strongly correlated with the mean SUV60-90 min of [18F]F-FPP-RGD2 in the liver in the control and NASH model groups with or without siRNA injection (rs = 0.901, P < 0.01, Fig. 4).
Fig. 4.
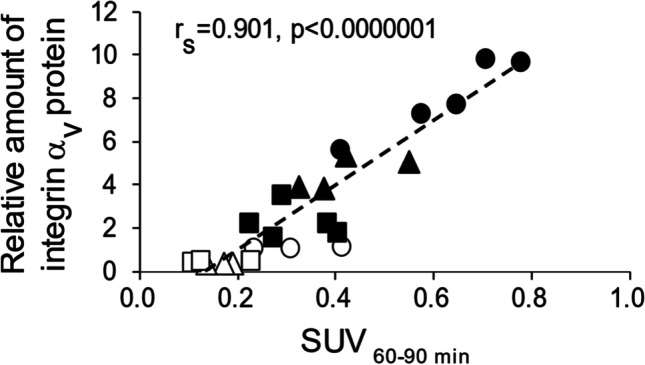
Correlation analysis of hepatic integrin αv protein expression levels and mean SUV60-90 min. Correlation between hepatic integrin αv protein expression levels and the mean SUV60-90 min in the control and NASH model groups after siRNA injection. Open circles, control rats with PBS; open triangles, control rats with 0.1 mg/kg siRNA; open squares, control rats with 0.5 mg/kg siRNA; filled circles, NASH model rats with PBS; filled triangles, NASH model rats with 0.1 mg/kg siRNA; filled squares, NASH model rats with 0.5 mg/kg siRNA. PBS phosphate-buffered saline, siRNA small interfering RNA
Correlation Analysis Between Integrin αv Protein Levels and Serum AST and ALT Concentrations
We also conducted a correlation analysis between liver integrin αv protein levels and serum AST and ALT concentrations. Hepatic integrin αv protein expression levels were strongly correlated with serum AST (rs = 0.875, P < 0.01) and ALT (rs = 0.862, P < 0.01) concentrations in the control and NASH model groups with or without siRNA injection (Fig. 5).
Fig. 5.
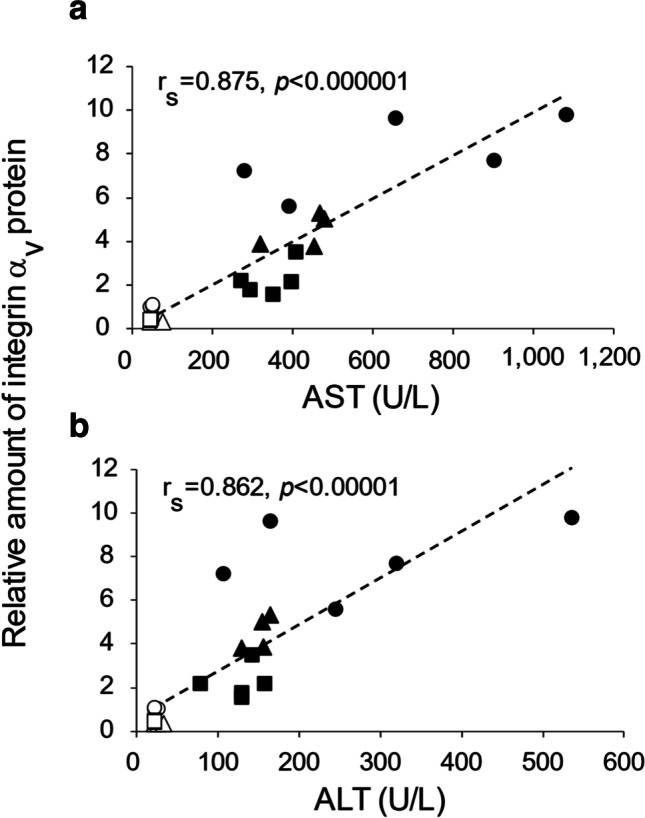
Correlation analysis of hepatic integrin αv protein expression levels and AST or ALT concentrations. Correlation between hepatic integrin αv protein expression levels and AST (a) or ALT (b) in the control group and NASH model group after siRNA injection. Open circles, control rats with PBS; open triangles, control rats with 0.1 mg/kg siRNA; open squares, control rats with 0.5 mg/kg siRNA; filled circles, NASH model rats with PBS; filled triangles, NASH model rats with 0.1 mg/kg siRNA; filled squares, NASH model rats with 0.5 mg/kg siRNA. PBS phosphate-buffered saline, siRNA small interfering RNA, AST aspartate aminotransferase, ALT alanine aminotransferase
Correlation Analysis Between the SUV of [18F]F-FPP-RGD2 and Serum AST and ALT Concentrations
The SUV of [18F]F-FPP-RGD2 were also correlated with serum AST (rs = 0.680, P < 0.01) and ALT (rs = 0.741, P < 0.01) concentrations in the control and NASH model groups with or without siRNA injection (Fig. 6).
Fig. 6.
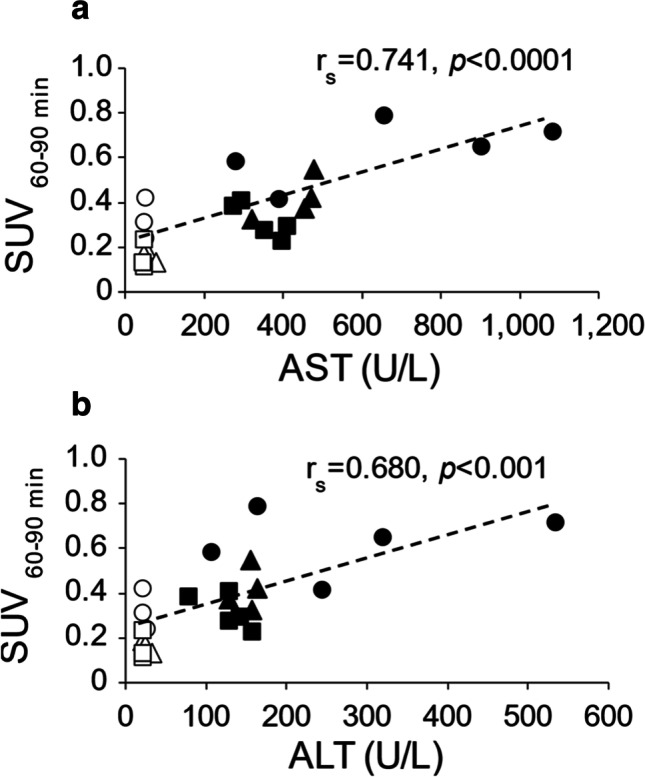
Correlation analysis of hepatic mean SUV60-90 min and AST or ALT concentrations. Correlation between hepatic mean SUV60-90 min and AST (a) or ALT (b) in the control group and NASH model group after siRNA injection. Open circles, control rats with PBS; open triangles, control rats with 0.1 mg/kg siRNA; open squares, control rats with 0.5 mg/kg siRNA; filled circles, NASH model rats with PBS; filled triangles, NASH model rats with 0.1 mg/kg siRNA; filled squares, NASH model rats with 0.5 mg/kg siRNA. PBS phosphate-buffered saline, siRNA small interfering RNA, AST aspartate aminotransferase, ALT alanine aminotransferase
Discussion
In this study, we investigated whether [18F]F-FPP-RGD2, integrin αvβ3 PET imaging can assess the suppression of hepatic integrin αv protein by siRNA injection in NASH model rats. PET imaging with [18F]F-FPP-RGD2, integrin αvβ3 PET radiotracer could detect a decrease in integrin αv protein expression levels induced by siRNA in the control and NASH model groups. Additionally, there was a strong correlation between the hepatic PET quantitative value (mean SUV60-90 min) and hepatic integrin αv protein levels in the control and NASH model groups. These findings suggested that [18F]F-FPP-RGD2 PET imaging may be a noninvasive method for monitoring the levels of integrin αv protein in the liver.
The diet-induced NASH animal model is suitable for reflecting the clinically relevant onset and progression of hepatic fibrosis [16, 17]. In our previous study, we observed the progression of NASH pathology by histological and biochemical analyses in CDHFD-induced NASH model rats [13]. We found that hepatic integrin αv protein expression levels increased with the severity of the pathological score. These previous findings are similar to other previous studies that were performed in similar animal models [12, 16, 18]. Furthermore, we validated that [18F]F-FPP-RGD2 PET uptake correlated well with pathological change of hepatic fibrosis and expression of integrin αv protein [12, 13]. In the present study, we performed PET imaging in the NASH model induced by feeding CDHFD for 8 weeks. The NASH pathological stage of rats fed CDHFD for 8 weeks is similar to that in rats fed for 9–10 weeks in our previous study [13]. Kleiner et al. [19] used the NASH model with CDHFD feeding for 8 weeks and found borderline NASH and frank NASH according to the nonalcoholic fatty liver disease activity score. In the present study, integrin αv protein expression levels were higher in the NASH model group than in the control group, with an eightfold difference (Fig. 1). We performed a single intravenous injection of integrin αv siRNA to rats in these pathological stages. Our compound (including siRNA) was designed to elicit the maximum suppression effect a week after administration in rats. Therefore, integrin αv protein expression levels were evaluated 1 week after administration of the compound. As shown in Fig. 1, integrin αv protein levels in siRNA-treated rats (0.1 or 0.5 mg/kg) were significantly lower (< 50%) than those in PBS-treated rats in the control and NASH model groups. This finding indicated that the increased hepatic integrin αv in NASH pathology can be adequately suppressed by siRNA injection.
A ninety-minute dynamic PET scan was conducted to determine the hepatic TACs of [18F]F-FPP-RGD2 in the control and NASH model groups with integrin αv siRNA injection. In both groups, the hepatic uptake of [18F]F-FPP-RGD2 rapidly peaked within several minutes after PET probe administration and gradually decreased until the end of scanning at 90 min (Fig. 2a and b). This phenomenon was the same in both groups, regardless of the presence or absence of siRNA injection. Moreover, we found that the TACs in the NASH model group showed a higher overall trend than that in the control group (Fig. 2a and b). Subsequently, we evaluated the change in the mean SUV60-90 min by siRNA injection in both groups. The mean SUV60-90 min of rats with siRNA injection was significantly lower than that in PBS-treated rats in both groups (Fig. 2c and d), which was also visually obvious (Fig. 3). The decrease of SUV60-90 min in control rats by siRNA could be due to a decrease in basal expression of integrin αv. The reduction of basal levels had no effect on the physiological parameters (body and liver weight, AST, and ALT). To the best of our knowledge, no reports have shown that PET imaging can noninvasively and visually detect a suppression effect of integrin αv siRNA in the NASH animal model. In this study, we clearly showed that the [18F]F-FPP-RGD2 PET probe, which binds to integrin αvβ3, could detect the suppression of hepatic integrin αv expression by siRNA in NASH model rats.
Clinical studies have shown that integrins αvβ3 and αvβ6 are upregulated in the liver tissue of patients with NASH [6, 11], with integrin αvβ3 playing an important role in the development and progression of NASH pathology. Specifically, integrin αvβ3 is a key molecule in the transformation of hepatic stellate cells into myofibroblasts. Furthermore, several integrin inhibitors have been shown to reduce fibrosis in animal models. The integrin αvβ3 inhibitor ProAgio induces apoptosis of αHSC in the fibrotic liver [6, 10]. Additionally, the integrin αvβ1, αvβ3, and αvβ6 antagonist IDL-2965 shows strong antifibrotic effects in liver fibrosis animal models. Prophylactic treatment of IDL-2965 significantly reduced histopathological fibrosis score in CCl4-induced liver fibrosis mice. And therapeutic treatment of IDL-2965 significantly reduced liver α-SMA and collagen levels measured by immunohistochemistry, in diet-induced liver fibrosis mice. These effects are correlated with a decrease in relevant plasma biomarkers [20]. Unfortunately, none of the low-molecular-weight drugs targeting integrins have been launched into the market. Although the reason for this is unclear, our development candidate, LNP formulation including integrin αv siRNA, has at least two features that its predecessor does not. The first is that our drug candidate suppresses the production of integrin αv protein regardless of the type of β subunit, which is a feature that no other compound has. In this study, we confirmed that hepatic integrin αv protein expression levels were strongly correlated with serum AST and ALT concentrations (Fig. 5), indicating that integrin αv siRNA may deliver therapeutic effects. The second feature is the specificity of the integrin αv siRNA in the LNP formulation for the liver, thereby reducing concerns about side effects on other organs. Although further research is needed, these characteristics indicated that our candidate, by specificity suppressing the mRNA expression level of integrin αv siRNA in the liver, will be safer and more therapeutically effective than previous small molecules.
A previous report [21] showed that F-FPP-RGD2 has a high affinity for integrin αvβ3, with a half-maximal inhibitory concentration (IC50) of 3.8 ± 0.42 nM, and a moderate affinity for integrin αvβ6, with an IC50 of 86 ± 7 nM. In contrast, its affinities for two other integrins, αvβ5 and αvβ8, are 503 ± 55 nM and > 10,000 nM, respectively. These data indicate that F-FPP-RGD2 has a higher selectivity for integrin αvβ3 than for other integrins. In our study, hepatic integrin αv expression levels in both groups were strongly positively correlated with the hepatic mean SUV60-90 min of [18F]F-FPP-RGD2 (Fig. 4). Moreover, hepatic integrin αv expression levels were positively correlated with serum AST and ALT concentrations (Fig. 5). Further studies will be needed to clarify the effects of siRNA on pathologic fibrosis in NASH. Our findings suggest that the hepatic mean SUV60-90 min of [18F]F-FPP-RGD2, which is obtained noninvasively in a clinical static PET scan, may be useful for monitoring the hepatic integrin αv expression and pathophysiology of NASH.
In the future, we will examine whether this decrease in integrin αv expression, including the regression of fibrosis and recovery of liver pathology, is correlated with PET data in rodents and primates.
Conclusion
This study shows that [18F]F-FPP-RGD2 PET imaging can detect integrin αv protein suppression by siRNA in a diet-induced NASH animal model. Moreover, the mean SUV60-90 min of [18F]F-FPP-RGD2 is strongly correlated with hepatic integrin αv protein expression levels and hepatic function (ALT and AST). These findings indicate that [18F]F-FPP-RGD2 PET imaging may be useful for the noninvasive detection of liver integrin αv protein and hepatic function in NASH pathology.
Acknowledgements
We acknowledge members of the Imaging Group at Shionogi & Co., Ltd. for their constructive discussion. We also thank Ellen Knapp, PhD, from Edanz (https://jp.edanz.com/ac) for editing a draft of this manuscript, with funding from Shionogi & Co., Ltd.
Author Contribution
SH performed the PET experiments and data analysis and drafted the manuscript. MI performed the PET experiments. HI synthesized the PET probe. IM performed the protein and AST/ALT analysis. JN performed the design and synthesization of LNP formulation. KM and ES were the supervisors of this study. KA coordinated and designed the study and drafted the manuscript. All authors read and approved the final version of the manuscript.
Funding
This study was funded by Shionogi & Co., Ltd.
Data Availability
All data generated or analyzed during this study are included in this published article and its supplementary information files.
Declarations
Conflict of Interest
Shuichi Hiroyama, Keiko Matsunaga, Miwa Ito, Hitoshi Iimori, Ippei Morita, Jun Nakamura, Eku Shimosegawa, and Kohji Abe declare that they have no competing interests.
Ethics Approval
The experimental protocols were reviewed and approved by the Institutional Animal Care and Use Committee of Shionogi & Co. Ltd. and Osaka University Graduate School of Medicine.
Consent to Participate
Not applicable.
Consent for Publication
Not applicable.
Footnotes
Publisher's Note
Springer Nature remains neutral with regard to jurisdictional claims in published maps and institutional affiliations.
References
- 1.Schuppan D, Surabattula R, Wang XY. Determinants of fibrosis progression and regression in NASH. J Hepatol. 2018;68:238–250. doi: 10.1016/j.jhep.2017.11.012. [DOI] [PubMed] [Google Scholar]
- 2.Tsuchida T, Friedman SL. Mechanisms of hepatic stellate cell activation. Nat Rev Gastroenterol Hepatol. 2017;14:397–411. doi: 10.1038/nrgastro.2017.38. [DOI] [PubMed] [Google Scholar]
- 3.Maile LA, Busby WH, Nichols TC, Bellinger DA, Merricks EP, Rowland M, et al. A monoclonal antibody against alphaVbeta3 integrin inhibits development of atherosclerotic lesions in diabetic pigs. Sci Transl Med. 2010;2. [DOI] [PMC free article] [PubMed]
- 4.Cox D, Brennan M, Moran N. Integrins as therapeutic targets: lessons and opportunities. Nat Rev Drug Discov. 2010;9:804–820. doi: 10.1038/nrd3266. [DOI] [PubMed] [Google Scholar]
- 5.Gerber EE, Gallo EM, Fontana SC, Davis EC, Wigley FM, Huso DL, et al. Integrin-modulating therapy prevents fibrosis and autoimmunity in mouse models of scleroderma. Nature. 2013;503:126–130. doi: 10.1038/nature12614. [DOI] [PMC free article] [PubMed] [Google Scholar]
- 6.Turaga RC, Satyanarayana G, Sharma M, Yang JJ, Wang S, Liu C, et al. Targeting integrin αvβ3 by a rationally designed protein for chronic liver disease treatment. Commun Biol. 2021;4:1–10. doi: 10.1038/s42003-021-02611-2. [DOI] [PMC free article] [PubMed] [Google Scholar]
- 7.Patsenker E, Popov Y, Stickel F, Schneider V, Ledermann M, Sägesser H, et al. Pharmacological inhibition of integrin alphavbeta3 aggravates experimental liver fibrosis and suppresses hepatic angiogenesis. Hepatology. 2009;50:1501–1511. doi: 10.1002/hep.23144. [DOI] [PMC free article] [PubMed] [Google Scholar]
- 8.Li F, Song Z, Li Q, Wu J, Wang J, Xie C, et al. Molecular imaging of hepatic stellate cell activity by visualization of hepatic integrin αvβ3 expression with SPECT in rat. Hepatology. 2011;54:1020–1030. doi: 10.1002/hep.24467. [DOI] [PubMed] [Google Scholar]
- 9.Zhou X, Murphy FR, Gehdu N, Zhang J, Iredale JP, Benyon RC. Engagement of alphavbeta3 integrin regulates proliferation and apoptosis of hepatic stellate cells. J Biol Chem. 2004;279:23996–24006. doi: 10.1074/jbc.M311668200. [DOI] [PubMed] [Google Scholar]
- 10.Turaga RC, Yin L, Yang JJ, Lee H, Ivanov I, Yan C, et al. Rational design of a protein that binds integrin αvβ3 outside the ligand binding site. Nat Commun. 2016;7:1–11. doi: 10.1038/ncomms11675. [DOI] [PMC free article] [PubMed] [Google Scholar]
- 11.Patsenker E, Popov Y, Stickel F, Jonczyk A, Goodman SL, Schuppan D. Inhibition of integrin alphavbeta6 on cholangiocytes blocks transforming growth factor-beta activation and retards biliary fibrosis progression. Gastroenterology. 2008;135:660–670. doi: 10.1053/j.gastro.2008.04.009. [DOI] [PMC free article] [PubMed] [Google Scholar]
- 12.Rokugawa T, Konishi H, Ito M, Iimori H, Nagai R, Shimosegawa E, et al. Evaluation of hepatic integrin αvβ3 expression in non-alcoholic steatohepatitis (NASH) model mouse by 18F-FPP-RGD2 PET. EJNMMI Res. 2018;8:40. doi: 10.1186/s13550-018-0394-4. [DOI] [PMC free article] [PubMed] [Google Scholar]
- 13.Hiroyama S, Rokugawa T, Ito M, Iimori H, Morita I, Maeda H, et al. Quantitative evaluation of hepatic integrin αvβ3 expression by positron emission tomography imaging using 18F-FPP-RGD2 in rats with non-alcoholic steatohepatitis. EJNMMI Res. 2020;10. [DOI] [PMC free article] [PubMed]
- 14.Haskali MB, Roselt PD, Karas JA, Noonan W, Wichmann CW, Katsifis A, et al. One-step radiosynthesis of 4-nitrophenyl 2-[(18) F]fluoropropionate ([(18) F]NFP); improved preparation of radiolabeled peptides for PET imaging. J Labelled Comp Radiopharm. 2013;56:726–730. doi: 10.1002/jlcr.3111. [DOI] [PubMed] [Google Scholar]
- 15.Bergeron M, Cadorette J, Tétrault MA, Beaudoin JF, Leroux JD, Fontaine R, et al. Imaging performance of LabPET APD-based digital PET scanners for pre-clinical research. Phys Med Biol. 2014;59:661–678. doi: 10.1088/0031-9155/59/3/661. [DOI] [PubMed] [Google Scholar]
- 16.Matsumoto M, Hada N, Sakamaki Y, Uno A, Shiga T, Tanaka C, et al. An improved mouse model that rapidly develops fibrosis in non-alcoholic steatohepatitis. Int J Exp Pathol. 2013;94:93–103. doi: 10.1111/iep.12008. [DOI] [PMC free article] [PubMed] [Google Scholar]
- 17.Van Herck MA, Vonghia L, Francque SM. Animal models of nonalcoholic fatty liver disease-a starter’s guide. Nutrients. 2017;9. [DOI] [PMC free article] [PubMed]
- 18.Zhang C, Liu H, Cui Y, Li X, Zhang Z, Zhang Y, et al. Molecular magnetic resonance imaging of activated hepatic stellate cells with ultrasmall superparamagnetic iron oxide targeting integrin αvβ3 for staging liver fibrosis in rat model. Int J Nanomedicine. 2016;11:1097–1108. doi: 10.2147/IJN.S101366. [DOI] [PMC free article] [PubMed] [Google Scholar]
- 19.Kleiner DE, Brunt EM, Van Natta M, Behling C, Contos MJ, Cummings OW, et al. Design and validation of a histological scoring system for nonalcoholic fatty liver disease. Hepatology. 2005;41:1313–1321. doi: 10.1002/hep.20701. [DOI] [PubMed] [Google Scholar]
- 20.Kossen K, Schaefer C, Lim S, Michener M, Griggs D, Ruminski P, et al. IDL-2965: a selective, highly potent, clinical-stage integrin antagonist for treatment of non-alcoholic steatohepatitis. J Hepatol. 2020;73:S450. doi: 10.1016/S0168-8278(20)31381-7. [DOI] [Google Scholar]
- 21.Kapp TG, Rechenmacher F, Neubauer S, Maltsev OV, Cavalcanti-Adam EA, Zarka R, et al. A comprehensive evaluation of the activity and selectivity profile of ligands for RGD-binding integrins. Sci Rep. 2017;7:1–13. doi: 10.1038/srep39805. [DOI] [PMC free article] [PubMed] [Google Scholar]
Associated Data
This section collects any data citations, data availability statements, or supplementary materials included in this article.
Data Availability Statement
All data generated or analyzed during this study are included in this published article and its supplementary information files.