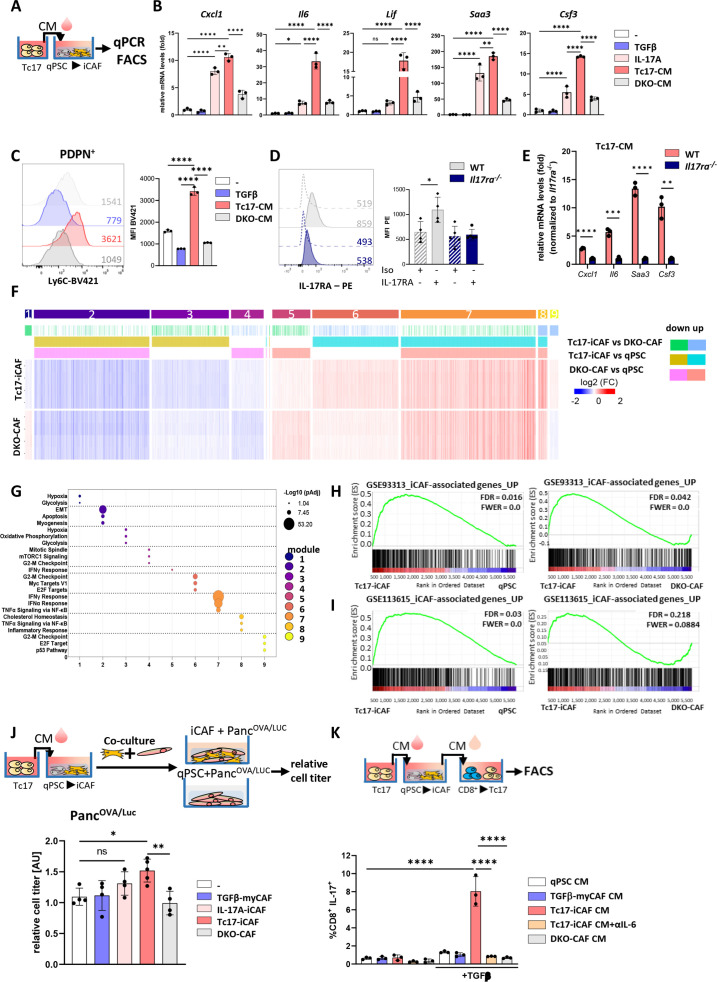
Figure 3.
Reciprocal crosstalk between Tc17 cells and iCAF. (A) Scheme of the experimental design showing Tc17-CM production. Tc17-CM was used to stimulate matrigel-embedded quiescent murine quiescent pancreatic stellate cells (qPSC) and to evaluate mRNA expression of iCAF-specific transcripts (B) or Ly6c+ phenotype (C). (B) qPCR for indicated iCAF transcripts in PSC after a 48- hour incubation with control medium (-), +TGFβ(2 ng/mL) (TGFβ), +IL-17A(50 ng/mL) (IL-17A), 30% Tc17-CM (Tc17-CM) or 30% CM obtained from IL-17A/FDKO Tc17 cells (DKO-CM), respectively. All incubations were done in control medium supplemented with the respective compounds or media. Fold mRNA expression is shown, normalised to the control (-), which was arbitrarily set to 1; (n=3). (C) FACS analysis of Ly6c levels by PSC after 48 hours incubation as described in B; mean fluorescence intensity (MFI) is shown. Left, representative histograms. Right, quantification of Ly6c levels, (n=3). (D) FACS analysis of WT qPSC and Il17ra-/- qPSC for IL-17RA levels, MFI is shown. Left, representative histograms. Right, quantification of IL-17RA levels (n=3). (E) qPCR analysis of the indicated iCAF transcripts in WT or Il17ra-/- PSC after incubation with Tc17-CM for 48 hours. Fold mRNA expression is shown, normalised to Il17ra-/- PSC, which was arbitrarily set to 1; (n=3). (F) Heatmap of differentially expressed genes (Z score normalised, FDR≤0.001) by PSC after incubation with control medium (qPSC) or with control medium containing 30% Tc17-CM (Tc17-iCAF) or 30% DKOTc17-CM (DKO-CAF) for 48 hours classified into modules based on the mutual upregulation or downregulation (n=4, biological replicates). (G) Pathway enrichment analysis for Molecular Signatures Database (MSigDB) Hallmark 2020. Bubble graph displays the three most significant enriched pathways by –log10 value (p adj) for nine modules established in (F). (H, I) Gene set enrichment analysis (GSEA) to identify differential expression of iCAF-associated genes based on raw data RNA-Seq GSE933134 (H) or GSE1136156 (I) in Tc17-iCAF vs qPSC (left) or DKO-CAF (right). (J) Top, scheme of the experimental design showing Tc17-iCAF induction, thereafter co-culture with PancOVA/Luccells for 36 hours. Bottom, tumour-cell titre was obtained from PancOVA cells tagged with firefly luciferase (PancOVA/Luc) after culture with control medium (-) or co-culture with TGFβ-myCAF (TGFβ-myCAF), IL-17A-iCAF (IL-17A-iCAF), Tc17-iCAF (Tc17-iCAF) or DKO-CAF (DKO-CAF). Tumour cell titre was assessed as fold of luciferase activity normalised to the control (-), which was arbitrarily set to 1, (n=4–5). (K) Top, scheme of the experimental design showing the production of CM from qPSC, TGFβ-myCAF, Tc17-iCAF, DKO-CAF, which were added to purified CD8+ T cells. Bottom, quantification of FACS analysis showing frequencies of IL-17A-producing CD8+ T cells after anti-CD3/CD28 activation in the presence or absence of TGFβ and with/without 50% CM obtained from qPSC (qPSC CM), TGFβ-myCAF (TGFβ-myCAF CM), Tc17-iCAF (Tc17-iCAF CM), Tc17-iCAF+αIL-6 (Tc17-iCAF CM +αIL-6) or DKO-iCAF (DKO-CAF CM) after 72 hours (n=3). (B–E, J, K) Bars show mean±SD; biological replicates are plotted. In (B, C, J, K) *p<0.05, **p<0.01, ***p<0.001, ****p<0.0001 evaluated by one-way ANOVA followed by Tukey’s HSD multiple comparison test, ns (non-significant) (D, E) *p<0.05, **p<0.01, ***p<0.001, ****p<0.0001 evaluated by two-tailed, unpaired t-test. ANOVA, analysis of variance; HSD, honestly significant difference; iCAF, inflammatory cancer-associated fibroblast.

